Embed Size (px)
Citation preview

Modeling reef fish biomass, recovery potential, and
management priorities in the western Indian Ocean
T.R. McClanahan1, J.M. Maina1,2, N.A.J. Graham3, K.R. Jones2,4
1Marine Programs, Wildlife Conservation Society, Coral Reef Conservation Project,
Mombasa Kenya
2ARC Centre of Excellence for Environmental Decisions (CEED), The University of Queensland, Australia
3 ARC Centre of Excellence for Coral Reef Studies, James Cook University, Townsville,
Queensland 4811, Australia
4 School of Geography, Planning and Environmental Management, University of Queensland, Australia
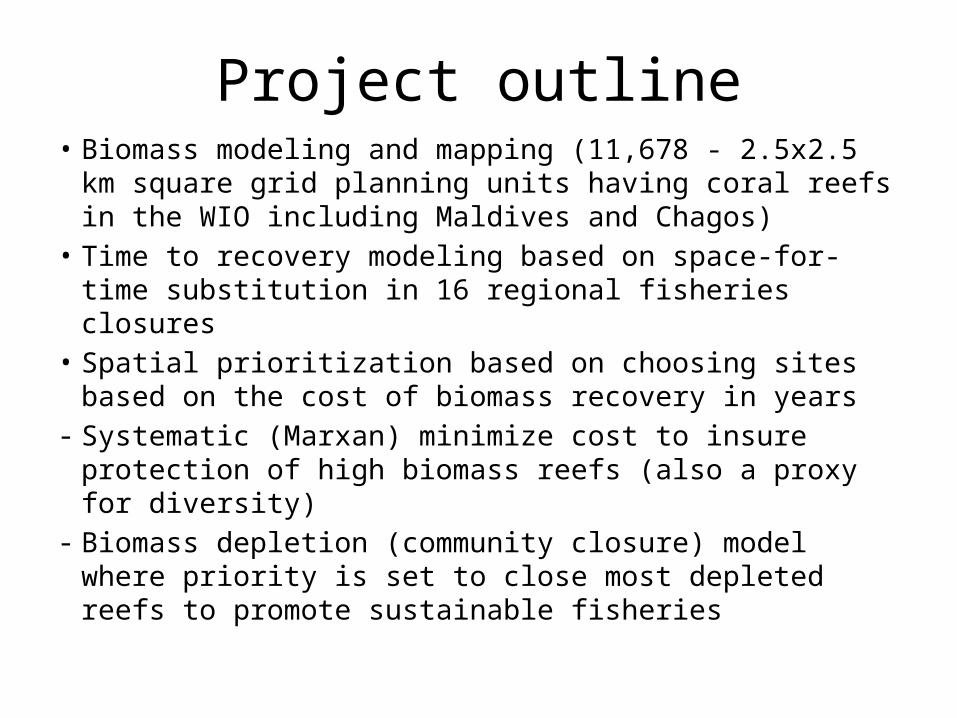
Project outline• Biomass modeling and mapping (11,678 - 2.5x2.5 km
square grid planning units having coral reefs in the WIO including Maldives and Chagos)
• Time to recovery modeling based on space-for-time substitution in 16 regional fisheries closures
• Spatial prioritization based on choosing sites based on the cost of biomass recovery in years
- Systematic (Marxan) minimize cost to insure protection of high biomass reefs (also a proxy for diversity)
- Biomass depletion (community closure) model where priority is set to close most depleted reefs to promote sustainable fisheries

Relationships between fish biomass, fisheries management categories, and fishing impact proxies were used to model the spatial distribution of fish biomass. The equations derived from the
empirical data from 337 sites in 9 countries below were used to fill in the spatial planning units
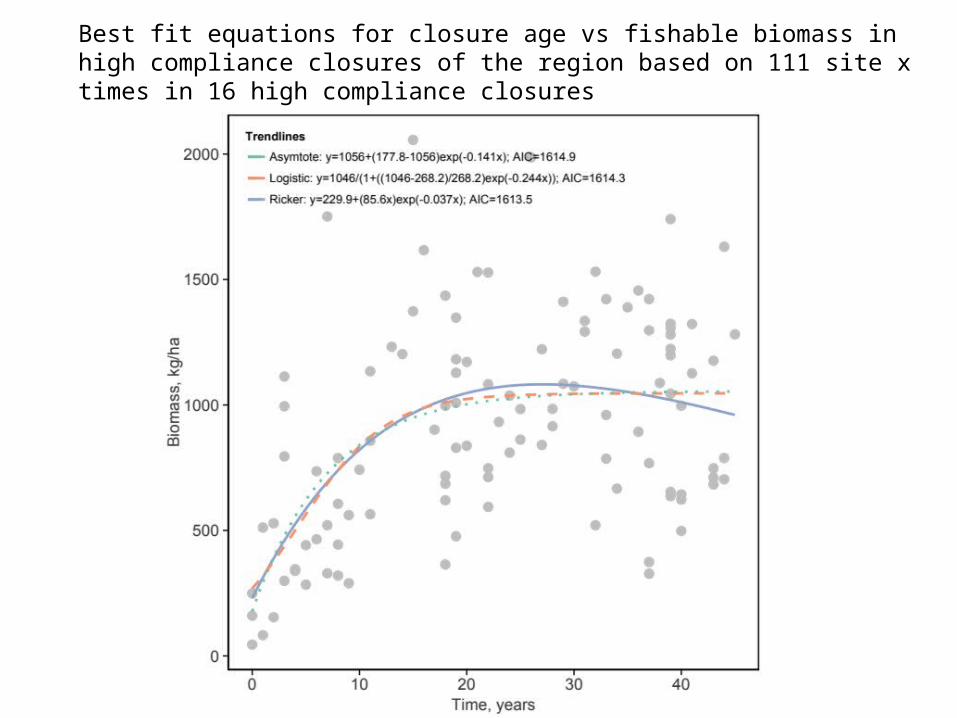
Best fit equations for closure age vs fishable biomass in high compliance closures of the region based on 111 site x times in 16 high compliance closures

Modeled Biomass Time To Recovery

Modeled biomass (kg/ha) expressed as a percentage of the total reef area for each location or country

Mean (+SD) time to recovery values in years for suggested biomass thresholds for each country.. 450 is considered mean sustainability, 600 is high sustainability and 1150 kg/ha is conservation thresholds.

Community vs national/international closure spatial model approaches
• Community approach – prioritize protection of degraded areas– Select core areas of low biomass, surrounded by
“spillover” areas
• National/International approach – prioritize for pristine areas– Use Marxan to prioritize for reef area while minimizing
Time-to-recovery.– Meet targets for 20% of area as conservation, and 50% as
sustainable fishing– Collaboration to achieve targets between all WIO nations
vs no collaboration

Biomass depletion priorities for small fisheries closures

Amount of reef (as a percentage of the total in each country) selected in each management type using the biomass depletion prioritization scenario.

Marzone Priorities - Total Regional Collaboration
Marzone Priorities – No Collaboration or by country

Comparing times to recovery (years) for the three prioritization approaches

Conclusions• Reef fish biomass can be modeled by management systems and human pressure
with ~60% accuracy• Recovery of biomass takes ~20-25 years• The mean time to recovery for the whole region to the conservation threshold is
7.9+3.0 (+ SD) 2.5+1.5 years for high sustainability and and 1.4+1.3 for the low sustainability thresholds.
• Recovery time varied considerably with Kenya’s southwest Madagascar fringing reefs and portions of Mauritius and Reunion requiring 16 to 26 years where as Tanzania, Mozambique, northern Madagascar and most inhabited islands required moderate times of 4 to 16 years. These are the main areas where the biomass depletion recovery strategy prioritizes action.
• Most of the remote islands, such as Chagos and Seychelles, are already above the suggested threshold biomass levels and regional collaboration will chose these locations but eliminate places like Mauritius and Reunion that have low biomass
• The no-collaboration national model insures more coverage in the region and more redundancy.
• A dual approach that combines the national and the biomass-depleted or community closure model is recommended for future action


![Market Sgmentation b. w Maina[Presentation]](https://img.pdfslide.net/doc/110x75/577cdfb01a28ab9e78b1c8ce/market-sgmentation-b-w-mainapresentation.jpg)