Embed Size (px)
Citation preview
Grand Canyon National Park U.S. Department of the InteriorNational Park Service
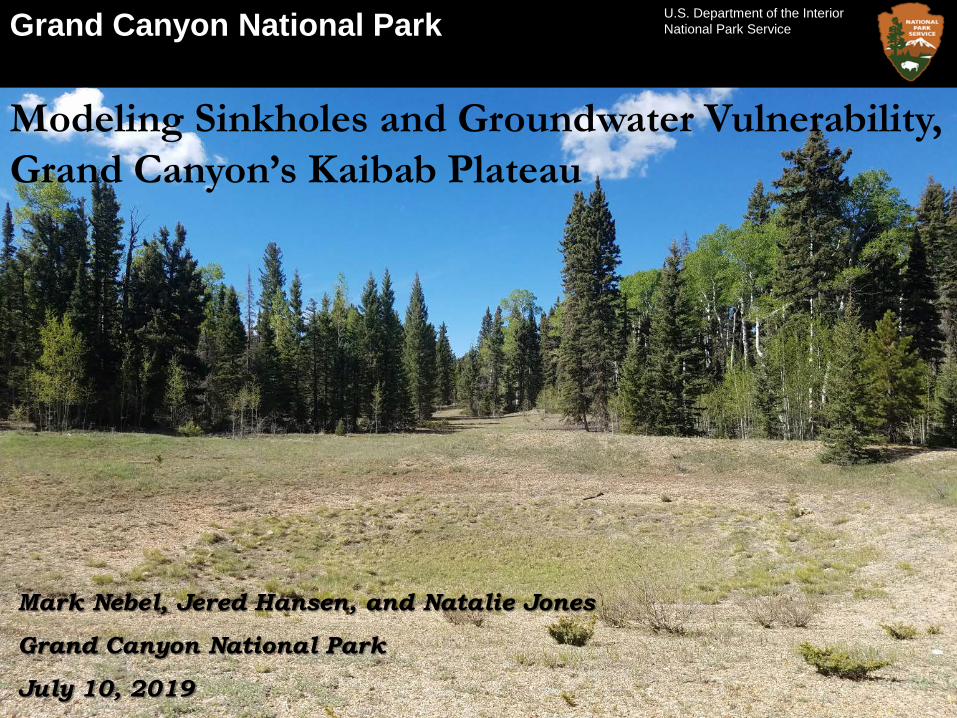
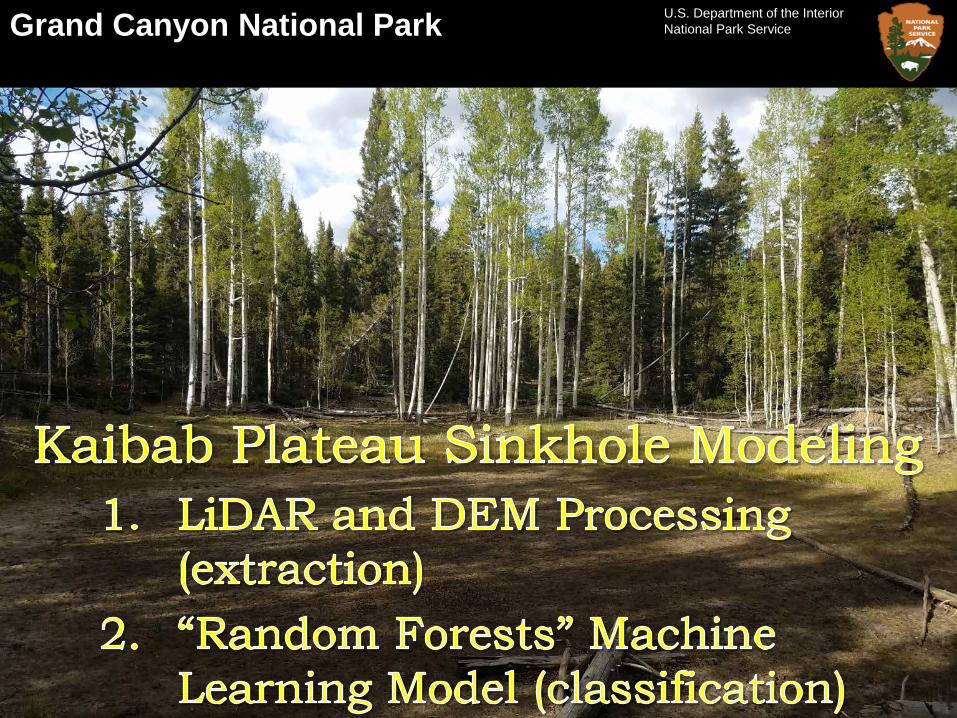
Modeling Sinkholes and Groundwater Vulnerability, Grand Canyon’s Kaibab Plateau
Mark Nebel, Jered Hansen, and Natalie Jones
Grand Canyon National Park
July 10, 2019
Grand Canyon National Park U.S. Department of the InteriorNational Park Service
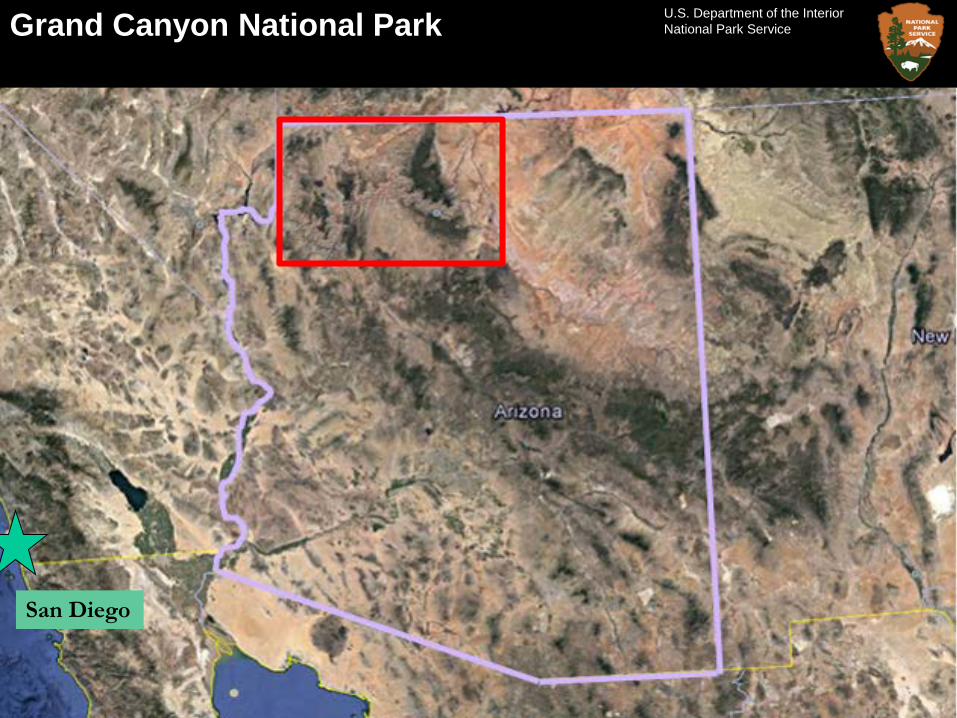
San Diego
Grand Canyon National Park U.S. Department of the InteriorNational Park Service
Grand Canyon National Park U.S. Department of the InteriorNational Park Service
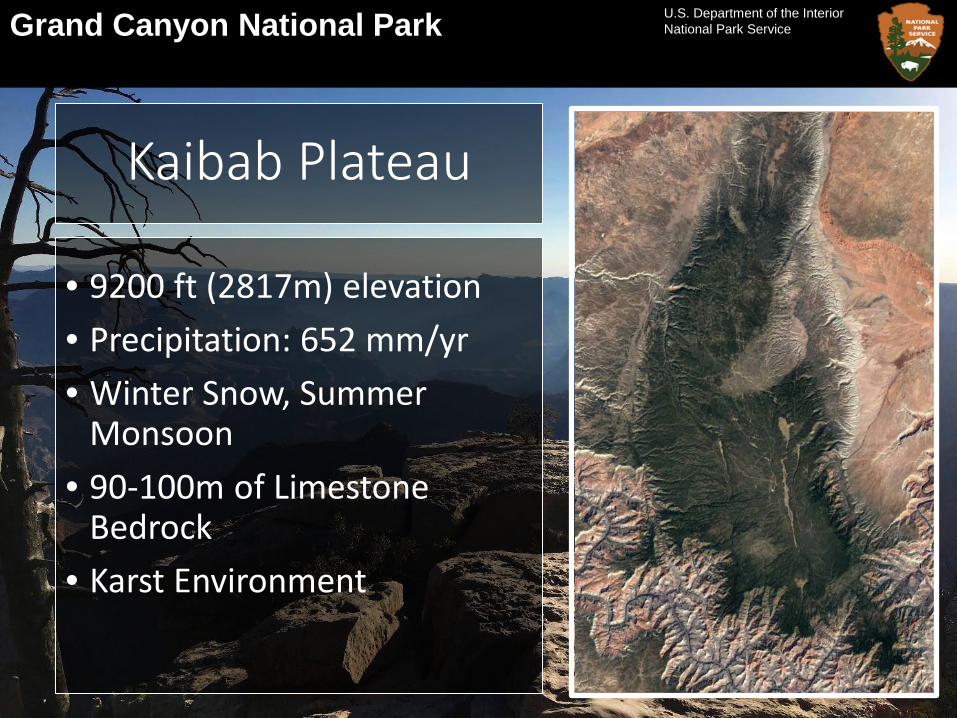
Kaibab Plateau
• 9200 ft (2817m) elevation• Precipitation: 652 mm/yr• Winter Snow, Summer
Monsoon• 90-100m of Limestone
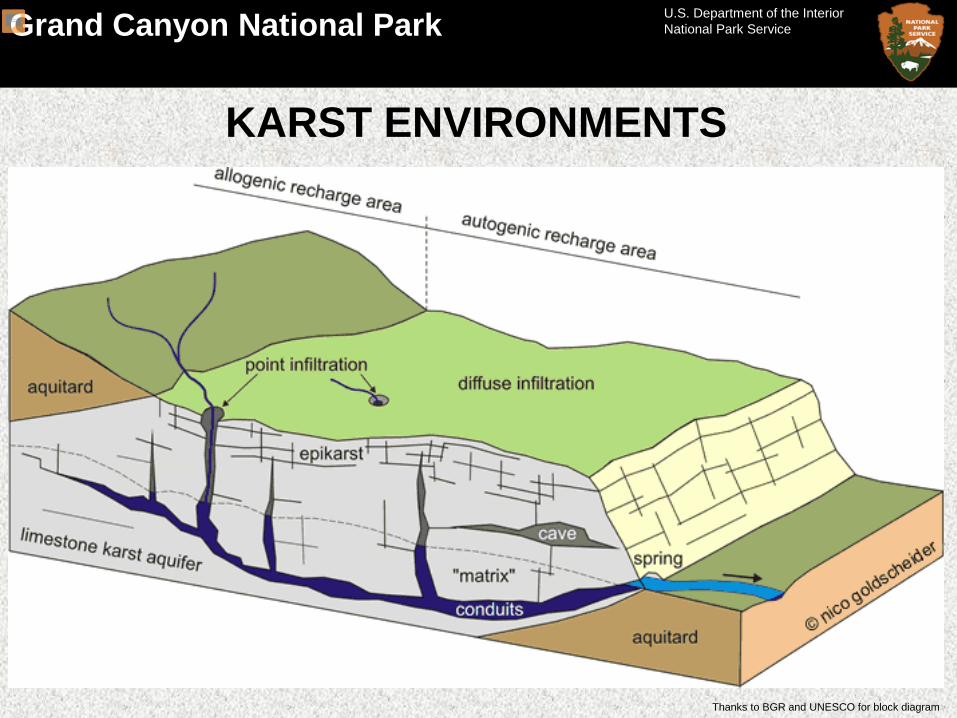
Bedrock • Karst Environment
Grand Canyon National Park U.S. Department of the InteriorNational Park Service
KARST ENVIRONMENTSKARST ENVIRONMENTS
Thanks to BGR and UNESCO for block diagram
Grand Canyon National Park U.S. Department of the InteriorNational Park Service
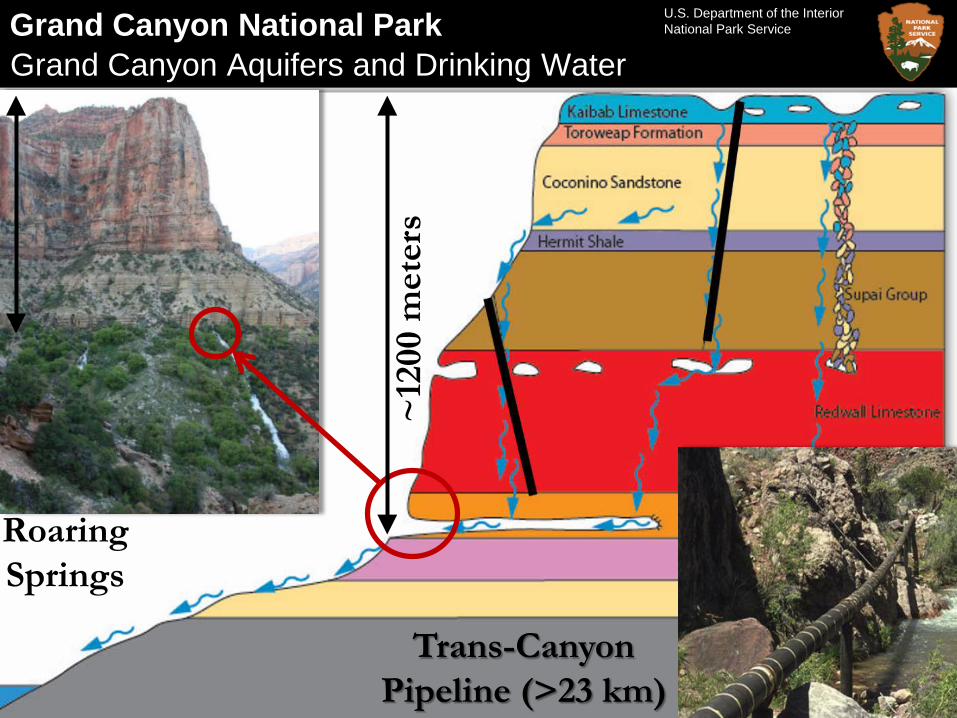
Grand Canyon Aquifers and Drinking Water
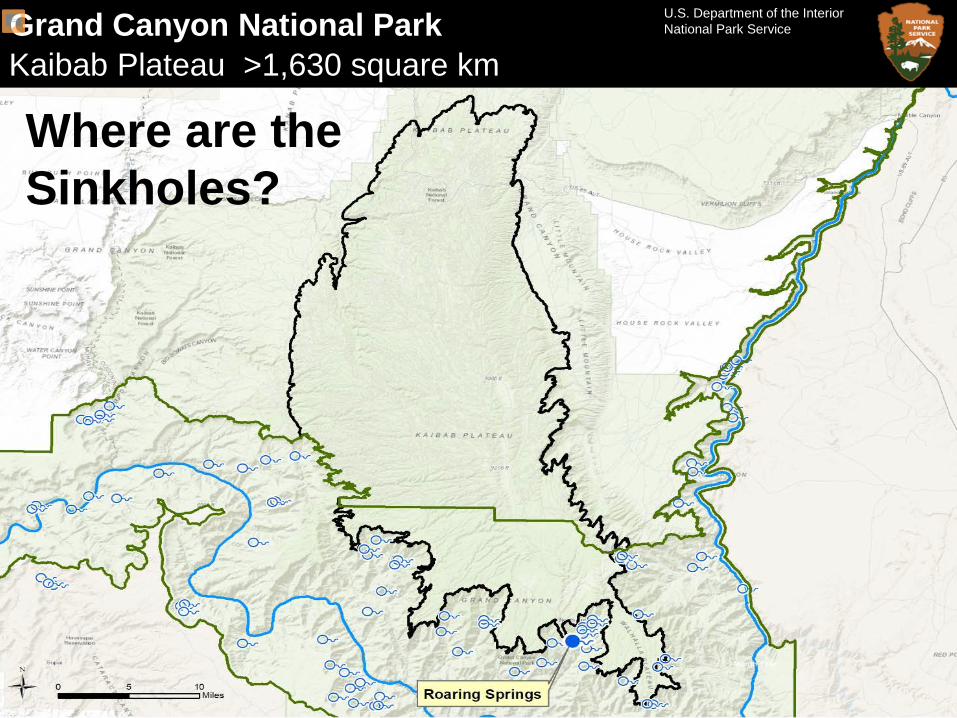
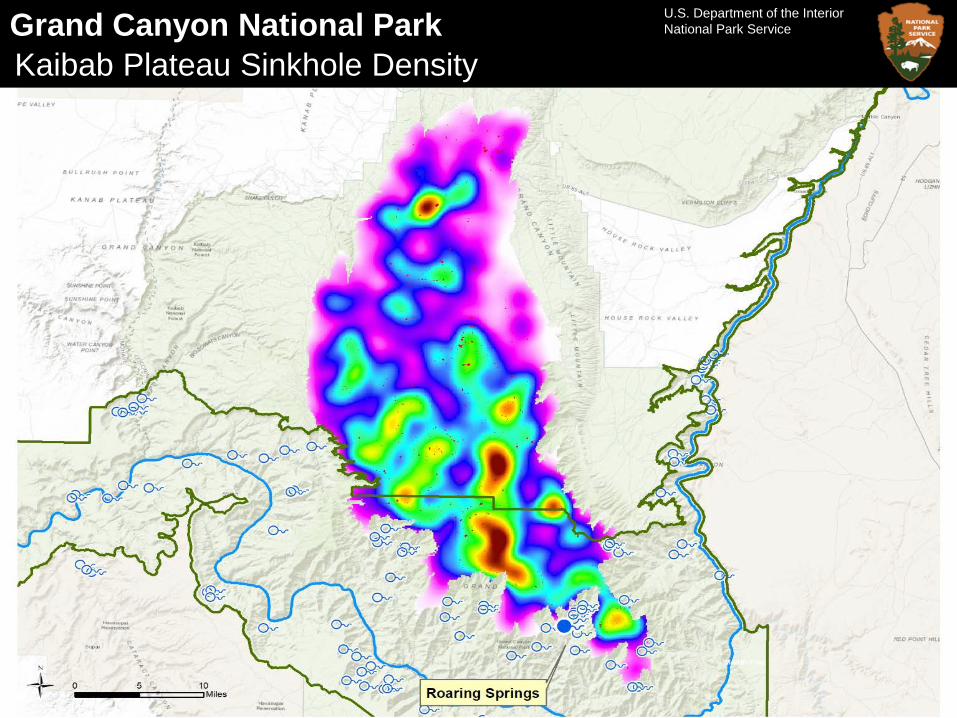
Roaring Springs
Trans-Canyon Pipeline (>23 km)
~12
00 m
eter
s
Grand Canyon National Park U.S. Department of the InteriorNational Park Service
Grand Canyon National Park U.S. Department of the InteriorNational Park Service
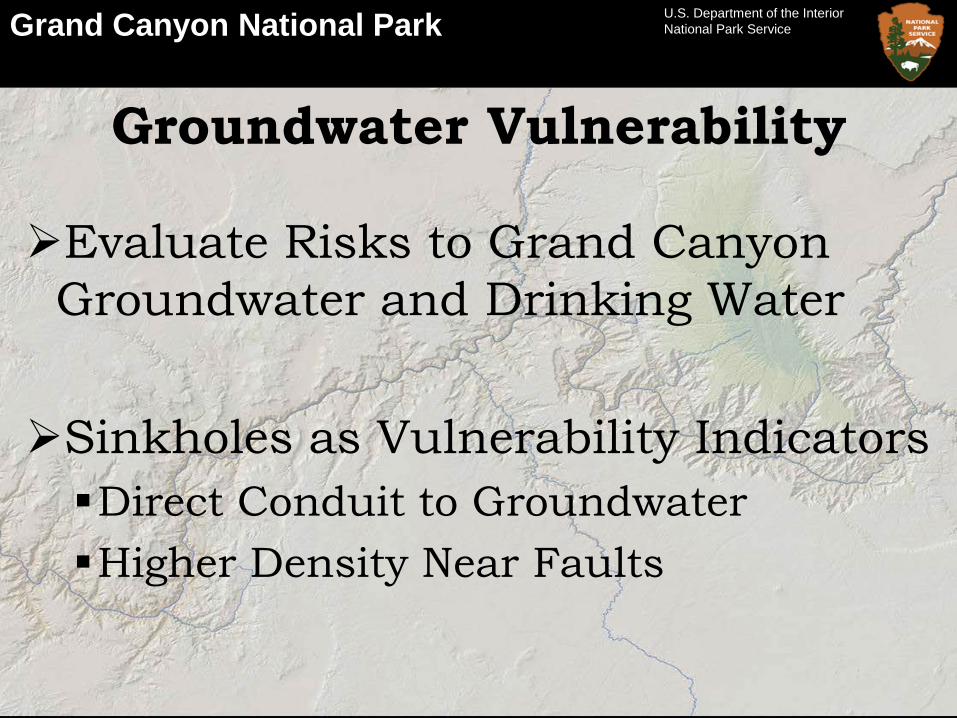
Groundwater Vulnerability
Evaluate Risks to Grand Canyon Groundwater and Drinking Water
Sinkholes as Vulnerability IndicatorsDirect Conduit to GroundwaterHigher Density Near Faults
Grand Canyon National Park U.S. Department of the InteriorNational Park Service
Grand Canyon National Park U.S. Department of the InteriorNational Park Service
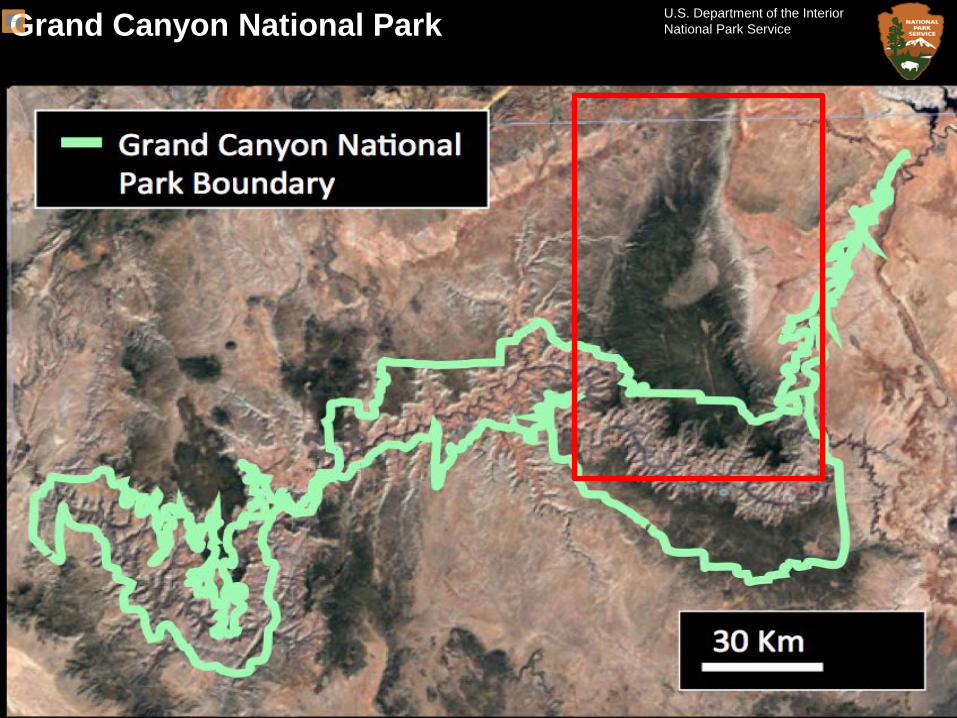
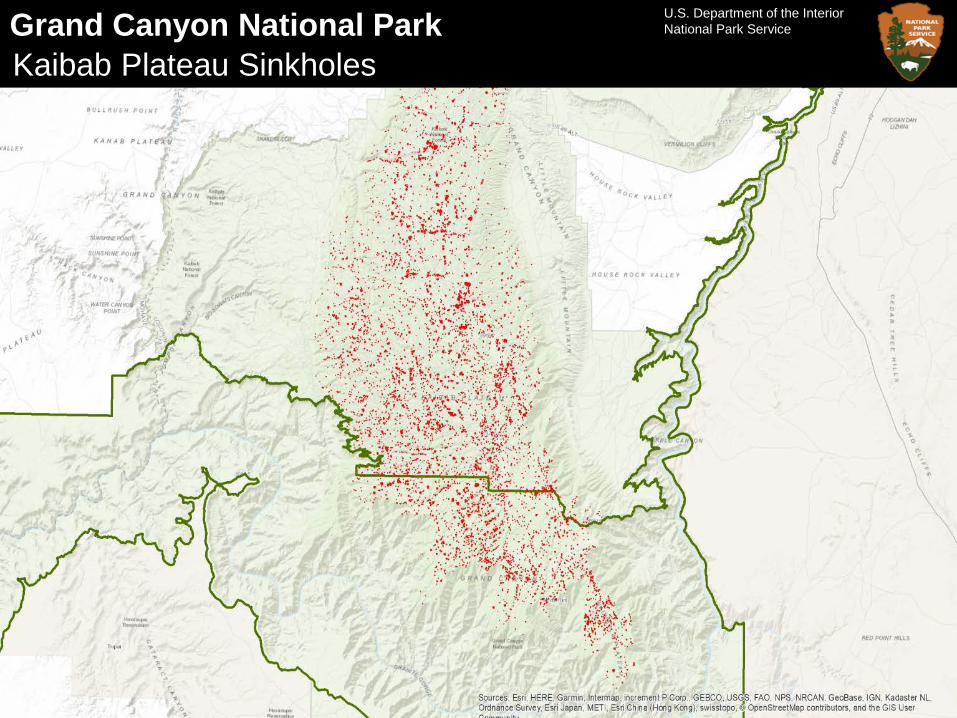
Kaibab Plateau >1,630 square km
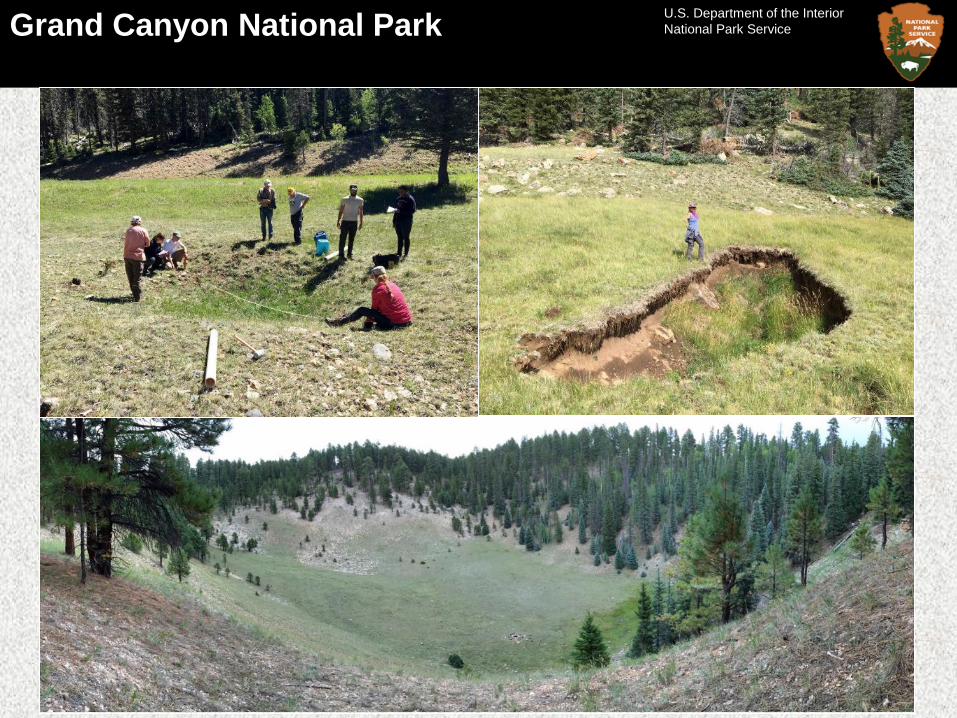
Where are the Sinkholes?
Grand Canyon National Park U.S. Department of the InteriorNational Park Service
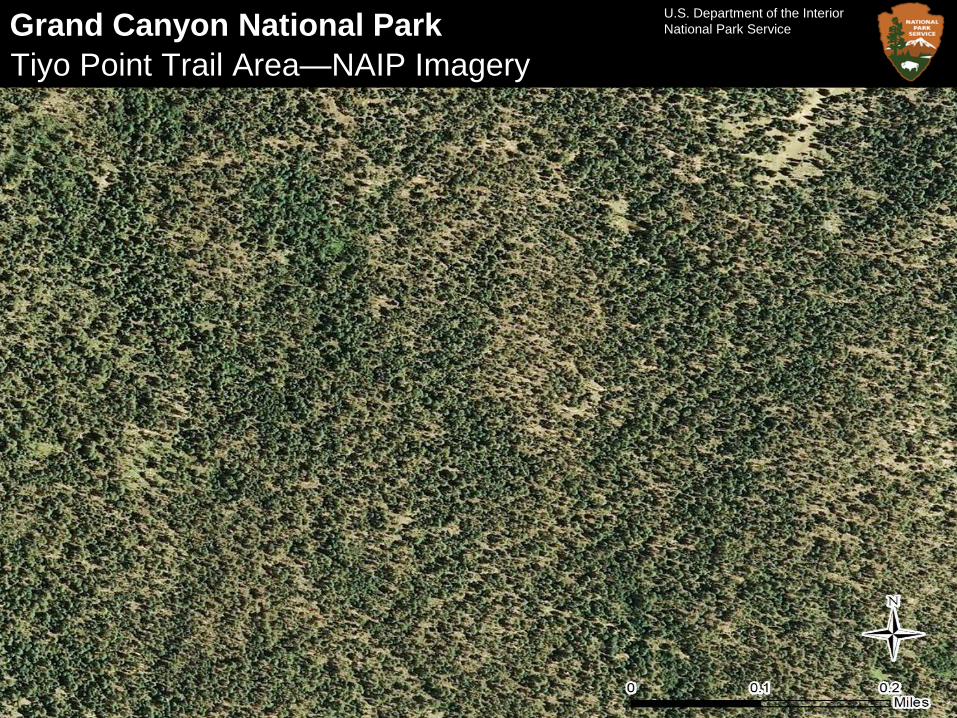
Tiyo Point Trail Area—NAIP Imagery
Grand Canyon National Park U.S. Department of the InteriorNational Park Service
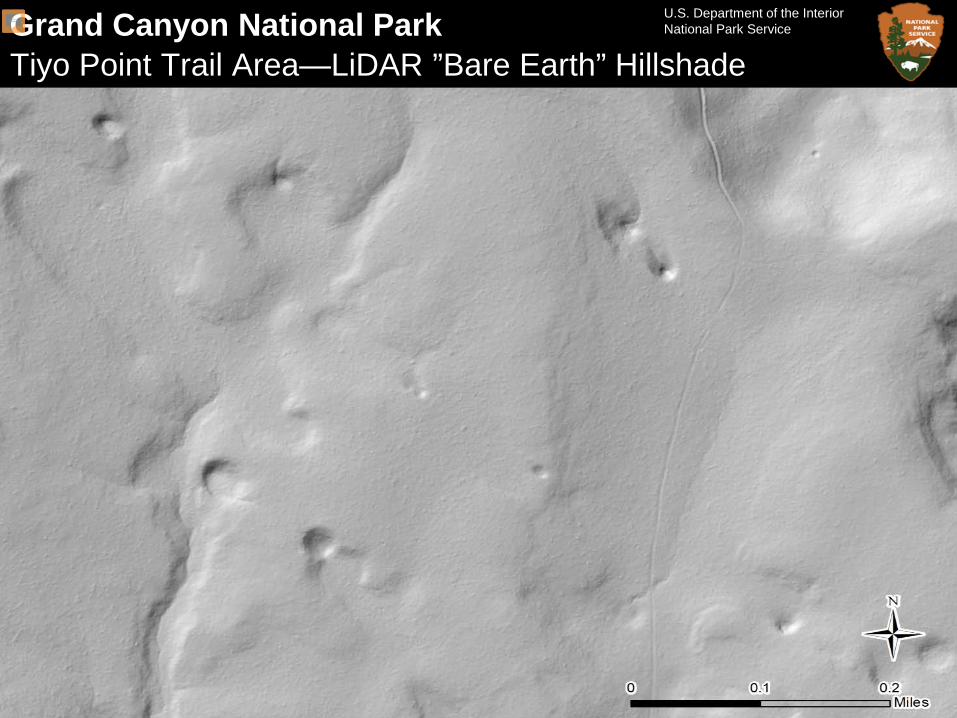
Tiyo Point Trail Area—LiDAR ”Bare Earth” Hillshade
Grand Canyon National Park U.S. Department of the InteriorNational Park Service
Grand Canyon National Park U.S. Department of the InteriorNational Park Service
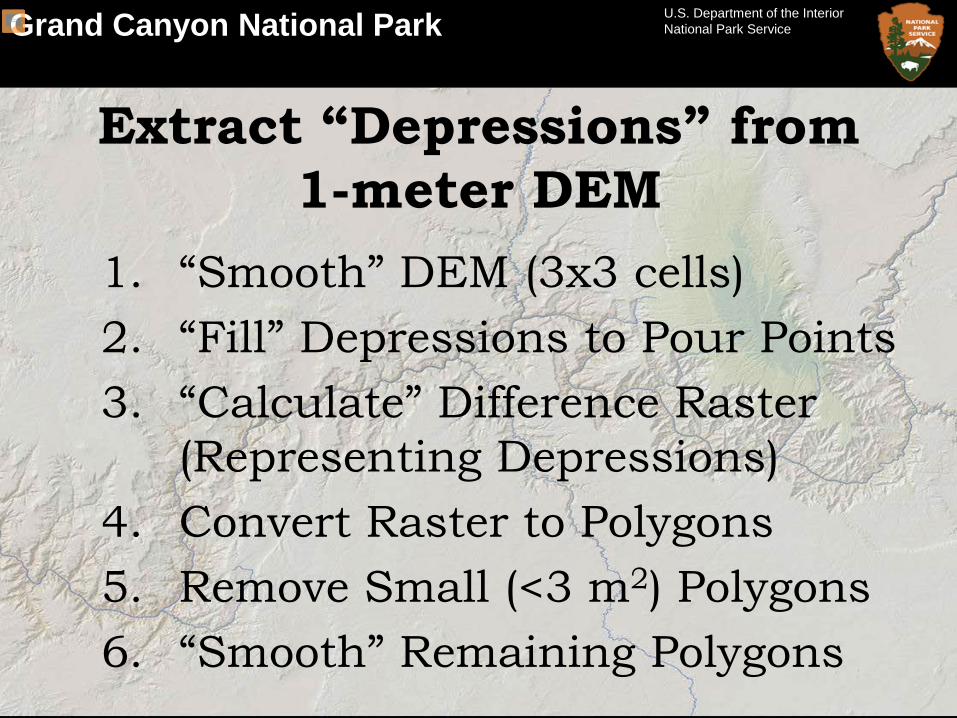
Extract “Depressions” from1-meter DEM
1. “Smooth” DEM (3x3 cells)2. “Fill” Depressions to Pour Points3. “Calculate” Difference Raster
(Representing Depressions)4. Convert Raster to Polygons5. Remove Small (<3 m2) Polygons6. “Smooth” Remaining Polygons
Grand Canyon National Park U.S. Department of the InteriorNational Park Service
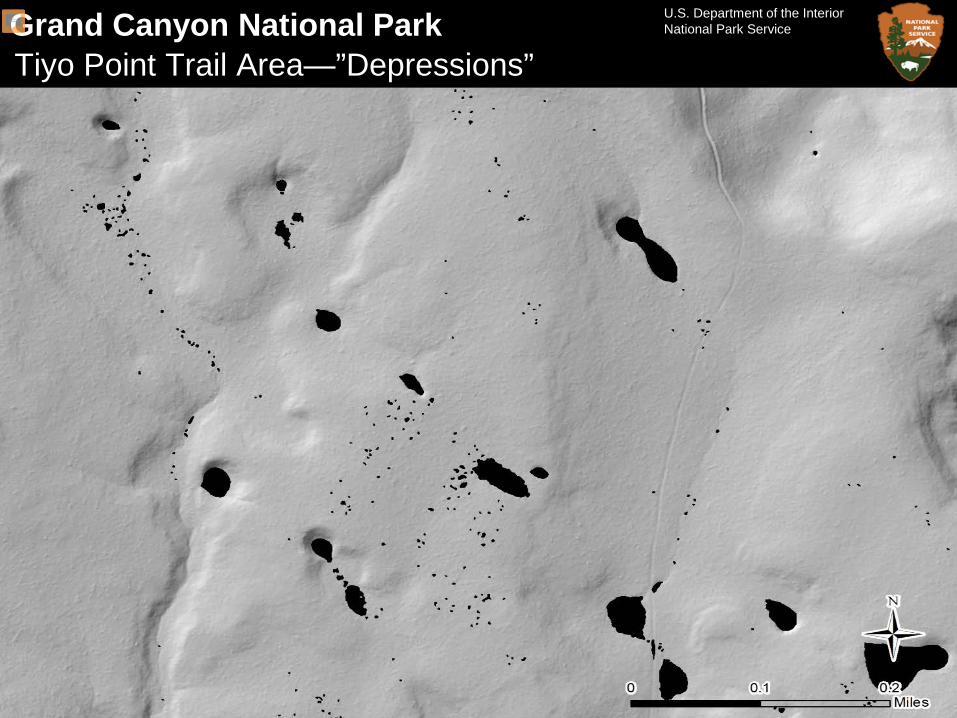
Tiyo Point Trail Area—”Depressions”
Grand Canyon National Park U.S. Department of the InteriorNational Park Service
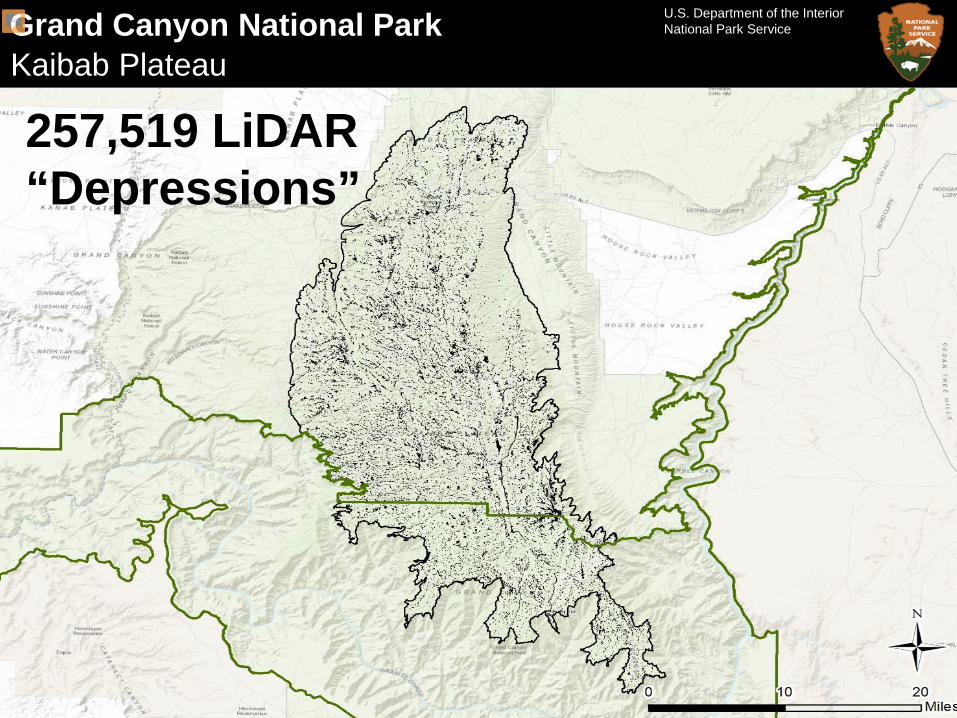
Kaibab Plateau
257,519 LiDAR “Depressions”
Grand Canyon National Park U.S. Department of the InteriorNational Park Service
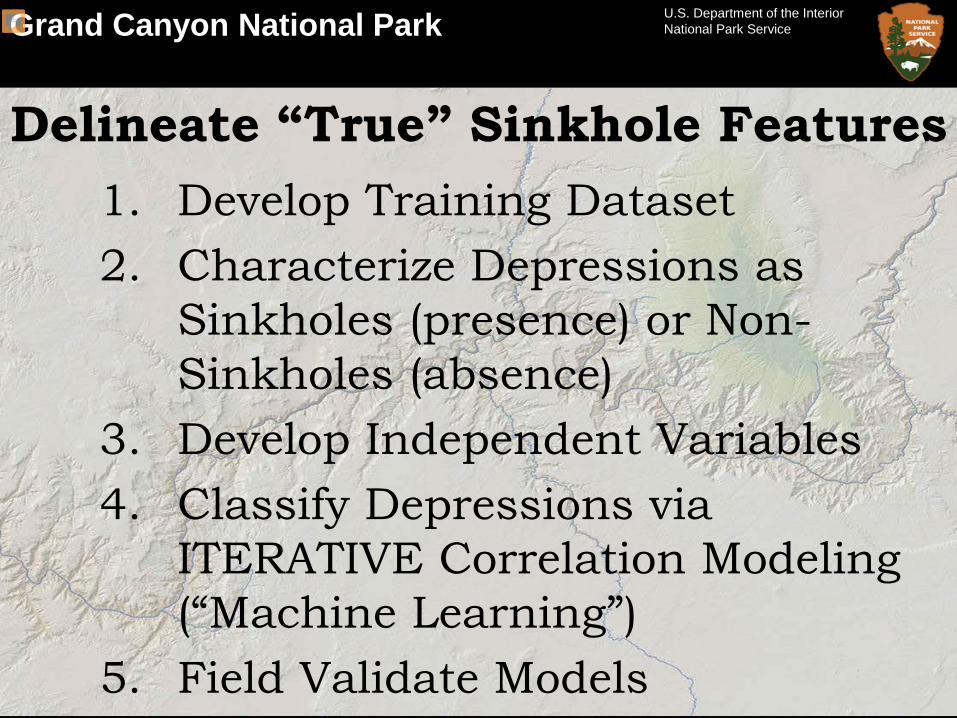
Delineate “True” Sinkhole Features1. Develop Training Dataset2. Characterize Depressions as
Sinkholes (presence) or Non-Sinkholes (absence)
3. Develop Independent Variables4. Classify Depressions via
ITERATIVE Correlation Modeling (“Machine Learning”)
5. Field Validate Models
Grand Canyon National Park U.S. Department of the InteriorNational Park Service
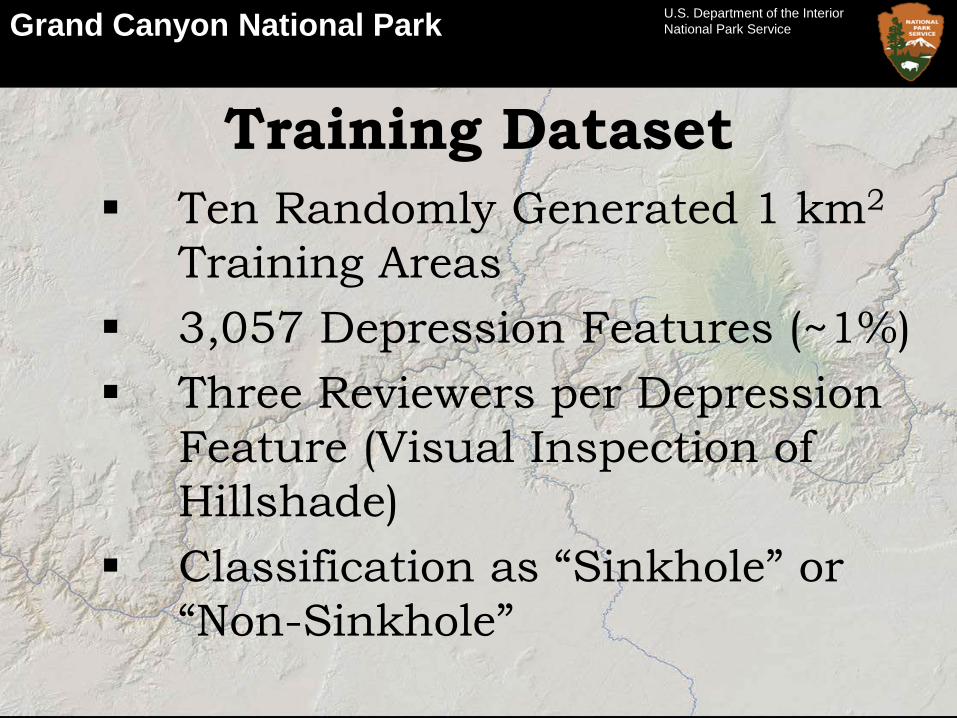
Training Dataset Ten Randomly Generated 1 km2
Training Areas 3,057 Depression Features (~1%) Three Reviewers per Depression
Feature (Visual Inspection of Hillshade)
Classification as “Sinkhole” or “Non-Sinkhole”
Grand Canyon National Park U.S. Department of the InteriorNational Park Service
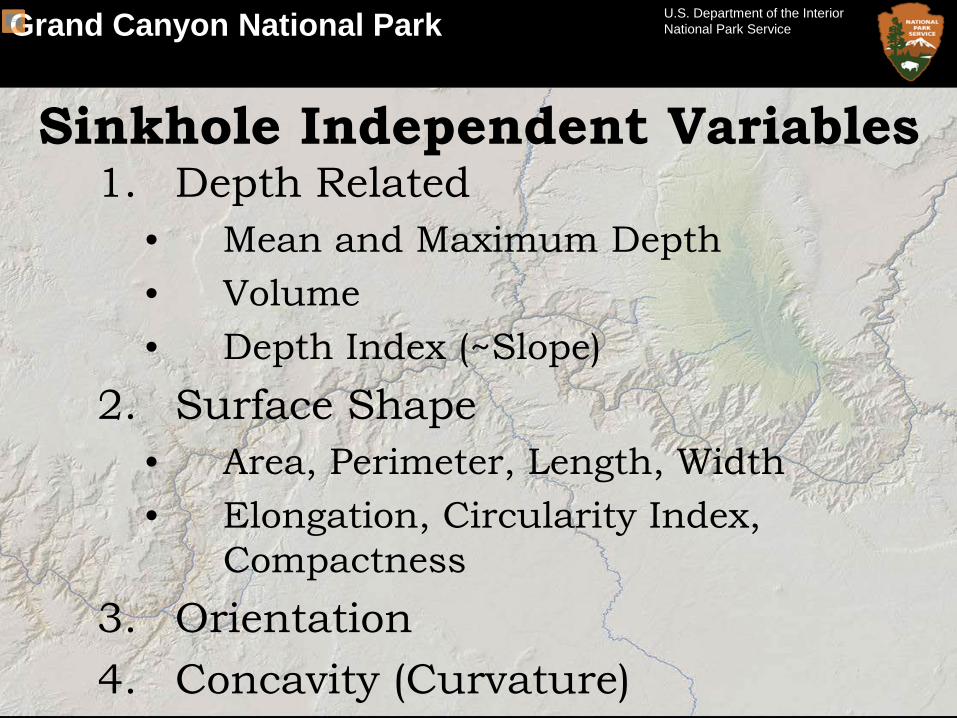
Sinkhole Independent Variables1. Depth Related
• Mean and Maximum Depth• Volume• Depth Index (~Slope)
2. Surface Shape• Area, Perimeter, Length, Width• Elongation, Circularity Index,
Compactness3. Orientation4. Concavity (Curvature)
Grand Canyon National Park U.S. Department of the InteriorNational Park Service
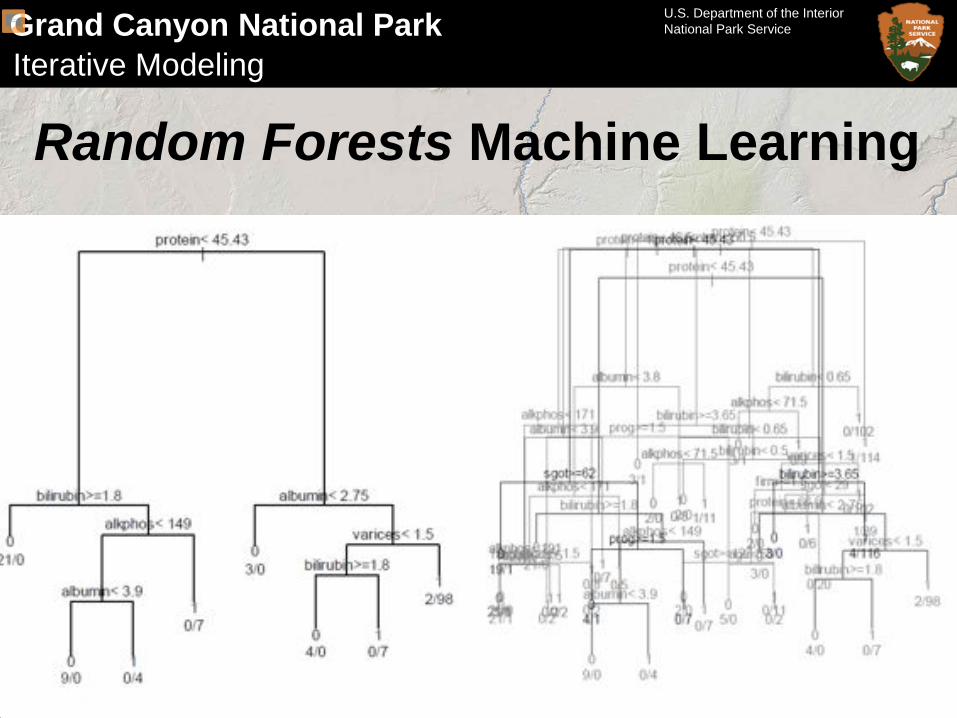
Random Forests Machine LearningIterative Modeling
Grand Canyon National Park U.S. Department of the InteriorNational Park Service
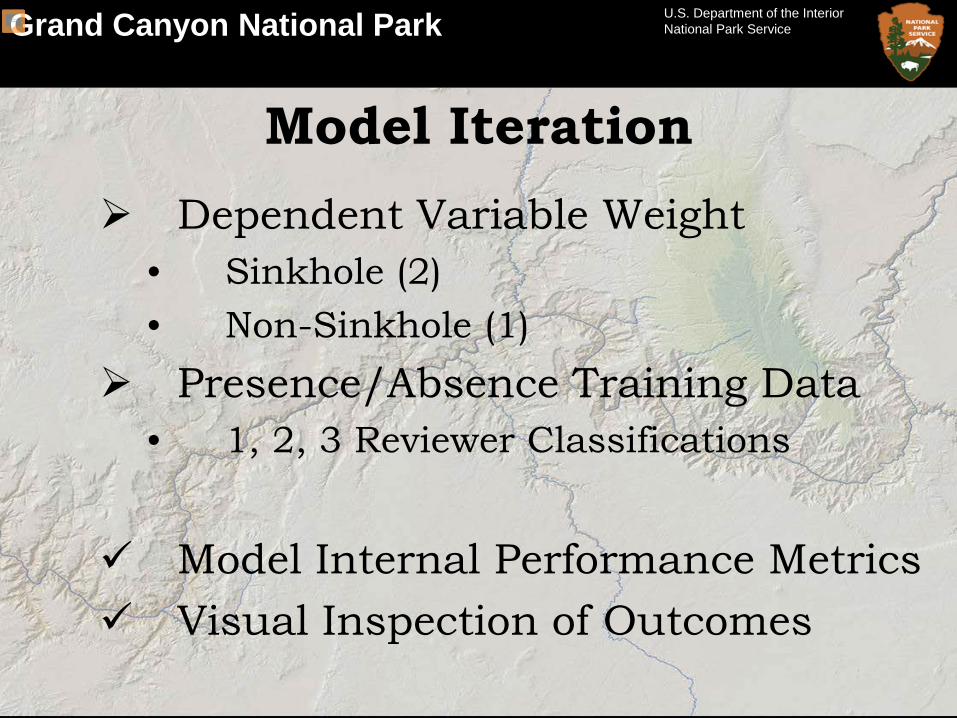
Model Iteration Dependent Variable Weight
• Sinkhole (2)• Non-Sinkhole (1)
Presence/Absence Training Data• 1, 2, 3 Reviewer Classifications
Model Internal Performance Metrics Visual Inspection of Outcomes
Grand Canyon National Park U.S. Department of the InteriorNational Park Service
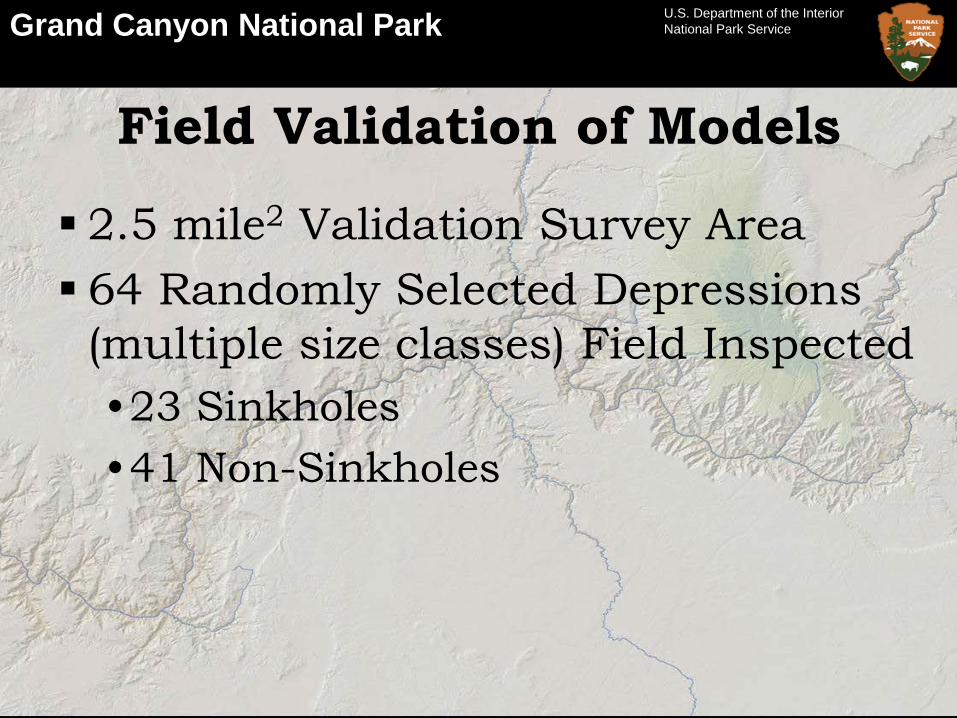
Field Validation of Models
2.5 mile2 Validation Survey Area 64 Randomly Selected Depressions
(multiple size classes) Field Inspected •23 Sinkholes•41 Non-Sinkholes
Grand Canyon National Park U.S. Department of the InteriorNational Park Service
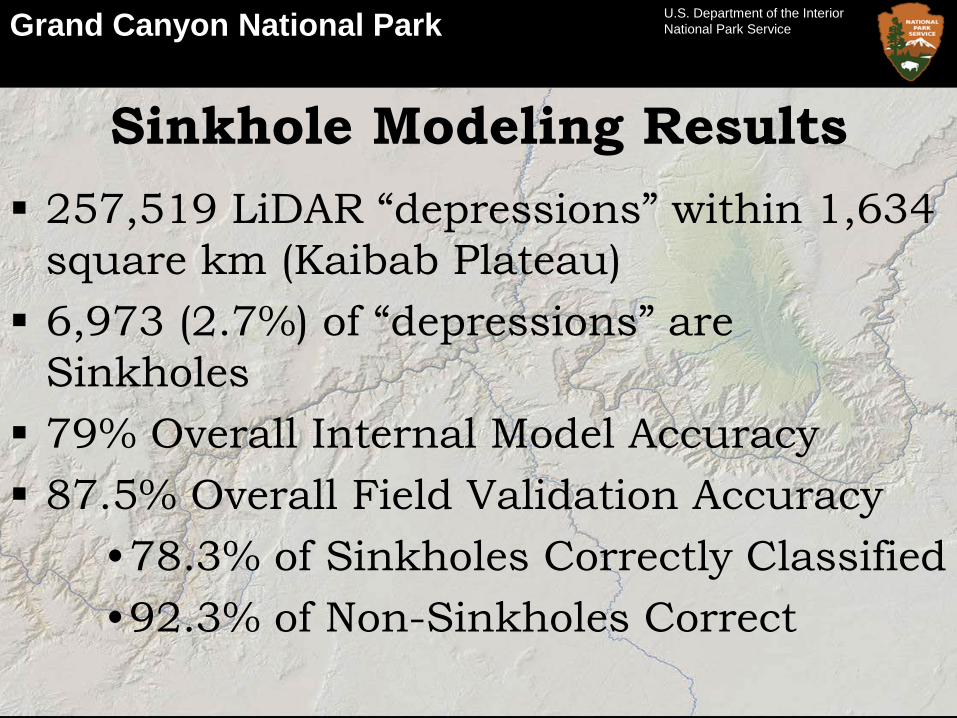
Sinkhole Modeling Results 257,519 LiDAR “depressions” within 1,634
square km (Kaibab Plateau) 6,973 (2.7%) of “depressions” are
Sinkholes 79% Overall Internal Model Accuracy 87.5% Overall Field Validation Accuracy
•78.3% of Sinkholes Correctly Classified•92.3% of Non-Sinkholes Correct
Grand Canyon National Park U.S. Department of the InteriorNational Park Service
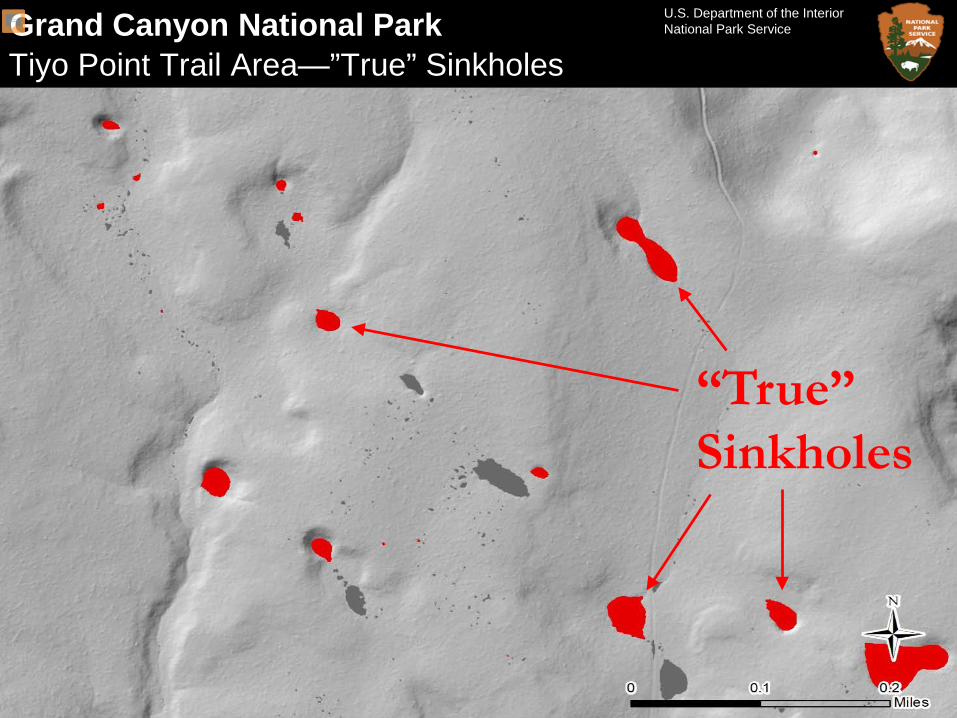
Tiyo Point Trail Area—”True” Sinkholes
“True” Sinkholes
Grand Canyon National Park U.S. Department of the InteriorNational Park Service
Kaibab Plateau Sinkholes
Grand Canyon National Park U.S. Department of the InteriorNational Park Service
Kaibab Plateau Sinkhole Density

Grand Canyon National Park U.S. Department of the InteriorNational Park Service
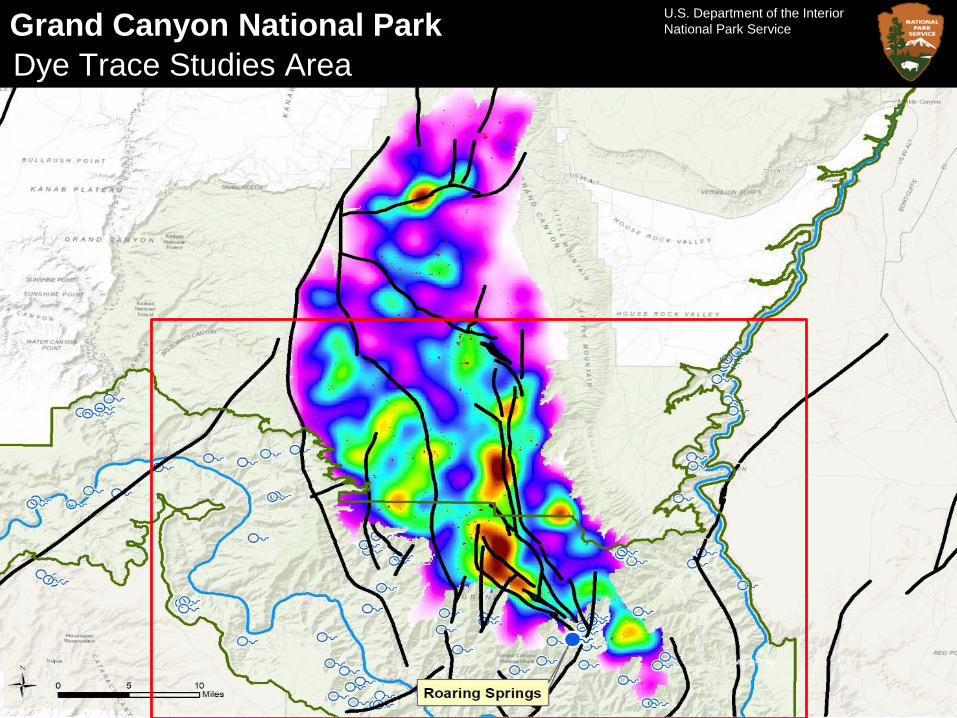
Kaibab Plateau Sinkhole Density and Mapped Faults
Grand Canyon National Park U.S. Department of the InteriorNational Park Service
Dye Trace Studies Area
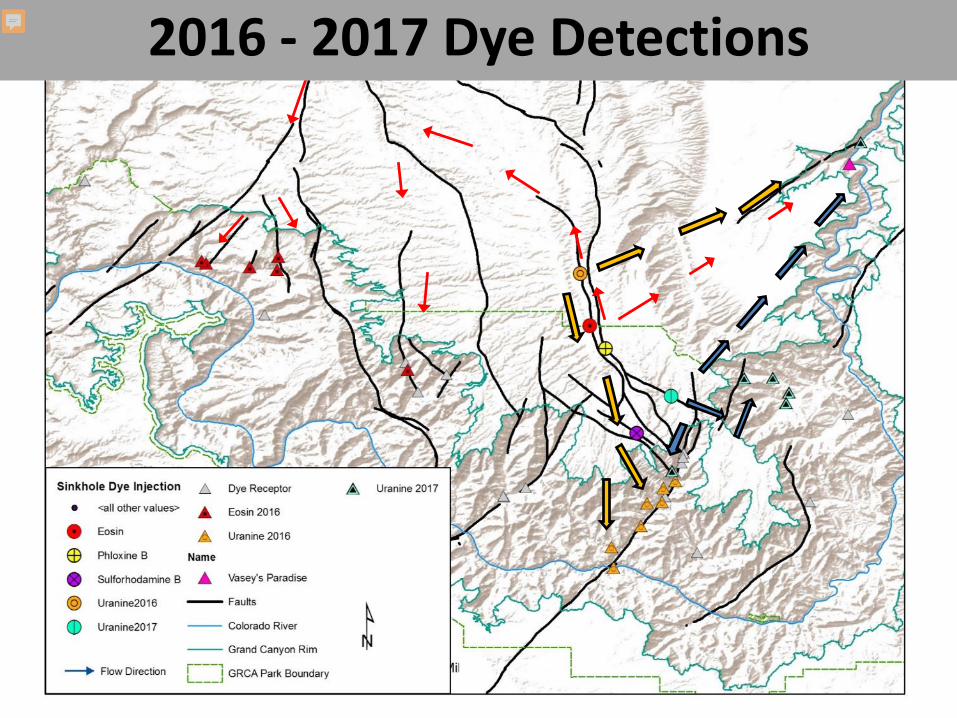
2016 - 2017 Dye Detections
Grand Canyon National Park U.S. Department of the InteriorNational Park Service
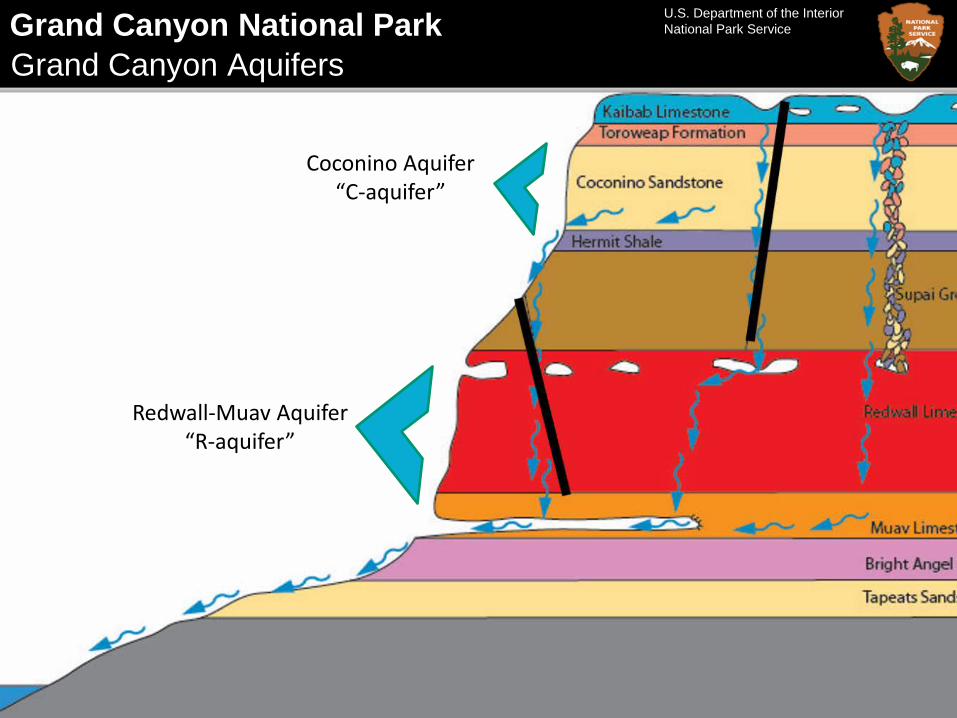
Coconino Aquifer“C-aquifer”
Redwall-Muav Aquifer“R-aquifer”
Grand Canyon Aquifers
Grand Canyon National Park U.S. Department of the InteriorNational Park Service
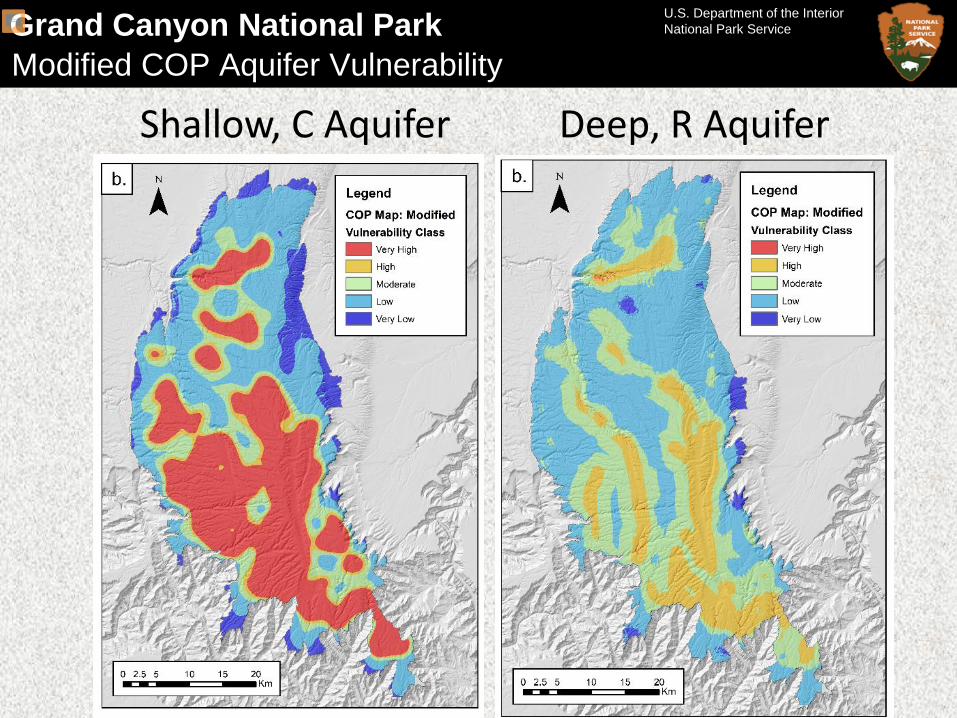
Shallow, C Aquifer Deep, R AquiferModified COP Aquifer Vulnerability
Grand Canyon National Park U.S. Department of the InteriorNational Park Service
Thank [email protected]