Embed Size (px)
Citation preview
•
•
•
14f-rft0D
Modeling Specialization and Escalation in the Criminal Career
Chester L. Britt, III* Department of Sociology
University of Illinois at Urbana 702 S. Wright St. Urbana, IL 61801
February 12, 1993
Abstract
Although research on criminal offense specialization and escalation has presented a consistent set of findings, this body of research is flawed in its approach. Commonly used indices of specialization and escalation are based on an invalid model, have no clear meaning, and cannot be tested for statistical significance across groups. This paper applies a class of log-linear models developed for studying social mobility tables with matched categories for one or more groups to crime-type-switching tables. The benefit to using these models, in comparison with prior specialization and escalation research, is the parameter estimates can be interpreted directly as tests of specialization and escalation in a meaningful way. The application of these models is illustrated with arrest data on a sample of felony offenders from Michigan.
*This paper was presented at the 44th Annual Meetings of the American Society of Criminology in New Orleans, November 1992. This research was supported by a Graduate Research Fellowship from the National Institute of .Justice (Grant 89-I.J-CX-0031).
1 •• +",,'
NC.JRS
fEB 24 1993
ACQUISITIONS
If you have issues viewing or accessing this file contact us at NCJRS.gov.
U.S. Department of Justice Nationallnstltute of Justice
141100
This document has been reproduced exactly as received from the person or organization originating it. Points of view or opinions stated In this document are those of the authors and do not necessarily represent the official position or policies of the National Institute of Justice.
Permission to reproduce this I .1 5 st material has been granted by
BJbl j c Domarn/QJPINIJ u. S. Department of Justice
to the National Criminal Justice Reference Service (NCJRS).
Further reproduction outside of the NCJRS system requires permission of the~owner.
•
•
•
J
•
•
•
--------------------- - ------ -------
1
1 INTRODUCTION
Specialization and escalation are key elements of the criminal career paradigm
described by Blumstein et al. (1986, 1988). Specialization refers to the tendency
among criminal offenders to repeat the same type of crime across their criminal
careers, while escalation refers to the tendency of some criminal offenders to
commit crimes of an increasingly serious nature over the span of their criminal
careers. Although several papers have recently claimed to find significant levels of
specialization and escalation, problems with the analytical approach used in this
work raise questions about its accuracy. The main goal of this paper is to illustrate
how an alternative approach to analyzing two-way crime-type tables provides a
clearer picture of criminal offense sequencing than is currently avaliable. To this
end, I have organized this paper as follows. Following a brief summary of the main
findings of prior specialization research, I note why prior methods provide at best
an unclear picture of specialization and, at worst, an inaccurate portrayal of offense
sequencing. I then explain how a log-linear model developed for studying social
mobility in two-way and multi-way tables has an analogous application in the study
of crime sequencing among criminal offenders. Data on black and white felony
criminal offenders are analyzed with these models to illustrate their utility for
studying specialization and escalation.
1.1 Prior Research
Research testing for offense specialization has generally concluded that the type of
crime a person commits at say, time 1, appears to increase the likelihood of that
crime being committed at time 2. What does vary across these studies is the
strength of the relationship between successive crime types. The single most
important factor influencing the likelihood of specialization appears to be the age
n
•
•
•
2
of the offender. The evidence for specialization is weakest among juvenile offenders
(Bursil<, 1980; Cohen, 1986; Nevares et aI., 1990; Rojek and Erickson, 1982;
Wolfgang et aI., 1972, 1987), although several studies have concluded that juvenile
offenders do specialize in limited criminal activjties (Farrington et aI., 1988; Kempf,
1987; Tracy et aI., 1990). The strongest evidence for specialization, however, comes
from studies of adult offenders (Blumstein et al., 1988; Brennan et aI., 1989;
Moitra, 1981), where relatively high degrees of specialization have been found for
drug and fraud offenses (Blumstein et aI., 1988) as well as violent offenses
(Blumstein et aI., 1988; Brennan et aI., 1989).
The effects of race and gender on the likelihood of offense specialization have
also received limited attention. The overall effect of race on specialization is
unclear. Bursik (1980), for example, found significantly different crime sequences
for white and black youth, while Blumstein et a1. (1988) found the pattern of
specialization to be approximately the same for their samples of black and white
offenders. Farrington et a1. (1988) represents the only study to have examined the
effect of gender, and concluded that young males and young females had similar
overall levels of specialization. However, when distinguished by specific crimes,
males were more likely to specialize in violent and serious theft offenses (e.g.,
robbery, aggravated assault, burglary) while females were more likely to specialize
in public order and status offenses (e.g., liquor, runaway, truancy).
The research on escalation is scant. In what little research has examined the
issue of escalation, the demographic effects appear to be comparable to those for
specialization. For instance, the evidence of escalation among juveniles is weak
(Tracy et aI., 1990; Wolfgang et aI., 1972), but apparently stronger for adult
offenders (Blumstein et aI., 1988). Race does not appear to be related to patterns
of escalation. Blumstein et a1. (1988), Tracy et a1. (1990), and Wolfgang et a1.
(1972, 1987) all failed to note large differences in the seriousness of offense
J
•
•
•
3
sequences by race over the criminal career.
1.2 Methodological Issues
The typical test for specialization or escalation has the researcher test for
independence in a two-way table of successive crime types. When the test reveals
crime sequences are not independent, the researcher often concludes there is
evidence of specialization or escalation. Although this research has consistently
shown successive crime types to be related, there are several problems with
concluding that non-independence implies the existence of specialization and/or
escalation. Conclusions of this type represent a non sequitur - the lack of fit by the
independence model simply implies that there is some degree of association in the
table not captured by the different marginal distributions in a two-way table. The
lack of fit by the independence model does not imply, as prior specialization and
escalation research would have us believe, that the model of pure specialization
(where all cases are expected to fall on the diagonal) or the model of pure
escalation (where all cases are expected to fall below the diagonal) is then true.
The concepts of specialization and escalation denote specific models - how
individual cases should be arranged in a two-way table of offense types - which are
not captured by a test for independence. Relatedly, Sobel (1983) criticized social
mobility research 011 similar grounds, noting that it is nonsensical to make
substantive juferences about the relationship between two variables on the basis of
non-independence (see also Hauser, 1986; Sobel, 1985).
A problem related to the use of the independence model concems the use of
"specialization coefficients" and "escalation coefficients." One of the more . frequently used specialization indices is the "Forward Specialization Coefficient"
(PSG) proposed by Farrington (1986; see also Farrington et al., 1988).1 The FSC
lThe FSC is variably referred to as "Farrington's Coefficient of Specialization" (Blumstein et
•
~~~~----.~~~~~~~~-~~~~~~~-~~~----.
4
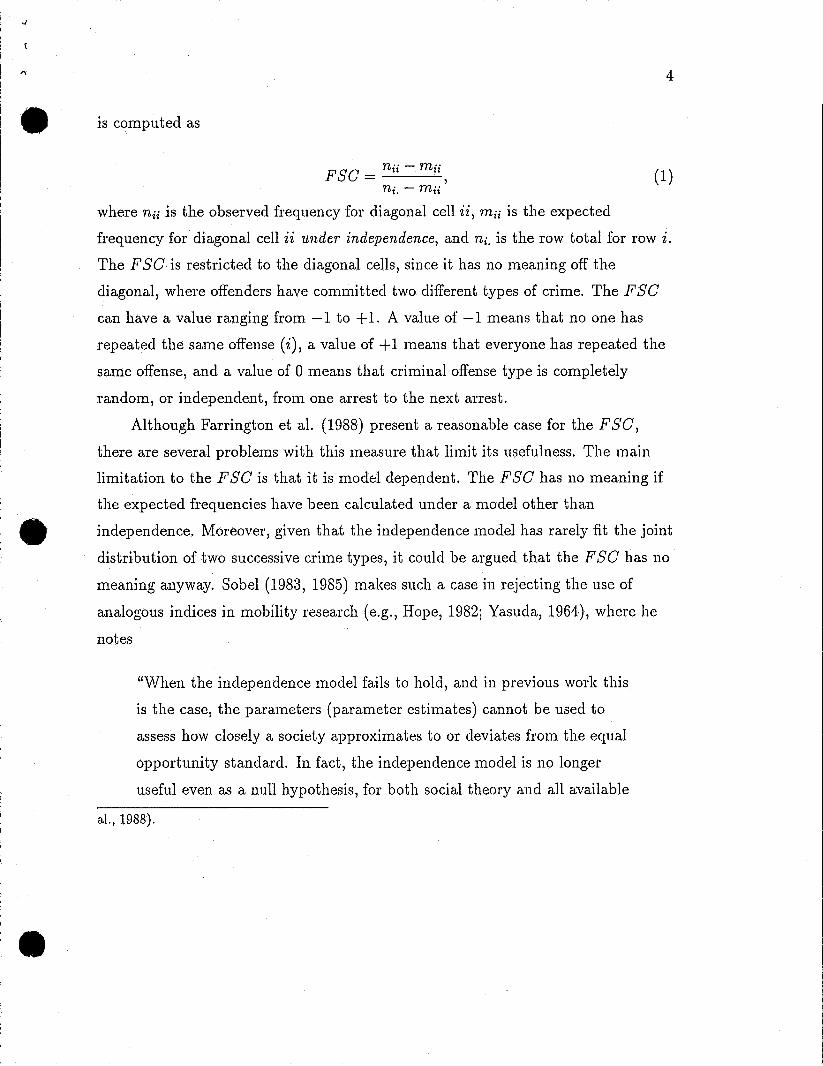
is computed as
Fse = nii - m ii , n· -m··
(1) t. tt
where nii is the observed frequency for diagonal cell ii, mij is the expected
frequency for diagonal cell ii under independence, and ni. is the row total for row i.
The F se is restricted to the diagonal cells, since it has no meaning off the
diagonal, where offenders have committed two different types of crime. The F se can have a value ranging from -1 to + 1. A value of -1 means that no one has
repeated the same offense (i), a value of + 1 means that everyone has repeated the
same offense, and a value of 0 means that criminal offense type is completely
random, or independent, from one arrest to the next arrest.
Although Farrington et al. (1988) present a reasonable case for the F se, there are several problems with this measure that limit its usefulness. The main
limitation to the F se is that it is model dependent. The F se has no meaning if
the expected frequencies have been calculated under a model other than
• independence. Moreover, given that the independence model has rarely fit the joint
distribution of two successive crime types, it could be argued that the F se has no
meaning anyway. Sobel (1983, 1985) makes such a case in rejecting the use of
analogous indices in mobility research (e.g., Hope, 1982; Yasuda, 1964), where he
notes
•
"\iVhen the independence model fails to hold, and in previous work this
is the case, the parameters (parameter estimates) cannot be used to
assess how closely a society approximates to or deviates from the equal
opportunity standard. In fact, the independence model is no longer
useful even as a null hypothesis, for both social theory and all available
al., 1988).
-------------------
•
•
•
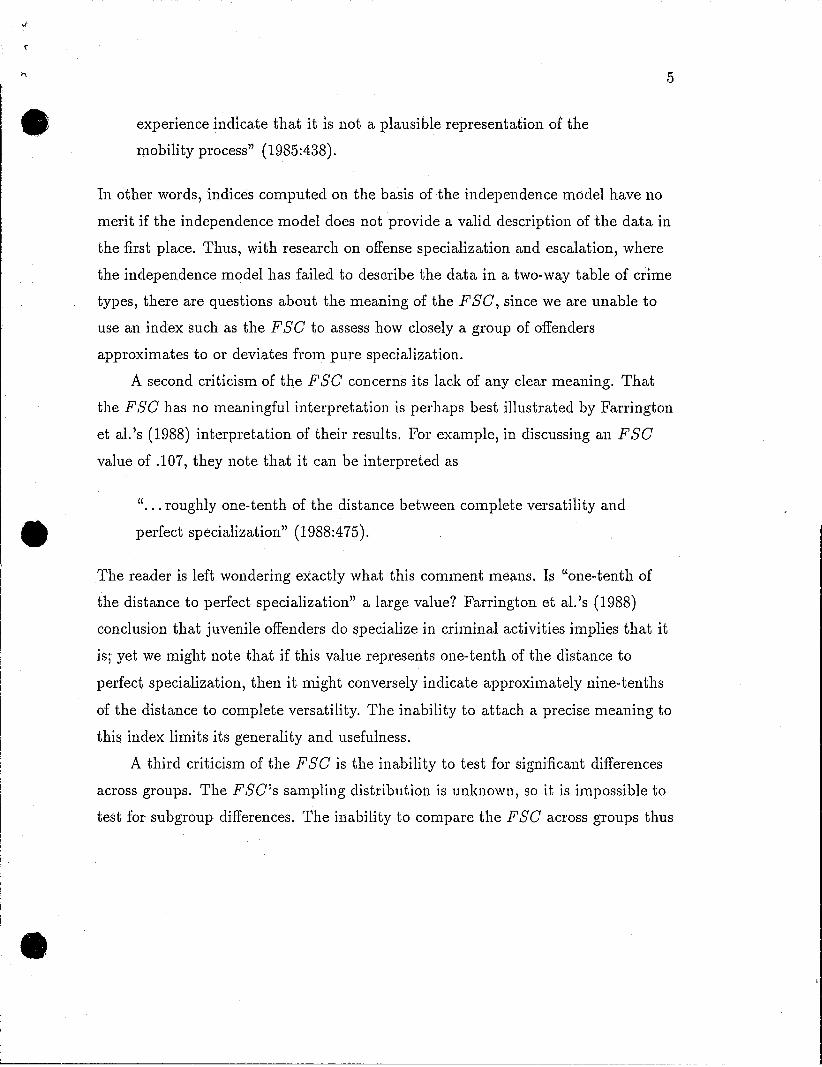
experience indicate that it is not a plausible representation of the
mobility process" (1985:438).
5
In other words, indices computed on the basis of the independence model have no
merit if the independence model does not provide a valid description of the data in
the first place. Thus, with research on offense specialization and escalation, where
the independence model has failed to desGribe the data in a two-way table of crime
types, there are questions about the meaning of the F se, since we are unable to
use an index such as the F se to assess how closely a group of offenders
approximates to or deviates from pure specialization.
A second criticism of the F se concerns its lack of any clear meaning. That
the F se has no meaningful interpretation is perhaps best illustrated by Farrington
et al.'s (1988) interpretation of their results. For example, in discussing an F se value of .107, they note that it can be interpreted as
" ... roughly one-tenth of the distance between complete versatility and
perfect specialization" (1988:475).
The reader is left wondering exactly what this comment means. Is "one-tenth of
the distance to perfect specialization" a large value? Farrington et al.'s (1988)
conclusion that juvenile offenders do specialize in criminal activities implies that it
is; yet we might note that if this value represents one-tenth of the distance to
perfect specialization, then it might conversely indicate approximately nine-tenths
of the distance to complete versatility. The inability to attach a precise meaning to
this index limits its generality and usefulness.
A third criticism of the F se is the inabillty to test for significant differences
across groups. The F se's sampling distribution is unknown, so it is impossible to
test for subgroup differences. The inability to compare the F se across groups thus
... '
•
•
•
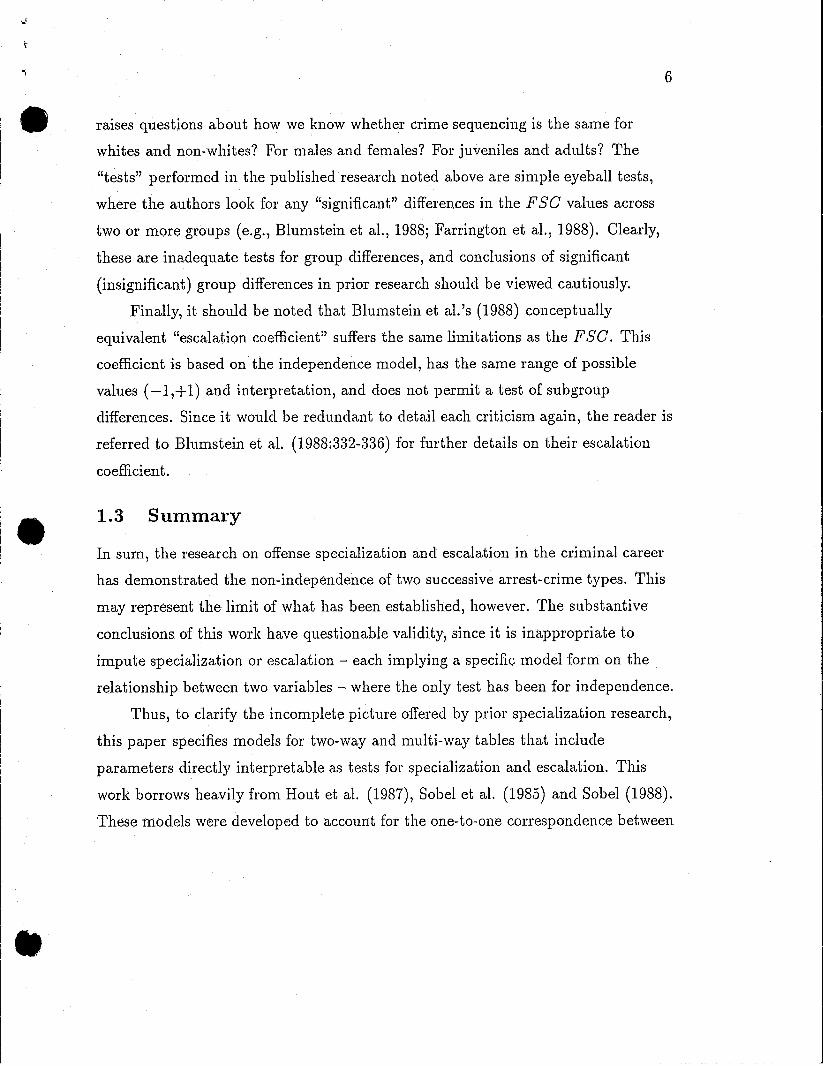
raises questions about how we know whether crime sequencing is the same for
whites and non-whites? For males and females? For juveniles and adults? The
"tests" performed in the published research noted above are simple eyeball tests,
where the authors look for any "significant" differences in the F se values across
two or more groups (e.g., Blumstein et al., 1988; Farrington et al., 1988). Clearly,
these are inadequate tests for group differences, and conclusions of significant
(insignificant) group differences in prior research should be viewed cautiously.
6
Finally, it should be noted that Blumstein et al. 's (1988) conceptually
equivalent "escalation coefficient" suffers the same limitations as the F se. This
coefficient is based on the independence model, has the same range of possible
values (-1,+1) and interpretation, and does not permit a test of subgroup
differences. Since it would be redundant to detail each criticism again, the reader is
referred to Blumstein et al. (1988:332-336) for further details on their escalation
coefficient.
1.3 Summary
In sum, the research on offense specialization and escalation in the criminal career
has demonstrated the non-independence of two successive arrest-crime types. This
may represent the limit of what has been established, however. The substantive
conclusions of this work have questionable validity, since it is inappropriate to
impute specialization or escalation - each implying a specific model form on the
relationship between two variables - where the only test has been for independence.
Thus, to clarify the incomplete picture offered by prior specialization research,
this paper specifies models for two-way and multi-way tables that include
parameters directly interpretable as tests for specialization and escalation. This
work borrows heavily from Rout et al. (1987), Sobel et al. (1985) and Sobel (1988).
These models were developed to account for the one-to-one correspondence between
~ 7
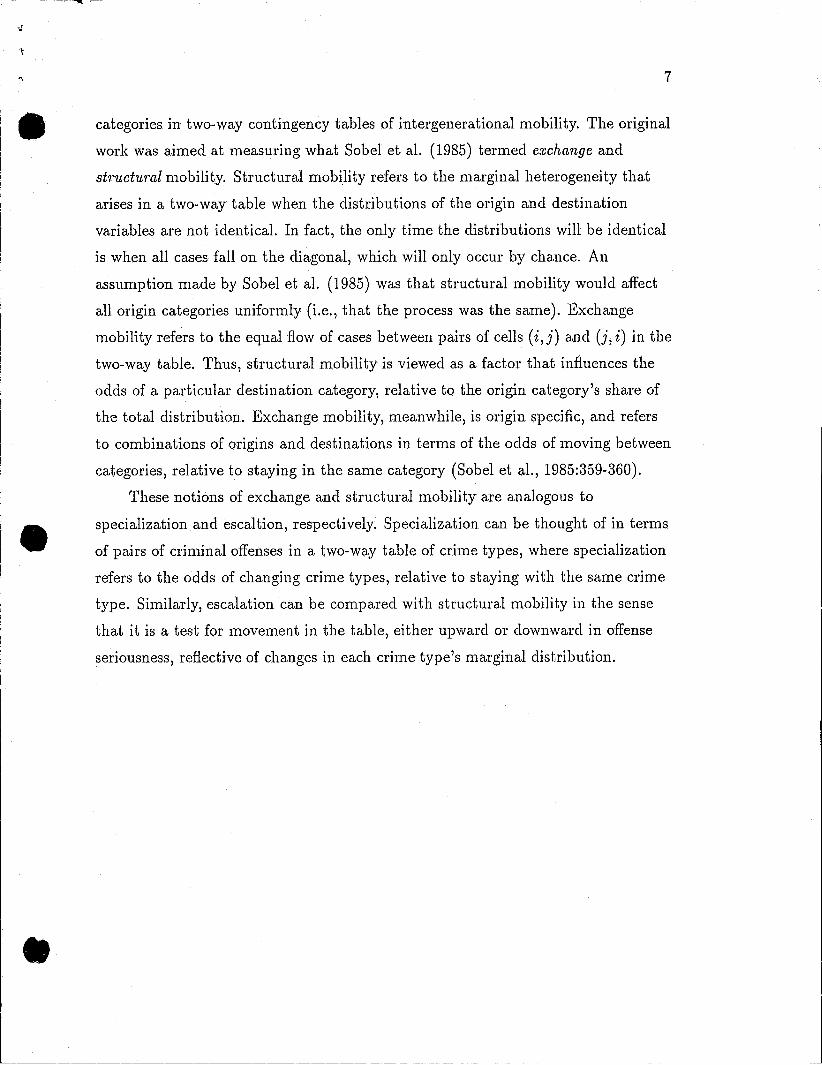
• categories in two-way contingency tables of intergenerational mobility. The original
work was aimed at measuring what Sobel et al. (1985) termed exchange and
structural mobility. Structural mobility refers to the marginal heterogeneity that
arises in a two-way table when the distributions of the origin and destination
variables are not identical. In fact, the only time the distributions will be identical
is when all cases fall on the diagonal, which will only occur by chance. An
assumption made by Sobel et al. (1985) was that structural mobility would affect
all origin categories uniformly (Le., that the process was the same). Exchange
mobility refers to the equal flow of cases between pairs of cells (i, j) and (j, i) in the
two-way table. Thus, structural mobility is viewed as a factor that influences the
odds of a particular destination category, relative to the origin category's share of
the total distribution. Exchange mobility, meanwhile, is origin specific, and refers
to combinations of origins and destinations in terms of the odds of moving between
categories, relative to staying in the same category (Sobel et al., 1985:359-360).
•
•
These notions of exchange and structural mobility are analogous to
specialization and escaltion, respectively. Specialization can be thought of in terms
of pairs of criminal offenses in a two-way table of crime types, where specialization
refers to the odds of changing crime types, relative to staying with the same crime
type. Similarly, escalation can be compared with structural mobility in the sense
that it is a test for movement in the table, either upward or downward in offense
seriousness) reflective of changes in each crime type's marginal distribution .
•
•
•
2 A MODEL OF OFFENSE SPECIALIZATION AND ESCALATION
2.1 Two-Way Tables
8
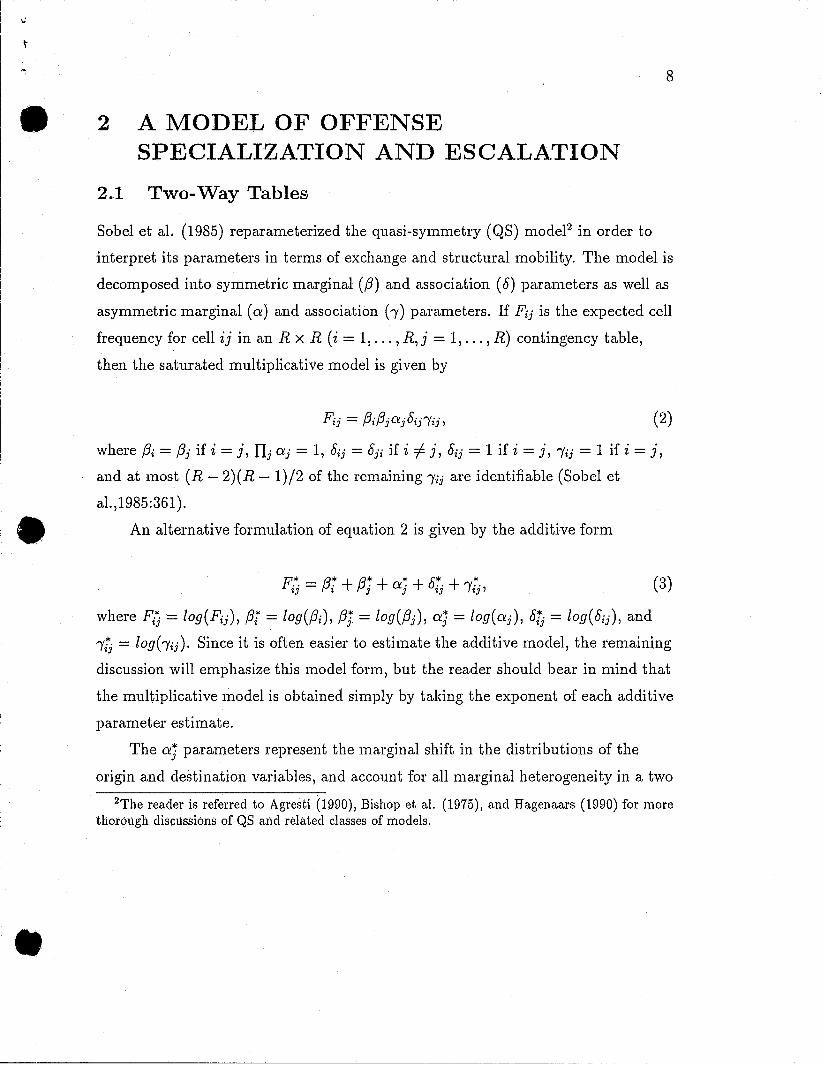
Sobel et al. (1985) reparameterized the quasi-symmetTy (QS) model2 in order to
interpret its parameters in terms of exchange and structural mobility. The model is
decomposed into symmetric marginal (f3) and association (8) parameters as well as
asymmetric marginal (a) and association ("I) parameters. If Fij is the expected cell
frequency for cell ij in an R x R (i = 1, ... , R, j = 1, ... ,R) contingency table,
then the saturated multiplicative model is given by
(2)
where Pi = pj if i = j, TIj aj = 1, 8ij = 8ji if i ::J j, 8ij = 1 if i = j, "Iij = 1 if i = j,
and at most (R - 2)(R - 1)/2 of the remaining "Iij are identifiable (Sobel et
a1.,1985:361 ) .
An alternative formulation of equation 2 is given by the additive form
F.*. = f3~ + f3~ + a~ + 8~. + "'~. lJ l· J J lJ I tJ ' (3)
where Ftj = log(Fij), f3i = log(f3i), f3J = log(f3j), aj = log(aj), 8ij = log(8ij ), and
1ij = logbij). Since it is often easier to estimate the additive model, the remaining
discussion will emphasize this model form, but the reader should bear in mind that
the multiplicative model is obtained simply by taking the exponent of each additive
parameter estimate.
The aj parameters represent the marginal shift in the distributions of the
origin and destination variables, and account for all marginal heterogeneity in a two
2The reader is referred to Agresti (1990), Bishop et al. (1975), and Hagenaars (1990) for more thorough discussions of QS and related classes of models .
----------- ----------
~ 9
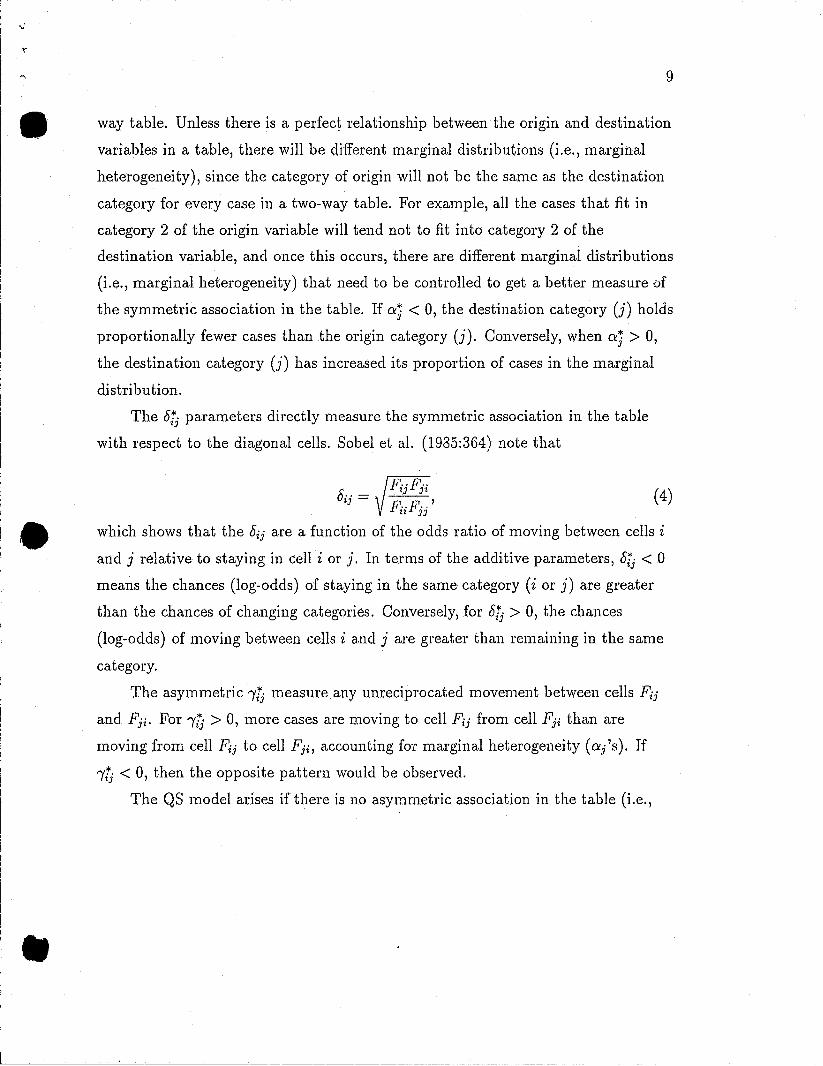
• way table. Unless there is a perfect relationship between the origin and destination
variables in a table, there will be different marginal distributions (i.e., marginal
heterogenei ty), since the category of origin will not be the same as the destination
category for every case in a two-way table. For example, all the cases that fit in
category 2 of the origin variable will tend not to fit into category 2 of the
destination variable, and once this occurs, there are different marginal distributions
(i.e., marginal heterogeneity) that need to be controlled to get a better measure of
the symmetric association in the table. If aj < 0, the destination category (j) holds
proportionally fewer cases than the origin category (j). Conversely, when aj > 0,
the destination category (j) has increased its proportion of cases in the marginal
distribution.
The 8ij parameters directly measure the symmetric association in the table
with respect to the diagonal cells. Sobel et al. (1935:364) note that
_FijFji ~= W FiiFjj'
• which shows that the 8ij are a function of the odds ratio of moving between cells i
•
and j relative to staying in cell i or j. In terms of the additive parameters, 8ij < 0
means the chances (log-odds) of staying in the same category (i or j) are greater
than the chances of changing categories. Conversely, for 8ij > 0, the chances
(log-odds) of moving between cells i and j are greater than remaining in the same
category.
The asymmetric iij measure any unreciprocated movement between cells Fij
and Fji . For 1'0 > 0, more cases are moving to cell Fij from cell Fji than are
moving from cell Fij to cell Fji, accounting fOT marginal heterogeneity (a/s). If
1ij < 0, then the opposite pattern would be observed.
The QS model arises if there is no asymmetric association in the table (i.e.,
---~--------~--------------------------------
10
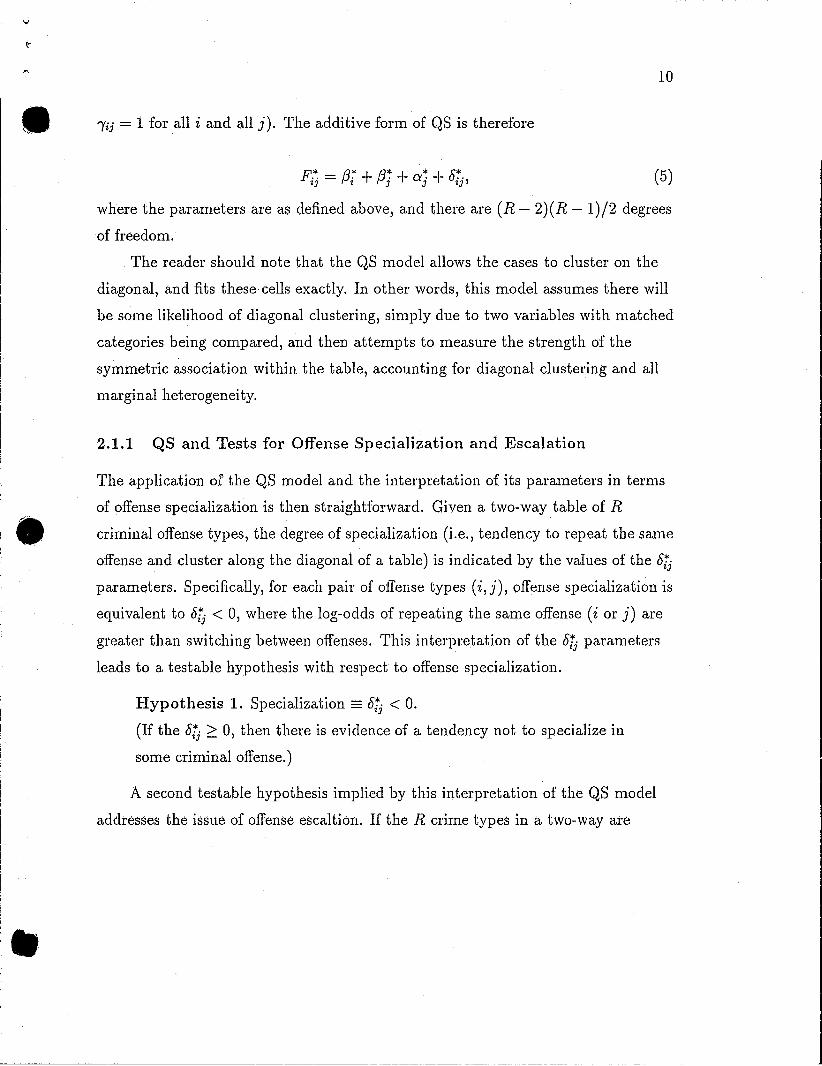
• lij = 1 for all i and all j). The additive form of QS is therefore
F.*. = f3~ + f3~ + a~ + o~· 1J 1 J J 1J' (5)
where the parameters are as defined above, and there are (R - 2)(R - 1)/2 degrees
of freedom.
The reader should note that the QS model allows the cases to cluster on the
diagonal, and fits these cells exactly. In other words, this model assumes there will
be some likelihood of diagonal clustering, simply due to two variables with matched
categories being compared, and then attempts to measure the strength of the
symmetric association within the table, accounting for diagonal clustering and all
marginal heterogeneity.
2.1.1 QS and Tests for Offense Specialization and Escalation
The application of the QS model and the interpretation of its parameters in terms
of offense specialization is then straightforward. Given a two-way table of R
• criminal offense types, the degree of specialization (i.e., tendency to repeat the same
offense and cluster along the diagonal of a table) is indicated by the values of the oij parameters. Specifically, for each pair of offense types (i, j), offense specialization is
equivalent to 00 < 0, where the log-odds of repeating the same offense (i or j) are
greater than switching between offenses. This interpretation of the oij parameters
leads to a testable hypothesis with respect to offense specialization.
•
Hypothesis 1. Specialization = oij < O.
(If the oij 2:: 0, then there is evidence of a tendency not to specialize in
some criminal offense.)
A second testable hypothesis implied by this interpretation of the QS model
addresses the issue of offense escaltion. If the R crime types in a two-way are
----_._--------~- - ----
11
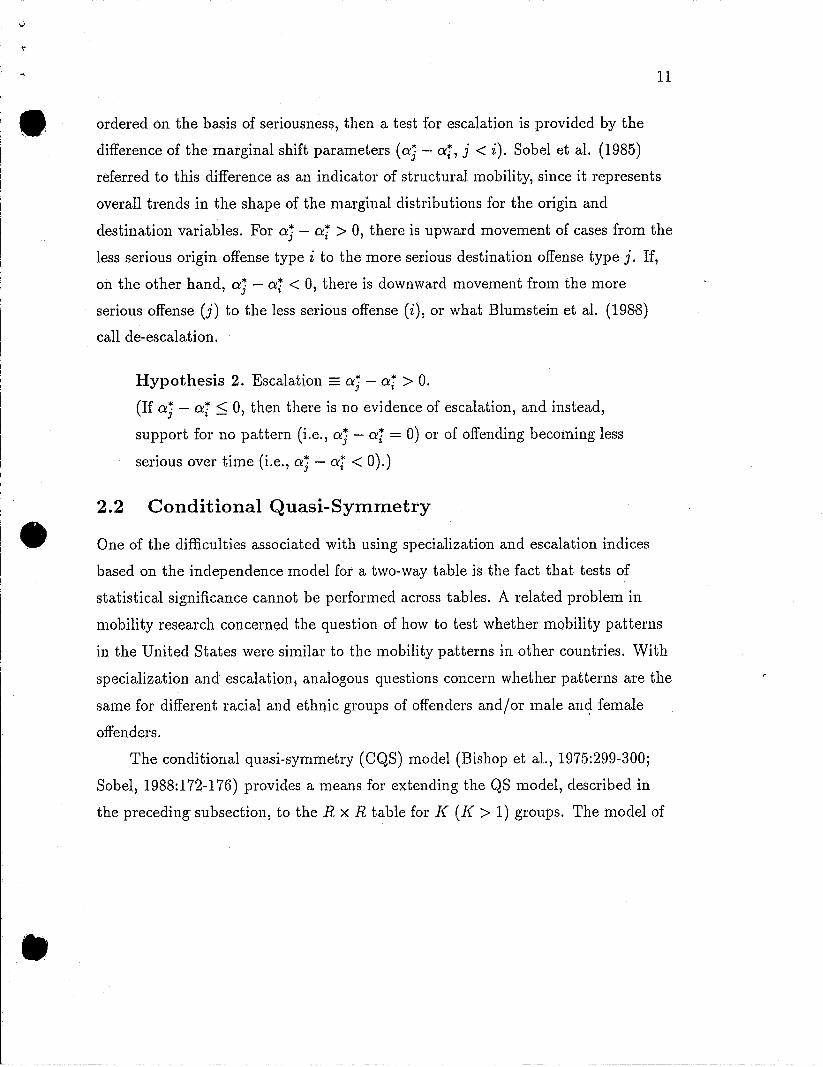
• ordered on the basis of seriousness, then a test for escalation is provided by the
difference of the marginal shift parameters (aj - at, j < i). Sobel et al. (1985)
referred to this difference as an indicator of structural mobility, since it represents
overall trends in the shape of the marginal distributions for the origin and
destination variables. For aj - at > 0, there is upward movement of cases from the
less serious origin offense type i to the more serious destination offense type j. If,
on the other hand, aj - at < 0, there is downward movement from the more
serious offense (j) to the less serious offense (i), or what Blumstein et al. (1988)
call de-escalation.
•
•
Hypothesis 2. Escalation = aj - at > o. (If aj - at ::; 0, then there is no evidence of escalation, and instead,
support for no pattern (i.e., aj - at = 0) or of offending becoming less
serious over time (i .e., aj - at < 0).)
2.2 Conditional Quasi-Symmetry
One of the difficulties associated with using specialization and escalation indices
based on the independence model for a two-way table is the fact that tests of
statistical significance cannot be performed across tables. A related problem in
mobility research concerned the question of how to test whether mobility patterns
in the United States were similar to the mobility patterns in other countries. With
specialization and escalation, analogous questions concern whether patterns are the
same for different racia.l and ethnic groups of offenders and/or male an~ female
offenders.
The conditional quasi-symmetry (CQS) model (Bishop et al., 1975:299-300;
Sobel, 1988:172-176) provides a means for extending the QS model, described in
the preceding subsection, to the R x R table for J( (J( > 1) groups. The model of
•
•
•
-----------------------------------
12
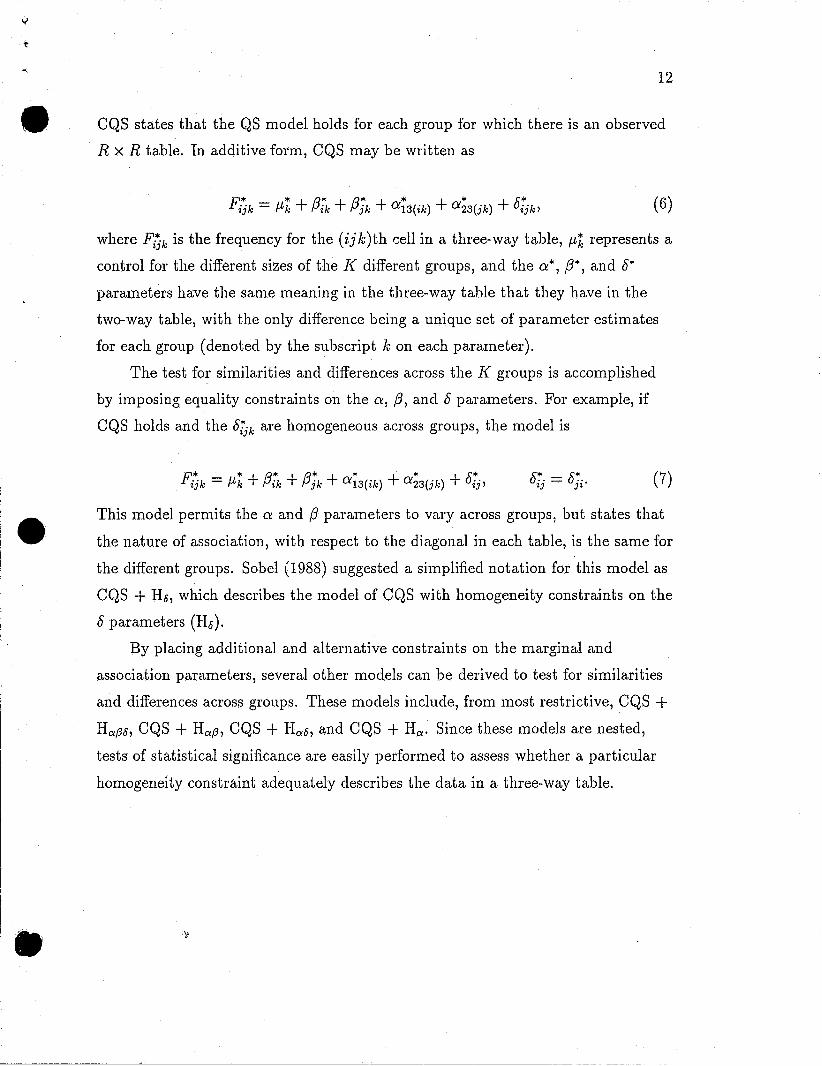
CQS states that the QS model holds for each group for which there is an observed
R x R table. In additive form, CQS may be written as
(6)
where Ftjk is the frequency for the (ijk)th ,o::ell in a three-way table, f-Lk represents a
control for the different sizes of the J( different groups, and the a*, /3*, and 8*
parameters have the same meaning in the three-way table that they have in the
two-way table, with the only difference being a unique set of parameter estimates
for each group (denoted by the subscript k on each parameter).
The test for similarities and differences across the J( groups is accomplished
by imposing equality constraints on the a, /3, and 8 parameters. For example, if
CQS holds and the 8ijk are homogeneous across groups, the model is
8~. = 8~. tJ Jt' (7)
This model permits the a and /3 parameters to vary across groups, but states that
the nature of association, with respect to the diagonal in each table, is the same for
the different groups. Sobel (1988) suggested a simplified notation for this model as
CQS + Hs, which describes the model of CQS with homogeneity constraints on the
8 parameters (Hs).
By placing additional and alternative constraints on the marginal and
association parameters, several other models can be derived to test for similarities
and differences across groups. These models include, from most restrictive, CQS + HaPs, CQS + HaP, CQS + HaS, and CQS + Ha. Since these models are nested,
tests of statistical significance are easily performed to assess whether a particular
homogeneity constraint adequately describes the data in a three-way table .
13
• 2.2.1 CQS and Offense Specialization and Escalation
The CQS model and tests for homogeneity restrictions then provide a means of
testing whether patterns of specialization and escalation are similar for different
groups of offenders. Specifically, based on the discussion linking parameters of the
QS and CQS models to specialization and escalation, similarities and differences
across groups of offenders are tested for by placing equality constraints on the a
and 8 parameters. There would seem to be three cases of primary interest. First, a
test for similar patterns of offense specialization would be given by the fit of the
model CQS + Hs. If the 8ijk are the same for different groups of offenders, their
tendency to cluster on the diagonal (repeat the same offense) are the same. Second,
a test for similar patterns of escalation is provided by the fit of the model CQS + Ha. Recall that the a parameters measure marginal heterogeneity, and that
differences in these parameters indicate shifts to ( away) from specific offense types.
Thus, if the a parameters are the same across groups, it states that there is the
same kind of marginal shift occurring in each R x R table of crime types for the
• different groups. Third, a test for Rimilarity in both specialization and escalation is
provided by the fit of the model CQS + HaS. If this model provides the best fit to
the data in a three-way table, then it means that the different groups of offenders
have the same patterns of crime-switching (specialization and escalation) across
their criminal careers.
•
3 DATA
The data to be used in the following analyses come from the Michigan Felony
Offenders Study conducted by Alfred Blumstein ancl Jacqueline Cohen.3 For
3Readers are referred to Blumstein et al. (1988) for a detailed description of the sample and methods of data collection.
14
• expository purposes, the following analyses are restricted to the first arrest
transition for black and white offenders in the Detroit SMSA. For the following
analyses, I use the same 10 offense classifications, and their assumed rank order
seriousness, used by Blumstein et al. (1988).4 The two-way tables illustrating the
transition from first to second adult arrest for black and white offenders are
displayed in Tables I and II, respectively.
•
•
4 FINDINGS
4.1 FSG Analysis
In order to establish a baseline against which to compare the results obtained from
the application of the QS model to the crime-type switching data, the F se values
for the diagonal cells in Tables I and II were calculated. The results from this
analysis are presented in Table 111.5
Turning first to the black offender subsample, we see that the three highest
F se values are for drug offenses (.258), auto theft (.246), fraud and robbery (both
.210), suggesting there was a significant tendency for black offenders in Detroit to
specialize in these crimes. The white offender subsample reveals a similar pattern,
where the three highest FSe values are for drug offenses (.373), fraud (.263), and
robbery (.258). The difference in the magnitudes of the FSe values for black and
white offenders further suggests that each group of offenders has a greater (lesser)
likelihood of specialization in some crime. For example, whites would be viewed as
4Some readers may object to the overly broad (narrow) offense descriptions used in this research. There may also be some debate over the relative seriousness of these 10 offenses. Although we should be wary of these concerns, they are beyond the immediate purpose of this paper, and will not alter the substance of the following discussion.
sThe reader should note that these results vary from those publishecl by Blumstein et al. (1988:322, Table VI). The primary reason is due to Blumstein et al. (1988) using summary transition matrices (i.e., all pairs of arrest sequences) for these offencler subsamples, while the research reported here uses only the first offense transition .
15
• more likely to specialize in drug, fraud and robbery offenses, since the F se values
appear to be considerably larger (.373 to .258, .263 to .210, and .258 to .210,
respectively), while the sample of black offenders shows a greater likelihood of
specializing in auto theft (.246 to .183).
Two additional aspects of Table III are worth noting. First, the F se values
for murder and rape for white offenders are negative. The reason for this is no one
charged with murder or rape for their first offense repeated that crime, leaving the
diagonal cell empty (see Table II). Second, recall that differences in the F se cannot be tested across groups. Thus, while the differences in F se values for
murder (.139), drug (.ll5), larceny (.107), and rape (.097) offenses may appear to
vary substantially across black and white offender subsamples, we really have no
way of knowing whether these differences are meaningful.
4.2 Application of the QS Model
The QS model fit statistics and parameter estimates for the black and white
• offender subsamples are displayed in Tables IV and V, respectively. As indicated by
the model fit statistics, the QS model offers a good fit to the crime-type data in
Tables I and II (L2 = 42.426, df = 36, p = 0.214, and L2 = 46.100, df = 36,
•
p = 0.121, respectively). The importance of the fit of this model is the ability to
interpret the parameter estimates as tests for specialization and escalation.
For the black offender subsample, we see that all the 8ij parameters are less
than zero (statistically significant with p ::; .05, one-tail test), except for 8t2' which
means the likelihood of switching between murder and rape is the same as the
likelihood of repeating the same offense. The strongest relationship is indicated by
838 (-3.016), the association between robbery and auto theft, which can be
interpreted as meaning the odds of switching between robbery and auto theft
relative to repeating the same crime are .002 (exp( -3.016)2). In other words,
------- ---- -- -- - - ---------------- ------------------
16
• offenders charged with robbery or auto theft for their first crime are much more
likely to repeat the same offense, rather than switch between these two offenses.
•
•
The a; parameters, as noted above, account for marginal heterogeneity. The
values of the a; parameters in Table IV show that regardless of the first offense,
offenders are more likely to commit a homicide (a~ = .624), weapons (a~ = .214)
and fraud (a~ = .070) offenses. Offenders are then less likely to commit rape
(a2 = -.537), burglary (a6 = -.323), and auto theft (as = -.538) for their second
cnme.
Table VI presents the test for escalation - the difference of the marginal shift
parameters (a; - ai). These results provide mixed evidence for a pattern of
escalation. There is clear upward movement from rape to homicide, from burglary
to homicide, robbery, aggravated assault, and drug offenses, and from auto theft to
homicide, robbery, aggravated assault, drug and larceny offenses. At the same time,
however, there are significant downward trends from rape to robbery, aggravated
assault, drug, larceny and weapons offenses, from burglary to larceny weapons and
fraud offenses, and from auto theft to weapons and fraud offenses. In sum, of the
20 statistically significant differences, 10 show evidence of escalation, while 10 show
evidence of de-escalation.
For the white offender subsample, the picture appears to be different. There
are many more oij parameters that are not statistically different from zero,
suggesting there is not as great a tendency for cases to cluster along the diagonal,
thus indicating a weaker tendency among white offenders to specialize their
criminal activities. Recall that oij = 0 means that the odds of switching crime
types relative to committing the same crime type are the same. Thus, the evidence
of specialization among the white offender subsample would appear to be much
weaker than in the black offender subsample. This finding varies with the results
from the F se analysis displayed in Table III. Recall that the pattern of F se
---------------------------------------------------------
values in Table III implied specialization was more prevalent in the white
subsample. The QS model reveals a different pattern: specialization is more
prevalent among the black offender subsample.
17
Turning to the issue of escalation, we see from Table V that, regardless of first
offense type, offenders are less likely to commit larceny (a; = -.20) and auto theft
(a~ = -.33) offenses for their second crime. The results from a specific test for
escalation appear in Table VII. In contrast to the results for the black offender
subsample, there is only limited evidence of escalation. The only evidence of
escalation shows that white offenders charged with larceny on the first arrest were
significantly more likely to move up to robbery, while offenders charged with auto
theft, similar to the black offender subsample, are more likely to move to robbery,
aggravated assault, and drug offenses.
To summarize the results thus far, they demonstrate that the parameters of
the QS model provide a much more detailed description of the nature of association
between first and second crime type. They also point to some limits to the validity
• of the FSG, where, based on this coefficient, we would have concluded, as have
prior studies, that there were significant levels of specialization and escalation
among both the black and white offender subsamples. The problem with this
•
conclusion, as the results in Tables IV through VII show, is that it misses some
important aspects of the association between successive crime types, such as the
the level of specialization and escalation being much more pronounced in t.he black
offender subsample, while there is only scant evidence of either specialization or
escalation for the white offender subsample.
4.3 Application of the CQS Model
As I noted above, one of the main benefits to the use of the CQS model and its
derivatives is the ability to test for equality in marginal and association parameters
18
• across groups. The model fit statistics for the CQS model, in addition to the five
alternative models that impose equality constraints on the a, f3 and 8 parameters,
are shown in Table VIII. Based on difference of chi-square tests, the overall,
best-fitting model is CQS + Hs, since the imposition of additional constraints
deteriorates the model fit, while relaxing the equality constraint on the 8
parameters, resulting in the general CQS model, does not significantly improve the
fit of the model to the data (L2 = 40.450, df = 45, p = .35).
•
•
There are two important implications of the model CQS + Hs. First, it states
that the nature of association in each table, with respect to the diagonal, is the
same for black and white offender subsamples. In short, the pattern of
specialization, to the degree it exists, is the same for both groups of offenders.
Second, this model states that patterns of marginal heteroeneity are different for
the two groups of offenders, since the equality constraint on the a parameters
provided a significantly worse fit to the data. Thus, there are significant differences
in the patterns of escalation for the two groups of offenders.
The parameter estimates for the CQS + Hs model are displayed in Table IX.
Note that the 8ij are all significantly less than zero, with the exception of 8;2 - the
association parameter for murder and rape. Simply put, there is a uniformly strong
tendency for offenders to repeat the same crime, rather than switch to an
alternative crime type, for all pairs of crime types. Interestingly, this relationship
has about the same magnitude regardless of the distance from the diagonal. In
other words, the likelihood that an offender will switch crime types relative to
staying with the same crime type is approximately the same whether there is little
or great difference in the seriousness of the acts. For example, the likelihood of
switching (relative to staying) between rape and a weapons offense (8;9 = -1. 707)
is close to the likelihood of switching (relative to staying) between aggravated
assault and a drug offense (845 = -1.642).
•
•
•
19
The discussion on patterns of escalation noted above for the two groups of
offenders still applies to the results presented in Table IX, since the aj were allowed
to vary across group. The results of testing for escalation across the two groups of
offenders are displayed in Panels A and B of Table X for black and white offenders,
respectively. Although the absolute values of the differences (aj - an vary at the
second or third decimal point, the pattern of escalation for black and white
offenders found under the CQS + Rs model is identical to that found under QS and
displayed in Tables VI and VII.
To summarize, the results presented in this analysis show the pattern of
specialization among black and white felony offenders to be statistically
indistinguishable, while the two groups of offenders appear to have different
tendencies to increase or decrease the seriousness of their criminal offenses across
their criminal careers. This set of results then conflicts with the conclusion of
Blumstein et al. (1988) that the pattern of escalation was similar between black
and white offenders .
5 CONCLUSIONS
The goal of this paper has been to propose and to apply a substantively meaningful
and testable model of specialization and escalation in criminal offending. The QS
model used in this paper is based on the work of Sobel et al. (1985) and Rout et al.
(1987), and contains parameters that are directly interpretable as indicators of
either specialization or escalation. This model was then extended to allow for
subgroup comparisons, which resulted in the CQS model. These models were
applied to data previously tested for specialization and revealed significant
differences in the pattern and level of specialization when compared to the pattern
found with traditional indices of specialization. Although the analyses here have
i I -
..
•
•
•
20
been limited to the first arrest transition for the black and white offender
subsamples, they would seem to raise doubts about the validity of Blumstein et al. 's
conclusions regarding specialization among criminal offenders in the same sample.
In regard to tests for escalation, the model tested here provides clear evidence
of a small group of offenders increasing the severity of the crimes they commit
across their cFiminal careers, but, at the same time, there is evidence of many
offenders decreasing the severity of their criminal offenc!ing. The overall pattern,
then, is mixed. Clearly, additional tests will be necessary to document what, if any,
pattern in offense sequence seriousness exists.
For the first time in research on specialization and escalation, statistical tests
for significant differences across subgroups were performed. The results of the
subgroup comparison show that black and white offender subsamples have
statistically identical patterns of specialization, but different patterns of escalation.
Thus, black offenders are just as likely as white offenders to repeat or switch crime
types, regardless of which pair of the ten crime types is being investigated. Further,
trends in escalation are much more pronounced for the black' offender subsample,
while there is very little evidence of escalation among the subsample of white
offenders. Although the test here was limited to race, and depending upon data
availability, contrasts by age, gender, offense transition (e.g., second to third
arrest), or some other relevant category could be performed.
Continued reHance on indices of specialization and escalation will do little to
advance knowledge of the processes underlying the likelihood of individual criminal
offenders to specialize and/or to increase the seriousness of their crimes across the
life course. The models used in this paper offer a means of improving the overall
quality of research on criminal specialization and escalation. In addition to the
ability to attach a precise meaning to the parameter estimates, these models also
offer a means of performing multivariate analyses of the detenninants of

21
• specialization and escalation .
•
• ~_ ~~ __ ~ ___ ~~ _____ ~~~~ ____________ ----l
t
•
•
•
•
References
Agresti, Alan. 1990. Categorical Data Analysis. New York: Academic Press.
Bishop, Yvonne M. M., Stephen E. Fienberg, and Paul W. Holland. 1975. Discrete Multivariate Analysis: Theory and Practice. Cambridge, MA: MIT Press.
Blumstein, Alfred, Jacqueline Cohen, Jeffrey Roth, and Christy Visher, eds. 1986. Criminal Careers and "Career Criminals," Volume l. Report of the Panel on Research on Criminal Careers, National Research Council. Washington, D.C.: National Academy Press.
Blumstein, Alfred, Jacqueline Cohen, Somnath Das, and Soumyo Moitra. 1988. "Specialization and Seriousness During Adult Criminal Careers." Journal of Quantitative Criminology 4: 303-345.
Brennan, Patricia, Sarnoff Mednick, and Richard John. 1989. "Specialization in Violence: Evidence of a Criminal Subgroup." Criminology 27: 437-453.
Bursik, Robert. 1980. "Dynamics of Specialization in Juvenile Offenders." Social Forces 58: 850-864 .
Cohen, Jacqueline. 1986. "Research on Criminal Careers." In Criminal Careers and "Career Criminals," Volume 1, ed. Alfred Blumstein et al. Washinton, D.C.: National Academy Press.
Duncan, Otis Dudley. 1979. "How Destination Depends on Origin in an Occupational Mobility Table." American Journal of Sociology 84: 793-803.
Farrington, David P., Howard N. Snyder, and Terrence Finnegan. 1988. "Specialization in Juvenile Court Careers." Criminology 26: 461-487.
Farrington, David P. 1986. "Age and Crime." In Crime and Justice: An Annual Review, ed. Michael Tonry and Norval Morris.
Haberman, Shelby J. 1978. Analysis of Qualitative Data, Volume l. New York: Academic Press .
•
•
•
•
Hagenaars, Jacques A. 1990. Categorical Longitudinal Data: LogLinear Panel, Trend, and Cohort Analysis. Newbury Parle Sage.
Hauser, Robert M. 1986. "Reinventing the Oxcart: Jones' Obsolete Proposal for Mobility Analysis." Social Forces 64:1057-1065.
Hope, Keith. 1982. "Vertical and Nonvertical Class Mobility." American Sociological Review 47:100-113.
Hout, Michael, Otis Dudley Duncan, and Michael E. Sobel. 1987. "Association and Heterogeneity: Structural Models of Similarities and Differences." Sociological Methodology 17: 145-184. ,ed. Clifford Clogg, Washington, D.C.: American Sociological Association.
Kempf, Kimberly. 1987. "Specialization and the Criminal Career." Criminology 25: 399-420.
Moitra, Soumyo D. 1981. The Analysis of Sentencing Policies Considering Crime Switching Patterns and Imprisonment Constraints. Unpublished Ph.D Dissertation. School of Urban and Public Affairs, Carnegie-Mellon University.
Nevares, Dora, Marvin E. Wolfgang and Paul E. Tracy. 1990 . Delinquency in Puerto Rico: The 1970 Birth Cohort Study. New York: Greenwood Press.
Rojek, Dean G. and Maynard L. Erickson. 1982. "Delinquent Careers: A Test of the Career Escalation Model." Criminology 20: 5-28.
Sobel, Michael E. 1983. "Structural Mobility, Circulation Mobility and the Analysis of Occupational Mobility: A Conceptual Mismatch." American Sociological Review 48:721-'727.
Sobel, Michael E. 1985. "Theory, Description, and Quantification: A Note on the Use of the Independence Model in Mobility Research." Sociology 19:437-441.
Sobel, Michael E. 1988. "Some Models for the Multiway Contingency Table with a One-to-One Correspondence among Categories." Sociological Methodology 18: 165-192. ,ed. Clifford CloggWashington, D.C.: American Sociological Association .
•
•
•
Sobel, Michael E., Michael Rout, Otis Dudley Duncan. 1985. "Exchange, Structure, and Symmetry in Occupational Mobility." American Journal of Sociology 91: 359-372.
Tracy, Paul E., Marvin E. Wolfgang, and Robert M. Figlio. 1990. Delinquency Careers in Two Birth Cohorts. New York: Plenum Press.
Wolfgang, Marvin E., Robert M. Figlio, and Thorstein Sellin. 1972. Delinquency in a Bjrth Cohort. Chicago: University of Chicago Press.
Wolfgang, Marvin E., Terrence F. Thornberry, and Robert M. Figlio. 1987. From Boy to Man: From Delinquency to Crime. Chicago: University of Chicago Press.
Yasuda, Saburo. 1964. "A Methodological Inquiry into Social Mobility." American Sociological Review 29:16-23 .