Embed Size (px)
Citation preview

Modeling System Effects and StructuralLoad Paths in a Wood-Framed Structure
Kenneth G. Martin1; Rakesh Gupta, M.ASCE2; David O. Prevatt, M.ASCE3;Peter L. Datin4; and John W. van de Lindt, M.ASCE5
Abstract: The objective of this project was to evaluate system effects and further define load paths within a light-frame wood structure underextreme wind events. The three-dimensional 30- by 40-ft (9.1- by 12.2-m) building, designed to be representative of typical light-frame woodconstruction in the southeastern coastal region of the United States, was modeled using SAP2000. Wall and roof sheathing was modeled usingSAP’s built-in thick shell element. The effect of edge nail spacing of the wall sheathing was incorporated by way of a novel correlationprocedure, which eliminated the need to represent each nail individually. The computer model was validated against both two- and three-dimensional experimental studies (in plane and out of plane). Uniform uplift pressure, worst-case simulated hurricane, and ASCE 7-05 pres-sures were applied to the roof, and vertical foundation reactions were evaluated. The ASCE 7-05 uplift pressures were found to adequatelyencompass the range of uplift reactions that can be expected from a severe wind event such as a hurricane. Consequently, it was observed thatASCE 7-05 “component and cladding” pressures satisfactorily captured the building’s uplift response at the foundation level without the use of“main wind force-resisting system” loads. Additionally, the manner in which the walls of the structure distribute roof-level loads to the foun-dation depends on the edge nailing of the wall sheathing. It was also revealed that an opening in any wall results in a loss of load-carryingcapacity for the entirewall. Moreover, thewall opposite the onewith the opening can also be significantly affected depending on the orientationof the trusses. In general, it was determined that complex, three-dimensional building responses can be adequately characterized using thepractical and effective modeling procedures developed in this study. The same modeling process can be readily applied in industry for similarlight-framed wood structures. DOI: 10.1061/(ASCE)AE.1943-5568.0000045. © 2011 American Society of Civil Engineers.
CE Database subject headings: Residential buildings; Wind loads; Wood structures; Hurricanes.
Author keywords: Load sharing; Residential buildings; Wind loads; Wood building modeling; Hurricane loads.
Introduction
In the United States, hurricane damage to residential structures re-sults in about $5 billion in losses annually (FEMA 2006). The vastmajority of losses are the result of failure of single-family wood-framed residential structures. The most common failures in homesobserved since Hurricane Camille (1969) are to roof systems, andproper anchorage (i.e., load path) is generally missing (Dikkerset al. 1970). These same concerns have repeatedly been voicedby researchers over the ensuing years, who also noted recurringwidespread structural damage attributable to lack of continuityin the load paths. Poststorm reports after Hurricane Katrina re-vealed similar patterns of structural failures of roof sheathing loss
(Fig. 1) and connection failures, as observed in Hurricane Katrina(van de Lindt et al. 2007). Arguably, improvements in hurricaneresistance of residential buildings have not been sufficient in lightof ample evidence from poststorm reports that concluded change isurgently needed. Wood-framed construction accounts for about90% of the existing residential housing stock in the country, andapproximately 95% of new homes. Reducing losses for residentialbuildings begins with forming a better understanding of the loadpaths from the roof to the foundation, which will likely alter theway in which light-frame wood buildings are designed for hurri-cane force winds.
A successful structural design, in its most basic form, must en-sure that buildings are capable of supporting loads and performingtheir intended functions. There are two more fundamental conceptsthat must also be integrated into structural design, yet are oftenoverlooked. The first concept is the need for a continuous load path.Second, designers must consider system effects that exist within thestructure. Today’s buildings are so complex that individual mem-bers inherently share load with their neighbors, yet these interac-tions are seldom incorporated into structural evaluations. This isperhaps because there is generally no practical manner by whichto address system effects. It is also essential that load paths be wellunderstood and evaluated in performing any structural analysis.Experience has shown that failure to do so leads to significant dam-age and even collapse (Taly 2003). History validates this notion; inthe aftermath of hurricane Katrina, damage assessment teams ob-served widespread damage and significant patterns of structuralfailure attributable to a lack of load path, especially because of wind
1Former Graduate Research Assistant, Dept. of Wood Science & Engi-neering, Oregon State Univ., Corvallis, OR.
2Professor, Dept. of Wood Science & Engineering, Oregon State Univ.,Corvallis, OR (corresponding author). E-mail: [email protected])
3Assistant Professor, Dept. of Civil Engineering, Univ. of Florida,Gainesville, FL.
4Graduate Research Assistant, Dept. of Civil Engineering, Univ. ofFlorida, Gainesville, FL.
5Associate Professor, Dept. of Civil Engineering, Colorado State Univ.,Ft. Collins, CO.
Note. This manuscript was submitted on February 25, 2010; approvedon May 19, 2011; published online on November 15, 2011. Discussionperiod open until May 1, 2012; separate discussions must be submittedfor individual papers. This paper is part of the Journal of ArchitecturalEngineering, Vol. 17, No. 4, December 1, 2011. ©ASCE, ISSN 1076-0431/2011/4-134–143/$25.00.
134 / JOURNAL OF ARCHITECTURAL ENGINEERING © ASCE / DECEMBER 2011
J. Archit. Eng., 2011, 17(4): 134-143
Dow
nloa
ded
from
asc
elib
rary
.org
by
OR
EG
ON
ST
AT
E U
NIV
ER
SIT
Y o
n 06
/19/
17. C
opyr
ight
ASC
E. F
or p
erso
nal u
se o
nly;
all
righ
ts r
eser
ved.

uplift, as one of the prevalent failure mechanisms observed (van deLindt et al. 2007).
Previous research has been conducted in the realm of wood-frame structures exposed to wind loads, but it has stopped shortof fully addressing the mechanisms at play within these complexsystems, especially in uplift scenarios. For example, much of theresearch has focused on specific components within the structure,such as roof or wall sheathing (Sutt 2000; Hill et al. 2009), or to-ward one particular type of connection, e.g., roof-to-wall (Reedet al. 1997; Riley and Sadek 2003). Very little work has addressedthe system effects in full-size buildings (Asiz et al. 2010a, b).Fortunately, this shortfall can be overcome by using an analyticaltool, such as a modern structural analysis computer program, whichdirectly incorporates system effects, mainly load sharing amongtrusses in the roof and studs in walls.
The following tasks represent the overall objectives of thisstudy. Throughout this research, one goal at the forefront of eachtask was to address very complex structural behaviors using themost pragmatic modeling techniques possible. In this manner, theauthors hope to develop a practical analysis approach for use bywood engineers and designers to readily and accurately predictthe behavior of similar wood structures. Specific goals were:(1) to develop a practical three-dimensional (3D) computer modelof a full-size light-frame wood structure, (2) to develop a practicalrepresentation of the sheathing nailing schedule to be incorporatedinto the computer model, and (3) to evaluate critical load paths andsystem effects for different building geometries under various windloading scenarios.
Literature Review
Mtenga (1991) developed a two-dimensional (2D) truss model withsemirigid, nonlinear connections at all the joints. Although hismodel proved to be an accurate predictor of member forces andmoments when compared with experimental results, Mtenga con-cluded that the model might be unnecessarily complicated. Severalresearchers have successfully used simplified connection (pinand rigid) models (Li et al. 1998; Gupta et al. 2004; Gupta andLimkatanyoo 2008) to successfully predict the behavior of 3D rooftruss assemblies.
Many previous studies have used beam elements to model thebehavior of sheathing. For example, Li et al. (1998) used threebeam elements per side in their nine-truss roof assembly modelto represent the roof sheathing. Their model was found to be ingood agreement with experimental results. Gupta et al. (2004)and Gupta and Limkatanyoo (2008) also used frame elements ina similar fashion to simulate roof sheathing. Some researchers haveexplored the use of area or shell elements built in to modern struc-tural analysis programs such as SAP. Doudak (2005) represented
oriented strand board (OSB) wall sheathing in 2D shear wall testsusing the shell element with elastic orthotropic material properties.Doudak fastened the sheathing to the framing members using non-linear link elements, which exhibited strength degradation as theconnection approached failure. This modeling procedure requiredindividual link elements to model every fastener in the shearwall. Although accurate, such “meticulous detailing”—as Doudaknoted—can be quite laborious to implement. Results from the ana-lytical model were compared with similar full-scale tests, and it wasfound that the two were in good agreement.
Zisis (2006) also made use of SAP’s shell element to model thesheathing while investigating wind effects on a low-rise woodenbuilding. In his study, Zisis chose to represent the in-plane forcesusing shell membrane behavior, but excluded plate (out-of-planebending) behavior of the element. As a result, the sheathing re-sponse in this research was limited to in-plane behavior. In addi-tion, isotropic material properties were assigned to the membrane,which may not necessarily capture the orthotropic nature of ply-wood and OSB sheathing. Finally, Zisis noted that a linear modelwas used; however, no additional details were provided. Thus, byeliminating the nonlinear link element of Doudak’s effort, it is un-clear how Zisis modeled the sheathing nail connection between theshell element and the framing members. In the most recent papers,Asiz et al. (2010a, b) address issues associated with system-levelmodeling of timber light-frame building superstructures in elasticand overload response regimes.
The Forest Products Laboratory, based in Madison, Wisconsin,has pioneered several full-scale load sharing studies in the past30 years. McCutcheon (1977) showed that there is an interactionbetween the sheathing and the joists, which tends to increase thestiffness of the floor system as a whole, but the two componentsdo not act as if they were rigidly connected together. Wolfeand McCarthy (1989) then investigated load sharing within anassembly of roof trusses and found that stiffer trusses carry a greatershare of the load, and truss deflections were far less in the assemblythan outside assembly. Wolfe and LaBissoniere (1991) showed that40–70% of the load applied to an individual truss is distributed toadjacent unloaded trusses by the plywood sheathing.
Additional load sharing and system interaction studies were alsoconducted by LaFave and Itani (1992), Percival and Comus (1980),and many others. A detailed literature review of these studies ispresented by Gupta (2005) and is, therefore, not included inthis paper.
Materials and Methods
In this study, an analytical model of a light-frame wood structurewas developed and validated. The major thrust of this researchhas focused on the development of simple, yet accurate material
Fig. 1. Roof sheathing failures of houses in Hurricane Katrina (reprinted from van de Lindt et al. 2007)
JOURNAL OF ARCHITECTURAL ENGINEERING © ASCE / DECEMBER 2011 / 135
J. Archit. Eng., 2011, 17(4): 134-143
Dow
nloa
ded
from
asc
elib
rary
.org
by
OR
EG
ON
ST
AT
E U
NIV
ER
SIT
Y o
n 06
/19/
17. C
opyr
ight
ASC
E. F
or p
erso
nal u
se o
nly;
all
righ
ts r
eser
ved.

assignments and property correlations for use in three-dimensionalwood structures. Considerable efforts were made to use built-infeatures of the software in conjunction with simple modeling tech-niques to capture complex structural responses (e.g., system effects,effect of nailing schedule).
A uniform uplift pressure was applied to the roof sheathing tobetter understand how the model behaved under uplift loads.Several scenarios (e.g., changing anchor bolt spacing, adding anopening to one wall, increasing the building length) were consid-ered while the structure was subjected to this uniform uplift pres-sure. Next, the reaction profile of the structure was compared whensubjected to simulated hurricane wind uplift loads against profilesubjected to ASCE 7-05 (ASCE 2005) design wind pressures.
The analytical model of the index building (Fig. 2) was devel-oped using SAP2000 (Computers and Structures 2008). The modelis composed entirely of pinned or rigid connections, and all mate-rials are assumed to behave within the elastic range. Although someparts of the building may go in to inelastic range, the generalbehavior of the building most likely would be the same as in theelastic rage.
Studs and truss members are represented using frame elementswith isotropic material properties. Wall and roof sheathing are mod-eled using the thick shell element with orthotropic material proper-ties. Anchorage devices are represented by grounded springs.
The footprint of the index building is 29 ft, 4 in. (9 m) wide by40 ft (12.2 m) long with overhangs on all sides. The gable roof has a4∶12 slope. Studs are spaced 16 in. (406 mm) on center, and trussesare 24 in. (610 mm) on center. The bottom plate is anchored to thefoundation using 1=2-in. (12.7-mm) diameter anchor bolts spacedat 4-ft (1.2-m) intervals. At each corner of the building, there is aSimpson Strong-Tie HDU2 hold-down attached to the double stud.The roof sheathing is 1=2-in. plywood, and the wall sheathing is7=16-in. (11 mm) OSB. There are no interior partitions (Fig. 2).Specific construction features and detailed framing plans of theindex building can be found in Martin (2010).
Modeling
Shell Element BehaviorThe roof sheathing [1=2-in. (12.7-mm) plywood] and wall sheath-ing [7=16-in. (11-mm) OSB] were modeled using SAP’s thick shellelement to include system effects. In the modeling environment—where the walls and roof structure are defined and manipulated—individual shell elements were used to represent each wall/roofsection. That is, an individual 4 × 8-ft (1:2 × 2:4-m) sheet ofplywood/OSB was not modeled, but instead an entire side wall (orroof surface) is represented by a single one shell element in SAP.SAP then automatically subdivides each modeling shell element
into multiple analysis shell elements, in a process known as mesh-ing. The user controls how the mesh is defined and can inspect themeshed “analysis model” of each shell element created (Fig. 3).The shell-element approach was verified using test results fromliterature as describe subsequently in the paper.
This modeling approach implicitly assumes that internal forcesare transferred continuously across the joints between the actual4 × 8-ft (1:2 × 2:4-m) sheathing panels. This practical assumptioncan be judged by examining the wall and roof systems in greaterdetail. In wall systems, blocking along all panel edges and highnailing density contribute to the validity of the assumption. In roofsystems, the assumption of continuity across the joints is drawnfrom four sources: (1) staggered joints along truss lines, (2) edgenail spacing of 6 in. (152 mm) or less along truss lines, (3) un-blocked panel edges with nails within 3=8 in. (10 mm) from theedge where trusses support the panels, and (4) “H-clips” locatedin the bays between trusses. Martin (2010) provides further detailsand accompanying figures related to this discussion.
ConnectivityThe members within the truss are connected using a mixture ofpinned and rigid connections. This configuration was used success-fully in the research effort conducted by Gupta and Limkatanyoo(2008). The joint representing the heel of the truss is not coincidentwith the connection to the top plate of the wall. Since the analog ofthe wall members is drawn through the centerlines, these two jointsare offset by a distance of 1.75 in. (44 mm) [i.e., half the width ofthe nominal 2 × 4-in: (51 × 102-mm) top plate]. Both of these con-nections (heel joint and truss to top plate) were rigid. Vertical webmembers in the gable end trusses and overhang framing memberswere considered to be pinned at each end.
All members in the walls are pinned, including stud-to-plateconnections (at both ends) as well as plate-to-plate connectionsat the corners of the building. In this configuration, the wall framingprovides no lateral stiffness unless sheathing is present.
Stiffness of Hold-Downs and Anchor BoltsFoundation hold-down devices at the corners and anchor bolts[spaced 4 ft (1.2 m) on center] were used to fasten the external wallsto the foundation. The axial stiffness of the selected hold-downdevice, the HDU2 (Simpson Strong-Tie 2008), is 35;000 lb=in(6;125 N=mm), which takes into account fastener slip, hold-downelongation, and bolt elongation. The axial stiffness of the anchorbolts was determined using Seaders et al. (2009) study. The shearstiffness of the anchor bolts in the X and Y-direction was deter-mined using a procedure recommended by the American WoodCouncil [American Forest and Paper Association (AF&PA) 2007].Table 1 summarizes the spring stiffness values used in this study.Additional details relating to the derivation of these values are givenin Martin (2010).
Fig. 2. SAP model of the index building (exterior sheathing not shownfor clarity)
Fig. 3. Meshing of the wall sheathing in the gable ends; “generaldivide” was used for the triangular region above the top plate of thewall
136 / JOURNAL OF ARCHITECTURAL ENGINEERING © ASCE / DECEMBER 2011
J. Archit. Eng., 2011, 17(4): 134-143
Dow
nloa
ded
from
asc
elib
rary
.org
by
OR
EG
ON
ST
AT
E U
NIV
ER
SIT
Y o
n 06
/19/
17. C
opyr
ight
ASC
E. F
or p
erso
nal u
se o
nly;
all
righ
ts r
eser
ved.

Material PropertiesAll framing members were nominal 2 × 4-in: (51 × 102-mm)lumber. Frame elements, which represent the wall and truss mem-bers, were modeled using elastic, isotropic material properties. Ateach of the four corners, three studs were nailed together andmodeled as one frame element with an equivalent moment ofinertia. Framing around the opening (e.g., door) had a nominal2 × 12-in:(51 × 305-mm) header beam and double studs at bothends. The National (NDS) code (AF&PA 2005a) and the WoodHandbook (USDA 1999) were used to assign values. Additionaldetails are provided in Martin (2010).
Wall and roof sheathing were each modeled using SAP’s thickshell element. Orthotropic, elastic material properties (Tables 2and 3) were then assigned. Nine constants are needed to describethe behavior of these materials, although only the values shown inbold (Table 3) affect the response of the model. The values given inTables 2 and 3 were used for all wall and roof sections in the indexbuilding with one exception: the shear modulus, G12, of the wallsheathing that was modified using a correlation procedure de-scribed in Martin (2010). Table 4 provides the correlated shearmodulus values for the wall sheathing.
Research Methods
Verification/ValidationThe following studies from literature were used to validate themodel: (1) two-dimensional individual truss behavior (Wolfe et al.1986); (2) three-dimensional roof assembly behavior (Wolfeand McCarthy 1989); (3) two-dimensional shear wall behavior
(Langlois et al. 2004; Lebeda et al. 2005; Sinha and Gupta 2009);(4) three-dimensional influence functions of the entire building(Datin and Prevatt 2007). The geometry modifications listed wereexplored for the uniform uplift pressure load case only. Further in-formation pertaining to each scenario is provided in Martin (2010).
Load CasesThe following load cases were explored in support of this researcheffort. Further information pertaining to each scenario is providedin Martin (2010).1. Uniform uplift pressure [50 psf (2.4 kPa)];2. Simulated hurricane uplift pressures:
a. Load case 1—Absolute maximum uplift [90 psf (4.3 kPa)]at the corner of the roof;
b. Load case 2—Local maxima over entire roof [10–90 psf(0.5–4.3 kPa)];
c. Load case 3—Absolute maximum uplift [90 psf (4.3 kPa)]at the ridge of the roof;
3. ASCE 7-05 component and cladding (C&C) design pressures:a. Uplift acting alone [28–95 psf (1.3–4.6 kPa)];b. Lateral forces acting alone [32–38 psf (1.5–1.8 kPa)];c. Combination of uplift [28–95 psf (1.3–4.6 kPa)] and lateral
forces [32–38 psf (1.5–1.8 kPa)].
Geometry ScenariosThe following geometry variations were explored for the first loadcase noted in the preceding section (uniform uplift pressure):(1) standard building (control case); (2) changing the edge nailingof the wall sheathing; (3) adding length to the building; (4) presence
Table 3. Elastic Orthotropic Material Properties Used in the SAP Model
Description Modulus of elasticity (105 psi) Shear modulus (105 psi) Poisson’s ratiod
Item Type E1 E2 E3 G12 G13 G23 μ12 μ13 μ23
Wall sheathinga,b 7=16 in: (11 mm) OSB 7.4 2.3 2.3 1.2 1.2 1.2 0.08 0.08 0.08
Roof sheathingc 1=2 in: (13 mm) plywood 19 2.9 2.9 1.5 1.5 1.5 0.08 0.08 0.08aModulus of elasticity and shear modulus values from Doudak (2005).bShear modulus values subject to the correlation procedure (Table 4).cModulus of elasticity and shear modulus values from Wolfe and McCarthy (1989) and Kasal (1992).dPoisson’s ratio from Kasal (1992).
Table 2. Elastic Isotropic Material Properties Used in the SAP Model
Item Description
Modulus of elasticity, 106 psi (GPa) Poisson’s ratio
Value Source Value Source
Wall members Spruce-pine-fir, stud grade 1.2 (8.3) NDS (AF&PA 2005a) 0.40 Wood Handbook (USDA 1999)
Truss members Southern yellow pine, No.3 and stud 1.4 (9.7) 0.36
Table 1. Spring Stiffness Used to Model the Anchor Bolts and Hold-Downs
ItemX-direction shear,lb=in: (N=mm)
Y-direction shear,lb=in: (N=mm)
Z-direction axial,lb=in: (N=mm) Source
Hold-downs — — 35,000 (6,125) Simpson Strong-Tie (2008)
Anchor bolts 65,000 (11,375) 65,000 (11,375) 35,000 (6,125) AF&PA (2005) and Seaders (2004)
Table 4. Correlation between Nailing Schedule and the Shear Modulus G12 of the Shell Element in SAP
SheathingStud spacing,in. (mm)
MOE ofmembers (106 psi)
Required G12 in SAP [104 psi (MPa)]for each edge nail spacing
2-in.(51 mm)
3-in.(76 mm)
4-in.(102 mm)
6-in.(152 mm)
12-in.(305 mm)
7=16 in: (11 mm) OSB 16 or 24 (406 or 610) 1.2 to 1.6 9.43 (651) 6.38 (440) 4.86 (335) 3.34 (230) 1.81 (125)
JOURNAL OF ARCHITECTURAL ENGINEERING © ASCE / DECEMBER 2011 / 137
J. Archit. Eng., 2011, 17(4): 134-143
Dow
nloa
ded
from
asc
elib
rary
.org
by
OR
EG
ON
ST
AT
E U
NIV
ER
SIT
Y o
n 06
/19/
17. C
opyr
ight
ASC
E. F
or p
erso
nal u
se o
nly;
all
righ
ts r
eser
ved.

of doors in each wall; (5) gable wall missing (three-sided structure);(6) presence of roof blocking; (7) different overhang construction(ladder versus outlooker); (8) varying the anchor bolt spacing; and(9) removing anchor bolts at key locations. The standard buildinggeometry was used for the simulated hurricane uplift and theASCE 7-05 pressures.
Results and Discussion
Model Validation
A 4-step validation procedure, incorporating both 2D and 3Dbehavior, was used to ensure the accuracy of the SAP2000 model-ing techniques. First, a 2D individual truss comparison was con-ducted against Wolfe et al. (1986) to verify the assumptions ofpinned/rigid joint connectivity within the truss. Next, a 3D roofassembly (Wolfe and McCarthy 1989) verified the load sharingresponse of the model. Third, a 2D investigation using multiplesources (Langlois et al. 2004; Lebeda et al. 2005; Sinha and Gupta2009) was performed to establish the validity of the shear wallbehavior. Finally, the model of the index building itself was vali-dated against a 1=3-scale prototype tested by researchers at theUniversity of Florida (Datin and Prevatt 2007). The results of thismultipart verification process showed that the SAP2000 computermodel and the simplified modeling techniques adequately charac-terize the structural responses observed by physical testing. Detailspertaining to each verification step are provided in Martin (2010).
Correlation Model for Nailing Schedule of Sheathing
One of the primary objectives was to develop a practical means toincorporate the effect of edge nailing into the SAP model. Previousresearchers modeled fasteners individually using a set of “zero-length link elements” to represent each nail, and so changingthe nailing schedule required the laborious revision of the model,one nail at a time. Although this may be a reasonable approach forsubassembly models, (i.e. shear wall segments), it is simply notfeasible for complex full-size 3D structures.
For a given load value, the shear wall deflections predicted bythe NDS code (AF&PA 2005b) were compared with those pre-dicted by SAP2000 model. The NDS tabulates Ga values for differ-ent nailing schedules, allowing the predicted deflection of a shearwall to be computed at each possible edge nailing scenario. Thegoal then is to match the analytical model to each of these com-puted deflections by iteratively changing the shear modulus, G12,in SAP. When a value of G12 in SAP is found to give the samedeflection as predicted by the NDS equation, the correlation is com-plete for that particular nailing schedule. The process is repeated foreach possible nailing schedule, resulting in the correlations shownin Table 4. The correlated SAP model was compared with previ-ously published experimental results, and, as shown in Martin(2010), the correlated SAP model reasonably predicted the deflec-tion of the shear walls.
Table 4 presents the results of the correlation study relating theshear modulus for the shell element, G12, to the edge nail spacingfor each panel. The extent to which edge nailing affects diaphragmor shear wall stiffness is dependent on the presence of blocking.Unblocked systems, such as residential roof systems, are relativelyunaffected (in-plane unit shears) by changes in the edge nailing. Onthe other hand, blocked systems, such as residential wall systems(assuming the typical practice of placing OSB panels vertically), dorespond to changes in the nailing schedule. Therefore, this studyfocuses on the effect of edge nailing in the wall sheathing (i.e.,not the roof sheathing). Martin (2010) offers detailed explanations
of how these correlated values were determined and how the resultscompare with physical shear wall tests.
Uniform Uplift Pressure
In all of the analyses, vertical reactions at the hold-downs andanchor bolts were determined. Positive values represent uplift (ten-sion), whereas negative values represent downward forces (com-pression). Unless otherwise noted, the edge nailing for the wallsheathing used for all output results is 6 in. (152 mm) on center.
Standard Geometry (Control Case)Before altering the geometry, the standard index building wasloaded with a uniform uplift pressure to establish a control casewith which all other arrangements could be compared. As ex-pected, the building response was symmetric. The gable walls, orend walls, show a load intensity (i.e., spike) directly beneath thepeak of the roof (see Fig. 4). This results from load accumulatingin the roof structure, delivered via the ridgeline to the anchor boltdirectly below it (see Fig. 5). In Fig. 5, the von Mises stresses in theshell element are displayed. The von Mises stress is a convenientmethod of combining the stresses (normal and shear) that act in allthree directions (X, Y , and Z) into a single parameter, called theequivalent stress or von Mises stress. Doing so highlights the ac-cumulation of load at the ridge and the subsequent concentration inthe gable wall directly beneath it. For the edge nailing shown(6 in.), the load is not evenly distributed by the gable wall, anda spike in load intensity is witnessed at the anchor bolt directlybelow the ridge.
The side walls, or eave walls, display a parabolic reaction profile(see Fig. 6). The side wall experiences the highest reactions of alllocations in the building, with the maximum occurring in themiddle. In this location, load originating in the roof structure is
1200
1250
1300
1350
1400
1450
1500
1550
1600
1650
1700
4 52 58 64 70 76 82 88 5Joint ID (for near side)
Rea
ctio
n (
lbs)
Fig. 4. Reaction profile for the gable wall, uniform uplift pressure
Fig. 5. Load accumulation in the gable end below the ridge of the roof
138 / JOURNAL OF ARCHITECTURAL ENGINEERING © ASCE / DECEMBER 2011
J. Archit. Eng., 2011, 17(4): 134-143
Dow
nloa
ded
from
asc
elib
rary
.org
by
OR
EG
ON
ST
AT
E U
NIV
ER
SIT
Y o
n 06
/19/
17. C
opyr
ight
ASC
E. F
or p
erso
nal u
se o
nly;
all
righ
ts r
eser
ved.

not effectively transferred to the end walls and is, in essence, forcedto the side walls. The practical implication of this finding is that ananchor bolt located in the side wall carries more load than onelocated in the end wall—even below the ridge line.
Effect of Edge NailingAs the edge nailing gets denser, the wall becomes stiffer andcapable of distributing the roof loads more evenly to the founda-tion. In looking at the 2-in. (51-mm) edge nailing reaction profilefor the gable end (Fig. 7), it can be seen that the seven interioranchor bolts each carry approximately the same vertical load[about 1,400 to 1,500 lbs (6.2 to 6.7 kN)]. In comparison, the12-in. (305-mm) nailing option produces nearly six times as muchvariation in anchor bolt loads [1,200 to 1,800 lbs (5.3 to 8.0 kN)]for the same uniform roof pressure. In other words, the less rigidwall is incapable of evenly distributing the roof loads, and elevatedload intensities occur. A similar trend is observed in the side walls,where the more rigid 2-in. edge nailed wall more evenly distributesroof load among interior anchor bolts (Fig. 8). However, the redis-tribution of force in the side wall is less than the gable wall, prob-ably because of the rigid gable end truss (acting more like a wall),which is able to transfer load more evenly to the gable walls than toside walls.
Effect of Door OpeningsDoor in End Wall: A 16-ft (4.9-m) opening representing a typicaloverhead garage door was located in the center of the end wall toexamine its effect. As expected, the anchorage devices at either sideof the opening carry more load (Fig. 9); however, the total upliftload carried by the gable wall is reduced by 14%, [from 12,987 lbs
(57.8 kN) with nine reactions to 12,063 lbs (53.7 kN) with six]. Themissing 924 lbs (4.1 kN) is shed to the side wall over the first half ofthe building, as can be seen in Fig. 10. There is no change in thereaction profile for the opposite gable wall, the one without thedoor. The significance of this finding is made clear when the dooris placed in the side wall instead of the end wall (see Fig. 11).
Door in Side Wall: A similar 16-ft (4.9-m) door opening waspositioned in the center of the side wall, (no door in the gableend walls). In this scenario, the opening creates very large load am-plifications in the reaction profile of the side wall with opening(Fig. 11). The anchor bolt reactions at the sides of the opening
1600
1800
2000
2200
2400
2600
2800
3000
5 142 148 154 160 166 172 178 184 190 92Joint ID (for near side)
Rea
ctio
n (
lbs)
Fig. 6. Reaction profile for the side wall, uniform uplift pressure
1100
1200
1300
1400
1500
1600
1700
1800
4 52 58 64 70 76 82 88 5Joint ID
Rea
ctio
n (
lbs)
2"
3"
4"
6"
12"
Fig. 7. Effect of edge nailing for the gable wall, uniform uplift pressure
1500
1700
1900
2100
2300
2500
2700
2900
5 142 148 154 160 166 172 178 184 190 92Joint ID
Rea
ctio
n (
lbs)
2"3"4"6"12"
Fig. 8. Effect of edge nailing for the side wall, uniform uplift pressure
0
500
1000
1500
2000
2500
4 52 58 64 70 76 82 88 5Joint ID (for near wall)
Rea
ctio
n (
lbs)
Near (with door)
Far (no door)
Building without doors
Fig. 9.Reaction profile for the end walls with a door in the center of thenear side gable wall
1500
1700
1900
2100
2300
2500
2700
2900
3100
5 142 148 154 160 166 172 178 184 190 92Joint ID (for near wall)
Rea
ctio
n (
lbs)
Side walls (symmetric)
Building without doors
Fig. 10. Reaction profile for the side walls with a door in the center ofthe near side gable wall
JOURNAL OF ARCHITECTURAL ENGINEERING © ASCE / DECEMBER 2011 / 139
J. Archit. Eng., 2011, 17(4): 134-143
Dow
nloa
ded
from
asc
elib
rary
.org
by
OR
EG
ON
ST
AT
E U
NIV
ER
SIT
Y o
n 06
/19/
17. C
opyr
ight
ASC
E. F
or p
erso
nal u
se o
nly;
all
righ
ts r
eser
ved.

nearly doubled the uplift reaction for the case of the side wall with-out an opening. Despite this amplification, the side wall carriesreduced total load than the side wall without opening [a 908 lbs(4.0 kN) (or 29%) reduction in total vertical load]. The balanceof the load is not carried by the opposite wall as might be expected,but instead it is shed evenly to the gable end walls. Further, the farside wall (Fig. 11) also carries less total load compared with thedoor opening present in the near side wall. This interesting systemeffect is attributable to the orientation of the trusses, perpendicularto the side walls. A reduction in stiffness in the front side wall (i.e.,the presence of a door) produces a corresponding stiffness reduc-tion in the far side wall. The flexibility introduced by the presenceof the door affects the trusses directly atop the opening. The trusseslocated above or near the door opening have reduced stiffness andtherefore carry less load, even though no opening is present in thefar side wall. In summary, the sidewalls shed 1,778 lbs (7.9 kN) tothe two gable end walls when a 16-ft (4.9-m) opening is located inone side wall. This load is shared evenly between the end walls,resulting in an 889 lbs (4.0 kN) increase in load, distributed evenlyamong the anchorage devices there.
The load-carrying capacity of the far side wall, the one withoutthe door, is highly dependent on the size of the header beam used tospan the door opening and the presence of a ceiling (Martin 2010).As the header depth increases, the opening becomes more rigid andthus is capable of carrying more load. However, very little of thisadditional load-carrying capacity is realized in the front side wallwith a door opening. For example, the total front (with opening)side wall reaction only increases by 2% when the header depthis doubled [from 12 to 24 in. (305 to 610 mm)]. However, a differ-ent story unfolds on the far side wall, where the total reaction ofthe five anchor bolts corresponding to the door opening location,increased by about 14% [from 11,654 to 13,248 lbs (51.9 to58.9 kN)].
A similar effect is observed when a ceiling [1=2-in. gypsum wallboard (GWB) in this case] is included in the 3D structural model.The total vertical reaction capacity of this building geometry is in-creased, with very little change in total reaction in front side wall(with opening), and a significant increase in capacity in the far sidewall (without opening) (Martin 2010). The 1=2-in. (12-mm) GWBceiling is as effective in attracting loads to the far side wall as isthe extremely deep (24-in.) header. The additional load-carryingcapability comes from the increase in stiffness that the ceilingprovides.
In summary, the presence of a door opening centered in the sidewall always results in an increase in the load carried by the(perpendicular) gable end walls. More flexible headers cause the
side walls to shed more load to the gable end walls than occurswith stiffer headers. The effect of several additional geometricscenarios studied are discussed in Martin (2010).
Simulated Hurricane Uplift Pressures
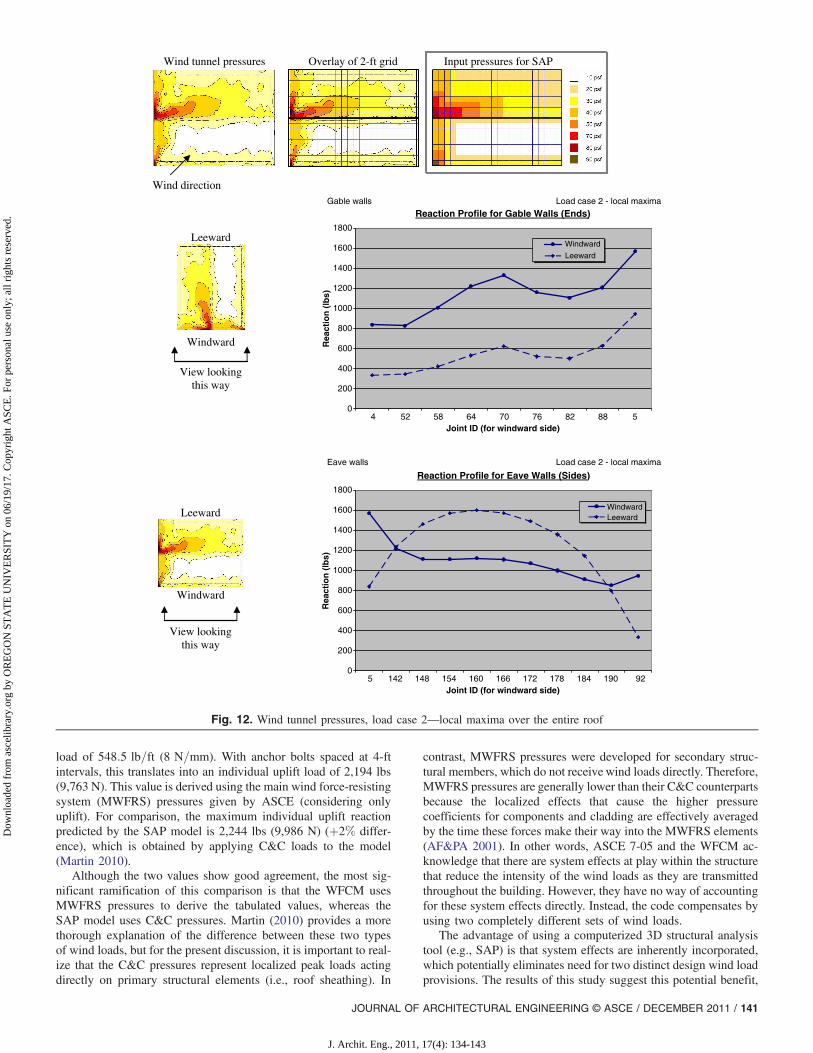
The simulated hurricane uplift pressures were determined from awind tunnel study on a 1∶50 scale model of the house (Datinand Prevatt (2007). Three hundred and eighty-six pressure taps in-stalled on the roof provided pressure-coefficient time histories thatwere used to develop pressure distributions for five incident windazimuths of 0, 45, 90, 135, and 180°. The pressure coefficients con-verted to full-scale pressures [normalized by a 3-s gust design windspeed of 130 mi=h (58 m=s) in open terrain exposure], for com-parison with ASCE 7-05 design values. The 45° wind azimuth pro-duced the highest pressures on the roof out of the five winddirections tested in the wind tunnel. The vertical reactions to localmaxima pressures distributed over the roof (for wind azimuth 45°)are reported in the next section. The discussions on two additionalload cases are provided in Martin (2010). Fig. 12 shows the reac-tion profile attributable to local maxima uplift pressures for windazimuth 45°, using 6-in. (152-mm) on center edge nailing of thewall sheathing. Positive values represent uplift, for both appliedpressure and observed reactions.
The reaction profiles of the gable end walls behave as expected,with the windward wall experiencing more uplift than the leewardwall. The leeward side wall experiences the highest uplift becausethe leeward roof area carries greater pressure. There is a significantdrop in the uplift reaction in the leeward side wall (dashed line).This occurs because a net lateral force “racks” the structure towardthe leeward corner of the building. The lateral forces arise becauseof the unbalanced horizontal component of the uplift pressures,which are oriented normal to the sloped roof surfaces.
ASCE 7-05 Pressures
Three scenarios were considered with the ASCE 7-05 pressures:(1) vertical component of uplift acting alone, (2) horizontal com-ponent of uplift pressures acting alone, and (3) a resultant upliftpressures (horizontal and vertical components). The results of sce-narios 2 and 3 are provided in Martin (2010). Case 1 is discussed inthis section and is compared with simulated hurricane loads, asshown in Fig. 13. The general shape of the reaction profiles is sim-ilar to that which was witnessed for the uniform pressure scenarios(Fig. 4). The magnitude of the reaction values is slightly different,though, because the applied load is not identical to the uniformpressure cases.
It is of particular importance to determine whether or not thecode-based design loads (ASCE 7-05) adequately address the sus-tained effects from extreme wind events such as hurricanes. Thecurrent study offers a unique insight into this area of interest.The uplift reactions predicted by the SAP model are comparedamong the three simulated hurricane load scenarios and theASCE 7-05 uplift-only scenario (Fig. 13). It can be seen that thecurrent code procedure satisfactorily encompasses the foundationload results collected using the three hurricane simulations.
SAP versus Wood Frame Construction Manual
In addition to the numerous validations already noted, the resultsfrom the SAP model can also be compared with values tabulated inthe Wood Frame Construction Manual (WFCM) published by theAmerican Forest and Paper Association (2001). The most notewor-thy comparison comes from Table 2.2A in the WFCM, whereinuplift connection loads are tabulated at different wind speeds. Tomake a direct comparison to SAP, no dead load is assumed to actwithin the building. Thus, the WFCM gives an uplift connection
0
500
1000
1500
2000
2500
3000
3500
4000
4500
5000
5 142 148 154 160 166 172 178 184 190 92Joint ID (for near wall)
Rea
ctio
n (
lbs)
Near wall (with door)Far wall (no door)Building without doors
Fig. 11. Reaction profile for the side walls when a door is centered inthe near side wall
140 / JOURNAL OF ARCHITECTURAL ENGINEERING © ASCE / DECEMBER 2011
J. Archit. Eng., 2011, 17(4): 134-143
Dow
nloa
ded
from
asc
elib
rary
.org
by
OR
EG
ON
ST
AT
E U
NIV
ER
SIT
Y o
n 06
/19/
17. C
opyr
ight
ASC
E. F
or p
erso
nal u
se o
nly;
all
righ
ts r
eser
ved.
load of 548:5 lb=ft (8 N=mm). With anchor bolts spaced at 4-ftintervals, this translates into an individual uplift load of 2,194 lbs(9,763 N). This value is derived using the main wind force-resistingsystem (MWFRS) pressures given by ASCE (considering onlyuplift). For comparison, the maximum individual uplift reactionpredicted by the SAP model is 2,244 lbs (9,986 N) (þ2% differ-ence), which is obtained by applying C&C loads to the model(Martin 2010).
Although the two values show good agreement, the most sig-nificant ramification of this comparison is that the WFCM usesMWFRS pressures to derive the tabulated values, whereas theSAP model uses C&C pressures. Martin (2010) provides a morethorough explanation of the difference between these two typesof wind loads, but for the present discussion, it is important to real-ize that the C&C pressures represent localized peak loads actingdirectly on primary structural elements (i.e., roof sheathing). In
contrast, MWFRS pressures were developed for secondary struc-tural members, which do not receive wind loads directly. Therefore,MWFRS pressures are generally lower than their C&C counterpartsbecause the localized effects that cause the higher pressurecoefficients for components and cladding are effectively averagedby the time these forces make their way into the MWFRS elements(AF&PA 2001). In other words, ASCE 7-05 and the WFCM ac-knowledge that there are system effects at play within the structurethat reduce the intensity of the wind loads as they are transmittedthroughout the building. However, they have no way of accountingfor these system effects directly. Instead, the code compensates byusing two completely different sets of wind loads.
The advantage of using a computerized 3D structural analysistool (e.g., SAP) is that system effects are inherently incorporated,which potentially eliminates need for two distinct design wind loadprovisions. The results of this study suggest this potential benefit,
Wind tunnel pressures Overlay of 2-ft grid Input pressures for SAP
Wind direction
Reaction Profile for Gable Walls (Ends)
0
200
400
600
800
1000
1200
1400
1600
1800
4 52 58 64 70 76 82 88 5Joint ID (for windward side)
Rea
ctio
n (
lbs)
Windward
Leeward
Gable walls
Leeward
Windward
View looking this way
Reaction Profile for Eave Walls (Sides)
0
200
400
600
800
1000
1200
1400
1600
1800
5 142 148 154 160 166 172 178 184 190 92Joint ID (for windward side)
Rea
ctio
n (
lbs)
WindwardLeeward
Eave walls Load case 2 - local maxima
Load case 2 - local maxima
Leeward
Windward
View looking this way
Fig. 12. Wind tunnel pressures, load case 2—local maxima over the entire roof
JOURNAL OF ARCHITECTURAL ENGINEERING © ASCE / DECEMBER 2011 / 141
J. Archit. Eng., 2011, 17(4): 134-143
Dow
nloa
ded
from
asc
elib
rary
.org
by
OR
EG
ON
ST
AT
E U
NIV
ER
SIT
Y o
n 06
/19/
17. C
opyr
ight
ASC
E. F
or p
erso
nal u
se o
nly;
all
righ
ts r
eser
ved.

observing that despite applying component and cladding pressuresto the primary structural system (i.e., sheathing), the program’soutput for foundation-level forces are nearly identical to (within2% of) the forces predicted by the MWFRS design provisions.However, further study for different building geometries and loadlocations will be needed to determine whether this finding is uni-versally applicable for all (or a specific class of) low-rise buildings.
Conclusions
The following conclusions are formed on the basis of research con-ducted in support of this project and, therefore, pertain only to thespecific load cases previously described.1. The 3D computer model and techniques developed within this
research effort successfully predicted the behavior of complex,three-dimensional, wood-framed structures subjected to winduplift pressure.
2. A novel correlation procedure and modeling technique devel-oped simplifies modeling procedures for blocked edge woodshear walls by eliminating the need for including individualfasteners in the analytical model. Thus, a simple thick shellelement with mesh-generated subelements can be used to mod-el a complete wall or roof surface. The adjustments in nailingschedule are applied by changing a single parameter, the G12bulk modulus.
3. Near the ends of the building, load accumulates at the ridgelineof the roof and is transferred to the gable walls directly belowthe roof peak.
4. When subjected to uniform uplift loads, anchor bolts located inthe side walls experience the highest uplift reactions.
5. The wall edge nailing density strongly influences the ability ofthe walls to share roof-level loads.
6. The addition of a large door opening to any wall results in aloss of load carried by the entire wall.
7. The extent to which a variation in the geometry (e.g., thepresence of an opening) on one side of the building affectsthe opposite side of the building is highly dependent on theorientation of the trusses.
8. ASCE 7-05 component and cladding pressures adequately pre-dict the expected uplift loads from extreme wind events such ashurricanes. The uplift reactions predicted by the SAP modelwhen loaded with the ASCE 7-05 C&C pressures (uplift only)fully encompass those of the simulated hurricane events at thesame basic wind speed.
9. The analytical model developed in this study accurately pre-dicted the MWFRS uplift forces at the foundation level whenusing ASCE 7-05 component and cladding pressures appliedto the roof. To account for system effects, foundation-levelforces are conventionally computed using the MWFRS setof wind loads from ASCE 7-05. The results suggest a singleset of wind design provisions may be suitable for designing astructure using the 3D structural model of the building.
Acknowledgments
Funding provided by NSF (Award No. CMMI 0800023)and USDA Center for Wood Utilization research grant is greatlyappreciated.
References
American Forest and Paper Association (AF&PA). (2001). “Wood frameconstruction manual.” ANSI/AF&PA WFMC-2001, Washington, DC.
American Forest and Paper Association (AF&PA). (2005a). “Nationaldesign specification for wood construction.” ANSI/AF&PA NDS-2005,Washington, DC.
American Forest and Paper Association (AF&PA). (2005b). “Specialdesign provisions for wind and seismic.” ANSI/AF&PA SDPWS-2005,Washington, DC.
American Forest and Paper Association (AF&PA). (2007). “Connectiondesign.” DES110, Washington, DC.
ASCE. (2005). “Minimum design loads for buildings and other structures.”ASCE/SEI 7-05, New York.
Asiz, A., Chui, C. Y., Smith, I., and Bartlett, M. (2010a). “Full-scaledestructive test on wood lightframe structures.” World Conf. on TimberEngineering (CD-ROM), CNR-IVALSA, Trees and Timber Institute,Florence, Italy.
Reaction Profile for Gable Walls
0
200
400
600
800
1000
1200
1400
1600
1800
2000
4 52 58 64 70 76 82 88 5Joint ID
Rea
ctio
n (
lbs)
ASCE 7-05 Uplift-only
Wind tunnel - 1
Wind tunnel - 2
Wind tunnel - 3
Gable walls All load cases
Dashed line
View looking this way
Solid line
Fig. 13. Comparison between uplift reactions using ASCE 7-05 and those predicted by the simulated hurricane events; the solid line represents thewindward end wall, and the dashed line signifies the opposite, leeward end
142 / JOURNAL OF ARCHITECTURAL ENGINEERING © ASCE / DECEMBER 2011
J. Archit. Eng., 2011, 17(4): 134-143
Dow
nloa
ded
from
asc
elib
rary
.org
by
OR
EG
ON
ST
AT
E U
NIV
ER
SIT
Y o
n 06
/19/
17. C
opyr
ight
ASC
E. F
or p
erso
nal u
se o
nly;
all
righ
ts r
eser
ved.

Asiz, A., Chui, C. Y., Zhou, L., and Smith, I. (2010b). “Three-dimensionalnumerical model of progressive failure in wood light-frame buildings.”World Conf. on Timber Engineering (CD-ROM), Riva del Garda, Italy.
Computers and Structures, Inc. (2008). CSI Analysis Reference Manual:SAP2000, ETABS and SAFE, Berkeley, CA.
Datin, P. L., and Prevatt, D. O. (2007). “Wind uplift reactions at roof-to-wall connections of wood-framed gable roof assembly.” 12th Int. WindEngineering Conf., Australasian Wind Engineering Society, Cairns,Australia.
Dikkers, R. D., Marshall, R. D., and Thom, H. C. S. (1970). HurricaneCamille—August 1969: A survey of structural damage along theMississippi Gulf Coast, National Bureau of Standards, Washington,DC.
Doudak, G. (2005). “Field determination and modeling of load paths inwood light-frame structures.” Ph.D. thesis, McGill Univ., Montreal,Quebec, Canada.
FEMA. (2006). Hurricane Katrina in the Gulf Coast: Mitigation assess-ment team report—Building performance observations, recommenda-tions, and technical guidance, Washington, DC.
Gupta, R. (2005). “System behavior of wood truss assemblies.” Prog.Struct. Eng. Mater., 7(4), 183–193.
Gupta, R., and Limkatanyoo, P. (2008). “Practical approach to designingwood roof truss assemblies.” Pract. Period. Struct. Des. Constr., 13(3),135–146.
Gupta, R., Miller, T. H., and Dung, D. (2004). “Practical solution to woodtruss assembly design problems.” Pract. Period. Struct. Des. Constr.,9(1), 54–60.
Hill, K. M., Datin, P. L., and Prevatt, D. O. (2009). “Revisiting wind uplifttesting of wood roof sheathing—Interpretation of static and dynamictest results.” Hurricane Hugo 20th Anniversary Symp. on BuildingSafer Communities—Improving Disaster Resilience, Applied Technol-ogy Council, Redwood City, CA.
Kasal, B. (1992). “A nonlinear three-dimensional finite-element model ofa light-frame structure.” Ph.D. thesis, Oregon State Univ., Corvallis,OR.
LaFave, K. D., and Itani, R. Y. (1992). “Comprehensive load distributionmodel for wood truss roof assemblies.” Wood Fiber Sci., 24(1), 79–88.
Langlois, J., Gupta, R., and Miller, T. H. (2004). “Effects of reference dis-placement and damage accumulation in wood shear walls.” J. Struct.Eng., 130(3), 470–479.
Lebeda, D., Gupta, R., Rosowsky, D., and Dolan, J. D. (2005). “The effectof hold-down misplacement on the strength and stiffness of wood shearwalls.” Pract. Period. Struct. Des. Constr., 10(2), 79–87.
Li, Z., Gupta, R., and Miller, T. H. (1998). “Practical approach to modelingof wood truss roof assemblies.” Pract. Period. Struct. Des. Constr.,3(3), 119–124.
Martin, K. G. (2010). “Evaluation of system effects and structural load
paths in a wood-frame building.” M.S. thesis, Oregon State Univ., Cor-vallis, OR, ⟨http://ir.library.oregonstate.edu/jspui/handle/1957/14312⟩.
McCutcheon, W. J. (1977). “Method for predicting the stiffness ofwood-joist floor systems with partial composite action.” FPL-RP-289,Forest Products Laboratory, Madison, WI.
Mtenga, P. V. (1991). “Reliability of light-frame wood roof systems.”Ph.D. thesis, Univ. of Wisconsin—Madison, Madison, WI.
Percival, D. H., and Comus, Q. B. (1980). “Load distribution in a full-scalenailed-glued hip-roof system.” For. Prod. J., 30(11), 17–21.
Reed, T. D., Rosowsky, D. V., and Schiff, S. D. (1997). “Uplift capacityof light-frame rafter to top plate connections.” J. Archit. Eng., 3(4),156–163.
Riley, M. A., and Sadek, F. (2003). Experimental testing of roof to wallconnections in wood frame houses, National Institute of Standardsand Technology, Gaithersburg, MD.
Seaders, P. (2004). “Performance of partially and fully anchored woodframe shear walls under monotonic, cyclic, and earthquake loads.”M.S. thesis, Oregon State Univ., Corvallis, OR.
Seaders, P., Gupta, R., and Miller, T. H. (2009). “Monotonic and cyclic loadtesting of partially and fully-anchored wood-frame shear walls.” WoodFiber Sci., 41(2), 145–156.
Simpson Strong-Tie Company, Inc. (2008). “Wood construction connec-tors.” C-2009 Product Catalog, Pleasanton, CA.
Sinha, A., and Gupta, R. (2009). “Strain distribution in OSB and GWB inwood-frame shear walls.” J. Struct. Eng., 135(6), 666–675.
Sutt, E. G., Jr. (2000). “The effect of combined shear and uplift forces onroof sheathing panels.” Ph.D. dissertation, Clemson Univ., Clemson,SC.
Taly, N. (2003). Loads and load paths in buildings: Principles of structuraldesign, International Code Council, Inc., Washington, DC.
USDA. (1999). “Wood handbook: Wood as an engineering material.”USDA Forest Service FPL-GTR-113, Forest Products Laboratory,Madison, WI.
van de Lindt, J. W., Graettinger, A., Gupta, R., Skaggs, T., Pryor, S., andFridley, K. (2007). “Performance of woodframe structures duringHurricane Katrina.” J. Perform. Constr. Facil., 21(2), 108–116.
Wolfe, R. W., and LaBissoniere, T. (1991). “Structural performanceof light-frame roof assemblies II. Conventional truss assemblies.”FPL-RP-499, Forest Products Laboratory, Madison, WI.
Wolfe, R. W., and McCarthy, M. (1989). “Structural performance oflight-frame roof assemblies: I. Truss assemblies with high truss stiffnessvariability.” FPL-RP-492, Forest Products Laboratory, Madison, WI.
Wolfe, R. W., Percival, D. H., and Moody, R. C. (1986). “Strength andstiffness of light framed sloped trusses.” FPL-RP-471, Forest ProductsLaboratory, Madison, WI.
Zisis, I. (2006). “Structural monitoring and wind tunnel studies of a lowwooden building.” M.S. thesis, Concordia Univ., Montreal, Canada.
JOURNAL OF ARCHITECTURAL ENGINEERING © ASCE / DECEMBER 2011 / 143
J. Archit. Eng., 2011, 17(4): 134-143
Dow
nloa
ded
from
asc
elib
rary
.org
by
OR
EG
ON
ST
AT
E U
NIV
ER
SIT
Y o
n 06
/19/
17. C
opyr
ight
ASC
E. F
or p
erso
nal u
se o
nly;
all
righ
ts r
eser
ved.