Embed Size (px)
Citation preview

Journal of The Electrochemical Society, 155 �10� B1066-B1076 �2008�B1066
Modeling the Dynamic Water Transport in the Porous Layersof PEM Fuel Cells Based on Numerical UpscalingJulia Hermanna and Christoph Zieglerb,z
aFraunhofer Institute for Solar Energy Systems, 79110 Freiburg, GermanybUniversity of Freiburg, 79110 Freiburg, Germany
A one-dimensional two-phase model is developed to study the dynamic water transport in the porous layers of polymer electrolytemembrane �PEM� fuel cells. Liquid water transport and diffusion of oxygen are described by a coupled differential equationsystem. Capillary pressure, relative permeability, and oxygen diffusivity are determined based on the results of microstructuralsimulations. The model is compared quantitatively to two different chronoamperometric experiments, potential step voltammetry,and sine wave testing, whereby the optimization algorithm of Nelder and Mead is used. The model predicts the measured dynamiccurrent behavior for both experiments. As a result of the optimization, important two-phase and material parameters are extracted.© 2008 The Electrochemical Society. �DOI: 10.1149/1.2957487� All rights reserved.
Manuscript submitted February 27, 2008; revised manuscript received June 17, 2008. Published August 25, 2008.
0013-4651/2008/155�10�/B1066/11/$23.00 © The Electrochemical Society
The fuel cell is attracting increasing attention as an importantenergy converter, because it is quiet, nonpolluting, and energy effi-cient. Polymer electrolyte membrane �PEM� fuel cells use hydrogenand air to convert chemical energy directly into electricity, produc-ing only water and heat as by-products. The oxygen reduction reac-tion �ORR� takes place in the catalyst layer of the cathode. Protonsresulting from the hydrogen oxidation reaction in the anode migratethrough the membrane to the cathode and react with oxygen to pro-duce water and heat. A porous gas diffusion layer �GDL� is locatedon each electrode between the flow field and catalyst layer to dis-tribute the reactants evenly.
The optimization of fuel cells requires a broad understanding ofthe underlying physical processes. Currently, a significant limitationof the fuel cell performance at high current densities originates inthe blockage of the pores of the GDL by liquid water, which con-strains the reactant transport to the catalyst layers. This process isknown as mass transport limitation. Modeling the two-phase trans-port in the porous layers of PEM fuel cells provides a basis forunderstanding this process and makes systematic material designpossible. A crucial task related to the two-phase modeling is theparametrization of saturation-dependent quantities such as capillarypressure and relative permeability of liquid water.
Various approaches exist to describe the liquid water transportand mass transport limitation phenomena in the porous layers ofPEM fuel cells. A detailed discussion of fundamental fuel cell mod-els including works on transient phenomena prior to 2004 can befound in Ref. 1. Pasaogullari and Wang2 derived a one-dimensionalanalytical solution for the liquid water transport across the GDL inboth hydrophobic and hydrophilic gas diffusion media by using thegradient of the capillary pressure. In addition, they studied the in-fluence of the GDL wettability on the liquid water transport in de-tail. In Ref. 3, Pasaogullari and Wang evaluated the degree of ap-proximation of the unsaturated flow theory �UFT� by using themultiphase mixture model. In UFT, a constant gas pressure is as-sumed, and the capillary pressure gradient corresponds to the nega-tive liquid water pressure gradient. Nam and Kaviany4 published aone-dimensional model to describe the liquid water transport in theGDL and an adjacent microporous layer �MPL�, using the UFT.They concluded that by creating a saturation step at the interfacebetween the GDL and MPL, the cell performance is improved.Wang et al.5 developed a two-dimensional two-phase model of aPEM fuel cell. A threshold current density was defined correspond-ing to the first appearance of liquid water at the membrane–cathodeinterface. Hence, single-phase and two-phase regimes both exist inthe cathode. In the two-phase model of Birgersson et al.,6 wheremass, heat, and charge transport are described for the complete PEMfuel cell, the simulation is carried out for two different expressions
z E-mail: [email protected]
Downloaded 06 Oct 2008 to 132.230.122.36. Redistribution subject to E
of the capillary pressure, one based on the Leverett function, andone defined by Natarajan and Nguyen.7 The former one leads to amuch higher liquid water saturation in the fuel cell, causing partialflooding in the active layer of the cathode. Birgersson et al. alsocarried out a scale analysis by nondimensionalizing the governingequations to determine the relative importance of various transportmechanisms. As one result, the convection of species in the cathodeis negligible compared to the diffusion, when a flow field withoutinduced forced flow is used. This corresponds to the UFT, where thegradient of the gas pressure is set to zero. In contrast to the publi-cations named above, the two-phase models of Ref.8-12 have beenvalidated by comparing the simulation results to experimental data,given by steady-state polarization curves. You and Liu8 investigatedthe threshold current density at which two-phase flow is formed andfound that it depends on the characteristics of the gas diffusionmaterial. In the two-phase cathode model of Rao et al.,11 the relativepermeability of liquid water and the derivative of the capillary pres-sure with respect to the liquid water saturation are regarded as con-stant. Acosta et al.12 developed a two-dimensional two-phase modelof the cathode, where the capillary pressure and the relative perme-ability of water were determined experimentally by using mercuryintrusion porosimetry, assuming a hydrophobic GDL. However, de-viations between simulation data and measured polarization curvesat high fuel cell loads showed that a more detailed consideration ofthe partially hydrophilic behavior of the GDL is necessary.
The above-mentioned studies investigate only the cell steady-state behavior, while for many applications of fuel cells, such as inautomobiles, their dynamic performance is important, given therapid change of the operating conditions with time. Dynamic modelsdescribing the liquid water transport in the porous layers of PEMfuel cells have been published in Ref. 7 and 13-16. Ziegler et al.13
developed a two-phase PEM fuel cell model, which was used tosimulate cyclic voltammograms. In the one-dimensional cathodeGDL model of Song et al.,14 the time needed to reach steady-statewater saturation was examined and plotted against various modelparameters such as the contact angle of the GDL. The two-phasemodel of Meng15 considered the effects of the liquid water transporton the dynamic response of a PEM fuel cell to a sudden change ofthe cell potential. It was found that under isothermal conditions, thepresence of liquid water in the porous media increases the currentovershot and undershot. Wang and Wang16 considered the fuel celldynamics under both fully humidified and underhumidified condi-tions using a three-dimensional model. They found that in underhu-midified situations there is simultaneous presence of a single-phaseregion and a two-phase zone, whereas the interface between the twois a moving boundary. Natarajan and Nguyen7 determined that theperformance of the cathode is highly dependent on the dynamics ofthe liquid water transport. Their simulation results showed that theliquid water transport is the slowest mass transfer and mainly re-sponsible for the mass transport limitation phenomena. By fitting thetwo-phase model to experimental data, the capillary-saturation ex-
CS license or copyright; see http://www.ecsdl.org/terms_use.jsp

B1067Journal of The Electrochemical Society, 155 �10� B1066-B1076 �2008� B1067
pression was obtained. The model was validated by comparing thesimulation results to a measured steady-state polarization curve.However, because fuel cells cannot be operated at steady state with-out adjustment control in the two-phase regime, model validationwith dynamic experimental data is necessary for transient models.
In all above-mentioned publications, except for Ref. 6, 7, and 11,the Leverett function, in a form suggested by Udell,17 is used todescribe the capillary pressure–saturation relationship. For the rela-tive permeability, an expression due to Wang18 is used in all publi-cations except for Ref. 7, 11, and 12. Both the Leverett and Wangexpressions are empirical correlations obtained by investigations onsoil tests. As the structure of the porous layers in PEM fuel cells isdifferent from that of soil tests, it is a crucial task to adapt theseempirical expressions for application to PEM fuel cells.
In this paper, a one-dimensional dynamic model of the poroustransport layers of a PEM fuel cell at the cathode side is developed.Liquid water transport and oxygen diffusion are described by a par-tial differential equation system. Due to the coupling of the twotransport mechanisms, mass-transport limitation phenomena occur-ring at high current densities can be expressed by the model. Cap-illary pressure, relative permeability, and oxygen diffusivity are de-termined by analyzing microstructural simulation data obtained byBecker et al.19 The ORR in the cathode catalyst layer is described byboundary conditions using Tafel kinetics. The model represents asimplified approach to the description of mass-transport limitationwith the benefit that problems of simulation times and parameteridentification are minimized. The model is compared quantitativelyto chronoamperometric measurements. The optimization algorithmof Nelder and Mead is used to fit the simulation results to the ex-perimental data and extract model parameters.
Modeling and Simulation
Model equations.— Figure 1 shows the two one-dimensionalgeometrical configurations for which the model is solved. Figure 1ais the configuration across the GDL on the cathode side, Fig. 1bacross a combination of GDL and MPL. The boundary ��c de-scribes the cathode side; ��ch is the boundary to the gas channels ofthe fuel cell. The boundary between GDL and MPL in Fig. 1b isdenoted as ��in.
The transport of liquid water in a porous medium is described byEq. 1, using the liquid water saturation sl
���l�sl
�t+ � � ��lvl� = 0 with � = GDL,MPL �1�
�l = −1
�lkrel,lKint,��pl �2�
In Eq. 1, no phase change of water is considered. �l, �l, and pl arethe liquid water density, viscosity, and pressure. The saturation-
Figure 1. Geometrical configurations. �a� GDL, �b� GDL + MPL.
Downloaded 06 Oct 2008 to 132.230.122.36. Redistribution subject to E
dependent relative permeability of liquid water is termed krel,l. Thematerial properties of layer � are given by the porosity �� and theintrinsic permeability Kint,�. According to the UFT �see Ref. 3�, thegradient of the gas pressure �pg in the porous transport layers is setto zero. This yields for the gradient of the liquid water pressure
�pl = �pg − �pc = − �pc �3�
where pc is the saturation-dependent capillary pressure.The transport of oxygen is described by the Fickian diffusion
equation
���O2
�yO2
�t− � � ��O2
DO2�yO2
� = 0 �4�
where yO2and �O2
are the volume fraction and the density of oxy-gen. DO2
is the saturation-dependent diffusivity of oxygen.For all simulations, the initial value of yO2
is set to
yO2
0 = 0.21 �5�
The initial value of sl is adjusted individually for each simulation toachieve good convergence. The respective values are given in thefollowing sections.
If the GDL only is modeled �Fig. 1a�, two boundary conditionsfor each of the variables sl and yO2
are needed. At the boundary tothe gas channel, ��ch, the water saturation sl is set to zero �Eq. 6�.For yO2
the volume fraction of oxygen in dry air is used as a bound-ary condition �Eq. 7�. This corresponds to the experimental condi-tion of dry air supplied to the cathode side of the fuel cell20
sl = 0 at ��ch �6�
yO2= 0.21 at ��ch �7�
The boundary conditions at ��c depend on the current density jc
Ml
2F� jc = Nl �8�
−MO2
4F� jc = NO2
�9�
where Nl, NO2are the surface normal components of water and
oxygen mass flux; Ml, MO2are the molar masses of water and oxy-
gen, and F is the Faraday constant. The mass fluxes Nl and NO2are
given by
Nl =�l
�lkrel,lK��pl �10�
NO2= �O2
DO2�yO2
�11�
The cathode current density jc is described by the Tafel equation
jc = − dc�1 − sl��aj0yO2exp�− �zFnc
RT� �12�
where dc is the thickness of the cathode layer. To account for theporous structure of the cathode layer, the active area per volume,denoted a, is introduced. Due to flooding processes, the active areaon the cathode is reduced as the water saturation sl increases; this isdescribed by the term �1 − sl��. The current density is further de-pendent on the volume fraction of oxygen yO2
. j0, �, and z are,respectively, the exchange current density at the cathode, the asym-metry factor, and the number of electrons involved in the productionof one water molecule. Experimental investigations21-23 reveal adoubling of the Tafel slope RT/��zF� for voltage values below0.8 V that are relevant for the description of mass-transport limita-tion. The doubling of the Tafel slope corresponds to a change of zfrom 2 to 1, if the other parameters are held constant. A possibleexplanation of this phenomen, given by Parthasarathy et al.,24 is a
CS license or copyright; see http://www.ecsdl.org/terms_use.jsp

B1068 Journal of The Electrochemical Society, 155 �10� B1066-B1076 �2008�B1068
change of the reaction mechanism. Based on this, we use
z = 1 �13�
The cathode overpotential is termed c and is the sum of the acti-vation overpotential A,c and the concentration overpotential conc,cat the cathode
c = A,c + conc,c �14�Ohmic losses due to the resistance of the membrane as well as theanode overpotential are not considered in the model. However, theuse of a reference fuel cell in the experimental setup allowed sepa-ration of the anodic, cathodic, and ohmic overpotentials. Thus, aneffective voltage Ueff could be determined by subtracting the anodicand the ohmic overpotentials from the cell voltage Ucell. Further on,an analytical function was fitted to Ueff, yielding the voltage Usimwhich was used for simulation �see the Model Validation section fora detailed description of the determination of Usim�. The cathodeoverpotential c can hence be expressed by
c = Usim − Uoc �15�
where Uoc is the measured open-circuit voltage of the test cell.If both GDL and MPL are modeled �Fig. 1b�, an interface con-
dition at ��in is needed. Here, the continuity of the capillary pres-sure is required
pc,GDL = pc,MPL at ��in �16�
Because the gas pressure pg is constant, this yields
pl,GDL = pl,MPL at ��in �17�The model is solved using the simulation software Comsol. Thepartial differential equations are discretized using the finite elementmethod. Because they are strongly nonlinear due to the nonlinearityof the saturation-dependent parameters, an implicit solver based onthe Newton method is used.
Determination of saturation-dependent parameters.— To deter-mine the saturation-dependent parameters, several empirical corre-lations for capillary pressure pc and relative permeability krel,l aswell as an expression for the diffusivity of oxygen DO2
have beenfitted to datasets obtained by Becker et al.19 from microstructuralsimulation using the pore morphology method. The best matchingexpressions were applied to Eq. 1–4. Starting from a three-dimensional �3D� tomography image of a Freudenberg GDL, Beckeret al. created a 3D model of the GDL. For an arbitrary contact angle,the liquid water saturation was calculated for several capillary pres-sure values. Based on these results, other saturation-dependent pa-rameters such as relative permeability, diffusivity, and thermal con-ductivity were determined.
Three empirical relations were found for the capillary pressure.They trace back to Leverett �especially in the form proposed byUdell17�, Brooks-Corey,25 and Van Genuchten.26 The capillary pres-sure defined by Leverett and Udell is given by
pc�sl� = l cos �� �
KintJ�sl� �18�
where l is the surface tension of liquid water at the phase boundaryto air, and cos � is the contact angle of the medium. J�sl� is theLeverett function
J�sl� = asl − bsl2 + csl
3 �19�with
a = 1.417
b = 2.120
c = 1.263
Brooks-Corey proposed the following expression for the capillarypressure
Downloaded 06 Oct 2008 to 132.230.122.36. Redistribution subject to E
pc�sl� = pd�1 − sl�−1/h �20�
Here, the entry pressure pd is the capillary pressure required to dis-place the wetting phase from the largest pore of the medium. Theempirical parameter h accounts for the pore size distribution of themedium. The expression due to Van Genuchten is given by
pc�sl� = pd��1 − sl�−1/m − 1�1−m �21�
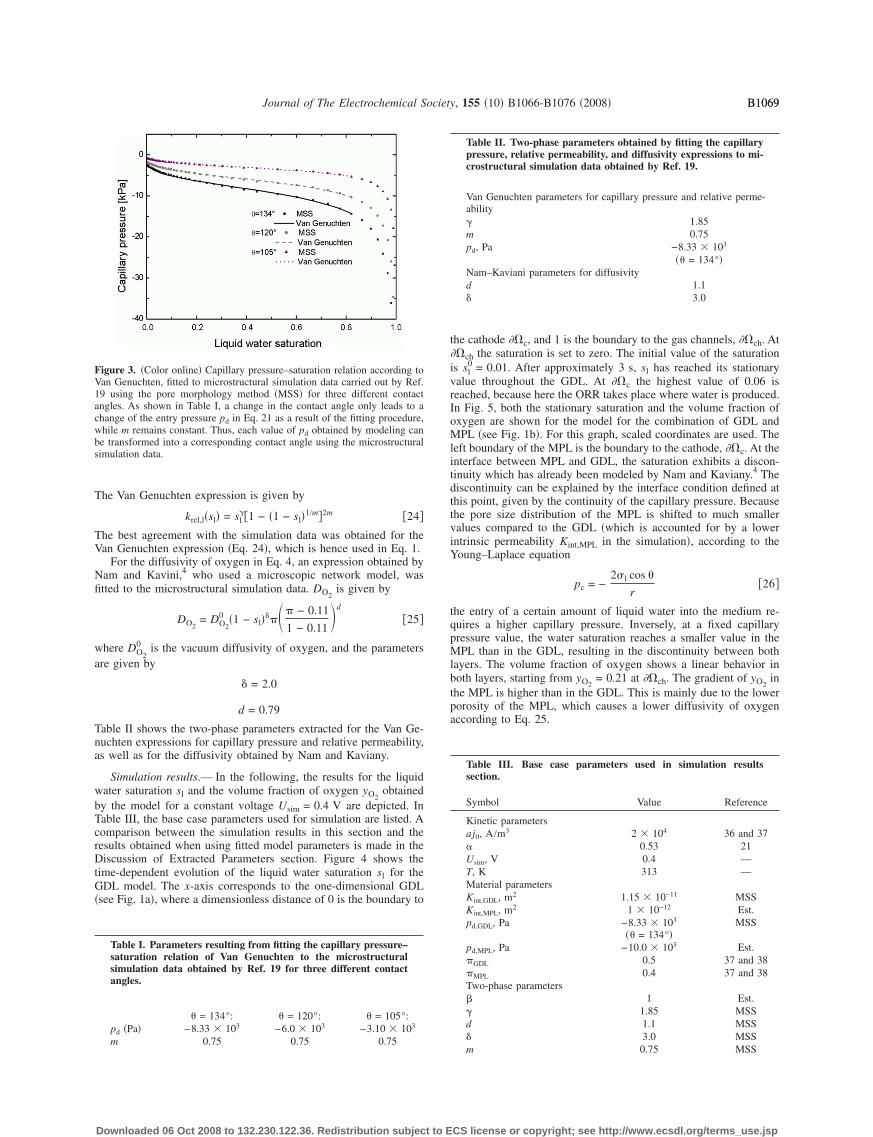
Figure 2 shows the capillary pressure–saturation relations proposedby Leverett, Brooks-Corey, and Van Genuchten together with thedataset obtained by Becker et al.19 from microstructural simulation�MSS�. The Brooks-Corey and Van Genuchten parameters h and mused for plotting represent typical values for soil tests.27 The entrypressure pd has been estimated for the GDL. Figure 2 shows that theLeverett expression, which is widely used for the description ofliquid water transport in the porous layers of fuel cells, shows thegreatest deviation from the simulation data. This is mainly because,in contrast to the Brooks-Corey function and the Van Genuchtenexpression, the Leverett function has a zero entry pressure. Thethree empirical expressions were fitted to the simulation data withinthe range of saturation values 0 � sl � 0.8 by using the data analy-sis program Origin. The best agreement was found for the expres-sion proposed by Van Genuchten �Eq. 21�, which is hence used inEq. 3. In Fig. 3, the fitted Van Genuchten expression is shown forthree different contact angles. Table I shows the parameters pd andm resulting from this fitting procedure. As can be seen from Table I,a change in the contact angle only results in a change of the entrypressure pd while m remains constant. This is used in the Discussionof Extracted Parameters section to transform each value of pd ob-tained by simulation into the corresponding contact angle.
Analogously, several empirical correlations for the relative per-meability as well as an expression for the diffusivity were fitted tothe microstructural simulation data. For the relative permeability,three expressions were found. The expression which is most oftenused is the one obtained by Wang18
krel,l�sl� = sl �22�
with
= 3
Mualem28 derived two expressions from the capillary pressure ex-pressions given by Brooks-Corey and Van Genuchten, respectively.The Brooks-Corey expression for the relative permeability of liquidwater in a hydrophobic medium is given by Eq. 23
krel,l�sl� = sl��1 − �1 − sl��2+h�/h� �23�
Figure 2. �Color online� Capillary pressure–saturation relation according toLeverett, Brooks-Corey, Van Genuchten, and microstructural simulations us-ing the pore morphology method �MSS�.19
CS license or copyright; see http://www.ecsdl.org/terms_use.jsp
B1069Journal of The Electrochemical Society, 155 �10� B1066-B1076 �2008� B1069
The Van Genuchten expression is given by
krel,l�sl� = sl��1 − �1 − sl�1/m�2m �24�
The best agreement with the simulation data was obtained for theVan Genuchten expression �Eq. 24�, which is hence used in Eq. 1.
For the diffusivity of oxygen in Eq. 4, an expression obtained byNam and Kavini,4 who used a microscopic network model, wasfitted to the microstructural simulation data. DO2
is given by
DO2= DO2
0 �1 − sl����� − 0.11
1 − 0.11�d
�25�
where DO2
0 is the vacuum diffusivity of oxygen, and the parametersare given by
� = 2.0
d = 0.79
Table II shows the two-phase parameters extracted for the Van Ge-nuchten expressions for capillary pressure and relative permeability,as well as for the diffusivity obtained by Nam and Kaviany.
Simulation results.— In the following, the results for the liquidwater saturation sl and the volume fraction of oxygen yO2
obtainedby the model for a constant voltage Usim = 0.4 V are depicted. InTable III, the base case parameters used for simulation are listed. Acomparison between the simulation results in this section and theresults obtained when using fitted model parameters is made in theDiscussion of Extracted Parameters section. Figure 4 shows thetime-dependent evolution of the liquid water saturation sl for theGDL model. The x-axis corresponds to the one-dimensional GDL�see Fig. 1a�, where a dimensionless distance of 0 is the boundary to
Table I. Parameters resulting from fitting the capillary pressure–saturation relation of Van Genuchten to the microstructuralsimulation data obtained by Ref. 19 for three different contactangles.
� = 134°: � = 120°: � = 105°:pd �Pa� −8.33 � 103 −6.0 � 103 −3.10 � 103
m 0.75 0.75 0.75
Figure 3. �Color online� Capillary pressure–saturation relation according toVan Genuchten, fitted to microstructural simulation data carried out by Ref.19 using the pore morphology method �MSS� for three different contactangles. As shown in Table I, a change in the contact angle only leads to achange of the entry pressure pd in Eq. 21 as a result of the fitting procedure,while m remains constant. Thus, each value of pd obtained by modeling canbe transformed into a corresponding contact angle using the microstructuralsimulation data.
Downloaded 06 Oct 2008 to 132.230.122.36. Redistribution subject to E
the cathode ��c, and 1 is the boundary to the gas channels, ��ch. At��ch the saturation is set to zero. The initial value of the saturationis sl
0 = 0.01. After approximately 3 s, sl has reached its stationaryvalue throughout the GDL. At ��c the highest value of 0.06 isreached, because here the ORR takes place where water is produced.In Fig. 5, both the stationary saturation and the volume fraction ofoxygen are shown for the model for the combination of GDL andMPL �see Fig. 1b�. For this graph, scaled coordinates are used. Theleft boundary of the MPL is the boundary to the cathode, ��c. At theinterface between MPL and GDL, the saturation exhibits a discon-tinuity which has already been modeled by Nam and Kaviany.4 Thediscontinuity can be explained by the interface condition defined atthis point, given by the continuity of the capillary pressure. Becausethe pore size distribution of the MPL is shifted to much smallervalues compared to the GDL �which is accounted for by a lowerintrinsic permeability Kint,MPL in the simulation�, according to theYoung–Laplace equation
pc = −2l cos �
r�26�
the entry of a certain amount of liquid water into the medium re-quires a higher capillary pressure. Inversely, at a fixed capillarypressure value, the water saturation reaches a smaller value in theMPL than in the GDL, resulting in the discontinuity between bothlayers. The volume fraction of oxygen shows a linear behavior inboth layers, starting from yO2
= 0.21 at ��ch. The gradient of yO2in
the MPL is higher than in the GDL. This is mainly due to the lowerporosity of the MPL, which causes a lower diffusivity of oxygenaccording to Eq. 25.
Table II. Two-phase parameters obtained by fitting the capillarypressure, relative permeability, and diffusivity expressions to mi-crostructural simulation data obtained by Ref. 19.
Van Genuchten parameters for capillary pressure and relative perme-ability� 1.85m 0.75pd, Pa −8.33 � 103
�� = 134°�Nam–Kaviani parameters for diffusivityd 1.1� 3.0
Table III. Base case parameters used in simulation resultssection.
Symbol Value Reference
Kinetic parametersaj0, A/m3 2 � 104 36 and 37� 0.53 21Usim, V 0.4 —T, K 313 —Material parametersKint,GDL, m2 1.15 � 10−11 MSSKint,MPL, m2 1 � 10−12 Est.pd,GDL, Pa −8.33 � 103
�� = 134°�MSS
pd,MPL, Pa −10.0 � 103 Est.�GDL 0.5 37 and 38�MPL 0.4 37 and 38Two-phase parameters� 1 Est.� 1.85 MSSd 1.1 MSS� 3.0 MSSm 0.75 MSS
CS license or copyright; see http://www.ecsdl.org/terms_use.jsp

B1070 Journal of The Electrochemical Society, 155 �10� B1066-B1076 �2008�B1070
The time-dependent development of the saturation in the modelfor the combination of GDL and MPL �see Fig. 1b� is shown in Fig.6. Figure 6a corresponds to the MPL where the boundary ��c islocated at a dimensionless distance of 0, and 1 is the boundarybetween MPL and GDL, ��in; Fig. 6b corresponds to the adjacentGDL. A comparison of both diagrams shows that the stationaryvalue of the saturation is reached much faster in the MPL �after 1 s�than in the GDL, where it takes 5 s for the saturation to reach itsequilibrium value. This can be explained by the different thicknessvalues of both layers. The time required for an exponentially decay-ing process to reach 1/e of the initial value is given by the charac-teristic time constant �� of layer �
�� =d�
2
Dl,�eff with � = GDL,MPL �27�
where d� is the thickness of layer �. As can be seen from Eq. 27, thegreater thickness of the GDL causes a much higher time constant.Because of the different material properties, the effective diffusivity
Figure 4. �Color online� Time evolution of the liquid water saturation in theGDL at a constant voltage of 0.4 V using the model parameters listed inTable III. The x-axis corresponds to the one-dimensional GDL model in Fig.1a.
Downloaded 06 Oct 2008 to 132.230.122.36. Redistribution subject to E
of water Dl,�eff is also different for GDL and MPL, but compared to
the thickness, the influence on the time constant can be neglected.A comparison of Fig. 6b with Fig. 4 shows that the saturation in
the GDL reaches a lower value �sl = 0.05� when an MPL is insertedbetween the GDL and cathode than when the GDL is connecteddirectly to the cathode �sl = 0.06�. This demonstrates the benefits ofan inserted MPL, which can prevent the GDL from flooding. Here,the results of Nam and Kaviany4 are reproduced, who concludedthat the saturation step between the GDL and MPL leads to animprovement of the cell performance.
Model Validation
Fitting procedure.— The chronoamperometric measurementsused for the validation of the model were carried out by Ziegler andHeilmann20 at Fraunhofer Institute for Solar Energy. The potentialstep voltammetry and sine wave testing described by Ziegler andHeilmann were simulated using the GDL model �Fig. 1a�. The volt-age Usim used for simulation was determined from the voltage Ucellapplied to the test cell as described in the following. Ziegler andHeilmann used a reference cell setup that is depicted in Fig. 7. Thevoltage measured between anode and cathode is denoted Ucell. Ineach experiment, the voltage between the working cathode and thereference anode, UCRA, was also measured. Because there is no load
Figure 5. �Color online� Stationary liquid water saturation and volume frac-tion of oxygen in MPL and GDL. The model parameters used for the simu-lation are listed in Table III. The x-axis corresponds to the one-dimensionalmodel in Fig. 1b using scaled coordinates. Due to the interface conditiondefined at the boundary ��in between MPL and GDL, given by the continu-ity of the capillary pressure, and the lower pore size values in the MPLcompared to the GDL, the saturation exhibits a discontinuity at ��in.
Figure 6. �Color online� Comparison ofthe time evolution of the liquid water satu-ration �a� in the MPL and �b� in the GDL.The model parameters used for the simu-lation are listed in Table III. The x-axiscorresponds to the one-dimensional modelin Fig. 1b. Due to the lower thickness ofthe MPL, the stationary value of the satu-ration is reached much faster in the MPLthan in the GDL.
CS license or copyright; see http://www.ecsdl.org/terms_use.jsp

B1071Journal of The Electrochemical Society, 155 �10� B1066-B1076 �2008� B1071
on the reference anode, UCRA does not contain the anode overpoten-tial na. Furthermore, UCRA contains only half of the ohmic mem-brane resistance if one assumes a symmetric potential distributionbetween anode and cathode, as shown in Fig. 7 by the potentiallines. The sum of the ohmic membrane and contact resistances ofthe test cell, referred to as Rohm, is given by the measured 10 kHzimpedance. Assuming that the contact resistance is small comparedto the membrane resistance, UCRA can be written as a function of themeasured current density jm as follows
UCRA = Ucell +1
2�jmRohm� + �a� �28�
From Eq. 28, an effective voltage Ueff can be calculated that iscorrected for the anode and the ohmic overpotentials. Ueff is givenby
Ueff = UCRA +1
2�jmRohm� �29�
For each experiment, Ueff was calculated according to Eq. 29, thenan analytical function was fitted to Ueff, yielding the voltage Usimwhich was used for simulation.
By using the Nelder–Mead algorithm, the simulated currentcurves were fitted to their corresponding measured curves, where thesame set of initial parameters was used in each case. The followingfunction was minimized by the algorithm
f�a� = i=1
m
�jc�a,ti� − jm�ti��2 �30�
where a is the vector of the parameters to be fitted. jc�a,ti� and jm�ti�are the simulated and the measured current density at the discretetime value ti, respectively. To calculate the function f�a�, the simu-lation values at ti with i = 1,2, . . . ,m had to be extracted from thesolution. The Nelder–Mead algorithm used to find the minimum off�a� is based on the simplex method. For N parameters to be opti-mized, N + 1 initial parameter vectors a1, . . . ,aN+1 � RN areneeded to form the corners of an N-dimensional simplex in theparameter space. The parameter vectors are varied such that thesimplex moves in the direction of the optimum parameter vector andfinally contracts with regard to this point. The termination criterionis defined by the diameter of the simplex and was set to 1 � 10−4.The Nelder–Mead algorithm is implemented in the function fmin-search in the program Matlab, where it can be used to find theminimum of an analytical function. To apply fminsearch to the Com-sol model of the GDL, both the model and the calculation of f�a�
Figure 7. Experimental setup consisting of working and reference elec-trodes. In addition to Ucell, in each experiment the voltage between the work-ing cathode and the reference anode, denoted UCRA, was measured. FromUCRA and the measured 10 kHz impedance, an effective voltage Ueff wasdetermined �Eq. 29� which is corrected for the anodic and the ohmic over-potentials that are not considered in the model. Further on, an analyticalfunction was fitted to Ueff, yielding the voltage Usim which was used forsimulation.
Downloaded 06 Oct 2008 to 132.230.122.36. Redistribution subject to E
according to Eq. 30 were implemented in Comsol Script. By defin-ing the Comsol Script file as a Matlab function, fminsearch couldthen be used to fit the simulation to the experimental data.
Potential step voltammetry.— In this experiment, a voltage of0.59 V was applied to the test cell while the impedance at 10 kHzwas measured. As soon as the impedance remained constant, a volt-age step from 0.59 to 0.06 V was imposed. The current response ofthe cell was sampled every 0.2 s for 50 s. The cell voltage can beexpressed by
Ucell�t� = Ucell,1:t � t0
Ucell,2:t � t0� �31�
with
Ucell,1 = 0.59 V
Ucell,2 = 0.06 V
The measured 10 kHz impedance Rohm �see Ref. 20 for numericaldata� and voltage UCRA were used to calculate the effective voltageUeff according to Eq. 29. Ueff and Ucell are shown in Fig. 8. Note thatUeff is higher than Ucell by the modulus of the anode and the ohmicoverpotential. A hyperbolic tangent was fitted to Ueff and is given by
Usim�t� =Usim,1 − Usim,2
el�t−t0� + 1+ Usim,2 �32�
with
Usim,1 = 0.70 V
Usim,2 = 0.27 V
l = 600 s−1
Considering that l must be high enough to ensure the steplike be-havior of Usim, but at the same time low enough to allow goodconvergence of the simulation, the value l = 600 s−1 was used. To-gether with the cell voltage Ucell and the effective voltage Ueff, Usimis shown in Fig. 8. Usim according to Eq. 32 was used to simulatethe potential step voltammetry. The initial saturation was set tosl
0 = 0.56. The Nelder–Mead algorithm was applied for t � t0 and�t0 + t1� � t � �t0 + t2�, using t1 = 0.7 s and t2 = 40 s, to the simu-lated current density curve. Between t0 and t0 + 0.7 s the curve wasnot fitted, because the processes occurring during this period are notconsidered in the model. The discharge of the double-layer capacitytakes place within 10−6 s. Processes in the active layer of the cath-
Figure 8. �Color online� Cell voltage Ucell�t� measured by potential stepvoltammetry, corresponding effective voltage Ueff�t�, and voltage Usim�t�used for simulation. Ueff�t� is corrected for the anodic and the ohmic over-potentials that are not considered in the model. Usim is obtained by fitting ahyperbolic tangent Ueff.
CS license or copyright; see http://www.ecsdl.org/terms_use.jsp

B1072 Journal of The Electrochemical Society, 155 �10� B1066-B1076 �2008�B1072
ode, like the diffusion of oxygen, occur within 10−3 s up to 1 s.Figure 9 shows a comparison of the fitted and the measured currentdensity, given by jc and jm, respectively, where the time evolution ofjc refers to the boundary ��c between the GDL and cathode. Simu-lation results and experimental data show very good agreement. Thevoltage step causes an instantaneous increase of the measured cur-rent density jm from 0.6 to 2.1 A/cm2. The ensuing decrease of jmwithin 26 s to the value 1.0 A/cm2 is due to the flooding of thepores and the resulting mass-transport limitation. Figure 10 showsthe evolution of the liquid water saturation and the volume fractionof oxygen after the voltage step. Note that the change of the satura-tion by �sl = 0.06 is small compared to the considerable change ofthe simulated current density by �jc = 0.27 A �see Fig. 9�. Figure10 shows that the saturation reaches the value 0.485 when the simu-lation parameters are used that have been optimized by the Nelder–Mead algorithm. Compared to Fig. 4, where literature values havebeen used for the simulation parameters and the maximum satura-tion is 0.06, this is a much higher value. The volume fraction ofoxygen decreases by �yO2
= 0.10. The opposite development ofsaturation and volume fraction of oxygen is due to the couplingbetween sl and the diffusivity of oxygen DO2
as well as the conversecoupling of sl and yO2
to the current density via boundary condi-tions. A discussion of the parameters that have been extracted by the
Figure 9. �Color online� Comparison of measured current density and fittedsimulated current density for potential step voltammetry. The simulated cur-rent density refers to the boundary ��c between GDL and cathode �Fig. 1a�.
Figure 10. �Color online� Time evolution of liquid water saturation andvolume fraction of oxygen at the boundary ��c between GDL and cathode�Fig. 1a� for the simulated potential step voltammetry. The opposite devel-opment of saturation and volume fraction of oxygen is due to the couplingbetween sl and the diffusivity of oxygen DO2
as well as to the conversecoupling of s and y to the current density via boundary conditions.
l O2Downloaded 06 Oct 2008 to 132.230.122.36. Redistribution subject to E
fitting algorithm is presented in the Discussion of Extracted Param-eters section.
Sine wave testing.— A voltage of Ucell,0 = 0.3 V was applied tothe test cell. As soon as the measured impedance at 10 kHz re-mained constant, the direct voltage was superposed by an alternatingvoltage of amplitude �Ucell = 0.3 V and frequency f = 0.1 Hz. Theresponding current density was sampled every 0.2 s. The voltagefunction applied to the test cell is given by
Ucell�t� = Ucell,0 − �Ucell sin�2�ft� �33�with
Ucell,0 = 0.3 V
�Ucell = 0.3 V
f = 0.1 Hz
The measured 10 kHz impedance Rohm �see Ref. 20 for numericaldata� and voltage UCRA were used to calculate the effective voltageUeff according to Eq. 29. A sine wave was fitted to Ueff and is givenby
Usim = Usim,0 − �Usim sin�2�ft� �34�where
Usim,0 = 0.45 V
�Usim = 0.27 V
Figure 11 shows Usim together with the effective voltage Ueff and thecell voltage Ucell. Usim according to Eq. 34 was used to simulate thesine wave testing. The initial saturation was set to sl
0 = 0.50. TheNelder–Mead algorithm was applied to a single oscillation. Figure12 shows the fitted and the measured current density, given by jc andjm, respectively, where the time evolution of jc refers to the bound-ary ��c between the GDL and cathode. The simulated and the mea-sured curves for the current density agree very well. The currentdensity oscillates conversely to the voltage with a phase shift of�1 = −12.6° between the minimum voltage and the maximum mea-sured current density jm. Because the major physical process corre-sponding to low frequencies is the transport of liquid water throughthe porous GDL, the phase shift can be explained by the flooding ofthe pores and the resulting mass-transport limitation. Even beforethe minimum voltage is reached, the fraction of water-filled pores ishigh enough to hinder the gas from reaching the electrode, which
Figure 11. �Color online� Cell voltage Ucell�t� measured by sine wave test-ing, corresponding effective voltage Ueff�t�, and voltage Usim�t� used forsimulation. Ueff�t� is corrected for the anodic and the ohmic overpotentialsthat are not considered in the model. Usim is obtained by fitting a hyperbolictangent to Ueff.
CS license or copyright; see http://www.ecsdl.org/terms_use.jsp

B1073Journal of The Electrochemical Society, 155 �10� B1066-B1076 �2008� B1073
results in a flattening of the upper part and finally in a decrease ofthe current density curve. With � = −9° in the simulation, the phaseshift between voltage and simulated current density jc is reproducedsufficiently.
Figure 13 shows the simulated water saturation and the volumefraction of oxygen. Within one oscillation, the change of the satura-tion by just �sl = 0.02 is accompanied by a significant change of theoxygen volume fraction. The opposite oscillation of sl and yO2
is dueto the two-phase coupling of both quantities as well as to theirconverse coupling to the current density via boundary conditions.
Discussion of Extracted Parameters
In Table IV the initial parameters used for the potential stepvoltammetry �PSV� and sine wave testing �SWT� simulations arelisted. The nine parameters that were optimized by the Nelder–Meadalgorithm are marked with stars; the remaining parameters were setto fixed values and kept constant. The fitted parameters are veryclose to the initial values. Due to the dependence of the fitted pa-rameters on the initial values, a well-founded choice of the latter hasto be made. Table IV shows that the fitted parameters are also closeto each other �the maximum deviation is 19% for the two-phaseparameter ��. This means that the model predicts the current behav-ior for the two experiments accurately while using almost the sameset of parameters.
Table IV also compares the model parameters to their corre-sponding literature values as far as they have been reported. The
Figure 12. �Color online� Comparison of measured current density and fittedsimulated current density for the sine wave testing. The simulated currentdensity is referred to the boundary ��c between GDL and cathode �Fig. 1a�.
Figure 13. �Color online� Time evolution of liquid water saturation andvolume fraction of oxygen at the boundary ��c between GDL and cathode�Fig. 1a� for the simulated sine wave testing. The change of the saturation byjust �sw = 0.02 is accompanied by a significant change of the oxygen vol-ume fraction.
Downloaded 06 Oct 2008 to 132.230.122.36. Redistribution subject to E
kinetic parameters of the ORR have been experimentally studied inRef. 29-35. While well-recognized values for � can be obtainedfrom the literature, it is difficult to get consistent values for aj0.Therefore, only � is compared to its literature value. As can be seenfrom Table IV, there is a significant deviation between the valueused for simulation �� = 0.14� and the literature value �� = 0.5329�.The choice of � to 0.14 can be explained by the following estimateusing the Tafel equation. The absolute value of the current density,� jc�, is given by
�jc� = C � exp�− �F
RT�Usim − Uoc� �35�
where the factor C is given by
C = �1 − sl��dcaj0yO2�36�
Plotting � jc� against the voltage Usim, it appears that the slope of thecurve increases rapidly with increasing �. This is shown in Fig. 14for three different values of �. The two points P1
� and P2� marked in
the diagram, where P1� is given by Usim = 0.30 V, jc = 1.01 A/cm2,
and P2� is given by Usim = 0.60 V, jc = 0.78 A/cm2, correspond to
measuring points in the sine wave testing at 0.1 Hz �Fig. 12�. These
Table IV. Comparison of initial and fitted parameters for poten-tial step voltammetry and sine wave testing.
Symbol Initial value
Fitted values
Lit. valuePSV SWT
Kinetic parametersaj
0*, A/m3 1.9 � 109 1.6 � 109 1.9 � 109 —
� 0.14 — — 0.53 29
T�PSV�, K 313 — — —T�SWT�, K 315 — — —Material parametersK
int,GDL* , m2 1.2 � 10−11 1.2 � 10−11 1.2 � 10−11 —
pd,GDL* , Pa −1.1 −0.99 −1.10 —
�GDL* 0.5 0.51 0.50 0.78 �TDG�
�GDL, ° 90.005 90.005 90.005 134 �TDG�Two-phase transport parameters�* 0.5 0.62 0.50 —�* 1.85 1.82 1.86 0.33 27
d* 0.6 0.55 0.61 0.79 4
�* 3.4 3.34 3.42 2 4
m* 0.75 0.76 0.75 0.77 27
Figure 14. �Color online� Current density � jc� according to Eq. 35 for dif-ferent values of �. The factor C is adjusted for each curve such that allcurves intersect in the point P
1* which corresponds to a measuring point in
the sine wave testing �P1 in Fig. 15�. For � = 0.14 the model predicts themeasured behavior of the current density.
CS license or copyright; see http://www.ecsdl.org/terms_use.jsp

B1074 Journal of The Electrochemical Society, 155 �10� B1066-B1076 �2008�B1074
measuring points, denoted as P1 and P2, are shown in Fig. 15, wherethe measured current density is plotted against the cell voltage Ucellfor the sine wave testing. P1 is given by Ucell = 0.13 V, jc= 1.01 A/cm2, and P2 is given by Ucell = 0.47 V, jc = 0.78 A/cm2.P1
� and P2� in Fig. 14 are derived from P1 and P2 by replacing the
measured voltage Ucell with the corresponding voltage Usim, whichcan be done by plotting Usim�t� �Eq. 33� and Ucell�t� �Eq. 34� againsteach other as shown in Fig. 16. In Fig. 14 the factor C is adjusted foreach curve such that all curves coincide at the point P1
�. To predictthe measured behavior, the simulated current density curve has totouch this point. If the literature value � = 0.53 is used, � jc� exhibitsa steep increase from higher to lower voltages. Accordingly, C hasto be chosen sufficiently low to put the curve through P1
�. However,this results in current density values too low for voltages higher thanUsim = 0.6 V �2.9 � 10−3 A/cm2 at 0.6 V�. Although yO2
and theterm �1 − sl�� increase with increasing voltage due to the mass-transport limitation, and so does the factor C according to Eq. 36, toput the curve through P2
�, C would have to be approximately 350times higher than in P1
� which cannot be achieved by varying yO2and sl. Hence, for � = 0.53, the model does not predict the measuredbehavior of the current density. For � = 0.3, the simulated current
Figure 15. Measured current density for the sine wave testing, plotted vs thecell voltage Ucell. The measuring points P1 and P2 correspond to P
1* and P
2*
in Fig. 14.
Figure 16. Plot of Usim�t� vs Ucell�t� according to Eq. 33 and 34 for the sinewave testing. Using the plot, values of Ucell can be converted directly intovalues of U .
simDownloaded 06 Oct 2008 to 132.230.122.36. Redistribution subject to E
density is still too low at 0.6 V �3.7 � 10−2 A/cm2�; C would haveto be increased more than 20 times in P2
� compared to P1�. The
optimum value for � turned out to be 0.14. At 0.6 V, � jc� reaches0.21 A/cm2. To put the curve through P2
�, C has to be increased bythe factor 3.7. This is reflected by the model description of themass-transport limitation. The optimized value of aj0, which is onthe order of 109 A/m3 for both simulations, can be explainedwith regard to the above. For � = 0.14, C has to be set to3.0 � 10−2 A/cm2, that is 3.0 � 102 A/m2, to put the curve throughP1
�. Estimating that yO2is on the order of 10−1 at Usim = 0.6 V, and
the term �1 − sl�� is on the order of 1, according to Eq. 36, aj0 hasto be on the order of 108 to 109 A/m3. Summarizing the above, thesimplifying description of the current density by the Tafel equationresults in the specific choice of the kinetic parameters. For example,the complex flooding process in the cathode is not considered suf-ficiently in the model. An additional term accounting for this processmight constrain the exponential slope in Eq. 35 and allow for thechoice of � � 0.14.
The optimized material parameters in Table IV, except for theintrinsic permeability Kint,GDL, are compared with the correspondingvalues given by the manufacturer of the Toray GDL, Toray Deut-schland GmbH �TDG�. For the determination of Kint,GDL to 1.2� 10−11 m2, the relation Kint,GDL = krel,l�sl = 1� was used, wherekrel,l was obtained by fitting the Van Genuchten expression �Eq. 24�to the microstructural simulation results of Becker et al.19. For theporosity �GDL of the Toray GDL, the manufacturer states 0.78, butin order to account for the decrease of the porosity due to the com-pression of the GDL, 0.5 was assumed in the model. From eachentry pressure pd,GDL used in the simulation, the correlated contactangle �GDL was determined by using the microstructural simulationdata in Ref. 19. In the following, the optimized contact angle isrounded off to the value 90.01° for the simulations. Here, a signifi-cant deviation from the value stated by the manufacturer, 134°, ap-pears; the optimized contact angle corresponds to a much less hy-drophobic GDL. Note that �GDL reflects the average contact angle ofthe GDL in the model, while in reality, the GDL is subject to localfluctuations of the wettability. The choice of the initial value for pdcan be explained as follows. The liquid water saturation increases bydecreasing pd and accordingly by decreasing �GDL. As can be seenfrom the diffusivity of oxygen DO2
�Eq. 25�, the water saturationlevel controls the two-phase coupling of water and oxygen via theterm �1 − sl��. If an entry pressure of 8.3 kPa is used in the simu-lation, corresponding to a contact angle of 134°, the maximum satu-ration at a cell voltage of 0.4 V reached in the GDL geometry is0.06 �Fig. 4�. This value is too low to allow significant influence ofthe term �1 − sl�� on the simulation result. To make fine adjustmentof the curve possible, the saturation level needs to be higher. Anentry pressure between −1 and −1.2 Pa �corresponding to a contactangle of approximately 90.01°�, yielding a saturation of maximally0.5 at 0.4 V in the GDL model, led to the best possible fit of thesimulated to the measured curve.
In the modeling and simulation section, a first set of two-phaseparameters was extracted by comparing literature expressions ofcapillary pressure, relative permeability, and diffusivity of oxygen tothe microstructural simulation results obtained by Ref. 19 et al. Theinitial values for the two-phase parameters needed for the applica-tion of the Nelder–Mead algorithm were chosen close to these firstvalues. In Table IV, the optimized values of the two-phase param-eters are compared to their corresponding literature values. The sig-nificant deviation of � from the literature value in Ref. 27 is due tothe differing application of the according Van Genuchten expression�Eq. 24�, which is in Ref. 27 used to describe soil tests.
Figure 17 shows the time-dependent water saturation in the GDLmodel �Fig. 1a� at a cell voltage of 0.4 V, where the parametersextracted for the potential step voltammetry have been used forsimulation. A comparison to Fig. 4, where the base case parametersaccording to Table III have been used for simulation, reveals twocharacteristics. First, the saturation reaches much higher values
CS license or copyright; see http://www.ecsdl.org/terms_use.jsp

B1075Journal of The Electrochemical Society, 155 �10� B1066-B1076 �2008� B1075
in Fig. 17; the maximum saturation is sl = 0.48 compared tosl = 0.06 in Fig. 4. This difference is mainly due to the lower contactangle of 90.01°. Second, the time constant is much higher in Fig. 17:Reaching a stationary value takes 30 s for sl, while in Fig. 4 theequilibrium value is reached after just 3 s. This can be explained bythe effective diffusivity of water Dl,eff in the GDL derived fromEq. 1. Dl,eff is given by
Dl,eff =1
�l�GDLkrel,lKint,GDL
�pl
�sl�37�
A decrease of the entry pressure pd,GDL corresponding to a decreaseof the contact angle �GDL lowers the capillary pressure pc �Eq. 21�,and hence the term �pl/�sl in Eq. 37. To a minor degree, the two-phase parameters contained in the relative permeability of waterkrel,l�sl� �Eq. 24� and in pc have an influence on the effective diffu-sivity of water.
Conclusion
A one-dimensional dynamic two-phase model for the GDL wasdeveloped. Important saturation-dependent parametrizations weredetermined by comparing several literature parametrizations to theresults of microstructural simulation data obtained by Becker et al.19
Capillary pressure and relative permeability are described by VanGenuchten expressions, and the diffusivity of oxygen is describedby an expression of Nam and Kaviany. The model was used tosimulate two chronoamperometric experiments, potential step volta-mmetry, and sine wave testing at 0.1 Hz. A comparison betweensimulation and measurement data was made by using the fittingalgorithm of Nelder and Mead. The model predicts the measuredtime-dependent current behavior for both experiments accurately,and hence describes the mass-transport limitation due to the dy-namic flooding of the pores with liquid water adequately for theseexperiments. As a result of the optimization, important material andtwo-phase parameters have been extracted. In particular, the ex-tracted contact angle indicates a less hydrophobic interior of theGDL than usually assumed. The method used to fit simulation re-sults to dynamic experimental data is useful for further quantitativecomparisons between two-phase models and experiments.
Fraunhofer Institute for Solar Energy Systems assisted in meeting thepublication costs of this article.
Figure 17. �Color online� Time evolution of the liquid water saturation inthe GDL at a constant voltage of 0.4 V using fitted model parameters �TableIV�. The x-axis corresponds to the one-dimensional model in Fig. 1a.
Downloaded 06 Oct 2008 to 132.230.122.36. Redistribution subject to E
List of Symbols
aj0 exchange current density � active area of cathode, A/m3
d Nam–Kaviani parameterdc thickness of cathode, 10 �m
dGDL thickness of GDL, 280 �mdMPL thickness of MPL, 50 �mDO2
diffusivity of oxygen, m2/sDO2
0vacuum diffusivity of oxygen, 1.8 � 10−5 m2/s
F Faraday constant, 9.6485 � 104 C/molf sine wave testing frequency, Hz
jc/m simulated/measured current density, A/m2
Kint,GDL/MPL intrinsic permeability of GDL/MPL, m2
krel,l relative permeability of waterm Van Genuchten parameter
Ml molar mass of water, 0.018 kg/molMO2
molar mass of oxygen, 0.032 kg/molpl liquid water pressure, Papg gas pressure, Papd entry pressure, Papc capillary pressure, PaR universal gas constant, 8.314 J/�kg mol�
Rohm ohmic resistance of test cell, � m2
sl liquid water saturationT temperature, K
Ucell voltage of test cell, VUeff effective voltage, VUoc open-circuit voltage of test cell, 0.98 V
Usim simulated voltage, VyO2
volume fraction of oxygenz number of electrons involved in ORR, 1
Greek
� asymmetry factor� parameter for coupling current density and saturation� Van Genuchten parameter� Nam–Kaviani parameter
c cathode overpotential, V�GDL contact angle of GDL, °
�l viscosity of liquid water, Pa s�GDL porosity of GDL�MPL porosity of MPL
�l mass density of liquid water, kg/m3
�O2mass density of oxygen, kg/m3
References1. C.-Y. Wang, Chem. Rev. (Washington, D.C.), 104, 4727 �2004�.2. U. Pasaogullari and C.-Y. Wang, J. Electrochem. Soc., 151, A399 �2004�.3. U. Pasaogullari and C.-Y. Wang, Electrochim. Acta, 49, 4359 �2004�.4. J. Nam and M. Kaviany, Int. J. Heat Mass Transfer, 46, 4595 �2003�.5. Z. H. Wang, C. Y. Wang, and K. S. Chen, J. Power Sources, 94, 40 �2001�.6. E. Birgersson, M. Noponen, and M. Vynnycky, J. Electrochem. Soc., 152, A1021
�2005�.7. T. V. Nguyen and D. Natarajan, J. Electrochem. Soc., 148, A1324 �2001�.8. L. You and H. Liu, Int. J. Heat Mass Transfer, 45, 2277 �2002�.9. M. Hu, A. Gu, M. Wang, X. Zhu, and L. Yu, Energy Convers. Manage., 45, 1861
�2004�.10. H. Sun, H. Liu, and L.-J. Guo, J. Power Sources, 143, 125 �2005�.11. R. M. Rao, D. Bhattacharyya, R. Rengaswamy, and S. R. Choudhury, J. Power
Sources, 173, 375 �2007�.12. M. Acosta, C. Merten, G. Eigenberger, H. Class, R. Helmig, B. Thoben, and H.
Müller-Steinhagen, J. Power Sources, 159, 1123 �2006�.13. C. Ziegler, H. M. Yu, and J. O. Schumacher, J. Electrochem. Soc., 152, A1555
�2005�.14. D. Song, Q. Wang, Z.-S. Liu, and C. Huang, J. Power Sources, 159, 928 �2006�.15. H. Meng, J. Power Sources, 171, 738 �2007�.16. Y. Wang and C.-Y. Wang, J. Electrochem. Soc., 154, B636 �2007�.17. K. S. Udell, Int. J. Heat Mass Transfer, 28, 485 �1985�.18. C. Wang and P. Cheng, Int. J. Heat Mass Transfer, 39, 3607 �1996�.19. J. Becker, V. Schulz, and A. Wiegmann, J. Fuel Cell Sci. Technol., 5, 021006
�2008�.20. C. Ziegler and T. Heilmann, J. Electrochem. Soc., 155, B349 �2008�.21. C. Song, Y. Tang, J. L. Zhang, J. Zhang, H. Wang, J. Shen, S. McDermid, J. Li, and
P. Kozak, Electrochim. Acta, 52, 2552 �2007�.22. D. Gerteisen, A. Hakenjos, and J. O. Schumacher, J. Power Sources, 173, 346
�2007�.23. J. Ihonen, F. Jaouen, G. Lindbergh, A. Lundblad, and G. Sundholm, J. Electro-
chem. Soc., 149, A448 �2002�.24. A. Parthasarathy, B. Dave, S. Srinivasan, and A. J. Appleby, J. Electrochem. Soc.,
139, 1634 �1992�.25. R. J. Brooks and A. T. Corey, “Hydraulic properties of porous media,” Hydraulic
Paper 3, Colorado State University, Fort Collins, CO �1964�.
CS license or copyright; see http://www.ecsdl.org/terms_use.jsp

B1076 Journal of The Electrochemical Society, 155 �10� B1066-B1076 �2008�B1076
26. M. T. van Genuchten, Soil Sci. Soc. Am. J., 44, 892 �1980�.27. R. Helmig, Multiphase Flow and Transport Processes in the Subsurface, Springer,
Heidelberg �1997�.28. Y. Mualem, Water Resour. Res., 12, 513 �1976�.29. A. Parthasarathy, S. Srinivasan, A. J. Appleby, and C. R. Martin, J. Electrochem.
Soc., 139, 2530 �1992�.30. A. Parthasarathy, C. R. Martin, and S. Srinivasan, J. Electrochem. Soc., 138, 916
�1991�.
31. O. Antoine, Y. Butel, and R. Durand, J. Electroanal. Chem., 499, 85 �2001�.Downloaded 06 Oct 2008 to 132.230.122.36. Redistribution subject to E
32. S. Mukerjee, S. Srinivasan, and A. J. Appleby, Electrochim. Acta, 38, 1661 �1993�.33. A. Parthasarathy, S. Srinivasan, and A. J. Appleby, J. Electroanal. Chem., 339,
101 �1992�.34. A. J. Appleby, J. Electroanal. Chem., 24, 97 �1970�.35. A. Damjanovic, J. Electroanal. Chem., 355, 57 �1993�.36. H. Ju, G. Luo, and C.-Y. Wang, J. Electrochem. Soc., 154, B218 �2007�.37. U. Pasaogullari and C.-Y. Wang, J. Electrochem. Soc., 152, A380 �2005�.38. C. H. Min, Y. L. He, X. L. Liu, B. H. Yin, W. Jiang, and W. Q. Tao, J. Power
Sources, 128, 173 �2004�.
CS license or copyright; see http://www.ecsdl.org/terms_use.jsp