Embed Size (px)
Citation preview
801
Safety, Reliability and Risk Analysis: Beyond the Horizon – Steenbergen et al. (Eds)© 2014 Taylor & Francis Group, London, ISBN 978-1-138-00123-7
Modeling the relationship between wind turbine failure modes and the environment
G. WilsonWind Energy CDT, University of Strathclyde, Glasgow, UK
D. McMillanInstitute for Energy and the Environment, University of Strathclyde, Glasgow, UK
ABSTRACT: It is important that the impact of the offshore environment on wind turbine reliabil-ity is reduced significantly due to the importance of offshore wind deployment to global energy tar-gets. Future development may otherwise be compromised by unsustainable operation and maintenance (O&M) costs. This paper aims to improve the accuracy of offshore O&M models by accounting for any relationship between certain weather characteristics and wind turbine failure modes. This is done using maintenance data from a UK onshore wind farm and weather data from a weather station located nearby. Non- parametric Mixture Models are estimated from the data and they are used to calculate a more accu-rate, weather dependent, failure rate which will be used in future research for Markov Chain Monte Carlo Simulation. This research will be of particular interest to wind turbine operators and manufacturers.
Offshore wind has many benefits however to make it an attractive prospect. Larger wind tur-bines can be installed offshore without planning restrictions, greater energy yields can be harvested where wind is more persistent, less turbulent and stronger, therefore producing more electricity and a bigger investment return (Henderson et al, 2003). Reported capacity factors from modern offshore wind farms range from 30%–50%, far greater than the 25% ball park figure for onshore (LORC, 2013).
Despite there being few restrictions on the size of offshore wind turbines, the average size of an operational or consented wind turbine is 2.8 MW (LORC, 2013). In the UK alone, the government
1 INTRODUCTION
The wind energy industry has grown significantly around the world in recent years and in the EU accounts for roughly 7% of installed capacity (EWEA, 2013). Germany and Denmark were the early leaders in installed capacity, however the UK, which boasts the strongest wind resource in Europe, plans to have installed 28GW of wind power installed by 2020 (DECC, 2011).
This recent popularity has come now that the cost of onshore wind power has decreased con-siderably to the point where it can now compete with some traditional thermal methods of power generation, such as nuclear and coal plants (Mott McDonald, 2010). Part of this reduction in costs is attributable to government subsides, however it is also due to there being larger, more reliable wind turbines on the market.
Despite these gains in onshore technology, the cost of offshore wind power is still relatively expen-sive. Analysis carried out in 2004, shown in Table 1, estimated that offshore wind power must improve substantially before it is attractive to potential investors (The Royal Academy of Engineering, 2004). Operation and Maintenance (O&M) is an area where this improvement can be made as a large amount of the cost of offshore wind is due to O&M (Mott McDonald, 2010) (The Royal Academy of Engineering, 2004).
Table 1. Cost of energy and O&M for different generat-ing technologies.
Power station type
Cost per MWh (UK pound)
O&M Cost (% of cost of electricity)
Nuclear 23 19.6%Gas (CCGT) 22 6.4%Coal (IGCC) 32 10%Onshore wind 37* 13.2%Offshore wind 55* 30.9%
*Not taking standby generation into account.

802
intends to have 13GW of offshore wind turbines installed and operating by 2020 (DECC, 2011). This equates to roughly 4500 wind turbines in the UK alone.
Maintaining this many unmanned offshore structures is unprecedented. In order to man-age these assets economically, operators will have to ensure that they have O&M strategies that are effective.
Perversely, the stronger winds which pose most threat to the health of the wind turbine also gen-erate the most electricity and return for the inves-tors. Strong winds however tend to come in the winter when access to maintain a wind turbine is much less probable (McMillan & Ault, 2008). Due to safety reasons access to offshore wind turbines is problematic. The significant wave height limit is currently 1.5 m. This restricts access consider-ably; in some cases to around 60% (Van Bussel et al, 2001). This low accessibility means that failures which for onshore wind turbines would only cause a small downtime can last far longer because engi-neers cannot access the wind turbine. This down-time must be minimized, as the longer it is the more revenue is lost.
Because of the restrictions posed by the off-shore environment, maintenance must be carefully planned and prioritized in advance so that the best can be made of any opportunity. There will also need to be efforts made to gain a better under-standing of wind turbine reliability and the vari-ables that influence component failure.
Onshore wind turbines and their components are very reliable when compared to thermal plants (Tavner et al, 2006a). Onshore wind turbines achieve availabilities in the region of 97%; however the offshore wind farms that have published their reliability statistics have indicated that they were only capable of 67%–88% availability (Van Bussel et al, 2001) (Feng et al, 2010). These statistics may have improved recently, but not likely to the level achieved by onshore.
The industry must improve upon these sta-tistics as offshore wind farms are getting bigger and are increasing their distance from the shore where the better wind resources are. This will increase travel time and make accessibility even more difficult.
This paper aims to improve on the knowl-edge of wind turbine reliability by investigating how the environment influences component fail-ures. It is believed that if a relationship can be derived between the weather and wind turbine failure modes that maintenance strategies can be planned with weather forecasts in mind. This may potentially prevent some failures from occur-ring and aid operators when planning offshore maintenance.
2 LITERATURE REVIEW
2.1 General wind turbine reliability
Offshore wind turbine operation and maintenance was explored by Van Bussel & Zaaijer (2001). It was found that the average failure rate of an onshore wind turbine was 2.20 failures per wind turbine per year. Van Bussel & Zaaijer (2001) did not believe this would be an economical figure for an offshore wind turbine due to the excessive operation and maintenance costs. They recommended sacrificing complex concepts such as variable speed, pitch reg-ulation with more reliable and simple fixed speed, stall regulation. The loss in income could, they believe, be offset by the improvements in reliability (Van Bussel & Zaaijer, 2001).
The failure rates for sub-assemblies of Dan-ish and German wind turbines were evaluated by Tavner & Xiang (2005) using the wind turbine reli-ability data from Windstats. They concluded that wind turbines were achieving reliability better than diesel generators and that inconsistent failure rates amongst the data may be attributable to differing weather conditions (Tavner & Xiang, 2005).
Work by Tavner et al (2006b) and Echavarria et al (2007) showed that wind turbine reliability was improving over time, following a bathtub curve. However, despite improvements over time, wind turbines still consist of components that experience lengthy periods of downtime whenever they fail.
Recent work on wind turbine reliability has led to questions over what the most reliable wind tur-bine configuration is. Tavner et al (2008) found that the gearbox—which fails relatively infrequently but causes long downtimes—was failing too often for economical use offshore. Tavner et al (2008) recom-mended two solutions to this problem; first improve the reliability of the gearbox or second, remove the gearbox completely. Improving the reliability would be a challenge as gearboxes are a mature technol-ogy and may not be enhanced further.
Work by McMillian & Ault (2010) discussed the reliability merits of using a direct drive wind tur-bine, but found that the reliability of the synchro-nous generator of the direct drive wind turbine was an issue and did not believe it had any advan-tage over a geared turbine. Their calculations were however based around onshore use. It remains to be seen if direct drive has an application offshore, recently however some original equipment manu-facturers have begun building direct drive models for offshore use.
2.2 Weather related wind turbine reliability
The effects of weather on turbine reliability were first addressed by Hahn (1997). Using wind turbine reliability data from the WMEP database it was
803
shown that the number of failures per day increased for certain wind turbine components as the average daily wind speed increased. The components most badly effected in Hahn’s analysis were the electric and control components (Hahn, 1997).
Tavner et al (2006c) carried out analysis to determine if there was any similarities between failure rate and Wind Energy Index (WEI). The methodology was to compare the monthly average wind speed across Denmark with monthly fail-ure data from the Windstats Denmark database. Correlations were calculated between the wind speed times series and failure time series for wind turbine components. Tavner et al (2006c) found that the generator, yaw system and mechanical control had the strongest correlation with the wind speed. This type of analysis however does not take non-instantaneous failures into account and con-ceals detail by aggregating the wind speed data and failure data into monthly bins. It was also assumed that the average wind speed across Denmark for that month was representative for all the wind tur-bines in the Windstats database.
The research did however show that there was a connection between wind speed and component failures. Tavner et al (2012) took the research fur-ther by considering a different database which comprised of three distinct sites in Germany, all with nearby weather stations. The wind turbines used on the sites were a mixture of Enercon E30 and E33’s. Both concepts are rated at 300 kW, have synchronous wound rotors, are variable speed, hydraulic blade pitch controlled and were manufactured from 1988–1993. They were the last geared turbines to be produced by Enercon before they switched exclusively to direct drive wind tur-bines. A more detailed analysis was undertaken which considered the cross correlation between particular meteorological parameters and wind turbine failures. The most closely correlated time series with wind turbine failures was the maximum wind speed time series, but overall there was a sig-nificant cross-correlation (55–75%) between the weather data and the failure data for each of the sites (Tavner et al, 2012).
Using the Garrad Hassan wind turbine data-base—which has more than 23,000 wind tur-bines—Wilkinson et al (2012) used SCADA Alarm Logs and availability databases to determine the impact of the environment on wind turbine fail-ure rates. Their analysis also showed that down-time decreased as the monthly mean temperature rose. The results appeared to show that extreme maximum air temperatures of between 18–21°C and maximum wind speeds of between 28–33 m/s cause a rise in failure rate and downtime (Wilkin-son et al, 2012). However is unclear whether this research takes account of scheduled maintenance
(preventative maintenance) and whether the vari-ations in downtime have taken the accessibility of the nacelle and tower into consideration. Wind tur-bines hubs are inaccessible for maintenance at wind speeds over 12 m/s and so if a failure occurred at a time when the wind speed was high, the down-time would be longer—not because of the failure’s severity, but because repairs could not be carried out safely (McMillan & Ault, 2008).
3 METHODOLOGy
Often the reliability of engineering systems is described as being discrete in that it can exist in one state until a transition occurs and the system changes to another state. These transitions can be represented by a transitional probability matrix. This characteristic means that many systems can be modeled as a Markov process. Markov Chains have been used often to model components and systems (Castro Sayas & Allan, 1996) (McMillan & Ault, 2007) (Besnard & Bertling, 2010) (Billington & Allan, 1983). This paper aims to improve this mod-eling by enhancing the understanding of the tran-sition rates between the states.
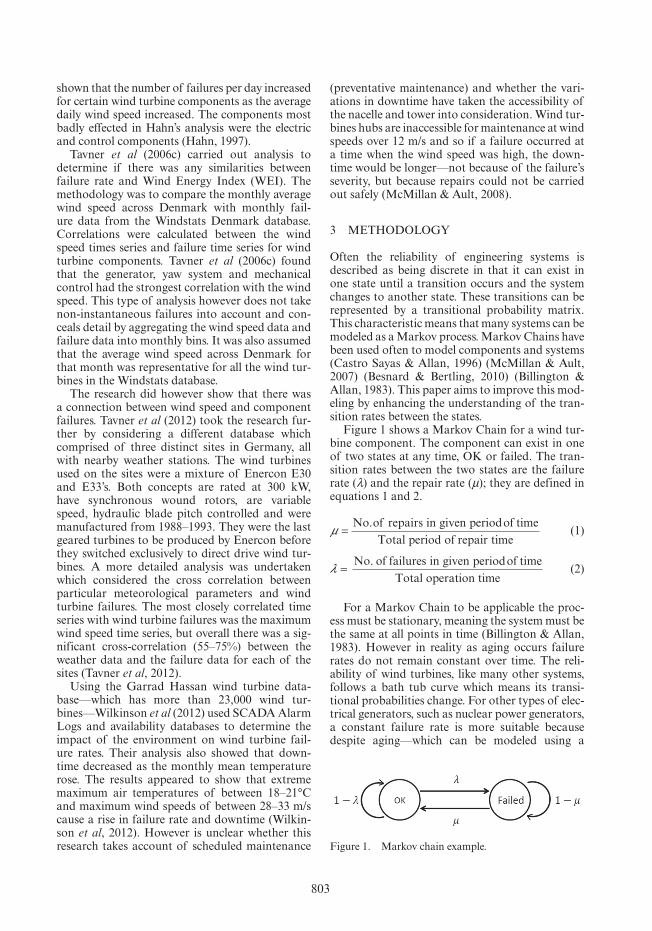
Figure 1 shows a Markov Chain for a wind tur-bine component. The component can exist in one of two states at any time, OK or failed. The tran-sition rates between the two states are the failure rate (λ) and the repair rate (µ); they are defined in equations 1 and 2.
µ =No.of repairs in given periodof time
Total period of repair time (1)
λ =No. of failures in given periodof time
Total operation time (2)
For a Markov Chain to be applicable the proc-ess must be stationary, meaning the system must be the same at all points in time (Billington & Allan, 1983). However in reality as aging occurs failure rates do not remain constant over time. The reli-ability of wind turbines, like many other systems, follows a bath tub curve which means its transi-tional probabilities change. For other types of elec-trical generators, such as nuclear power generators, a constant failure rate is more suitable because despite aging—which can be modeled using a
Figure 1. Markov chain example.

804
bathtub curve—operation rarely changes through-out its lifetime.
However for a wind turbine the weather condi-tions constantly change affecting every component from the blades through the drive train down to the foundation. If a relationship exists between weather conditions and failure modes then the failure rate of a component should change depending on the severity of the weather. As weather conditions change frequently, this problem is more compli-cated to model than simply fitting a bathtub curve.
Any relationship between component failure rates and weather conditions would have particu-lar significance when organizing offshore wind tur-bine maintenance strategies. Accessibility changes seasonally offshore and if a constant failure rate was used it may underestimate the challenges in the winter season and overestimate the difficulties in the summer.
The aim of this paper is to find a way of deter-mining the failure rate of a component taking the weather conditions into account. This approach should produce more accurate and informative models which can better inform maintenance deci-sion makers.
The procedure used in this methodology is summarized in Figure 2. Each step is explained in greater detail in the following sections.
3.1 Data sources
The data used in this analysis was from a set of maintenance records used as part of an onshore wind turbine management system. A summary of the maintenance data is given in Table 2. There is
the equivalent of 262 wind turbine years of data and all the wind turbines come from one site and are the same model and age.
The wind turbine system was split into twelve sub-assemblies, these are shown in Table 3 along with their codes.
The dataset defined a failure as any event which had caused the wind turbine to suffer downtime. Each individual failure was logged in the dataset as an event with a designated code in accordance with where the failure took place originally. As well as the failure location, the event logs also contained the downtime, date and time, turbine number and stoppage definition (preventative or corrective). Any incomplete failure events were removed from the dataset along with all preventative mainte-nance events. This filtering left a total of 442 indi-vidual failures to be analyzed—the failure rate of the site during the evaluated period was calculated to be 2.36, similar to the figure given by Van Bussel et al (2001).
Using equation 2 yearly failure rates were calcu-lated for the sub-assemblies in the dataset, this is shown in Table 4.
Environmental data came from the UK Met Office. The wind farm is situated within roughly 15 miles of the weather station which provides hourly relative humidity, temperature and wind speed. All of these measurements relate to condi-tions at ground level, not at hub height. It is assumed that the conditions at the weather station represent Figure 2. Procedure used in this paper.
Table 2. Summary of data.
Installed capacity (MW)
Number of wind turbines
Duration of data (years)
Wind turbine years
322 140 1.87 262
Table 3. List of sub-assemblies and their codes.
Code Sub-assembly
100 Emergency systems200 Meteorological instruments300 Rotor400 Blade pitch system500 Drive train600 yaw system700 Hydraulic system800 Control system900 Main generator
1000 Lifting system1100 Nacelle1200 Tower

805
Figure 3. Fitting of a kernel to a set of failure data points.
Table 4. yearly failure rates (failures/year/wind turbine) of sub-assemblies with downtime filter applied.
CodeNo filter
10 hour filter
24 hour filter
48 hour filter
100 0.0352 0.0186 0.0041 0.0000200 0.0600 0.0083 0.0021 0.0000300 0.0269 0.0083 0.0041 0.0021400 0.0538 0.0248 0.0165 0.0062500 0.1241 0.0889 0.0248 0.0227600 0.1199 0.0496 0.0248 0.0124700 0.0620 0.0310 0.0124 0.0062800 0.4115 0.2068 0.0662 0.0310900 0.0248 0.0083 0.0041 0.0021
1000 0.0083 0.0021 0.0000 0.00001100 0.0124 0.0000 0.0000 0.00001200 0.0476 0.0000 0.0000 0.0000
Figure 4. Seasonal variations of temperature and wind speed at wind farm.
the conditions on the wind farm accurately despite the distance between them. Figure 4 shows aver-aged monthly wind speed and temperature varia-tions for the weather station using the Met Office data over a four year period.
To simplify both sets of data they were reduced to daily resolution. Therefore weather data was averaged over 24 hour periods and daily failure rates were calculated from those shown in Table 4.
3.2 Fit mixture models
The approach taken in this paper to calculate the failure rate of a component at a specific weather condition uses Mixture Modeling. This method has been used by others to provide better estimates of wind speeds rather than using a Weibull distri-bution (Akpinar & Akpinar, 2009) (Morgan et al, 2011). Mixture Models allow subpopulations to be represented together in a probabilistic model. They can be used to examine the distributions of weather conditions when failures occur for each sub-assembly compared to the weather conditions recorded by the weather station which represent typical site conditions.
Distributions of weather conditions when a failure has occurred for each sub-assembly are esti-mated by calculating kernel density functions of the weather data. Non-parametric distributions are used as opposed to parametric distributions because it is not known what shape the distributions should take. These non-parametric distributions are fitted to the weather data recorded on the day when a failure has occurred to a sub-assembly in the wind turbine. Each sub-assembly then has its weather data fitted to a distribution. Figure 3 shows how a kernel has been fitted to the data. The dots show the real data and the line shows the smoothed kernel.
Mean squared errors were calculated, using equation 3, for each fitting. Any distributions with badly fitted curves were filtered out of the dataset. Some sub-assemblies had so few failures that they were too statistically insignificant to be included and they too were filtered out. Statistical signifi-cance was determined using the Wilcoxon Rank Sum Test.
Figure 6 shows an example of a Mixture Model. It was calculated by producing three kernel density functions from three different datasets. It shows the distribution of daily average wind speeds that were recorded at the weather station during a 4 year period. The two other distributions show the daily average wind speeds recorded for only days when a failure has occurred to either the drive train (500) or the control system (800).
MSEn
Y Yi ii
n= −
=∑1 2
1( )
(3)

806
Weightings were calculated by determining the frequency of occurrence of each sub-population. In the case of sub-assemblies, the weightings are simply their failure rate.
The purpose of this paper is to investigate the reliability and operation and maintenance of a wind farm rather than a single turbine and so the individual wind turbine failure rates were mul-tiplied by the population of the wind farm. The weather station data represents the entire popula-tion, its weighting was therefore 1.
If a wind speed x, shown in Figure 5 and 6 as a vertical line, is forecast to occur on day y, this mixture model can be used to determine the prob-ability of x occurring on any given day, P(x), using the weather station data. The probability of a fail-ure occurring to a sub-assembly is the failure rate of the sub-assembly λsub. So given that a failure has occurred in a sub-assembly, the probability that wind speed x also occurs is P(λsub | x ).
A downtime filter can be used which removes failures from the dataset which did not cause the
turbine to be shut down over a certain downtime limit. Some wind turbine failures can be repaired remotely and therefore have very short downtimes, these failures would not need to be considered when scheduling offshore maintenance. This filter alters the yearly failure rate of each sub-assembly, as shown in Table 4. Figure 6 shows the mixture model when a 24 hour downtime filter is used. The drive train had 11 failures which caused downtimes equal to or greater than 24 hours.
3.3 Calculating the failure rate
The probability of wind speed x occurring at the wind farm is 0.075 according to Figures 5 and 6. The probability that wind speed x occurs, given a failure has occurred in the controller is 0.009. To calculate the failure rate of the controller for day y the law of total probability is used, shown in equation 4. With no downtime filter used P(λ800) = 0.12.This is 0.04 less than the average daily wind farm failure rate which does not take weather conditions into account, shown in Figure 8.
P AP A B
P B( ) ( | )
( )=
(4)
If a downtime filter of 24 hours is applied, using the mixture model in Figure 6, P(λ800) = 0.027 for day y, 0.025 more than the non-weather dependent failure rate.
This same process can be used for average daily wind speed, average daily humidity and average daily temperature.
4 RESULTS
Using the procedure described in section 3, a range of failure rates were calculated for a wind turbine component. The range begins with the lowest read-ing recorded for a weather characteristic and ends with the maximum value recorded.
This is shown in Figure 7. The weather charac-teristic in this case is the average daily wind speed and the component being examined is the drive train. No downtime filter is applied. The bold horizontal line shows the non-weather dependent failure rate for the drive train, given in Table 4.
The failure rate for wind speeds between approx-imately 0 knots and 11 knots is less than the non-weather dependent failure rate indicating that between these wind speeds the drive train experi-ences fewer failures than encountered normally. For wind speeds higher than 11 knots the failure rate increases significantly. This suggests that in high wind speeds the drive train suffers more failures.
Figure 5. Wind speed dependent failure rates for the drivetrain.
Figure 6. mixture model of controller and drive train with weather station data.

807
Figure 7. mixture model of controller and drive train with 24 hour downtime filter applied.
Figure 8. Wind speed dependent failure rates for the control system.
Figure 9. Wind speed dependent failures for the drive train with a 24 hour downtime filter.
The control system results, shown in Figure 8, are very similar to the drive train results which again show a lower failure rate at low wind speeds and a significantly higher failure rate at higher wind speeds.
This pattern is also prevalent when the 24 hour downtime filter is applied. Interestingly the drive train results from Figure 9 shows that the longer downtimes appear to occur at higher wind speeds. There is a difference of approximately 2 knots between the non-filtered and 24 hour filtered wind speed failure data. This suggests that wind speeds over 12.5 knots are more likely to cause more severe failures. However care must be taken when linking downtimes and failure severity as discussed in section 2.2.
Figures 10 and 11 show the yaw system com-ponent and how its failure rate changes as the humidity and average temperature changes. The low temperatures do not appear to have a negative
Figure 10. Humidity dependent failure rates for the yaw system.
Figure 11. Temperature dependent failure rates for the yaw system.
effect on the failure rate for the yaw system but temperatures between 3 and 12 degrees Celsius seem to adversely affect the failure rate.
Analysis on the effect of humidity shows that for the yaw system there is a range between
808
approximately 70% and 85% where the yaw system fails most often.
5 DISCUSSION
This research has shown patterns which suggest that there is a relationship between weather con-ditions and wind turbine failures. A procedure is demonstrated which would allow this relationship to be modeled in a Markov Chain.
The results show that in general, when wind speed increases the probability of failure increases for controller system and drive train components.
Care must be taken when drawing conclusions from results that have been filtered for down-time. Like in previous research by Wilkinson et al (2012), results have shown that higher wind speeds are more likely to lead to longer downtimes. How-ever wind turbine accessibility must also be taken into consideration and future research will account for this.
The data used in this research only involves one wind farm; further analysis will be undertaken using additional data from a second wind farm using the same model of wind turbines but located in a different part of the UK. The volume of data available from the wind farm is only over a rela-tively short period of time which means that some sub-assemblies with low failure rates have not failed often enough for their results to be useful. More data will be required before these compo-nents can be included in future work.
Some of the non-parametric distributions con-tain probabilities for negative wind speeds and improbable temperature and humidity readings. At present these readings are omitted using com-mon sense. However this problem will be elimi-nated with a larger dataset.
The results in this paper do not necessarily describe all wind turbines but at this stage only really describe one site and one model of wind turbine. Because of differing climates and mod-els of wind turbine, analysis would have to be undertaken on a specific wind farm to understand its relationship between failure rate and weather characteristics.
6 CONCLUSION
This paper has outlined a method of calculating more accurate failure rates which are a function of weather conditions. It has also suggested that there is a relationship between some failure modes and some weather conditions.
This research will be used in future research to produce a Markov Chain Monte Carlo simulation.
The aim of this model will be to assess the eco-nomic benefit of different maintenance strategies for offshore wind turbines which take weather characteristics into consideration.
The research in this paper will be of interest to operators and manufacturers of wind turbines.
ACKNOWLEDGEMENTS
The authors would like to thank the EPSRC for funding this research as well as Dr Max Parker for his help in formatting the data used in this paper.
REFERENCES
A.R. Henderson, C. Morgan, B. Smith, H.C. Sorenson, R.J. Barthelie an B. Boesmans, “Offshore wind energy in Europe—A review of the state-of-the-art,” Wind Energy, vol 6, pp 35–52, 2003.
Akpinar, S. and Akpinar, E.K. 2009. Estimation of wind energy potential using finite mixture distribution models. Energy Conversion and Management. 50(4): 877–884.
Besnard, F. and Bertling, L. 2010. An approach for condition-based maintenance optimization applied to wind turbine blades. IEEE Trans. on sustainable energy 1(2): 77–83.
Billington, R. and Allan, R. 1983. Reliability Evaluation of engineering systems: Concepts and Techniques. London:Pitman.
Castro Sayas, F. and Allan, R.N. 1996. Generation avail-ability of wind farms. IEE Proc. Generation Transmis-sion Distribution. 143(5): 507–518.
DECC. 2011. UK Renewable Energy Roadmap. London: Crown.
Echavarria, E., Tomitama, T., Van Bussel, G.J.W. and Hahn, B. 2007. How has Reliability of Technology Devel-oped Through Time. In Proceedings of International European Wind Energy Conference, Milan, May 2007.
EWEA. 2013. Wind in Power: 2012 European Statistics.Feng, y., Tavner, P.J. and Long, H. 2010. Early experi-
ences with UK round 1 offshore wind farms. In Pro-cedings of I.C.E. Energy 163(EN4) 167–181.
Hahn, B. 1997. Zeitlicher Zusammenhang von Schaden-shaufigkeit und Windgeschwindigkeit. In 22. FGW-Workshop Einflub der Witterung auf Windener-gieanlagen, Leipzig, 1997.
LORC. 2013. Capacity factor by commissioned site. http://www.lorc.dk/offshore-wind-farms-map/statistics/ production/capacity-factor. [Access 04/04/13].
McMillan, D. and Ault, G. 2007. Quantification of con-dition monitoring benefit for offshore wind turbines. Wind Engineering. 31(4): 267–285.
McMillan, D. and Ault, G. 2008. Condition monitoring benefit for onshore wind turbines: sensitivity to oper-ational parameters. IET Renewable Power Generation 2(1): 60–72.
McMillan, D. and Ault, G. 2010. Techno-Economic Comparison of Operational Aspects for Direct Drive and Gearbox Driven Wind Turbines. IEEE Transac-tions on Energy Conversion, 251): 191–198.

809
Morgan, E.C., Lackner, M., Vogel, R.M. and Baise, L.G. 2011. Probability Distributions for offshore wind speeds. Energy Conversion and Management. 52(1): 15–26.
Mott McDonald. 2010. UK Electricity Generation Costs Update. London: Mott McDonald.
Tavner, P.J., Brinkman, C. and Spinato, F. 2006c. Influ-ence of Wind Speed on Wind Turbine Reliability. Wind Engineering 30(1):55–72.
Tavner, P.J., Greenwood, D.M., Whittle, M.W.G., Gindele, R., Faulstich, S. and Hahn, B. 2012. Study of weather and location effects on wind turbine failure rates. Wind Energy 16(2): 175–187.
Tavner, P.J., Spinato, F., Van Bussel, G.J.W. and Kortoulakos, E. 2008. Reliability of different wind turbine concepts with relvance to offshore application. in Proceedings of the International European Wind Energy Conference, Brussels, April 2008.
Tavner, P.J., Van Bussel, G.J.W., Spinato, F. 2006a. Machine and Converter Reliabilities in Wind Turbines. In IEE 2nd International Conference on Power, Machines and Drives. Dublin, April 2006.
Tavner, P.J. and Xiang, J. 2005. Wind Turbine Reliability, how does it compare to other embedded generation sources. In IEE RTDN Conference, London, Jan 2005.
Tavner, P.J., Xiang, J.P. and Spinato, F. 2006b. Reliability Analysis for Wind Turbines. Wind Energy 10(1): 1–18.
The Royal Society of Engineering. 2004. The Costs of Generating Electricity. London: The Royal Society of Engineering.
Van Bussel, G.J.W. and Zaaijer, M.B. 2001. Reliability, availability and maintenance aspects of large-scale offshore wind farms, a concepts study. In ImarE Con-ference in MAREC, Newcastle, UK, March 2001.
Van Bussel, G.J.W., Henderson, A.R., Morgan, C.A., Smith, B. Barthelmie, R., Argyriadis, K., Arena, A., Niklasson, G. and Peltola, E. 2001. State of the Art and Technology Trends for Offshore Wind Energy: Operation and Maintenance Issues. In Proceedings of offshore wind energy special topic conference, Brussels, Belgium, December 2001.
Wilkinson, M., Van Delft, T. and Harman, K. 2012. The Effect of Environmental Parameters on Wind Turbine Reliability. In EWEA, Copenhagan, April 2012.