Embed Size (px)
Citation preview
COGNITIVE PSYCHOLOGY 22, 225-271 (1990)
Modeling the Role of Parallel Processing in Visual Search
KYLE R. CAVE AND JEREMY M. WOLFE
Massachuserts Institute of Technology
Treisman’s Feature Integration Theory and Julesz’s Texton Theory explain many aspects of visual search. However, these theories require that parallel pro- cessing mechanisms not be used in many visual searches for which they would be useful, and they imply that visual processing should be much slower than it is. Most importantly, they cannot account for recent data showing that some subjects can perform some conjunction searches very efficiently. Feature Integration The- ory can be modified so that it accounts for these data and helps to answer these questions. In this new theory, which we call Guided Search, the parallel stage guides the serial stage as it chooses display elements to process. A computer simulation of Guided Search produces the same general patterns as human sub- jects in a number of different types of visual search. D 19w Academic press, IW.
A central idea in the study of early visual cognition is that visual pro- cessing is done in two stages: an early stage that operates in parallel across the entire visual field, and a later stage that can only process information from a limited part of the field at any one time. This idea appeared relatively early in cognitive psychology (Neisser, 1967) and forms the foundation for two current accounts of early visual cognition: Treisman’s Feature Integration Theory (Treisman & Gelade, 1980; Tre- isman, 1986) and Julesz’s Texton Theory (Bergen & Julesz, 1983; Julesz, 1984; Julesz & Bergen, 1983).
Although these two theories employ different terminologies, the basic constructs they propose are essentially the same. They both claim that the fast parallel stage identifies the basic visual features that are present, and that the slower, serial stage then combines these features to produce complex representations of visual objects. We will refer to the general framework set up by these two theories as Feature Integration Theory, or FIT.
The authors thank Karen Yu, Mami Stewart, Anne Treisman, Ken Nakayama, and Stephen Kosslyn for useful comments and advice. This work was supported by a Whitaker Health Sciences Graduate Fellowship and an NSF Graduate Fellowship to K. R. Cave; by a Whitaker Health Sciences Fund Research Award, NIH grant (EY05087), and a grant from the Educational Foundation of America to J. M. Wolfe; by a grant from the Alfred P. Sloan Foundation to the M.I.T. Center for Cognitive Science; and by NSF Grant 85-18774 to Steven Pinker. Correspondence and reprint requests should be sent to Kyle R. Cave, De- partment of Psychology, C-009, University of California, San Diego, La Jolla, CA 92093.
225 OOlO-0285/90 $7.50 Copyright 0 1990 by Academic Press, Inc. Au rights of reproduction in any form reserved.
226 CAVE AND WOLFE
Julesz and Treisman have presented a large body of very orderly data to support FIT, and their results have been confirmed and expanded by numerous others. Among the many experimental paradigms they have used is visual search, in which subjects must find a target element em- bedded among distracters. When the target differs from all the distracters by a single feature, FIT holds that the parallel stage should be able to detect it, and thus subjects should be able to find it quickly, regardless of the number of distracters. Treisman and Gelade (1980) measured re- sponse times as subjects searched for a target that had a different color or different shape from all the distracters. In accordance with FIT, when the response times were plotted by the number of distracters present, the resulting function was almost completely flat.
FIT predicts a different result when the target is defined by a conjunc- tion of features and each distractor shares at least one of those features with the target. In this case, the serial stage must process each element individually until it finds the target conjunction. Therefore a conjunc- tion search, unlike a feature search, should require more time as the number of elements in the display increases. When Treisman and Gelade’s (1980) subjects searched for a target defined by a conjunction of color and shape, the resulting response time function had a substantial slope.
FIT’s ability to account for these and other experimental results with a few simple mechanisms makes it very compelling. Nevertheless, there are some questions about FIT that must be answered if it is to remain a viable account of the early stages of visual cognition. This paper will review data that cannot be easily explained by FIT as it currently stands. Following that, a new theory called Guided Search will be proposed. Guided Search is similar to FIT, but the interactions between the parallel and serial stages are different. After Guided Search is described, the results from a computer simulation will be presented to demonstrate that this modifica- tion makes it possible to account for a wide range of data, including some not explained by FIT.
Conflicting Data
Treisman’s original visual search data show very different patterns for feature and conjunction searches: very shallow response time X set size functions for feature searches, and steeper functions for conjunction searches, with a 2: 1 target-absent/target-present ratio suggesting serial self-terminating search. These results made it easy to believe that there is a parallel mechanism that works well for feature searches and not at all for conjunction searches. Since FIT was introduced, however, new data have appeared that may not tit well within the Feature Integration framework.

MODELING VISUAL SEARCH 227
For instance, Egeth, Virzi, and Garbart (1984) showed evidence from conjunction searches suggesting that subjects were able to limit their search to elements of a single color or a single shape. According to FIT, the serial stage should be forced to choose elements completely at random in a conjunction search. Instead, these subjects apparently were able to exclude a subset of the elements in parallel from the beginning, although they were still searching serially among the remaining elements.
With a relatively minor addition, FIT can account for this result. The parallel stage must be able to use a single feature dimension to guide the serial search, steering it away from elements with the wrong values and toward those with the right value on that dimension. This modification preserves the essential idea that feature dimensions are processed inde- pendently in the parallel stage, and Treisman and Gormican (1988) appear to accept it.
More troublesome data come from experiments using different features in conjunction searches. Nakayama and Silverman (1986a, 1986b) find that for some types of conjunction search, reaction time remains constant as set size increases, giving the flat function associated with parallel search. The targets in these parallel searches are usually defined by a conjunction involving either size or stereoscopic depth. It seems as if subjects can limit their search to a particular depth plane or to a particular scale, and can thus do a parallel search for the one unique element within that plane or scale.
One way to retain FIT would be to classify size and stereo depth as special feature dimensions similar to two-dimensional location. Subjects can limit their search to a particular region of two-dimensional space, and so perhaps it should not be surprising that they can also limit it to a particular depth plane or scale as well. However, part of the strong appeal of FIT stems from its generality. It accounts for results involving many different types of visual information with a single mechanism that can operate on any type of visual feature. The more special cases there are, the weaker FIT becomes.
Even if Nakayama and Silverman’s parallel conjunction searches can be explained within the Feature Integration framework (Nakayama & Silverman 1986a, 1986b), other problems arise from a study by Wolfe, Cave, and Franzel (1989). In a conjunction search in which the target was a conjunction of color and form (a red 0 among green OS and red Xs), they found a broad distribution of performance. Some of their subjects exhibited the very steep slopes characteristic of serial search that Treis- man finds, while other subjects responded very quickly regardless of the number of distracters. The fastest of their subjects had slopes about as flat as those from Treisman’s feature search experiments. They found similar shallow slopes in other search tasks involving a conjunction of
228 CAVE AND WOLFE
Feature Search
cl
60% A 50%
40% 30% 20% 10%
0% 5toiO lot020 20to40 '
100%
90%
80%
- I
70% 60%
slope
Conjunction Search
cot05 5to10 lot020 2oto40
slope lOO%-
90% -
80% -. T/L 70%. Search 60%-
q C 50%. 40%. 30%- 20%- 10%.
O%, <oto5 5to10 lot020 2oto40
slope
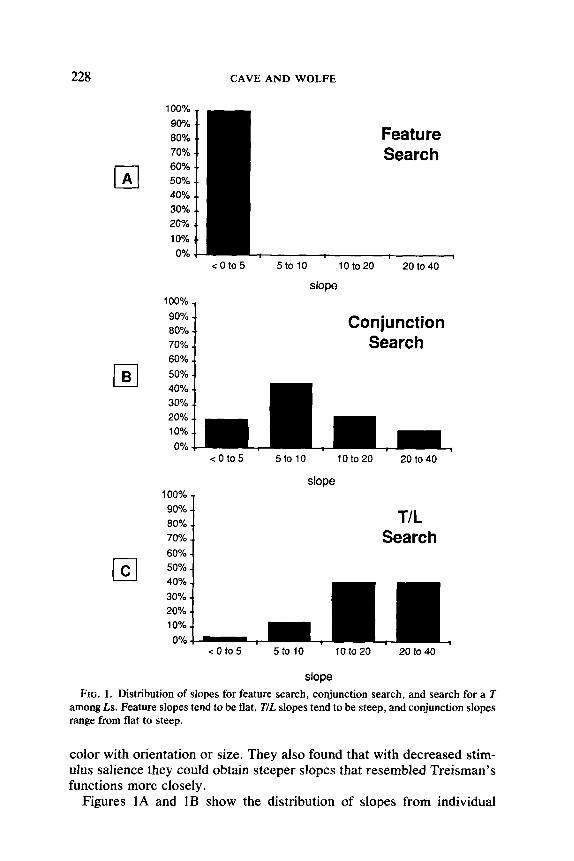
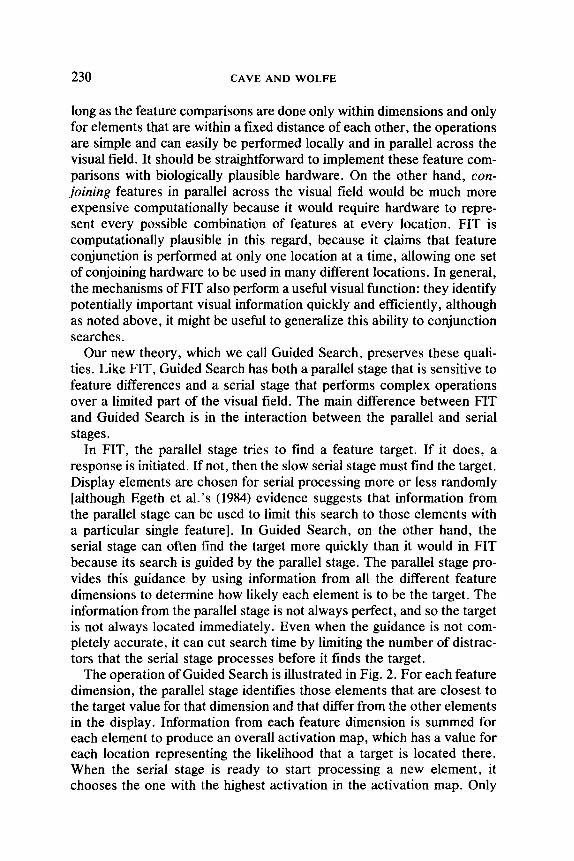
FIG. 1. Distribution of slopes for feature search, conjunction search, and search for a T among Ls. Feature slopes tend to be flat, T/L slopes tend to be steep, and conjunction slopes range from flat to steep.
color with orientation or size. They also found that with decreased stim- ulus salience they could obtain steeper slopes that resembled Treisman’s functions more closely.
Figures 1A and IB show the distribution of slopes from individual
MODELING VISUAL SEARCH 229
subjects for feature and conjunction searches. Only trials with a target present are shown here. These experiments were conducted in the man- ner described by Wolfe et al. (1989). Figure 1A displays combined data from three different feature searches. In each, the elements were small patches of oriented line segments. The target was defined by a differ- ence in color, orientation, or line width. All the subjects produce slopes near zero. Figure 1B shows data from a search for a conjunction of color and form (X vs. 0). The conjunction slopes are more widely distri- buted; some are about as flat as the feature slopes, but others are very steep.
These new data suggest that the difference between parallel and serial search might not be so clear-cut when the target is defined by a conjunc- tion of features. Because of the theoretical limitations described by Townsend (1972), drawing conclusions about parallel and serial process- ing from such data is tricky. Nevertheless, the wide variation in perfor- mance across subjects suggests that there might be some factor that varies from individual to individual that could make the difference between a clearly serial conjunction search and an almost parallel conjunction search.
Although some subjects in Wolfe et al.‘s (1989) experiments could find conjunction targets very quickly, their surprising performance did not extend to all types of visual search. In another experiment the target was a randomly oriented T embedded in a field of randomly oriented Ls. This task has produced clearly serial searches in other labs (for instance, Ju- lesz & Bergen, 1983), and it did so for Wolfe et al. (1989) as well. An example from T/L search is presented in Fig. lC, which shows that almost all the subjects produce steep slopes. Thus if there is a factor that controls the speed with which subjects can search for conjunction targets, it ap- parently cannot affect the speed of other visual searches, such as the T/L search.
GUIDED SEARCH
These problems require a new account of the early stages of visual cognition. A new theory should retain the scope and elegance of FIT while accounting for fast conjunction searches. Any new theory should also make sense computationally: operations that must be executed quickly and in parallel should be computationally simple, and operations that are computationally complex should take time and be executed in a limited fashion. Ideally it should be straightforward to implement the theory using biological hardware. Also, the proposed mechanisms should perform a useful function within a plausible visual system. They should not be designed solely to perform visual search experiments.
For the most part, FIT already makes good sense computationally. As
230 CAVE AND WOLFE
long as the feature comparisons are done only within dimensions and only for elements that are within a fixed distance of each other, the operations are simple and can easily be performed locally and in parallel across the visual field. It should be straightforward to implement these feature com- parisons with biologically plausible hardware. On the other hand, con- joining features in parallel across the visual field would be much more expensive computationally because it would require hardware to repre- sent every possible combination of features at every location. FIT is computationally plausible in this regard, because it claims that feature conjunction is performed at only one location at a time, allowing one set of conjoining hardware to be used in many different locations. In general, the mechanisms of FIT also perform a useful visual function: they identify potentially important visual information quickly and efficiently, although as noted above, it might be useful to generalize this ability to conjunction searches.
Our new theory, which we call Guided Search, preserves these quali- ties. Like FIT, Guided Search has both a parallel stage that is sensitive to feature differences and a serial stage that performs complex operations over a limited part of the visual field. The main difference between FIT and Guided Search is in the interaction between the parallel and serial stages.
In FIT, the parallel stage tries to find a feature target. If it does, a response is initiated. If not, then the slow serial stage must find the target. Display elements are chosen for serial processing more or less randomly [although Egeth et al’s (1984) evidence suggests that information from the parallel stage can be used to limit this search to those elements with a particular single feature]. In Guided Search, on the other hand, the serial stage can often find the target more quickly than it would in FIT because its search is guided by the parallel stage. The parallel stage pro- vides this guidance by using information from all the different feature dimensions to determine how likely each element is to be the target. The information from the parallel stage is not always perfect, and so the target is not always located immediately. Even when the guidance is not com- pletely accurate, it can cut search time by limiting the number of distrac- tors that the serial stage processes before it finds the target.
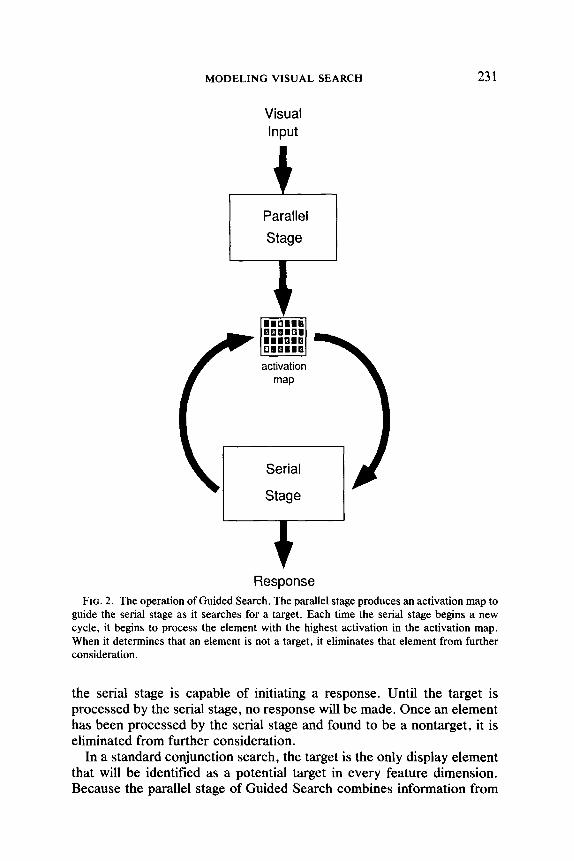
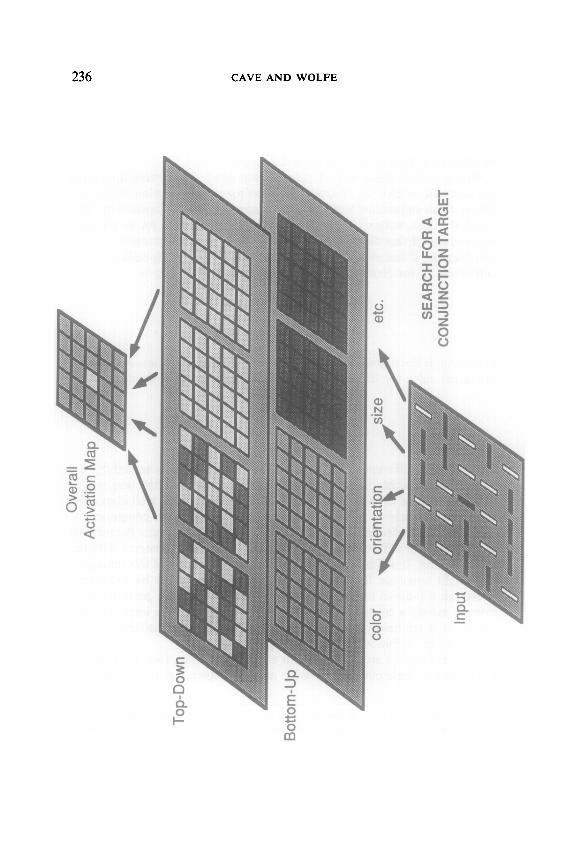
The operation of Guided Search is illustrated in Fig. 2. For each feature dimension, the parallel stage identifies those elements that are closest to the target value for that dimension and that differ from the other elements in the display. Information from each feature dimension is summed for each element to produce an overall activation map, which has a value for each location representing the likelihood that a target is located there. When the serial stage is ready to start processing a new element, it chooses the one with the highest activation in the activation map. Only
MODELING VISUAL SEARCH 231
Visual input
Parallel
Stage
activation
\
Serial F
Stage
Response FIG. 2. The operation of Guided Search. The parallel stage produces an activation map to
guide the serial stage as it searches for a target. Each time the serial stage begins a new cycle, it begins to process the element with the highest activation in the activation map. When it determines that an element is not a target, it eliminates that element from further consideration.
the serial stage is capable of initiating a response. Until the target is processed by the serial stage, no response will be made. Once an element has been processed by the serial stage and found to be a nontarget, it is eliminated from further consideration.
In a standard conjunction search, the target is the only display element that will be identified as a potential target in every feature dimension. Because the parallel stage of Guided Search combines information from

232 CAVE AND WOLFE
all the feature dimensions, it should be able to find a standard conjunction target immediately. However, we assume that the system performs less than perfectly because it is subject to a certain amount of noise. Because of this noise, on any given trial some of the distracters may be identified as being more promising than the target, and the serial stage will process them first.
As in FIT, the basic operations of the parallel stage are very simple. The only operations it requires are comparisons and summations, both of which can easily be implemented in biological hardware. Furthermore, only a relatively small number of operations are necessary for each loca- tion in the visual field, and so the parallel stage requires a reasonably small amount of hardware.
The manner in which the parallel stage guides the serial stage is similar to that in Hoffman’s (1978, 1979) two-stage model. Hoffman was moti- vated by data showing that subjects searching for targets among a series of letters could quickly rule out many distracters, but required a relatively long period of time to identify a target. He proposed a parallel stage to find a stimulus that was similar to one of the targets, and a serial stage to thoroughly compare that stimulus to each of the targets.
Guided Search demonstrates the advantage of combining this idea with FIT’s claim of parallel feature detection and serial feature integration. Guided Search also adds to this combination two other ideas. First, al- though the parallel stage cannot represent every possible combination of features at every location, it can combine information from different fea- ture dimensions to measure how likely a stimulus is to be a target. Sec- ond, the information produced by the parallel stage is less than perfect, and variations in its quality between subjects can lead to large individual differences in performance. The manner in which these ideas combine to form a working theory is illustrated by the computer simulation described below.
SIMULATION OF GUIDED SEARCH
The principles underlying Guided Search are simple, but predicting the amount of time necessary to perform different types of visual search is not always easy. Therefore, we have constructed a computer simulation of Guided Search. The following description of the simulation will also serve to illustrate in detail how the two stages interact.
The Parallel Stage
Like FIT, the modified theory uses a separate representation of the visual field for each feature dimension. In Guided Search, each of these representations is a single feature map, with each location holding an activation value. Thus each location in the visual field has one activation
MODELING VISUAL SEARCH 233
for color, another for orientation, and another for each of the remaining feature dimensions. Each activation value is made up of both a bottom-up and a top-down component.
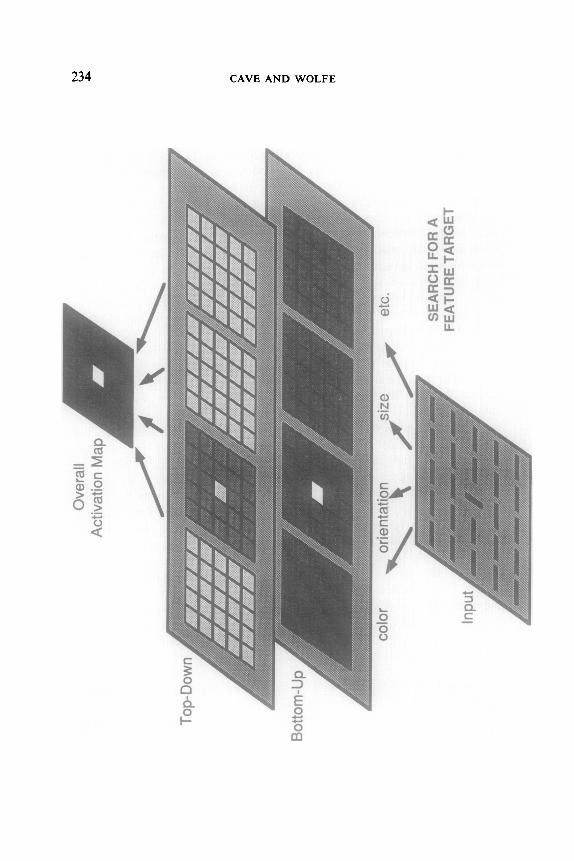
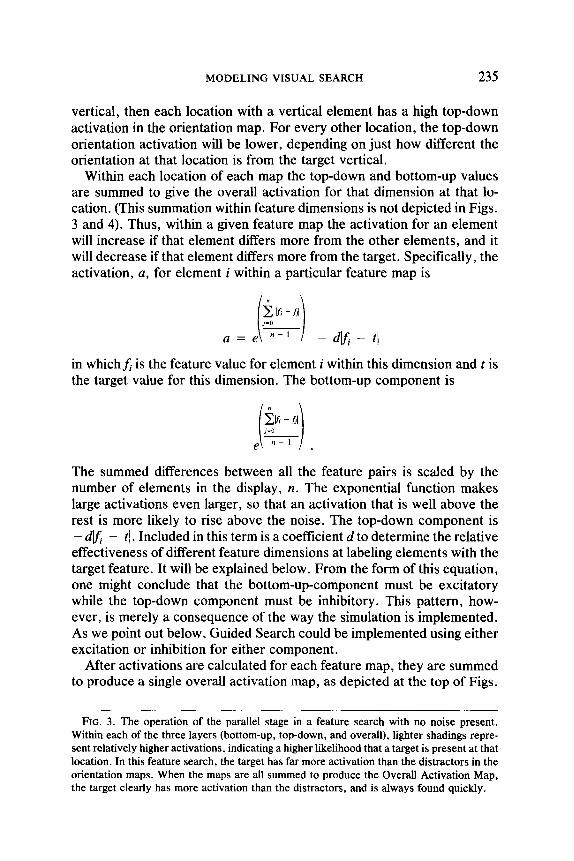
Figures 3 and 4 illustrate the operation of the parallel stage for a feature search and a conjunction search. At the bottom of each figure is the visual input. In the feature search in Fig. 3, the target is the vertical line in the center of the input pattern, and the distracters are all horizontal lines. In the conjunction search in Fig. 4, the target is again in the center and is again a black vertical line. In this case, the distracters are black horizontal lines and white vertical lines. Above the input pattern are separate feature maps for each feature dimension (color, orientation, size, etc.). In these diagrams we have split each feature map into two maps to show the effects of bottom-up and top-down activation separately. Each location in each feature map is shaded according to its activation; lighter shading represents a higher activation level.
The bottom-up component within each feature map does not depend on what target value is expected for that dimension, and will be the same even when nothing is known about what kind of target to expect. We assume that it is the basis for visual “pop-out” (Treisman, 1986). For a particular location within a particular feature map, the botton-up compo- nent is based on the difference between the value for that feature at that location and the value for every other location in the display. In Fig. 3, all elements have the same color. The bottom-up component of the color activation at a particular location is calculated by finding the difference between the color at that location and the color at each of the other locations, and then combining all these differences. Thus if every location in a display has the same color, all the differences will be zero, and the bottom-up component of the color activation at each location will be low. This is illustrated in Fig. 3 by the uniformly dark shading in the bottom-up map for color. On the other hand, there is one element that differs from the rest in orientation. The difference between that element’s orientation and every other orientation will be nonzero, and these differences will all combine to produce a high activation at that location, as can be seen at the center location of the bottom-up orientation map. For each of the other locations, however, the orientation differs from only one other orientation in the display. For each of these elements, all but one of the differences to be combined will be zero, and the bottom-up component of the orien- tation activation for each element is low.
The top-down component contributes to feature searches as well, but is more important in conjunction searches. It depends on knowledge of the target to be found. The top-down component for each location within a particular feature map is simply the similarity between the feature at that location and the target value for that feature dimension. If the target is
234 CAVE AND WOLFE
MODELING VISUAL SEARCH 235
vertical, then each location with a vertical element has a high top-down activation in the orientation map. For every other location, the top-down orientation activation will be lower, depending on just how different the orientation at that location is from the target vertical.
Within each location of each map the top-down and bottom-up values are summed to give the overall activation for that dimension at that lo- cation. (This summation within feature dimensions is not depicted in Figs. 3 and 4). Thus, within a given feature map the activation for an element will increase if that element differs more from the other elements, and it will decrease if that element differs more from the target. Specifically, the activation, a, for element i within a particular feature map is
&I
i 1
j=O
ace n-' - dK - tl
in which& is the feature value for element i within this dimension and t is the target value for this dimension. The bottom-up component is
The summed differences between all the feature pairs is scaled by the number of elements in the display, n. The exponential function makes large activations even larger, so that an activation that is well above the rest is more likely to rise above the noise. The top-down component is - dk - tl . Included in this term is a coefficient d to determine the relative effectiveness of different feature dimensions at labeling elements with the target feature. It will be explained below. From the form of this equation, one might conclude that the bottom-up-component must be excitatory while the top-down component must be inhibitory. This pattern, how- ever, is merely a consequence of the way the simulation is implemented. As we point out below, Guided Search could be implemented using either excitation or inhibition for either component.
After activations are calculated for each feature map, they are summed to produce a single overall activation map, as depicted at the top of Figs.
FIG. 3. The operation of the parallel stage in a feature search with no noise present. Within each of the three layers (bottom-up, top-down, and overall), lighter shadings repre- sent relatively higher activations, indicating a higher likelihood that a target is present at that location. In this feature search, the target has far more activation than the distracters in the orientation maps. When the maps are all summed to produce the Overall Activation Map, the target clearly has more activation than the distracters, and is always found quickly.
236 CAVE AND WOLFE
I- m
MODELING VISUAL SEARCH 237
3 and 4. This map represents the parallel stage’s “opinion” of how likely the stimulus at each location is to be the target. Whenever the serial process is ready to begin processing a new element, it chooses the one with the highest activation in the overall activation map, after first elim- inating those that have been processed in previous cycles.
The Serial Stage
In Guided Search, the parallel stage cannot determine that an element is the target. It can only suggest probable targets. Thus, even in feature searches the target must be selected and processed by the serial stage before the response is made. The simulation says little about how the serial stage operates, except that it is capable of deciding conclusively whether or not an element is the target. The serial stage is undoubtedly a large collection of complex processing mechanisms. For present pur- poses, the important aspect of these mechanisms is that they operate over a limited part of the visual field at any one time, and that they use the quickly-prepared evidence from the parallel stage to decide what to pro- cess next.
The serial stage does not necessarily have to process every element in the display when there is no target present. The simulation stops process- ing elements when the activations of all the unprocessed elements are below a certain threshold. This mechanism prevents the simulation from wasting time searching exhaustively through a display for a target that is not present. After fully examining the performance of the simulation on trials in which a target is present, we will explore methods for terminating searches in more detail.
In a sense, the serial stage chooses elements by working its way down a list provided by the parallel stage. The elements in the display are ordered on the list by activation level, with the highest activations at the top of the list. Those elements with activations below the threshold are not placed on the list, and will not be processed by the serial stage. If the serial stage reaches the end of the list without finding a target, it con- cludes that no target is present and stops searching.
The order in which subjects process the elements in a search display might be affected in part by their preferences for certain regions of the display. For instance, because of habits developed in reading, subjects may start searching in the upper left of the display. Also, a subject who finds a target in a particular region in one trial may begin searching in that
FIG. 4. The operation of the parallel stage in a conjunction search with no noise present. As with the feature search, the target activation in the Overall Activation Map is still higher than the distracters, but the activation gap is much smaller. If noise is added, the target will sometimes be obscured.

238 CAVE AND WOLFE
same region in the next trial. Such search strategies depend on higher- level cognitive factors that are beyond the scope of Guided Search, but they could easily work in tandem with the activation mechanisms of Guided Search. This sort of bias for searching certain regions might be implemented by manipulating the top-down activation for elements in those areas, or it might be done by a separate mechanism not included in Guided Search. In matching the simulation’s performance against exper- imental data, such high-level search strategies are not a concern. As long as the elements in the experimental displays are positioned randomly, the data on the average should be the same whether or not subjects consis- tently search certain regions first.
The simulation assumes that the time to process a single element is constant. Indeed, the time necessary for subjects to shift the serial stage from one element to another is likely to be constant across different visual search tasks. However, once the serial stage has shifted, the time neces- sary to process an element may vary depending on what sort of process- ing is necessary to differentiate targets from distracters. This variation in processing time can complicate the interpretation of visual search data, because the slope of the response-time-by-set-size function can depend on two different factors. An increase in slope from one condition to an- other might mean that more elements are being processed, or it might mean that more time is necessary to process each individual element. It is important to consider this ambiguity whenever comparing results from different visual search experiments.
It would be difficult to interpret slope differences between two search tasks if there were good reason to expect that processing each element in one search task would take longer than in the other. However, whenever Wolfe et al. (1989) compared the slopes from two visual searches, they generally used stimuli that were as similar as possible in the two condi- tions, and so the time necessary to process a single element in the two conditions was probably about equal. The simulation appears to provide a good explanation for the differences between conditions and even be- tween subjects, and thus it lends credibility to the assumption. Unless an explanation based on differences in processing times for individual ele- ments can account for the data better than the simulation, the equal-time assumption appears reasonable.
Noise
If the parallel stage worked perfectly, then in both feature and conjunc- tion searches the serial stage would always choose the target first, and response times for both types of search would be fast regardless of the number of distracters. Obviously this conflicts with the data, and so in the simulation there is a certain amount of noise in the output of the parallel
MODELING VISUAL SEARCH 239
stage, which reduces the ability of the parallel stage to guide the serial stage and thus slows down searches in some conditions. Noise would be expected in any system such as the parallel stage which must be imple- mented with relatively simple neural hardware and which must produce information very quickly.
When a new stimulus is first presented to the simulation, the values from each of the feature maps are added to the overall activation map. Also added to each location is a noise value. The noise values are nor- mally distributed, and the variance of the distribution is determined by a preset parameter that is assumed to vary between subjects (but not be- tween different types of search). Because of this noise, the highest acti- vation may belong to one of the nontargets. The uncertainty introduced by this noise reduces the reliability of the parallel stage. Thus the final decision about an element is left to the serial stage.
The noise is added to the output of the parallel stage. Guided Search makes no commitment to the origin of the noise, other than that it occurs early enough to affect the serial stage’s choice. It could be in the original stimuli, the input to the parallel stage, the feature maps, the overall ac- tivation map, the transfer of information between the different maps, the transfer of information between the parallel and serial stages, or some combination of these.
Apparently some feature dimensions are more effective at separating targets and distracters than others (Bundesen & Pedersen, 1983; Carter, 1982; Egeth et al., 1984; Farmer & Taylor, 1980; Green & Anderson, 1956; Smith, 1962; Treisman & Sato, in press). Examples of feature and conjunction search often involve color, because targets defined by color often seem to be easier to find than targets defined by other dimensions. The simulation allows a separate level of effectiveness to be set for each dimension for the top-down component of the activation. In the examples below, the simulation parameters were set so that it could use color information more effectively than orientation information. This ability to adjust the relative effectiveness of feature dimensions has important im- plications for search patterns when the noise is at an intermediate level, as the examples below will show.
EXAMPLES OF SIMULATION PERFORMANCE
Each cycle of the simulation corresponds to a single shift of the serial stage. In each cycle, the program simulates the serial stage by choosing the location with the highest activation and determining whether or not the element at that location is the target. If it is, the search ends. If not, that location is excluded from further consideration and a new cycle begins. The interesting result produced by the simulation is the number of
240 CAVE AND WOLFE
cycles necessary to find the target. The pattern of cycle times in different search conditions should reflect the pattern of response times from the corresponding conditions of visual search experiments.
The results shown below are all from trials in which a target is present. In all visual search experiments, however, the target is absent for a subset of the trials. In the data collected by Wolfe et al. (1989), and also in data from other visual search experiments, results from target-present trials tend to be more orderly and consistent than those from target-absent trials. Target-absent trials almost always produce longer response times, and the slope of the response time function is usually greater, but the magnitude of these differences varies from task to task and from subject to subject. Following the examples from target-present trials, there is a discussion of why there is so much variation in the results from target- absent trials and how the simulation handles them.
Feature Search
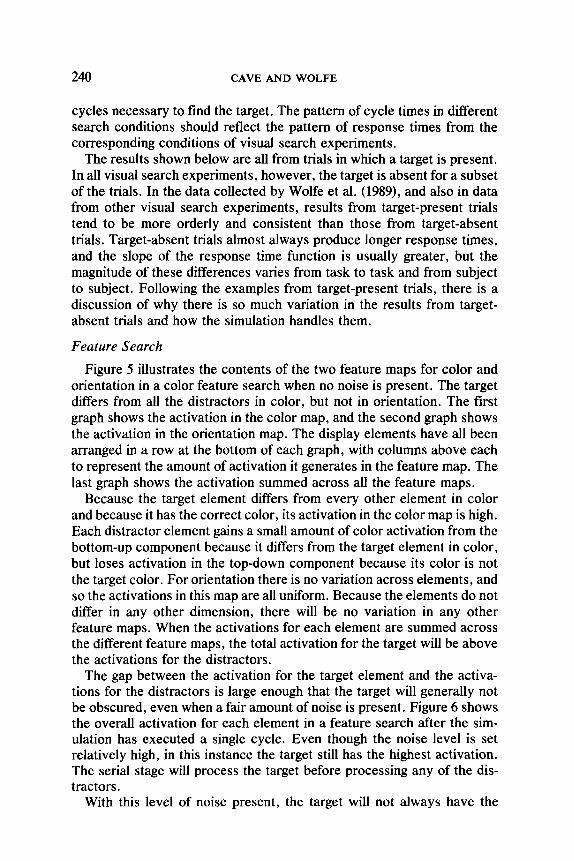
Figure 5 illustrates the contents of the two feature maps for color and orientation in a color feature search when no noise is present. The target differs from all the distracters in color, but not in orientation. The first graph shows the activation in the color map, and the second graph shows the activation in the orientation map. The display elements have all been arranged in a row at the bottom of each graph, with columns above each to represent the amount of activation it generates in the feature map. The last graph shows the activation summed across all the feature maps.
Because the target element differs from every other element in color and because it has the correct color, its activation in the color map is high. Each distractor element gains a small amount of color activation from the bottom-up component because it differs from the target element in color, but loses activation in the top-down component because its color is not the target color. For orientation there is no variation across elements, and so the activations in this map are all uniform. Because the elements do not differ in any other dimension, there will be no variation in any other feature maps. When the activations for each element are summed across the different feature maps, the total activation for the target will be above the activations for the distracters.
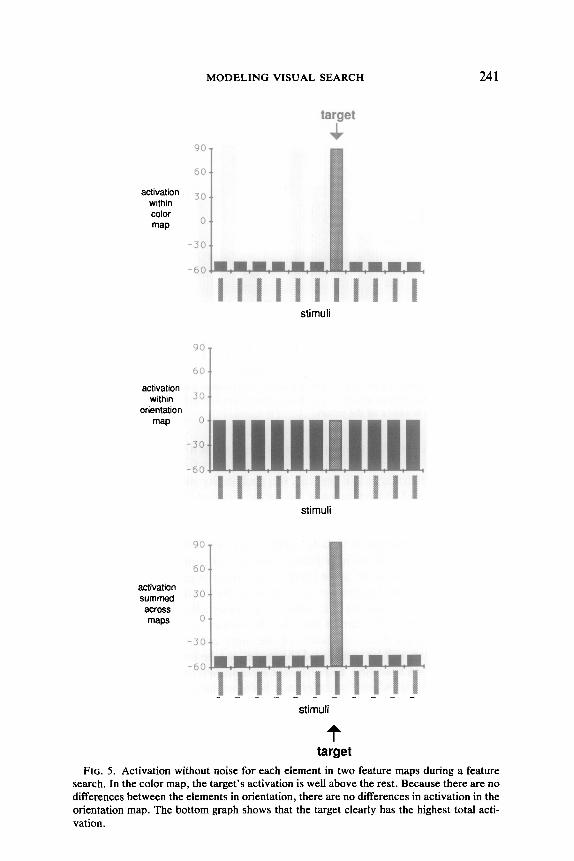
The gap between the activation for the target element and the activa- tions for the distracters is large enough that the target will generally not be obscured, even when a fair amount of noise is present. Figure 6 shows the overall activation for each element in a feature search after the sim- ulation has executed a single cycle. Even though the noise level is set relatively high, in this instance the target still has the highest activation. The serial stage will process the target before processing any of the dis- tractors.
With this level of noise present, the target will not always have the
MODELING VISUAL SEARCH 241
target
90
60
a%$;” 30
color map
0
-30
-60
stimuli
90
60
activation within 30 1
orientation map
stimuli
activation summed
across maps
-60
stimuli
f target
FIG. 5. Activation without noise for each element in two feature maps during a feature search. In the color map, the target’s activation is well above the rest. Because there are no differences between the elements in orientation, there are no differences in activation in the orientation map. The bottom graph shows that the target clearly has the highest total acti- vation.
242 CAVE AND WOLFE
-50
overall activation
-100
-150
-200
Stimuli
FIG. 6. The overall activation is a feature search, with noise at a relatively high level. The asterisk marks the element with the highest activation. Even with a fair amount of noise, the target activation is above all the others.
highest activation after the first cycle. In some trials it will not be until the second or third cycle, although it will always be found fairly quickly. When more distracters are present, the probability increases that one or two of them will at first surpass the target element, and so the average number of cycles necessary to find the target will rise somewhat. Such a hint of a slope actually appears in the data from many feature search experiments (Treisman & Gelade, 1980; Treisman, 1986). The slope pro- duced by the simulation in a feature search will normally not be very large, though, unless the noise level is extremely high.
There is one way to produce a steep slope for feature searches in the simulation without raising the noise to an unusually high level. If the difference between the target and the distracters is very small (for in- stance, if they are different shades of the same color), the activations in the feature map will be small, and the target can be lost in the noise as it is in conjunction searches. Experiments have shown that feature searches can become serial when the difference between target and distracters is diminished (Triesman & Gormican, 1988), and so the simulation handles these situations as it should.
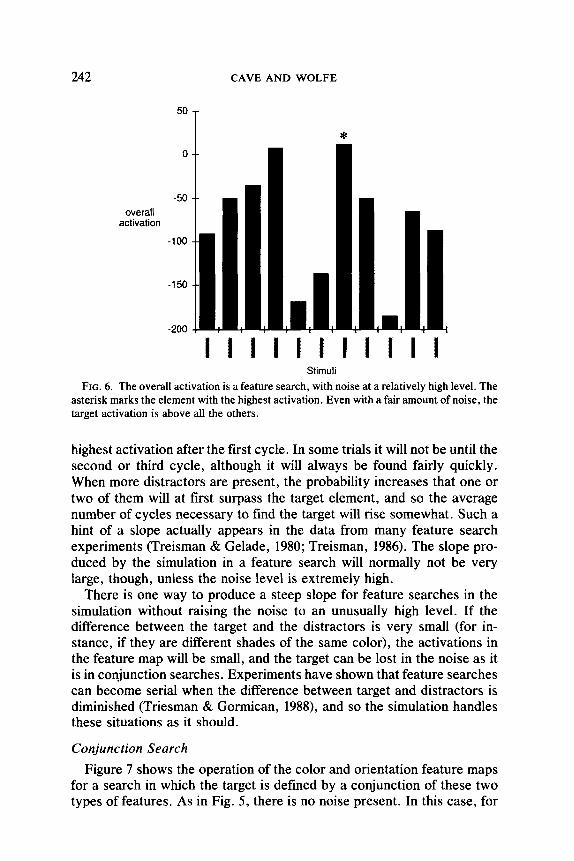
Conjunction Search Figure 7 shows the operation of the color and orientation feature maps
for a search in which the target is defined by a conjunction of these two types of features. As in Fig. 5, there is no noise present. In this case, for
MODELING VISUAL SEARCH 243
90
60
I
target activation 3 0
within color map
0
-30
-$O
stimuli
60
activation within 30
orientation map 0
-30
-60
stimuli
60
activation summed 3o
across maps 0
-30
-60
target FIG. 7. Activation without noise for each element in two feature maps during a conjunc-
tion search. The target is the only element to have a high activation in both the color and orientation maps. When the two maps are summed, the target has the highest activation, as with the feature search, although the difference is much less.
244 CAVE AND WOLFE
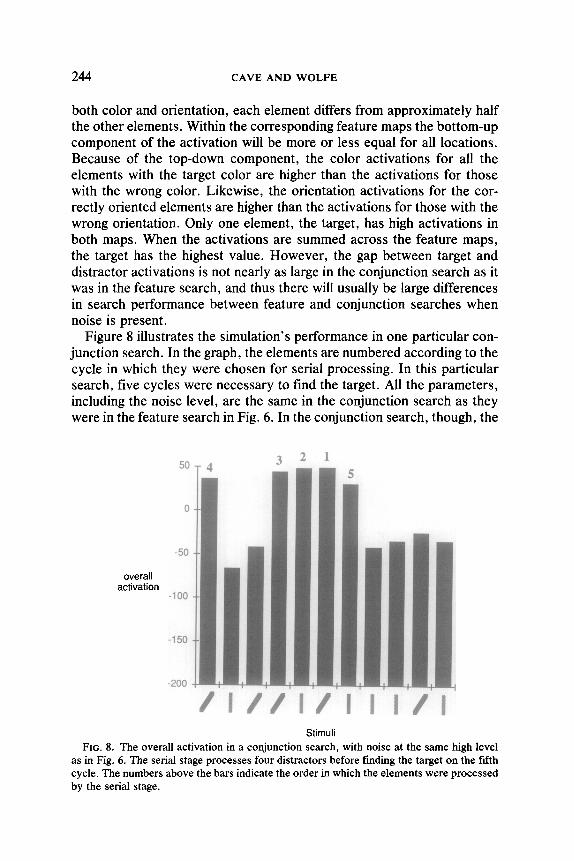
both color and orientation, each element differs from approximately half the other elements. Within the corresponding feature maps the bottom-up component of the activation will be more or less equal for all locations. Because of the top-down component, the color activations for all the elements with the target color are higher than the activations for those with the wrong color. Likewise, the orientation activations for the cor- rectly oriented elements are higher than the activations for those with the wrong orientation. Only one element, the target, has high activations in both maps. When the activations are summed across the feature maps, the target has the highest value. However, the gap between target and distractor activations is not nearly as large in the conjunction search as it was in the feature search, and thus there will usually be large differences in search performance between feature and conjunction searches when noise is present.
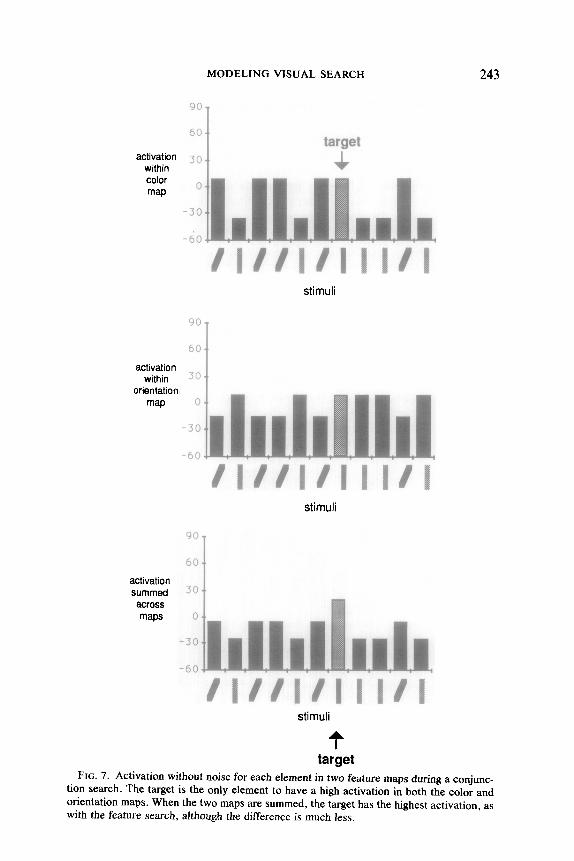
Figure 8 illustrates the simulation’s performance in one particular con- junction search. In the graph, the elements are numbered according to the cycle in which they were chosen for serial processing. In this particular search, five cycles were necessary to find the target. All the parameters, including the noise level, are the same in the conjunction search as they were in the feature search in Fig. 6. In the conjunction search, though, the
activation
50
0
-50
-100
-150
-200
2 1
Stimuli FIG. 8. The overall activation in a conjunction search, with noise at the same high level
as in Fig. 6. The serial stage processes four distractors before finding the target on the fifth cycle. The numbers above the bars indicate the order in which the elements were processed by the serial stage.
MODELING VISUAL SEARCH 245
target is at first lost in the noise. In the first cycle, the highest overall activation belonged to the element in the sixth position on the graph, which is labeled with a numeral 1. The serial stage processed this element and determined that this element was not the target, and it was eliminated from further consideration. This is consistent with experimental findings on the “inhibition of return,” which suggest that a mechanism exists to limit the activation of locations that the serial stage has already processed (Klein, 1988; Posner & Cohen, 1984). In cycles 2, 3, and 4, three more elements were processed and eliminated, and they are labeled accordingly in the graph. Finally, in cycle 5, the element with the largest activation was the target. It was processed by the serial stage and the search ended.
On the average, the number of cycles necessary to find the target will increase with the level of noise. It will also increase with the number of distracters, because with more elements in the display the probability decreases that the highest activation will belong to the target. Thus the average number of cycles necessary to find the target (in a sense, the simulation’s “response time”) will increase steadily with the number of distracters, yielding slopes similar to those found in conjunction search experiments.
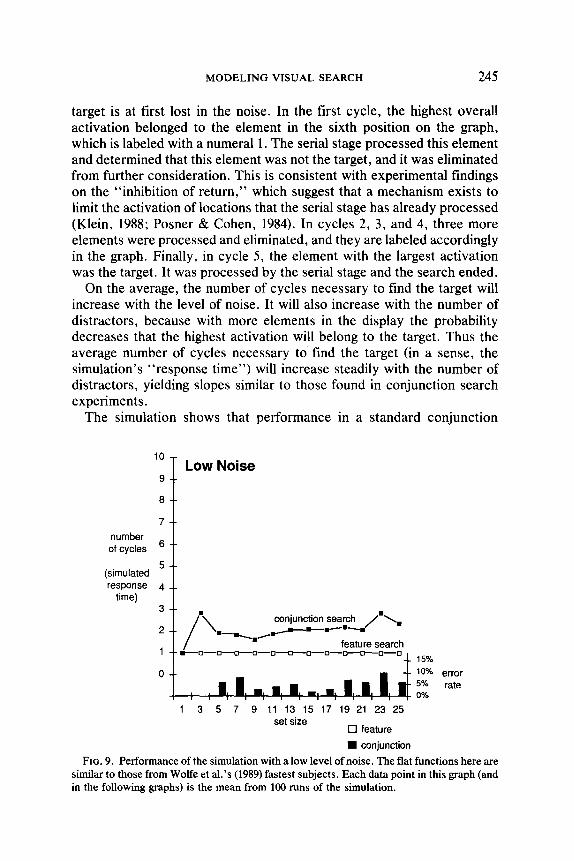
The simulation shows that performance in a standard conjunction
10 - Low Noise
9 --
8 --
7 --
number of cycles 6 --
5 -- (simulated response 4 __
time) 3 -- 2 --
/
n \m-m,- -.-. -.-¤-. /‘\. conjunction search
1 feature search
-- .-b-a-O----O-O-I-o 4 15%
0 -- -- 10% error
I: I; q I; I, I; 1; I; I: 5”/. rate
I 0%
1 3 5 7 9 11 13 15 17 19 21 23 25 set size
0 feature
W conjunction
FIG. 9. Performance of the simulation with a low level of noise. The flat functions here are similar to those from Wolfe et al.‘s (1989) fastest subjects. Each data point in this graph (and in the following graphs) is the mean from 100 runs of the simulation.
246 CAVE AND WOLFE
10
9
8
number 6 of cycles
5 (simulated response 4
time) 3
2
0
High Noise
/
. conjunction search
/ .\/’
/=
.‘. /
/
/ .‘.
feature search n -m
1: / m---o
,,-•-+d ,/h-d0
I
error rate
1 3 5 7 9 11 13 15 17 19 21 23 25 set size Cl feature
W conjunction
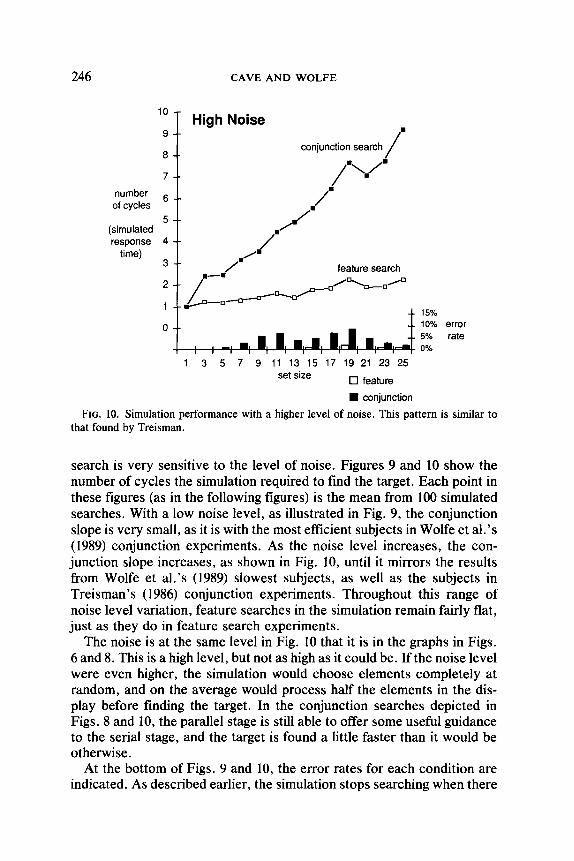
FIG. 10. Simulation performance with a higher level of noise. This pattern is similar to that found by Treisman.
search is very sensitive to the level of noise. Figures 9 and 10 show the number of cycles the simulation required to find the target. Each point in these figures (as in the following figures) is the mean from 100 simulated searches. With a low noise level, as illustrated in Fig. 9, the conjunction slope is very small, as it is with the most efficient subjects in Wolfe et al’s (1989) conjunction experiments. As the noise level increases, the con- junction slope increases, as shown in Fig. 10, until it mirrors the results from Wolfe et al.‘s (1989) slowest subjects, as well as the subjects in Treisman’s (1986) conjunction experiments. Throughout this range of noise level variation, feature searches in the simulation remain fairly flat, just as they do in feature search experiments.
The noise is at the same level in Fig. 10 that it is in the graphs in Figs. 6 and 8. This is a high level, but not as high as it could be. If the noise level were even higher, the simulation would choose elements completely at random, and on the average would process half the elements in the dis- play before finding the target. In the conjunction searches depicted in Figs. 8 and 10, the parallel stage is still able to offer some useful guidance to the serial stage, and the target is found a little faster than it would be otherwise.
At the bottom of Figs. 9 and 10, the error rates for each condition are indicated. As described earlier, the simulation stops searching when there

MODELING VISUAL SEARCH 241
are no elements left with an activation above a termination threshold. Occasionally the simulation stops too early and misses a target. The error rates presented at the bottom of these graphs are the percentages of trials in which a target was present but not processed by the serial stage. The mechanism that the simulation uses for deciding when to end a search is discussed in the section on target-absent trials. Note that whether the noise level is low or high, the simulation makes many more errors in conjunction searches than in feature searches.
As mentioned above, the simulation is adjusted so that the top-down activation is more effective for color than orientation in searches. As long as the noise is not extremely high, distracters with the target color will tend to have higher activations than distracters with the target orienta- tion. The elements chosen for serial processing will generally be those with the target color.
Thus with an intermediate level of noise the simulation is able to limit its search to elements that have the correct value for one salient feature, and thereby eliminate a large number of distracters. Egeth et al. (1984) showed that their subjects could use such a search strategy. In the search depicted in Fig. 8, four of the five elements chosen by the serial process had the target color. For the most part, the simulation is able to avoid those elements with the wrong color, just as Egeth et al.‘s (1984) subjects did. Elements with the wrong color are typically avoided in searches with this level of noise, and with less noise the simulation will avoid them even more often. This pattern is also consistent with Nakayama and Silver- man’s (1986a, 1986b) results. Apparently top-down activation is very ef- fective for size and stereoscopic depth, and subjects can easily eliminate those elements with the wrong values on either of these dimensions.
The differences in top-down activation across dimensions are imple- mented by multiplying the top-down component in each feature map by a coefficient. This coefficient (d in the equation present earlier) has a dif- ferent value for each feature dimension. In the simulation, the coefficient for the color dimension is assigned a higher value than that for the ori- entation dimension. As a result, the activation gap between elements with target and distractor features is larger in the color graph of Fig. 7 than in the orientation graph, and in the summation graph those distracters with the target color have a higher activation than those with the target orien- tation. Of course, the relative effectiveness of a given dimension can also be manipulated by choosing feature values for the target and distracters that are further apart.
Because of this coefficient, one must be careful in generating predic- tions with Guided Search, because it is not possible to know a priori how well different types of target features will be identified. Of course, this same difficulty exists as long as the scale on which feature values are
248 CAVE AND WOLFE
encoded in each dimension are not known. Additionally, without knowing the value ford beforehand, it is impossible to predict the balance between top-down and bottom-up activation for a given dimension, and so clear predictions will be difficult when the two types of activation are working in different directions. However, there can only be one value for d for each dimension, regardless of the type of search or the other features involved. This constraint makes it possible to adequately test Guided Search by comparing results from different types of search using the same set of feature values.
This explanation for Egeth et al.‘s (1984) data seem less than complete. In one condition, their subjects were able to almost completely exclude elements with the wrong color. In a second condition, they were able to almost completely exclude elements of the wrong shape. If they could use both of these dimensions so effectively, then in a standard conjunction of color and shape they should have found targets in parallel. Instead, their standard conjunction slopes were about as steep as those of Treisman and Gelade (1980).
One way to explain this discrepancy is to assume that subjects have a fixed amount of top-down activation that they can allocate across dimen- sions. When they are instructed to attend to color, and when most of the distracters have the wrong color, they will devote most or all of their activation to color, so that distracters with the wrong color are very effectively excluded. When the instructions and the distracters emphasize shape over color, subjects shift their activation accordingly. With no instructions and a balance of color and shape distracters, they split the activation, and neither type of distractor is effectively excluded.
However, Guided Search offers a better explanation that does not re- quire an overall limit on top-down activation. This explanation relies on a close examination of Egeth et al’s (1984) experiments, which included two different types of conjunction search. Their “confounded” condition is a standard conjunction search, in which the distracters are split evenly between two types. In the “unconfounded” condition, there is always a fixed number of one type of distractor. For instance, in the color version of the unconfounded condition, there are always two distracters with the target color. The striking fact about their results is that as more elements with the wrong color are added to the display in the unconfounded con- dition, the slope rises very little. Given the steep standard conjunction slopes, the top-down activation alone should not be strong enough to effectively prevent these new distracters from adding to the slope.
In Guided Search, however, the top-down activation does not have to work single-handedly. As more wrong-color distracters are added, they increase the bottom-up activation for all the elements with the target color, and decrease it for all the elements with the wrong color. So as each
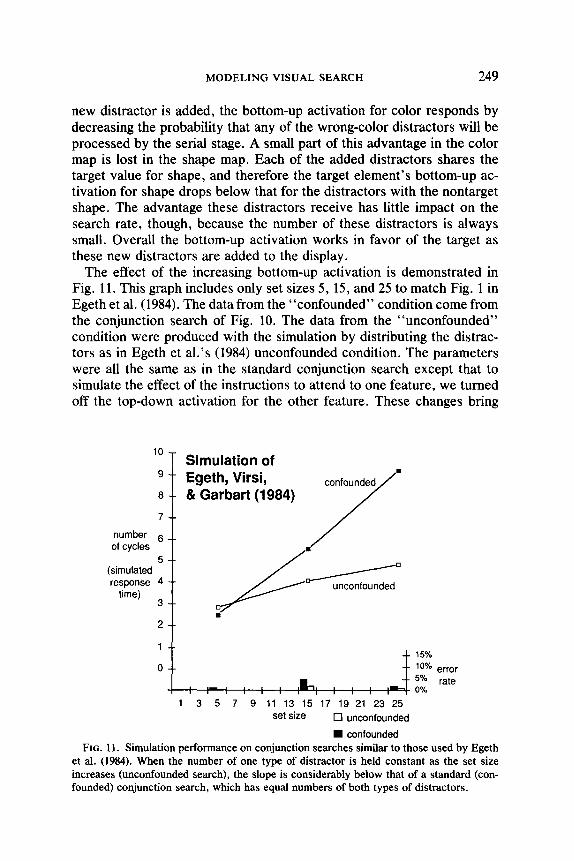
MODELING VISUAL SEARCH 249
new distractor is added, the bottom-up activation for color responds by decreasing the probability that any of the wrong-color distracters will be processed by the serial stage. A small part of this advantage in the color map is lost in the shape map. Each of the added distracters shares the target value for shape, and therefore the target element’s bottom-up ac- tivation for shape drops below that for the distracters with the nontarget shape. The advantage these distracters receive has little impact on the search rate, though, because the number of these distracters is always small. Overall the bottom-up activation works in favor of the target as these new distracters are added to the display.
The effect of the increasing bottom-up activation is demonstrated in Fig. 11. This graph includes only set sizes 5, 15, and 25 to match Fig. 1 in Egeth et al. (1984). The data from the “confounded” condition come from the conjunction search of Fig. 10. The data from the “unconfounded” condition were produced with the simulation by distributing the distrac- tors as in Egeth et al.‘s (1984) unconfounded condition. The parameters were all the same as in the standard conjunction search except that to simulate the effect of the instructions to attend to one feature, we turned off the top-down activation for the other feature. These changes bring
10 -
9 --
8 --
7 --
number 6 of cycles
5 -- (simulated response 4 --
time) 3 --
Simulation of Egeth, Virsi, 81 Garbart (1984)
1 15%
lo% error --.
1 3 5 7 9 11 13 15 17 19 21 23 25 set size 0 unconfounded
I confounded FIG. 11. Simulation performance on conjunction searches similar to those used by Egeth
et al. (1984). When the number of one type of distractor is held constant as the set size increases (unconfounded search), the slope is considerably below that of a standard (con- founded) conjunction search, which has equal numbers of both types of distracters.

250 CAVE AND WOLFE
down the slope considerably, just as they did in Egeth et al’s experi- ments. Guided Search therefore suggests that their subjects were able to effectively exclude the distracters with one nontarget feature because of the bottom-up activation generated by their distribution of distracters, and that their subjects were not able to effectively exclude these distrac- tors in a standard conjunction search with an equal number of two dis- tractor types.
Triple Conjunction Search
Wolfe et al. (1989) performed “triple conjunction” experiments in which the target was defined by a combination of color, form, and size. Similar triple conjunction experiments were conducted by Quinlan and Humphreys (1987) and by Treisman and Sato (in press). At first glance, one might expect that more time would be required for each element when three features must be processed. If so, slopes should be steeper for triple conjunctions than for the standard variety. However, Guided Search pre- dicts a different result for some triple conjunction searches.
All these researchers used two types of triple conjunction search. In one, each distractor shares one of the three relevant features with the target. In the other, each distractor has two of the target features. Ac- cording to Guided Search, slopes for a one-feature search should be lower than for a two-feature search with the same feature differences, and slopes for standard conjunctions should generally fall somewhere in be- tween, as explained below.
The differences in performance between these three types of search are the result of both bottom-up and top-down activation. To illustrate these differences, let us first assume that the feature differences in all three of the relevant dimensions have been normalized, so that target and distrac- tor features can be discriminated equally well in all three dimensions. In a standard conjunction search, within either of the two relevant feature maps, half the elements will have the target value for that feature dimen- sion and half will have another value. Because each element differs from about half the other elements in a given feature dimension, they will all have about the same amount of bottom-up activation for that particular dimension, and bottom-up activation will be of no help in finding the target. In a triple conjunction search with one shared feature, only one- third of the elements will have the target feature for a particular dimen- sion, and two-thirds will have a nontarget feature. The elements with the target feature will have a higher bottom-up activation for that dimension, because they differ from relatively more elements. The target element will be the only one with higher bottom-up activation in all three of the rele- vant feature maps, and so it will have a higher overall bottom-up activa- tion than any of the distracters. Thus bottom-up activation will direct the
MODELING VISUAL SEARCH 251
serial stage to the target more quickly for a one-feature triple conjunction than for a standard conjunction. In a triple conjunction search with two shared features, two-thirds of the elements will have the target feature in any one of the three relevant dimensions, and thus those with the target feature will have lower bottom-up activations than those with the nontar- get feature. Because the target element will have a lower bottom-up ac- tivation in every relevant feature map, it will have a lower overall bottom- up activation. With two shared features, the bottom-up activation actually works against finding the target.
The one-feature triple conjunction target also does better than the stan- dard conjunction target in top-down activation. In each of the relevant feature maps, those elements with the target feature will receive more top-down activation than those with the nontarget feature. In the one- feature triple conjunction, the target receives high top-down activation in all three maps, but each of the distracters only receives high activation in one of the three. Because the feature maps are summed to produce an overall activation map, the double advantage for the target element means that it will generally have a much higher top-down activation than the distracters. In a standard conjunction, all the distracters have the target value in one of the two relevant feature dimensions, and thus all receive high top-down activation in the corresponding feature map. The target still receives high top-down activation in three feature maps (the two in which features are varied and the one in which they are not), but each distractor receives high activation in two of the three. The target element still has an advantage, but it is not as great. Thus, the gap between top-down activation for target and distracters is larger in one-feature triple conjunctions than in standard conjunctions, just as it is for bottom- up activation. In the two-feature triple conjunction, each distractor re- ceives high top-down activation in two of the three maps and so the top-down target gap for these searches should be comparable to standard conjunction searches.
These activation differences lead to the conclusion that one-feature triple conjunctions should exhibit slopes less than those of standard con- junctions, and two-feature triple conjunctions should exhibit slopes greater than those of standard conjunctions. These relationships become more complicated, however, if feature differences are not equally salient across dimensions. Only two of the three dimensions are relevant in the standard conjunction. The exact relationships between the slopes for standard and triple conjunctions depends on the relative effectiveness of the three feature dimensions, the differences between target and distrac- tor features in each, and which two of the three features are used in the standard conjunction. If the dimension that is not used is a particularly effective one, then standard conjunction performance will be relatively
252 CAVE AND WOLFE
lower when compared against triple conjunction performance. If the un- used dimension is particularly poor, then standard conjunction perfor- mance will be relatively better. [Note that Quinlan and Humphreys (1987) and Treisman and Sato (in press) used three different standard conjunc- tions with the three different possible combinations of dimensions, whereas Wolfe et al. (1989) used only a single type of triple conjunction.] Regardless of these variations, two-feature triple conjunctions should al- ways yield larger slopes than one-feature triple conjunctions when the same feature values are used, and standard conjunction slopes should usually fall somewhere in between the two.
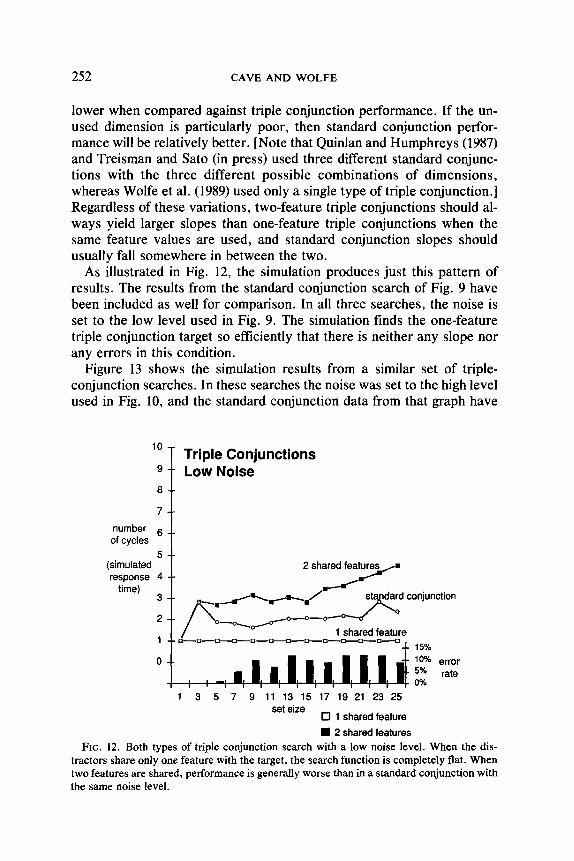
As illustrated in Fig. 12, the simulation produces just this pattern of results. The results from the standard conjunction search of Fig. 9 have been included as well for comparison. In all three searches, the noise is set to the low level used in Fig. 9. The simulation finds the one-feature triple conjunction target so efficiently that there is neither any slope nor any errors in this condition.
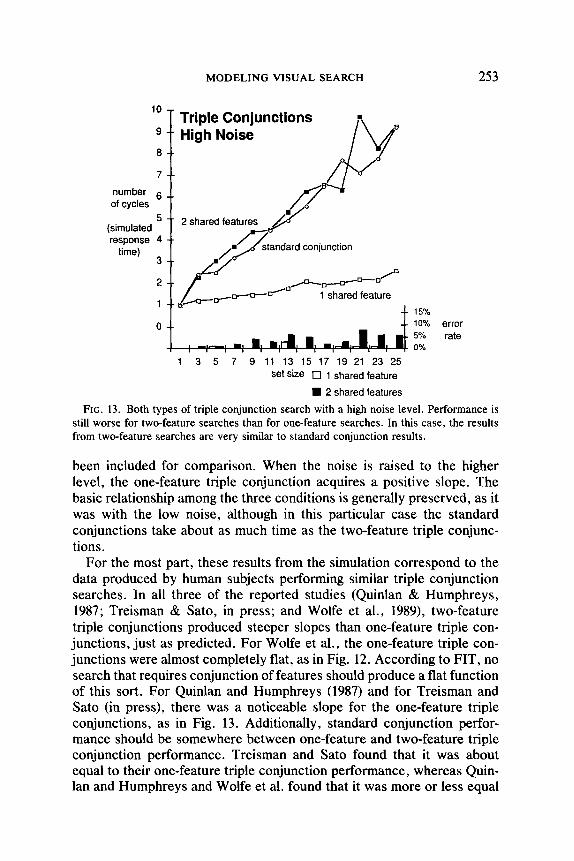
Figure 13 shows the simulation results from a similar set of triple- conjunction searches. In these searches the noise was set to the high level used in Fig. 10, and the standard conjunction data from that graph have
10
?
Triple Conjunctions 9 Low Noise 8
7
number 6 of cycles t
response time)
-c+/o---- 1 shared feature
a-O--O-D-O-D-D-O-O--- -- 15%
set size 0 1 shared feature
n 2 shared features FIG. 12. Both types of triple conjunction search with a low noise level. When the dis-
tractors share only one feature with the target, the search function is completely flat. When two features are shared, performance is generally worse than in a standard conjunction with the same noise level.
MODELING VISUAL SEARCH 253
lo Triple Conjunctions n
g -- High Noise 8 -- 7 --
number of cycles
6
5 -- 2 shared features
1 shared feature
0 --
15%
10% error 5% rate 0%
1 3 5 7 9 11 13 15 17 19 21 23 25 set size 0 1 shared feature
n 2 shared features
FIG. 13. Both types of triple conjunction search with a high noise level. Performance is still worse for two-feature searches than for one-feature searches. In this case, the results from two-feature searches are very similar to standard conjunction results.
been included for comparison. When the noise is raised to the higher level, the one-feature triple conjunction acquires a positive slope. The basic relationship among the three conditions is generally preserved, as it was with the low noise, although in this particular case the standard conjunctions take about as much time as the two-feature triple conjunc- tions .
For the most part, these results from the simulation correspond to the data produced by human subjects performing similar triple conjunction searches. In all three of the reported studies (Quinlan & Humphreys, 1987; Treisman & Sato, in press; and Wolfe et al., 1989), two-feature triple conjunctions produced steeper slopes than one-feature triple con- junctions, just as predicted. For Wolfe et al., the one-feature triple con- junctions were almost completely flat, as in Fig. 12. According to FIT, no search that requires conjunction of features should produce a flat function of this sort. For Quinlan and Humphreys (1987) and for Treisman and Sato (in press), there was a noticeable slope for the one-feature triple conjunctions, as in Fig. 13. Additionally, standard conjunction perfor- mance should be somewhere between one-feature and two-feature triple conjunction performance. Treisman and Sato found that it was about equal to their one-feature triple conjunction performance, whereas Quin- lan and Humphreys and Wolfe et al. found that it was more or less equal
254 CAVE AND WOLFE
to their two-feature triple conjunction performance. In some of Quinlan and Humphrey’s experiments, the error rate was actually higher for standard conjunctions than for two-feature triple conjunctions. Search rates, however, were never slower for the standard conjunctions than for the two-feature triple conjunctions, and in some cases were faster. Generally, the pattern of results across the three sets of experiments seems to be consistent with Guided Search, and the variation between the three is within the range to be expected when different features are used.
Search for T among Ls
Both the letter T and the letter L are made up of one horizontal and one vertical line segment when presented in the four orientations used by Wolfe et al. (1989) and there are presumably no simple features that distinguish one from the other. The difference between the two letters depends on the configuration of the components making up the shape. Thus it can only be detected by the serial stage, which includes among its many abilities the capacity to identify spatial relations.
Because the parallel stage cannot identify spatial relations, it has no
10 - Variation in an
’ -- Irrelevant Dimension a -- 7 --
number 6 of cycles
(simulated ’ -- response time) 4
3 -- irrelevant variation
2 -- .,,L.%,,,49 1 -- ,,yqc.-=+-~
no irrelevant variation -- 15% 0 -- -- 10% error
-- 5% rate I I t I I I I I I 0 , I .rO%
1 3 5 7 9 11 13 15 17 19 21 23 25 set size 0 irrelevant variation
n no irrelevant variation
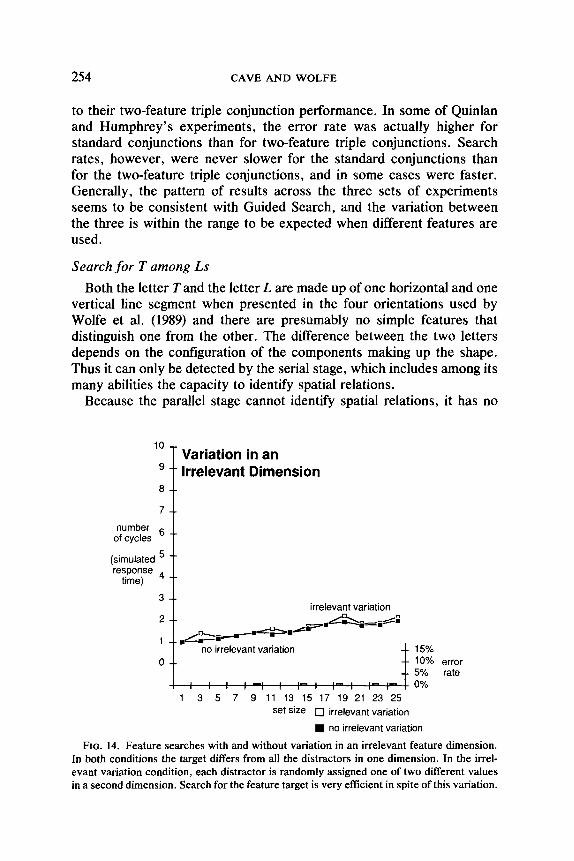
FIG. 14. Feature searches with and without variation in an irrelevant feature dimension. In both conditions the target differs from all the distracters in one dimension. In the irrel- evant variation condition, each distractor is randomly assigned one of two different values in a second dimension. Search for the feature target is very efftcient in spite of this variation.

MODELING VISUAL SEARCH 255
clues about the location of the target, and it can offer no help in directing the search. The serial stage is left to choose randomly among the ele- ments. Response time slopes will thus always be steep, regardless of the noise level. This corresponds well with Wolfe et al’s findings. Although some of their conjunction search subjects were able to search almost in parallel, slopes among their T/L search subjects were generally steep.
Variation in Irrelevant Dimensions
Treisman (1988) has demonstrated that subjects can still find a feature target quickly and in parallel even when the display elements vary along some irrelevant dimension. Figure 14 compares the simulation’s perfor- mance on a standard color search with its performance on a similar search in which each of the elements was randomly assigned one of two orien- tations. For these measures, there was no top-down activation for orien- tation, because the orientation of the target could not be known in ad- vance. (The results are essentially the same when top-down activation for orientation is included.) The variation in orientation has almost no effect. In the standard feature search, all elements have the same orientation, and the activations in the orientation map are uniformly low. If two dif- ferent orientations are present, each element differs from approximately half the other elements in orientation. The activations in the orientation map are now higher, but still relatively uniform. In both cases, the target receives much more color activation than the distracters, and the serial stage finds it quickly.
A similar situation occurs in the disjunctive feature search used by Treisman and Gelade (1980). They used the same distracters for their conjunction search that they did for their feature search. Thus, not only was there variation in an irrelevant dimension for the feature search, but in the relevant dimension, the distracters had two different values. The variation in the relevant dimension makes the search a bit more difftcult for Guided Search. In that case, each distractor is different from half the elements in the relevant dimension, and the bottom-up activation rises for all of them. However, the target differs from all of the distracters, and it still has a much higher bottom-up activation. The simulation produces very flat results for a feature search with this set of distracters.
Pashler (1988) approached the question of random variation along an irrelevant dimension with a different methodology, and also found that it interfered very little with search for a feature target. However, he did find that subjects had more trouble finding feature targets when just a small number of distracters differed from the rest on an irrelvant dimension. His subjects were searching for one element that differed in shape from all the others in a display that appeared for 50 ms. On some trials, all 90 elements in the display were the same color, whereas on others, two of
256 CAVE AND WOLFE
the elements differed in color from the rest. Subjects had to decide whether the shape target was on the left or right side of the display, and they made more errors when the odd-color distracters were present.
Guided Search can explain why a few isolated elements that differ in color can interfere with visual search more than totally random color variation. In the random variation condition, each element differs from roughly the same number of other elements in color, and so targets and distracters all have approximately the same bottom-up activation in the color map. However, when a small number of elements have a different color from the rest, they will have a high bottom-up activation. They will tend to draw the serial stage away from the shape target. The target is less likely to be processed in the short time that the display is visible, and the error rate will be higher.
In Pashler’s (1988) experiment, the shape target was either the charac- ter / in a field of OS or an 0 among a field of /s. The interference from odd-color items is strong when subjects do not know which of these two shape targets might appear. However, the interference drops consider- ably when subjects know which target to expect. These results fit well with the principles of Guided Search. When the target is known, subjects can use top-down activation in the shape map (or whatever map is sen- sitive to the difference between target and distracters) to raise the target activation beyond the range of the odd-color activations in the color map.
Individual Variations
In Guided Search, variation in performance across individual subjects results from variation in the level of noise. When the simulation operates with no noise, the target in any of the searches presented here (other than the T/L search and the two-feature triple conjunction search) is guaran- teed to have the highest activation. The serial stage will always find the target on the first cycle, and the “response time” function will be per- fectly flat. Alternatively, if the noise level is extremely high, the parallel stage will be of no use whatsoever. The serial stage will choose at random from among all the elements, and the slope will be very steep. In practice, the noise level for most subjects appears to be in between these two extremes, in a range for which feature search functions are almost flat and conjunction search functions range from almost flat to very steep. No matter what the level of noise, T/L searches will always exhibit a steep slope.
If the noise parameter could take on a different value for each search that a subject performed, Guided Search would have little predictive value and would not be of much use. However, because Guided Search is constrained to use only a single noise value for each subject, it can be tested by measuring its ability to account for the same subjects’ perfor-
MODELING VISUAL SEARCH 257
mance on all the different types of search. Indeed, with the wide variation in search performance across subjects, any model that is going to ade- quately account for visual search will need the flexibility that comes with a parameter that varies across subjects.
Differences in conjunction slopes across experiments might be due to individual noise differences among subjects, or they might instead result from differences in the salience of the stimuli. The larger the differences among feature values in a search stimulus, the easier it is to find targets quickly in the presence of heavy noise. Differences in stimulus salience apparently account for a large part of the differences between Treisman’s data and those from Wolfe et al.
Disjunctive Searches
In a disjunctive search, two or more targets are defined. For instance, subjects might be told to respond if either a red element or a vertical element is present. Treisman and Gelade (1980) tested subjects with dis- junctive feature searches in which the target could have either a color or a shape that was different from the distracters. As mentioned earlier, Guided Search can find disjunctive feature targets quickly, just as Treis- man and Gelade’s subjects did, because for feature searches it relies mainly on bottom-up activation. Whenever a single element differs from all others along a single-feature dimension, and the remaining elements differ little among themselves in that dimension, the single element will receive a high level of bottom-up activation. In this case, bottom-up ac- tivation will quickly guide search to the target, even if the subject has no knowledge of what sort of target to expect. In Treisman and Gelade’s feature search, in which subjects knew what two targets to expect, there could be an additional contribution from top-down activation in the two dimensions used to define the two possible targets.
The disjunctive conjunction searches of the sort used by Nakayama and Silverman (1986a) are more difficult. In these searches, the target can be either large and black or small and white, whereas half the distracters are large and white and the other half are small and black. Bottom-up acti- vation is of little help, and there is no single pattern of top-down activa- tion that will activate both targets without activating the distracters. Nev- ertheless, Nakayama and Silverman’s subjects did not produce steep slopes in this task.
Experiments described in Wolfe and Cave (1989) provide an explana- tion. Their data suggest that subjects perform disjunctive conjunction searches by first searching for one target, and then searching for the other. Thus subjects can first try top-down activation for large and black. If they find no large black target, they can switch to top-down activation

258 CAVE AND WOLFE
for small and white. These two guided searches are still generally more efficient than an unguided serial search.
Additivity of Dimensions
Treisman and Sato (in press) performed a series of conjunction search experiments with different combinations of features to demonstrate that the effects of different features were additive. An analysis of Guided Search shows that it predicts additivity of dimensions in standard con- junction searches.
In general, response time increases as the number of elements pro- cessed by the serial stage increases. That number depends on how many distracters have activations higher than the target activation. For a par- ticular search target, the top-down activation for a particular type of element will always be the same, regardless of what other elements are in the display. As long as the ratios of different types of elements are main- tained, the bottom-up activation for each element will also remain the same. Thus, under these conditions, the probability that a distractor of a particular type will have an activation higher than the target activation will be constant, regardless of what other elements appear in the display.
If pg is the probability that a single green distractor in a search for a red target will have an activation greater than the target activation, and t, is the time the serial stage takes to process a single green distractor, then when response times from a search for red among green are plotted by number of distracters, the slope will be pgt,. In a conjunction search for red vertical targets among equal numbers of green vertical and red hori- zontal distracters, the slope will be
(Pet, + Pdh) 2 ’
where pg is the probability of a green distractor activation exceeding the target activation, ph is the probability of a horizontal distractor activation exceeding the target activation, tg is the time to process a green distractor, and th is the time to process a horizontal distractor. If we assume that tg = th = t, then the conjunction slope will be
fbg + Ph) 2
Thus in a conjunction search the slope is the sum of two components,
p&J pht 2 and - , 2
one for each type of distractor. In this model, the probability that a distractor of a particular type will
MODELING VISUAL SEARCH 259
have a higher activation than the target depends on the difference be- tween target and distractor activations before noise is added. As long as that difference remains the same and the noise level is held constant, then the probability remains the same. In a standard conjunction search, each distractor differs from the target in only a single-feature dimension. The target-distractor activation difference (before noise is added) will depend entirely on that dimension. In the red-vertical conjunction search, the difference between the target activation and the green distractor activa- tion will be the same as long as the relative number of red and green elements is maintained. This activation difference will remain constant even if all the horizontal distracters are replaced with the same number of distracters that differ from the target in size rather than orientation. In this case, the absolute activations for the target and green distracters will change, but because they are all of the same orientation and size, and because the activation in each of the feature maps is summed, all these activations will change by the same amount, and the difference between target and green distracters will be preserved.
As long as the prenoise activation difference between the target and green distracters remains constant, then the probability that any green distractor activation will rise above the target activation remains con- stant, and the component of the search slope due to green distracters remains constant. Thus our model predicts that in a standard conjunction search, with equal numbers of two types of distracters, and each distrac- tor differing from the target in a single feature, the effects of different feature dimensions on the slope should be additive, just as Treisman and Sato (in press) found.
Treisman and Sato (in press) note that the additivity of dimensions appears to be incompatible with finding of Egeth et al. (1984) that subjects can use one feature dimension to eliminate a subset of distracters from serial processing. If none of the distracters with a particular target feature is chosen for serial processing, then that feature dimension will add noth- ing to the search time slope. Guided search suggests a solution to this conflict. Above we demonstrated how bottom-up activation can account for Egeth et al.‘s results. In many conjunction searches, the sort of one- feature exclusion that they demonstrated will only be possible if there is a large imbalance of distractor types that generates a large amount of bottom-up activation. As noted above, the effects of feature dimensions will only be additive if there is a balance of distractor types. Thus ac- cording to Guided Search, both findings are correct, but only with the appropriate distractor distribution.
Excitation vs. Inhibition
In another experiment, Treisman and Sato (in press) try to determine whether feature selection is accomplished by exciting those elements with

260 CAVE AND WOLFE
the target feature or inhibiting those elements with a nontarget feature. They compared performance on a standard conjunction search with an- other conjunction search in which half of the distracters were identical to those in the original search, and half of the distracters were further from the target in the relevant dimension than those in the standard search. If only one particular type of feature in a given dimension can be inhibited at any given time, then having two different features in that dimension should make the search more difficult. In fact, slopes for the modified search were somewhat steeper than in the standard search, leading Tre- isman and Sato to conclude that feature selection worked by inhibition.
However, Guided Search provides another possible explanation for the advantage of the standard two-feature conjunction search over the four- feature search. In Guided Search, moving half of the distracters further from the target in the relevant feature dimensions will change both the top-down and bottom-up activations. Because each element’s top-down activation depends on its similarity to the target, these distracters will receive even less top-down activation than they did before. Also, the target’s bottom-up activation will increase, because it now differs even more from the other elements in the display. Both of these changes make it less likely that the distracters will interfere with the search for the target. However, the bottom-up activation for all the distracters will in- crease as well, because there is now more variation among the distrac- tors. The increase in distractor activations will be larger than the increase in the target activation,’ and the net effect of the bottom-up activation will be to diminish performance on the four-feature search.
With top-down activation more favorable in the four-feature search and bottom-up activation less favorable, the end result depends on the bal- ance between the two types of activation. We can account for Treisman and Sato’s (in press) data by assuming that in this particular case the bottom-up change was stronger than the top-down change. Guided Search suggests that it might be possible to produce different results by using
’ Within one of the relevant feature maps in a standard conjunction, half the elements have one value and half have the other. If the difference between these two values is x, then for each element, including the target, the mean difference between it and all the other elements is x/z. If half of the distracters with the nontarget value are then moved further from the target in feature space by an amount y, all of the mean differences change. For the target and all the distracters with the target value, the mean difference is now x/2 + y/4. For the distracters with the nontarget value that did not change from the standard conjunction, the mean difference is also x/2 + y/4. However, for the distracters that did change, the mean difference is now x/2 + 3~/4. In the standard conjunction, the distracters in this subset have bottom-up activations equal to that of the target, but in the four-feature conjunction, they have bottom-up activations higher than the target, and thus are more likely to interfere with the search for the target.

MODELING VISUAL SEARCH 261
different features. A more thorough understanding of the relationship between bottom-up and top-down processing will allow more precise pre- dictions.
Given that Guided Search provides an alternative explanation for Tre- isman and Sato’s (in press) data, the question of excitation vs. inhibition is still open. Within the framework of Guided Search, this question seems somewhat less relevant. Guided Search differs from Feature Integration Theory in that it does not have a separate map for each value of each feature. Because there is a separate map for each value in FIT, and because activation (whether it is excitation or inhibition) tends to operate within a single map, a particular type of activation will affect only a subset of the display elements, those with a particular value (red, for instance), and not affect those with any other value (blue, green, yellow, etc.). In FIT, the question of excitation vs. inhibition is important because there are big differences between exciting one class of stimuli while not exciting all the others, and inhibiting one class of stimuli while not inhibiting all the others. Because Guided Search does not have a separate map for each feature value, its activation is not limited to a single subset of the stimuli. Each element will receive a particular amount of activation, depending on its similarity to other elements and the target. If there are only two values in a particular feature dimension, as in a standard feature or conjunction search, then there will only be two levels of activation within the map for that dimension. However, if the stimuli in a display cover a wide range of values in a particular feature dimension, then they will receive a wide range of different activations.
Guided Search could be implemented by first setting the activations for all elements to a low value, and then exciting each one in proportion to its similarity to the target and its dissimilarity to its neighbors. Alternatively, it could be implemented by first setting all the activations to a high level and then inhibiting each element in proportion to its similarity to its neigh- bors and its dissimilarity to the target. Either way, the results will be the same, and thus the question about excitation vs. inhibition is an imple- mentational issue that probably does not bear directly on the performance of the system.
Target-Absent Trials
In many cases, when the slope for target-present trials is steep, the slope for target-absent trials will be approximately twice as large. As Treisman and Gelade (1980) point out, this pattern suggests a serial, self- terminating search. The simulation performs just such a search when the noise level is so high that the parallel stage can offer no useful guidance at all, and in this case it produces the 2:l slope ratio.
In other cases, though, subjects are apparently able to conclude that no
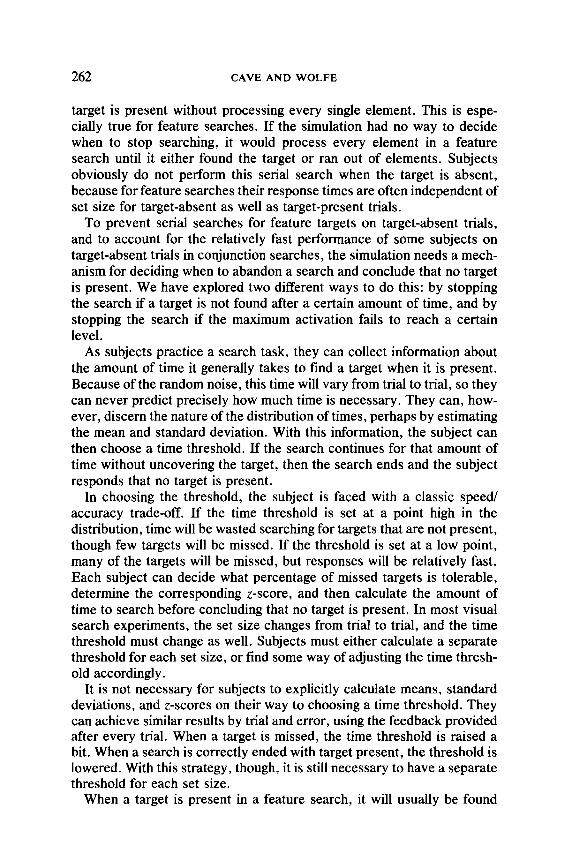
262 CAVE AND WOLFE
target is present without processing every single element. This is espe- cially true for feature searches. If the simulation had no way to decide when to stop searching, it would process every element in a feature search until it either found the target or ran out of elements. Subjects obviously do not perform this serial search when the target is absent, because for feature searches their response times are often independent of set size for target-absent as well as target-present trials.
To prevent serial searches for feature targets on target-absent trials, and to account for the relatively fast performance of some subjects on target-absent trials in conjunction searches, the simulation needs a mech- anism for deciding when to abandon a search and conclude that no target is present. We have explored two different ways to do this: by stopping the search if a target is not found after a certain amount of time, and by stopping the search if the maximum activation fails to reach a certain level.
As subjects practice a search task, they can collect information about the amount of time it generally takes to find a target when it is present. Because of the random noise, this time will vary from trial to trial, so they can never predict precisely how much time is necessary. They can, how- ever, discern the nature of the distribution of times, perhaps by estimating the mean and standard deviation. With this information, the subject can then choose a time threshold. If the search continues for that amount of time without uncovering the target, then the search ends and the subject responds that no target is present.
In choosing the threshold, the subject is faced with a classic speed/ accuracy trade-off. If the time threshold is set at a point high in the distribution, time will be wasted searching for targets that are not present, though few targets will be missed. If the threshold is set at a low point, many of the targets will be missed, but responses will be relatively fast. Each subject can decide what percentage of missed targets is tolerable, determine the corresponding z-score, and then calculate the amount of time to search before concluding that no target is present. In most visual search experiments, the set size changes from trial to trial, and the time threshold must change as well. Subjects must either calculate a separate threshold for each set size, or find some way of adjusting the time thresh- old accordingly.
It is not necessary for subjects to explicitly calculate means, standard deviations, and z-scores on their way to choosing a time threshold. They can achieve similar results by trial and error, using the feedback provided after every trial. When a target is missed, the time threshold is raised a bit. When a search is correctly ended with target present, the threshold is lowered. With this strategy, though, it is still necessary to have a separate threshold for each set size.
When a target is present in a feature search, it will usually be found
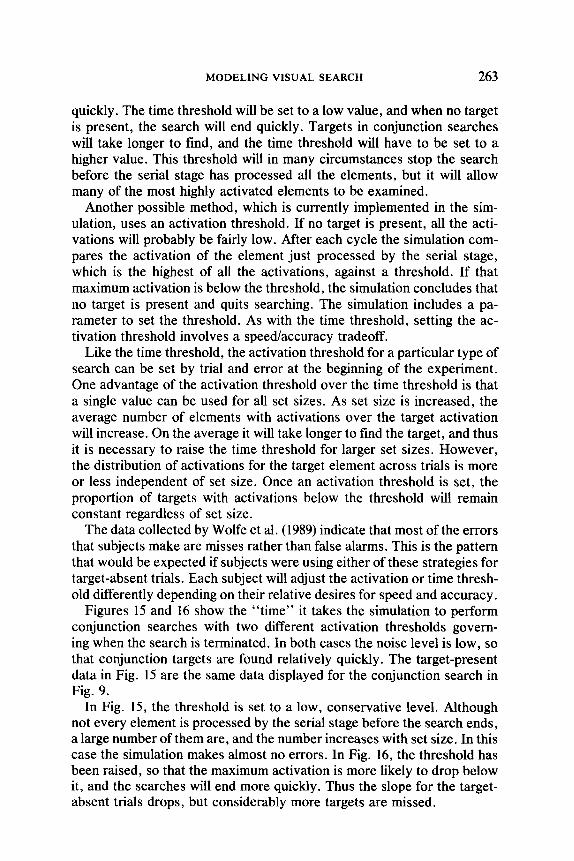
MODELING VISUAL SEARCH 263
quickly. The time threshold will he set to a low value, and when no target is present, the search will end quickly. Targets in conjunction searches will take longer to find, and the time threshold will have to be set to a higher value. This threshold will in many circumstances stop the search before the serial stage has processed all the elements, but it will allow many of the most highly activated elements to be examined.
Another possible method, which is currently implemented in the sim- ulation, uses an activation threshold. If no target is present, all the acti- vations will probably be fairly low. After each cycle the simulation com- pares the activation of the element just processed by the serial stage, which is the highest of all the activations, against a threshold. If that maximum activation is below the threshold, the simulation concludes that no target is present and quits searching. The simulation includes a pa- rameter to set the threshold. As with the time threshold, setting the ac- tivation threshold involves a speed/accuracy tradeoff.
Like the time threshold, the activation threshold for a particular type of search can be set by trial and error at the beginning of the experiment. One advantage of the activation threshold over the time threshold is that a single value can be used for all set sizes. As set size is increased, the average number of elements with activations over the target activation will increase. On the average it will take longer to find the target, and thus it is necessary to raise the time threshold for larger set sizes. However, the distribution of activations for the target element across trials is more or less independent of set size. Once an activation threshold is set, the proportion of targets with activations below the threshold will remain constant regardless of set size.
The data collected by Wolfe et al. (1989) indicate that most of the errors that subjects make are misses rather than false alarms. This is the pattern that would be expected if subjects were using either of these strategies for target-absent trials. Each subject will adjust the activation or time thresh- old differently depending on their relative desires for speed and accuracy.
Figures 15 and 16 show the “time” it takes the simulation to perform conjunction searches with two different activation thresholds govem- ing when the search is terminated. In both cases the noise level is low, so that conjunction targets are found relatively quickly. The target-present data in Fig. 15 are the same data displayed for the conjunction search in Fig. 9.
In Fig. 15, the threshold is set to a low, conservative level. Although not every element is processed by the serial stage before the search ends, a large number of them are, and the number increases with set size. In this case the simulation makes almost no errors. In Fig. 16, the threshold has been raised, so that the maximum activation is more likely to drop below it, and the searches will end more quickly. Thus the slope for the target- absent trials drops, but considerably more targets are missed.

264 CAVE AND WOLFE
lo Low Threshold 9 -- 8 --
7 -- number target absent d- --
of cycles 6
/
/ 5 --
(simulated response 4 -- Hd
time) 3-- y-d
“\
/
target present 2 -- /“\. ‘-k/=- -*y-m
1 --0 -- 15%
0 -- error rate
1 3 5 7 9 11 13 15 17 19 21 23 25 set size
n missed targets
FIG. 15. The search termination threshold is set to a low, conservative value. When the target is absent, the serial stage processes many of the distracters before the search is terminated, resulting in a steep target-absent slope.
These data illustrate that as the threshold varies, the slope for target- absent trials can change dramatically while the slope for target-present trials remains about the same. The experimental data show similar pat- terns across different subjects. For instance, in Wolfe et al’s (1989) search for conjunctions of color and size (Experiment 3), three of the subjects had slopes on the target-present trials that were almost equal (2.6, 2.0, and 2.1). The same three subjects, however, showed wide vari- ation in their slopes for target-absent trials (5.5, 8.4, and 21.9). This pat- tern suggests that these subjects had similar noise levels but varied in the conservatism of their responses on target-absent trials.
In general, the response time for a trial with no target will be bounded on the top by the time necessary to process every element, and on the bottom by the mean time to find the target. Therefore, the slopes for target-absent trials will be bounded on the top by the slope for a purely serial search with no guidance from the parallel stage, and on the bottom by the slope for target-present trials. For tasks in which the target-present slope is low, the ratio between target-present and target-absent slopes can range from 1: 1 up to very high values. The range of slope ratios will be different for those tasks or those subjects in which the guidance from the parallel stage is poor. In these cases, the target-present slopes will be high, and because of the upper bound on the target-absent slopes, the slope ratio will generally not range much above 2: 1.

MODELING VISUAL SEARCH 265
lo High Threshold 9
8
7 i number
of cycles 6
5 (simulated response 4 --
time) target absen>qo
3
1 3 5 7 9 11 13 15 17 19 21 23 25 set size
W missed targets
FIG. 16. The threshold has been raised, and fewer elements are processed before the simulation concludes that no target is present. Comparison with Fig. 15 shows that manip- ulating the threshold has a large effect on target-absent trials, but not on target-present trials.
Currently it is not clear what method is best for terminating searches in Guided Search. The activation threshold can be implemented simply and matches the experimental data in many aspects, but it cannot account for the rise that is generally seen in error rates as the set size increases. When the activation threshold is used, the error rate will depend on the number of trials in which the target activation is below the threshold. Because this activation will vary little with the set size (except for the smallest set sizes), the error rate will remain fairly constant as well. There are other methods that do predict a rise in error rate with set size, including the time threshold described earlier, or some combination of activation and time thresholds. Alternatively, an activation threshold could be used by itself if it is adjusted over time, or if it is adjusted according to the set size. Any of these methods could produce error rates that increase with set size.
Determining how subjects decide when to quit searching will probably not be easy. Because they will set thresholds according to the risks they are willing to take, any substantial improvement at predicting when searches will end will probably have to take into account higher-level cognitive factors of judgment and decision-making that are beyond the scope of this model.
GENERAL DISCUSSION
The computer simulation demonstrates that when Feature Integration
266 CAVE AND WOLFE
Theory is modified along the lines of Hoffman’s two-stage model, it can explain the broad range in performance for different feature searches by different subjects. In Guided Search, the parallel stage still cannot repre- sent conjunctions of features, so it cannot identify conjunction targets. It can, however, combine information from different feature dimensions to choose elements that are likely to be targets. Thus in many cases the parallel stage is able to prevent a purely serial search, even if it is not able to produce a purely parallel search.
The simulation also demonstrates that varying the relative efficiency of the parallel stage has drastic effects on the simulation’s performance in conjunction search. As the noise level varies, the performance of the simulation on conjunction search ranges from the flat function associated with parallel search to the steep slope of serial search. As conjunction performance moves from one extreme to the other, however, results from feature searches and from T/L search remain fairly constant. This reflects the pattern in Wolfe, et al’s (1989) data and explains why their conjunc- tion search results varied so widely between subjects while their T/L search results did not. The simulation also demonstrates why the re- sponse time functions from feature searches are usually not completely flat. Finally, it demonstrates how subjects might eliminate distracters based on a single feature dimension and then search serially among the rest, as Egeth et al.‘s (1984) subjects did.
In addition to conflicting data, there were two other problems with FIT. The modifications proposed here also allow Guided Search to better ad- dress these problems.
Making the best use of the parallel stage. In FIT, the parallel stage can find a target element whenever it differs from its surroundings by a single simple visual feature, such as color, orientation, or depth. If the target is not marked by such a unique feature, then the parallel stage is of no use, and it is up to the serial stage to find the target by searching at random. It can be computationally expensive to build a representation of every possible combination of features at every location in the visual field (see Feldman, 1985), and therefore it is not surprising that it cannot be done all at once in parallel across the visual field. However, limiting the parallel stage to those situations when the target is marked by a unique feature means that it is useless in a wide variety of processing circumstances.
Although the parallel stage does not have the capacity to build con- junction representations that can support visual search, Guided Search demonstrates that it can be used to guide the serial stage away from distracters and toward targets. The simulation demonstrates how “guidance” from different feature dimensions can be combined without building computationally expensive conjunction representations at each location. In computational terms the modified theory is not much more complex than the original, but its parallel stage is able to provide help in
MODELING VISUAL SEARCH 267
many more situations, even if every feature of the target is shared by some other nearby object. Because the parallel stage is less than perfect, it will not always find the target the first time around, but in general it puts the same feature-detecting apparatus to better use.
Speeding up visual processing. Just as FIT cannot explain the speed of some subjects in conjunction search, it cannot explain the speed of visual processing in a number of everyday tasks. When presented with a picture, even if it is a very complex scene, we are usually able to find and identify the most important objects almost immediately. In almost every case this identification will require combining information about different types of features. According to FIT, this combination can only be done by the slow serial process, and unless the important objects are each marked with a single unique feature, they will not be found quickly. For instance, if a driver is searching for a red STOP sign, FIT predicts that she must search from among other red objects such as an oncoming red car, apples on a nearby tree, a cardinal flying by, and a pedestrian with a red hat. According to Guided Search, the STOP sign can be found quickly as long as these other red items do not have the same size, shape properties, and direction and velocity of motion. Thus Guided Search can help to explain why visual processing in general can be so fast even if feature conjunction is slow.
It will take much more than this model to explain the extraordinary speed with which visual processing takes place. Nevertheless, it does provide a suggestion for one part of the explanation. In Guided Search the parallel stage can direct the serial stage to the right locations faster and in more types of situations, and thus it provides a better account of visual processing speed.
Revised FIT
Recently, Treisman (1988) has described her own revisions to her Fea- ture Integration Theory, prompted by the same data that prompted us to construct Guided Search. In her system, there is a separate map for each value of each feature. Mutual inhibition within each of these maps lessens the activation for elements that share the same feature value with many other elements, much like the bottom-up activation in Guided Search. Also, a particular feature map representing a nontarget value can inhibit the associated locations in a master map, much like our top-down acti- vation. It is not clear whether this inhibition can come from more than one feature dimension at once, although presumably it could if the effects of different dimensions are to be additive in conjunction search, as Treisman and Sato (in press) found. Treisman accounts for the variation in slopes for different conjunction tasks by varying the number of items that can be processed at once. The more discriminable the feature values used, the higher the number of elements that can be processed at once, and the
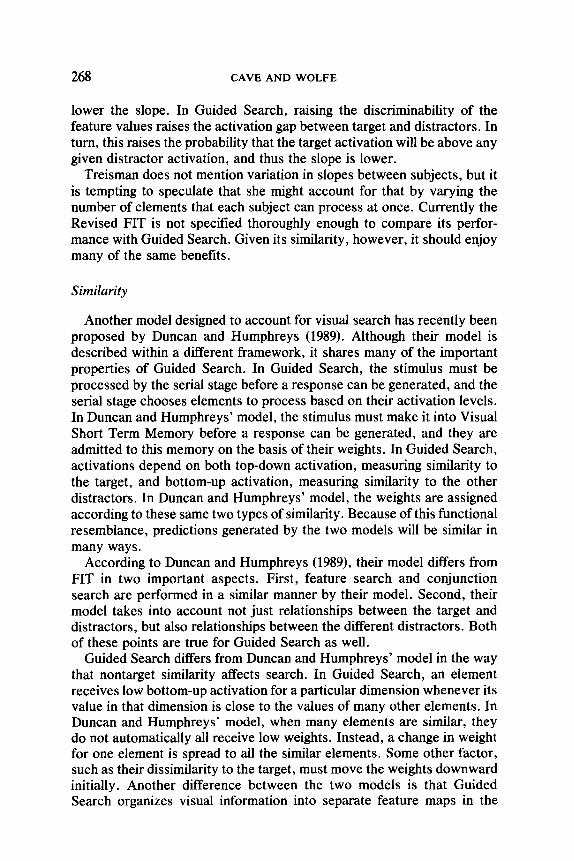
268 CAVE AND WOLFE
lower the slope. In Guided Search, raising the discriminability of the feature values raises the activation gap between target and distracters. In turn, this raises the probability that the target activation will be above any given distractor activation, and thus the slope is lower.
Treisman does not mention variation in slopes between subjects, but it is tempting to speculate that she might account for that by varying the number of elements that each subject can process at once. Currently the Revised FIT is not specified thoroughly enough to compare its perfor- mance with Guided Search. Given its similarity, however, it should enjoy many of the same benefits.
Similarity
Another model designed to account for visual search has recently been proposed by Duncan and Humphreys (1989). Although their model is described within a different framework, it shares many of the important properties of Guided Search. In Guided Search, the stimulus must be processed by the serial stage before a response can be generated, and the serial stage chooses elements to process based on their activation levels. In Duncan and Humphreys’ model, the stimulus must make it into Visual Short Term Memory before a response can be generated, and they are admitted to this memory on the basis of their weights. In Guided Search, activations depend on both top-down activation, measuring similarity to the target, and bottom-up activation, measuring similarity to the other distracters. In Duncan and Humphreys’ model, the weights are assigned according to these same two types of similarity. Because of this functional resemblance, predictions generated by the two models will be similar in many ways.
According to Duncan and Humphreys (1989), their model differs from FIT in two important aspects. First, feature search and conjunction search are performed in a similar manner by their model. Second, their model takes into account not just relationships between the target and distracters, but also relationships between the different distracters. Both of these points are true for Guided Search as well.
Guided Search differs from Duncan and Humphreys’ model in the way that nontarget similarity affects search. In Guided Search, an element receives low bottom-up activation for a particular dimension whenever its value in that dimension is close to the values of many other elements. In Duncan and Humphreys’ model, when many elements are similar, they do not automatically all receive low weights. Instead, a change in weight for one element is spread to all the similar elements. Some other factor, such as their dissimilarity to the target, must move the weights downward initially. Another difference between the two models is that Guided Search organizes visual information into separate feature maps in the
MODELING VISUAL SEARCH 269
same manner as FIT (see Wolfe, Yu, Stewart, Shorter, & Cave, 1989), while Duncan and Humphreys’ model does not.
Identifying other differences between the two models is difftcult. Many important performance comparisons will not be possible until Duncan and Humphreys’ model is specified in more detail. Perhaps the most impor- tant question about their model concerns how similarity is measured. Producing a satisfactory answer to this question may be difficult, for the same reasons that it is difficult to produce a complete and definitive list of the features used in FIT or Guided Search.
Future Enhancements
As always, there are a number of ways in which this simulation can be expanded and improved. A few are listed below.
Effect of&stance. Currently the input to the simulation is merely a list of the elements present in the display. It has no information about the spatial relationships between these elements. Ideally, the simulation would limit the interactions between elements to those pairs that are near each other. The only change necessary would be in the calculation of the bottom-up component of the activation, in which currently a location is compared against every other location in the display. The increase in activation due to the difference between two locations should be adjusted according to the distance between the two locations, so that nearby lo- cations have a large effect on each other and distant elements have little or no effect.
Adding distance effects to the simulation might solve one problem that arises when a conjunction target is present with a small number of dis- tractors. The simulation can take an unusually long time to find conjunc- tion targets in these circumstances because the bottom-up activation works to favor the distracters. If a display contains only a conjunction target and two distracters of different types (for instance, one differing from the target in color and the other differing in orientation), then the bottom-up activation for the target will actually be larger for the distrac- tors than for the target. In both of the relevant feature maps, two elements will have the target value and only one will have the nontarget value. Thus one distractor receives high bottom-up activation in one map, and the other receives high activation in the other. The result of this extra acti- vation for the distracters can be seen in the conjunction search data in Fig. 9, which includes an unusual rise at a set size of three (one target and one distractor of each type). If bottom-up activation depended on the proximity of the elements, then it would generally be weaker for small set sizes, when elements tend to be farther apart, and thus might not interfere as much in these conjunction searches.
Search asymmetries. Treisman and her collaborators (Treisman & Souther, 1985; Treisman & Gormican, 1988) have carefully documented a

270 CAVE AND WOLFE
number of cases of asymmetries in visual search. For instance, it is easier to find a long line surrounded by short lines than a short line surrounded by long lines. Treisman argues that these asymmetries reflect basic prin- ciples of the representation of different types of visual features.
Currently the feature comparisons in the simulation do not reflect these asymmetries, and the simulation cannot reproduce these data. Thus, in calculating the bottom-up component, the difference between feature A and feature B is the same as that between feature B and feature A. One way to introduce asymmetries would be to make the comparisons non- commutative. Another approach, which might produce a more plausible result, is to change the coding of basic features according to the principles sketched out by Treisman and Gormican (1988). They have shown that with the proper feature representation, search asymmetries can be ex- plained by Weber’s Law, which might be incorporated into the simulation by adjusting the noise level according to the overall level of activation. These modifications should not affect the design features that make Guided Search appealing in the first place: namely, the guidance of the serial search by the parallel stage, the impact of noise in the parallel stage, and the summation of information from different feature dimensions.
Network implementation. The basic operations necessary to implement the parallel stage can easily be implemented with a network of simple computational units working in parallel. We are therefore planning to implement Guided Search as a network model. We also hope that by demonstrating the sort of basic operations necessary for feature activa- tion and feature comparison, Guided Search will be a useful guide in the search for structures in visual cortex that implement and guide visual selection.
REFERENCES
Bergen, J. R., & Julesz, B. (1983). Parallel versus serial processing in rapid pattern discrim- ination. Nature, 303, 696-698.
Bundesen, C., & Pedersen, L. F. (1983). Color segregation and visual search. Perception & Psychophysics, 33,487-493.
Carter, R. C. (1982). Visual search with color. Journal of Experimental Psychology: Human Perception and Performance, 8, 127-136.
Duncan, J., & Humphreys, G. W. (1989). Visual search and stimulus similarity. Psycho- logical Review, 96, 433458.
Egeth, H. E., Virzi, R. A., & Garbart, H. (1984). Searching for conjunctively defined tar- gets. Journal of Experimental Psychology: Human Perception and Performance, 10, 32-39.
Farmer, E. W., & Taylor, R. M. (1980). Visual search through color display: Effects of target-background similarity and background uniformity. Perception & Psychophysics, 27, 267-272.
Feldman, J. A. (1985). Four frames suffice: A provisional model of vision and space. The Behavioral and Brain Sciences, 8, 265-289.
MODELING VISUAL SEARCH 271
Green, B. F., & Anderson, L. K. (1956). Color coding in a visual search task. Journal of Experimental Psychology, 51, 19-24.
Hoffman, J. E. (1978). Search through a sequentially presented visual display. Perception & Psychophysics, 23, l-l 1.
Hoffman, J. E. (1979). A two-stage model of visual search. Perception &Psychophysics, 25, 319-327.
Julesz, B. (1984). A brief outline of the texton theory of human vision. Trends in Neuro- sciences, 7, 41-45.
Julesz, B., & Bergen, J. R. (1983). Textons, the fundamental elements in preattentive vision and perception of textures. The Bell System Technical Journal, 62, 1619-1645.
Klein, R. (1988). Inhibitory tagging system facilitates visual search. Nature, 334, 43ti31. Nakayama, K., & Silverman, G. H. (1986a). Serial and parallel processing of visual feature
conjunctions. Nature, 320, 26+265. Nakayama, K., & Silverman, G. H. (1986b). Serial and parallel encoding of feature con-
junctions. Investigative Ophthalmology and Visual Science, 27, 182 (Supplement). Neisser, U. (1967). Cognitive psychology. New York: Appleton-Century-Crofts. Pashler, H. (1988). Cross-dimensional interaction and texture segregation. Perception &
Psychophysics, 43, 307-318. Posner, M. I., & Cohen, Y. (1984). Components of attention. In H. Bouma & D. Bouwhuis
(Eds.), Attention and Performance X (pp. 55-66). Hillsdale, NJ: Erlbaum. Quinlan, P. T., & Humphreys, G. W. (1987). Visual search for targets defined by combi-
nations of color, shape, and size: An examination of the task constraints of feature and conjunction searches. Perception & Psychophysics, 41, 455472.
Smith, S. L. (1962). Color coding and visual search. Journal of Experimental Psychology, 64, 43uo.
Townsend, J. T. (1972). Some results on the identifiability of parallel and serial processes. British Journal of Mathematical and Statistical Psychology, 25, 168-199.
Treisman, A. M. (1986). Features and objects in visual processing. Scientific American, 255, 114B-125.
Treisman, A. M. (1988). Features and objects: The fourteenth Bartlett memorial lecture. Quarterly Journal of Experimental Psychology, 4OA, 201-237.
Treisman, A. M., Gelade, G. (1980). A feature-integration theory of attention. Cognitive Psychology, 12, 97-136.
Treisman, A. M., & Gormican, S. (1988). Feature analysis in early vision: Evidence from search asymmetries. Psychological Review, 95, 1548.
Treisman, A. M., & Sato, S. (in press). Conjunction search revisited. Journal of Experi- mental Psychology: Human Perception and Performance.
Treisman, A. M., & Souther, J. (1985). Search asymmetry; A diagnostic for preattentive processing of separable features. Journal of Experimental Psychology: General, 114, 285-310.
Wolfe, J. M., & Cave, K. R. (in press). Deploying visual attention: The guided search model. In A. Blake & T. Troscianko (Eds.), A.I. and the eye. Chichester, UK: Wiley.
Wolfe, J. M., Cave, K. R., & Franzel, S. L. (1989). A modified feature integration model for visual search. Journal of Experimental Psychology: Human Perception and Perfor- mance, 15, 419-433.
Wolfe, J. M., Yu, K. P., Stewart, M., Shorter, A. D., & Cave, K. R. (1989). Limitations on the parallel guidance of parallel search. Manuscript submitted for publication.
(Accepted August 22, 1989)

本文献由“学霸图书馆-文献云下载”收集自网络,仅供学习交流使用。
学霸图书馆(www.xuebalib.com)是一个“整合众多图书馆数据库资源,
提供一站式文献检索和下载服务”的24 小时在线不限IP
图书馆。
图书馆致力于便利、促进学习与科研,提供最强文献下载服务。
图书馆导航:
图书馆首页 文献云下载 图书馆入口 外文数据库大全 疑难文献辅助工具