Embed Size (px)
Citation preview
MODELING UTILIZATION OF PLANNED INFORMATION TECHNOLOGY
Timothy Dwight Stettheimer, B.B.S, M.S.
Dissertation Prepared for the Degree of
DOCTOR OF PHILOSOPHY
APPROVED:
Ana Cleveland, Major ProfessorVictor Prybutok, Committee MemberJack Becker, Committee MemberJ. Rafael Toledo, Committee MemberJean Francis, Committee MemberKirk Kirksey, Committee MemberPhilip M. Turner, Director of the Interdisciplinary
Program in Information ScienceC. Neal Tate, Dean of the Robert B. Toulouse School
of Graduate Studies
UNIVERSITY OF NORTH TEXAS
May 2000
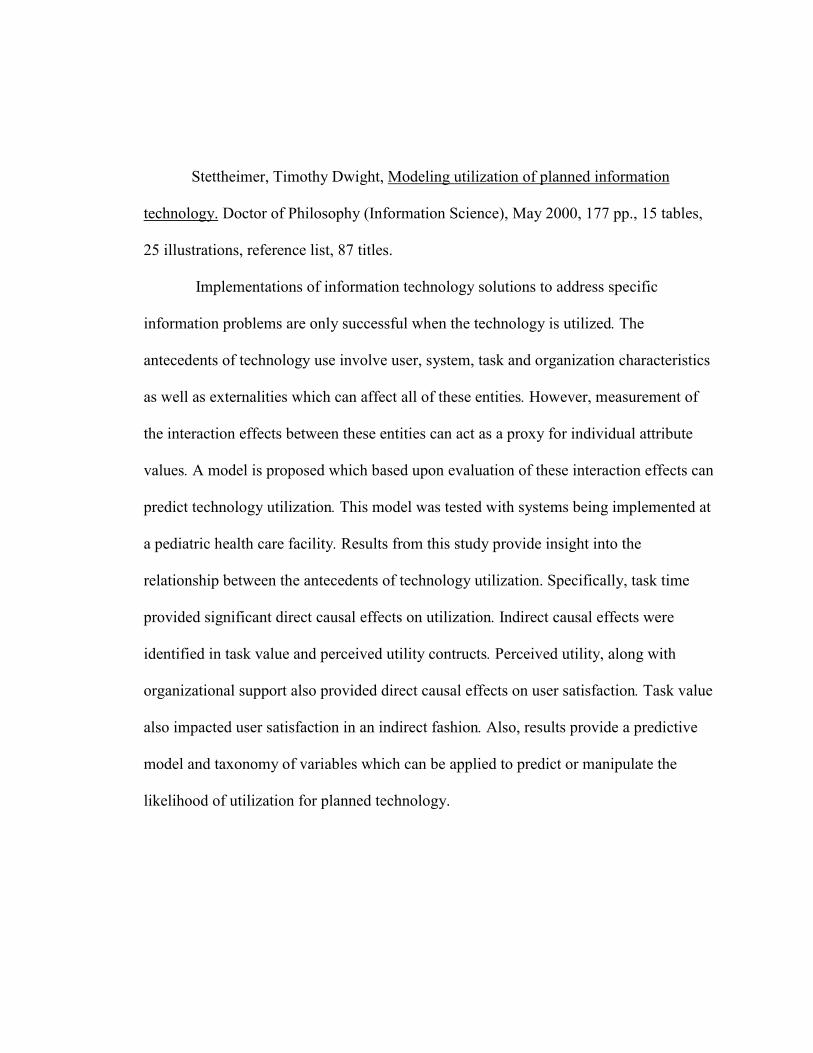
Stettheimer, Timothy Dwight, Modeling utilization of planned information
technology. Doctor of Philosophy (Information Science), May 2000, 177 pp., 15 tables,
25 illustrations, reference list, 87 titles.
Implementations of information technology solutions to address specific
information problems are only successful when the technology is utilized. The
antecedents of technology use involve user, system, task and organization characteristics
as well as externalities which can affect all of these entities. However, measurement of
the interaction effects between these entities can act as a proxy for individual attribute
values. A model is proposed which based upon evaluation of these interaction effects can
predict technology utilization. This model was tested with systems being implemented at
a pediatric health care facility. Results from this study provide insight into the
relationship between the antecedents of technology utilization. Specifically, task time
provided significant direct causal effects on utilization. Indirect causal effects were
identified in task value and perceived utility contructs. Perceived utility, along with
organizational support also provided direct causal effects on user satisfaction. Task value
also impacted user satisfaction in an indirect fashion. Also, results provide a predictive
model and taxonomy of variables which can be applied to predict or manipulate the
likelihood of utilization for planned technology.
ii
Copyright 2000
by
Timothy Dwight Stettheimer

iii
ACKNOWLEDGEMENTS
The successful completion of this research would not have been possible without
the cooperation and resources provided by Children�s Medical Center of Dallas. Both
hospital administration and staff provided significant input. The guidance of Jean Francis,
Senior Vice President for Patient Care, was especially appreciated.
The statistical support provided by Dr. Victor Prybutok as well as Craig
Henderson was invaluable in the analysis stage of this research. Also, each of my
committee member provided beneficial suggestions aiding in the completion of this
project.
Throughout the entire process of my studies for this degree and during the
completion of this present study, Dr. Ana Cleveland served in the role of both mentor and
guide. I will always appreciate her support and encouragement.
Finally, my thanks go out to my entire family for their patience and endurance
during the years of study required for the completion of this research and this degree.
iv
TABLE OF CONTENTS
Page
LIST OF TABLES........................................................................................................... vi
LIST OF ILLUSTRATIONS........................................................................................... vii
Chapter
1. INTRODUCTION ......................................................................................... 1
OverviewStatement of the ProblemPurpose of the StudySignificance of the StudyBackgroundResearch QuestionsLimitations and Assumptions
2. REVIEW OF THE LITERATURE ............................................................... 12
BackgroundResearch in Information Technology UtilizationResearch in Information Technology SatisfactionResearch in Adoption & Diffusion of Innovation
3. METHODOLOGY ........................................................................................ 36
Research DesignModel SpecificationsHypothesesDiscussion of HypothesesSubject SelectionData GatheringData Analysis
4. FINDINGS..................................................................................................... 62
System Subject ComparisonModel AnalysisHypotheses Testing
v
5. CONCLUSIONS AND SUMMARY ............................................................ 96
Performance of Utilization ModelsConsiderations for Future Research
APPENDIX A..................................................................................................................100
APPENDIX B ..................................................................................................................126
BIBLIOGRAPHY............................................................................................................171
vi
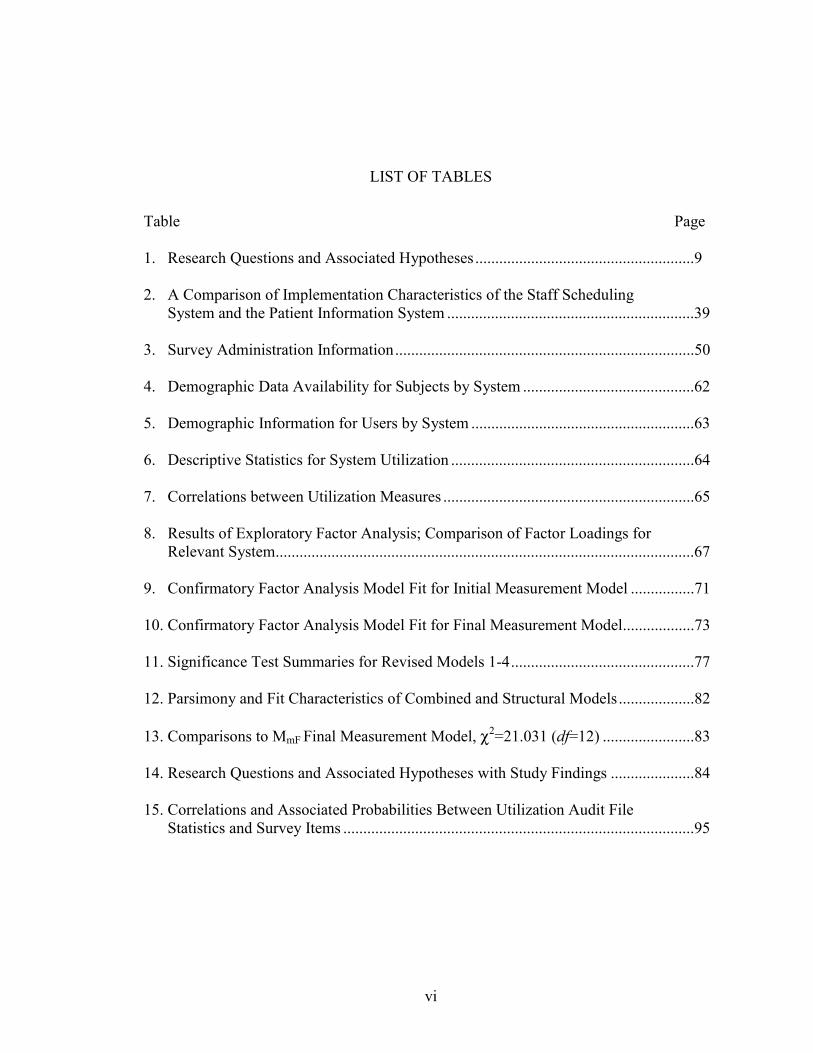
LIST OF TABLES
Table Page
1. Research Questions and Associated Hypotheses .......................................................9
2. A Comparison of Implementation Characteristics of the Staff SchedulingSystem and the Patient Information System ..............................................................39
3. Survey Administration Information...........................................................................50
4. Demographic Data Availability for Subjects by System ...........................................62
5. Demographic Information for Users by System ........................................................63
6. Descriptive Statistics for System Utilization .............................................................64
7. Correlations between Utilization Measures ...............................................................65
8. Results of Exploratory Factor Analysis; Comparison of Factor Loadings forRelevant System.........................................................................................................67
9. Confirmatory Factor Analysis Model Fit for Initial Measurement Model ................71
10. Confirmatory Factor Analysis Model Fit for Final Measurement Model..................73
11. Significance Test Summaries for Revised Models 1-4..............................................77
12. Parsimony and Fit Characteristics of Combined and Structural Models...................82
13. Comparisons to MmF Final Measurement Model, χ2=21.031 (df=12) .......................83
14. Research Questions and Associated Hypotheses with Study Findings .....................84
15. Correlations and Associated Probabilities Between Utilization Audit FileStatistics and Survey Items ........................................................................................95
vii
LIST OF ILLUSTRATIONS
Figure Page
1. Relational Diagram of Primary Forces and their Interactions ...................................7
2. Galletta and Lederer (1989) Model of Information System Outcomes .....................12
3. Pitt, Watson and Kavan�s 1995 Augmented IS Success Model (adapted fromDeLone and McLean, 1992) ......................................................................................14
4. Thompson, Higgins and Howell�s (1994) Model of Factors Influencing theUtilization of Personal Computers.............................................................................18
5. Davis' Technology Acceptance Model (TAM)..........................................................20
6. Igbaria, Parasuraman and Baroudi�s (1996) Motivational Model of ComputerUsage..........................................................................................................................24
7. Torkzadeh and Dwyer's 1994 Utilization Relationship Model..................................27
8. McKeen, Guimareas and Wetherbe�s (1994) Relationships Found amongResearch Variables.....................................................................................................30
9. Usefulness/EOU Grid ................................................................................................32
10. Utilization Prediction Model......................................................................................40
11. Doll�s (1991) System to Value Chain........................................................................41
12. The Initial Measurement Model, after Identifying all Parameters to be Estimated(Completed Program for Confirmatory Factor Analysis) ..........................................57
13. Initial Theoretical Model ...........................................................................................59
14. Graphical Representation of System Use as Indicated by Audit File Analysis(trendlines are included for each system; OS=scheduling system; HCI=educationsystem) .......................................................................................................................66
15. The Initial Measurement Model (Completed Program for Confirmatory FactorAnalysis with significance of covariance values indicated by t test values) .............70
viii
16. The Final Measurement Model (with significance of covariance values indicatedby t test values) ..........................................................................................................72
17. Initial Theoretical Model (with significance of covariance values indicated byt test values) ...............................................................................................................75
18. Fourth Revised Model (significant causal paths are bolded).....................................78
19. Utilization by User-satisfaction Split Response Set ..................................................87
20. Utilization by Organizational Support Split Response Set ........................................88
21. User Satisfaction by Job Satisfaction Split Response Set..........................................89
22. User Satisfaction by Perceived Utility Split Response Set ........................................90
23. User Satisfaction by Task Time Split Response Set ..................................................91
24. Organizational Support by Task Value Split Response Set.......................................92
25. Organizational Support by Perceived Utility Split Response Set ..............................93

1
CHAPTER 1
INTRODUCTION
Overview
Statement of the Problem
Appropriate allocation of information technology is a critical activity for
information intensive organizations. Benefits of information technology advances are
only realized through selective allocation of resources to those who most require the
technology and are able to utilize it. When allocation of information technology occurs in
a haphazard fashion, a low quality of technology utilization results. This low utilization
quality is demonstrated through non-utilization, mis-utilization, or under-utilization of the
technology. Failure to successfully utilize core information technology represents a
significant loss of investment for information intensive organizations.
Implementation of a successful information technology allocation method
assumes that a means of measuring both information requirement and technology
utilization exists. The combination of these measures in a meaningful theoretical model
with identifiable antecedents and causative factors can provide practical application for
those who must make decisions in regard to information technology acquisition and
allocation.
Purpose of the Study
This study seeks to describe a utilization model that could be generally applied to
quantify information requirements and information technology utilization. In addition,
2
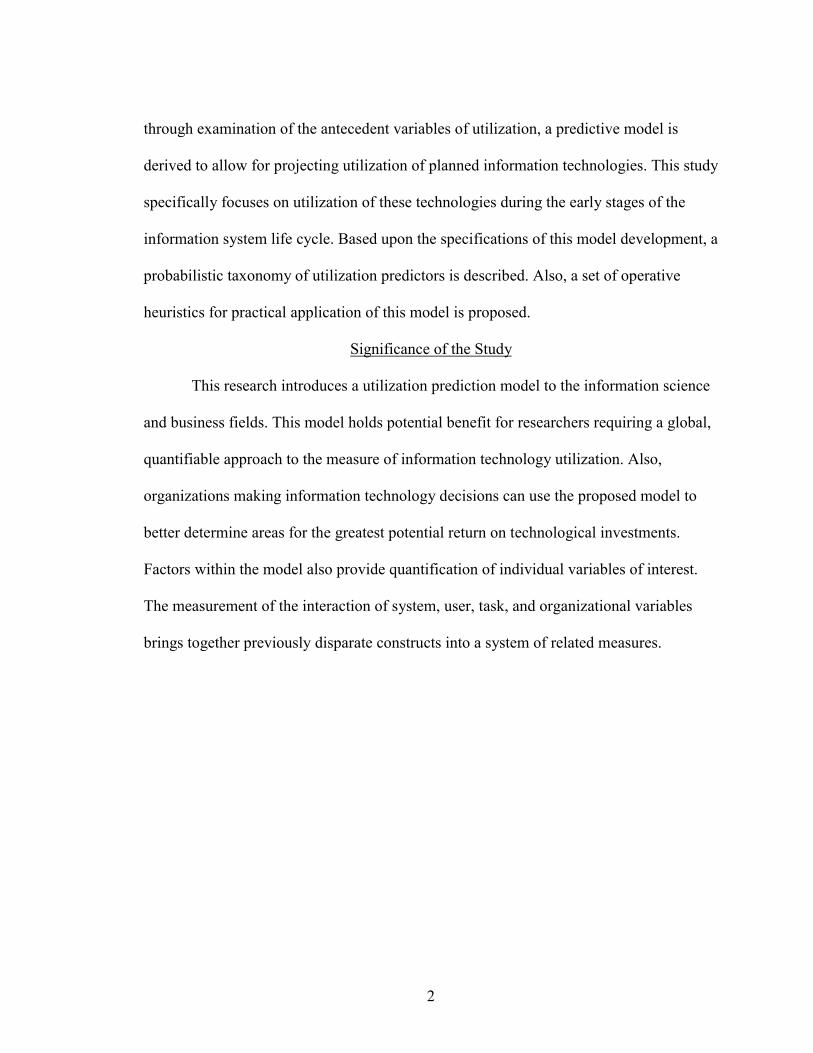
through examination of the antecedent variables of utilization, a predictive model is
derived to allow for projecting utilization of planned information technologies. This study
specifically focuses on utilization of these technologies during the early stages of the
information system life cycle. Based upon the specifications of this model development, a
probabilistic taxonomy of utilization predictors is described. Also, a set of operative
heuristics for practical application of this model is proposed.
Significance of the Study
This research introduces a utilization prediction model to the information science
and business fields. This model holds potential benefit for researchers requiring a global,
quantifiable approach to the measure of information technology utilization. Also,
organizations making information technology decisions can use the proposed model to
better determine areas for the greatest potential return on technological investments.
Factors within the model also provide quantification of individual variables of interest.
The measurement of the interaction of system, user, task, and organizational variables
brings together previously disparate constructs into a system of related measures.

3
Background
Application of Information Technology
Information technology is by definition designed to effectively and efficiently
process information. Framing a potential problem-solution in a quantifiable model
requires the ability to individually quantify problems that arise in information processing.
The universe of information problems can be viewed as a multidimensional problem
space in which any one information problem is represented by a single point in that
space. Corresponding to each point in the problem space is a unique solution space
consisting of all possible solutions to the specific point in problem space.
When faced with a specific information problem that requires a solution, the
individual will navigate through a unique solution space in an attempt to decide on a
specific method of solving the problem. Four primary forces along with the interaction of
these forces can describe this solution space:
1. The individual - defined as the one who will use the solution; thus the
�user,�
2. The problem - defined as the information �task� to be performed or
resolved,
3. The potential solution - which will be defined as the �system� to be
applied whether technological or otherwise, and
4. The organization � the institution that is planning for the use of
information solutions.
These forces were recognized and included in a multidimensional model of
human-computer interaction (HCI) proposed by Jagodzinski and Clarke in 1988. To the
4
traditional array of variables associated with HCI studies, such as terminal dialogue
characteristics, their model added �users� attitudes, beliefs and personal objectives . . . in
complex interaction with the host organisation�s objectives and norms, with its task
structures, and with the general information and misinformation about computers that
exists in the world in general (p. 410).� While many of their measures lack robustness,
their theoretical model and approach illustrate the significance of the primary forces and
their interactions.
The relative strength of any force in determining a solution is a result of the
combined characteristics of the forces and their interactions. The number of all possible
characteristics involved in describing a point, while not infinite, is formidable. An
attempt to characterize a solution space and to predict outcomes of problem and solution
space mappings through measurement of single attributes is an untenable undertaking.
While conceivable within the confines of a controlled environment, practical application
of such a methodology is destined for failure due to the resources required to map points
and predict possible interactions. Also, erroneous deductions due to omissions of
measurements of pertinent attributes are extremely likely since the relative importance of
any one attribute is a dynamic variable temporally dependent upon interactions between
forces in both problem and solution spaces.
Defining a tenable methodology for mapping any solution space is dependent
upon the ability to identify a small number of reliable measures which accurately reflect
the dimensions of a solution space and which can be generally applied to a solution space
independent of the problem space. The only logical candidates for such measures must be
those that focus on describing the interactions between primary forces, since

5
characteristics of these forces define the parameters of the interactions. The interactions
of the forces are then extensions of the attributes of the individual forces and effects from
each force attribute resonate throughout the interactions themselves.
Information Industries
As technological solutions proliferate, there is an increasing need for
organizations to focus on those solutions that best fit the specific mission and objectives
of the organization. Generally, two approaches have been followed in matching
organizational need to potential technology.
Some organizations choose to acquire highly specialized systems that narrowly
focus on solving problems specific to the organization. Whether these systems are
targeted by industry, market segment or other means, they typically are extremely
structured and not designed with flexibility in terms of application to problems in a
particular environment. The second approach is to acquire very general technological
tools designed to be customized by the end user. This approach has the advantage of
flexibility of application, but requires a higher degree of user resource investment and
skills.
After implementation of an information system, many organizations experience
unexpected problems. Often employees either refuse to use the system, under-utilize the
system, or misuse the system. Refusal can be viewed as an avoidance of the area within a
solution space identified by the organization as desirable. Under-utilization represents
failure to maintain position at a desired point in solution space. Finally, misuse can be
described as a failure to adequately apply the desired point in solution space to the
resolution of the initial problem.

6
Interactions of Forces Driving Technology Application
Six interactions can be identified from the four primary forces previously
identified:
1. USER-SYSTEM: this interaction has historically been related to the field
of Human-Computer Interactions (HCI) and can be globally represented
by a measure of system satisfaction.
2. USER-TASK: this interaction can be represented by a measure of
information requirement.
3. USER-ORGANIZATION: an interaction which encompasses not only the
user�s particular place within the organization, but also the user�s
attitudes; job satisfaction is linked to this interaction.
4. SYSTEM-TASK: an interaction that has only recently received formal
attention, this can be characterized through a measure of task-technology
fit.
5. SYSTEM-ORGANIZATION: an interaction that involves the degree to
which the organization champions, endorses, or requires use of a system,
i.e. the organizational support for the system.
6. TASK-ORGANIZATION: this interaction describes the value an
organization places on a particular activity or information and typically
reflects the impact the task has on the organization�s continued existence.
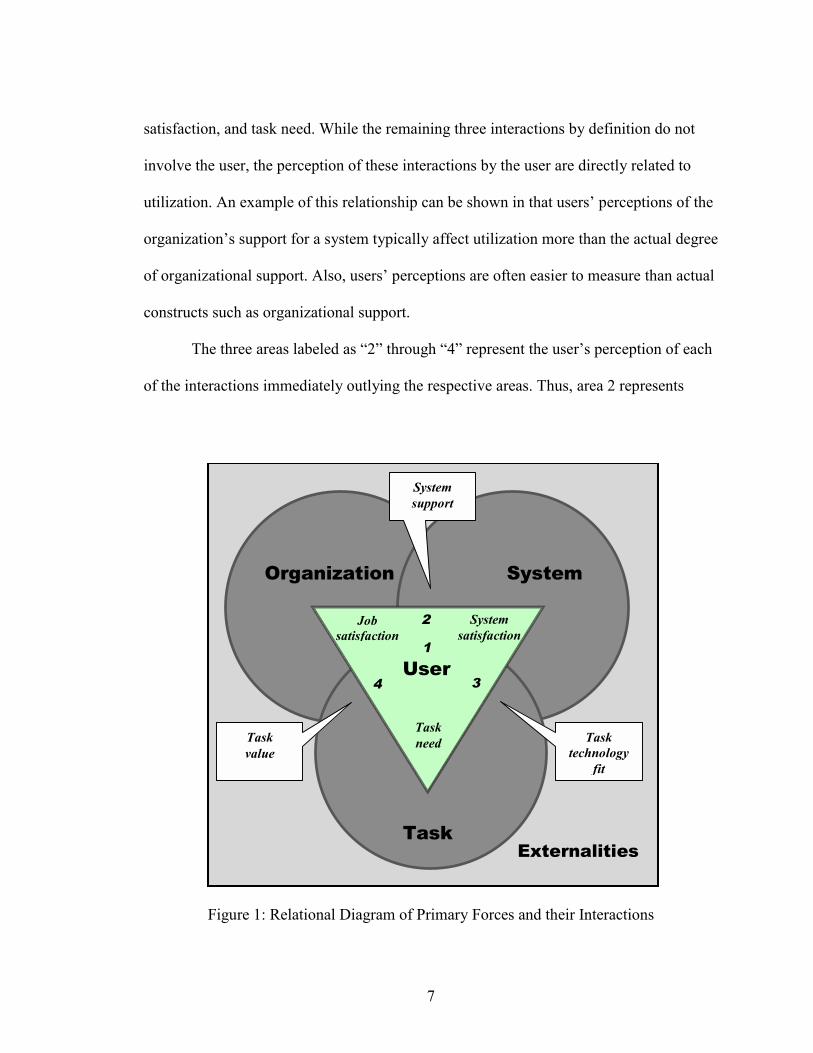
Figure 1 graphically describes these interactions.
As can be seen in this diagram, the user forms the focus for all interactions that
occur in this model. Three interactions involve users directly: job satisfaction, system
7
satisfaction, and task need. While the remaining three interactions by definition do not
involve the user, the perception of these interactions by the user are directly related to
utilization. An example of this relationship can be shown in that users� perceptions of the
organization�s support for a system typically affect utilization more than the actual degree
of organizational support. Also, users� perceptions are often easier to measure than actual
constructs such as organizational support.
The three areas labeled as �2� through �4� represent the user�s perception of each
of the interactions immediately outlying the respective areas. Thus, area 2 represents
Figure 1: Relational Diagram of Primary Forces and their Interactions
Externalities
Organization
User
System
Task
Jobsatisfaction
Systemsatisfaction
TaskneedTask
valueTask
technologyfit
Systemsupport
4 3
2
1
8
the user�s perception of the organization�s support for the system. Likewise, area 3
represents the user�s perception of Perceived-Utility and area 4 represents the user�s
perception of the value of the task to the organization. The remaining area, number 1, is
the confluence of all primary forces: user, system, task and organization. This interaction,
while difficult to quantify, can best be conceptualized as an overall user satisfaction
measure centered within a specific situational context.
Another significant feature of this model is that external factors can affect any of
these interactions. A few examples of external factors affecting the organization might
include market forces, workforce availability and resource costs. For the individual user,
external forces could include such factors as extra-organizational activities, lifestyle, or
family obligations. External factors affecting the task construct typically involve
improved methods or processes that increase or decrease the significance of the task.
9
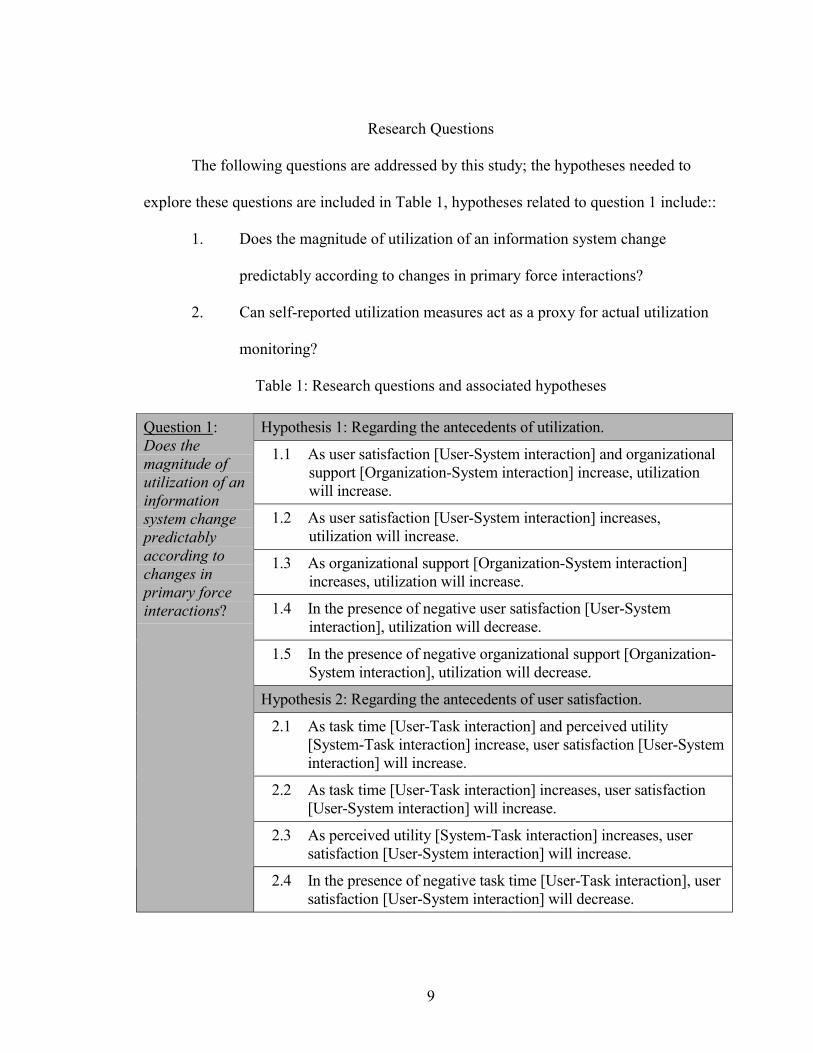
Research Questions
The following questions are addressed by this study; the hypotheses needed to
explore these questions are included in Table 1, hypotheses related to question 1 include::
1. Does the magnitude of utilization of an information system change
predictably according to changes in primary force interactions?
2. Can self-reported utilization measures act as a proxy for actual utilization
monitoring?
Table 1: Research questions and associated hypotheses
Hypothesis 1: Regarding the antecedents of utilization.
1.1 As user satisfaction [User-System interaction] and organizationalsupport [Organization-System interaction] increase, utilizationwill increase.
1.2 As user satisfaction [User-System interaction] increases,utilization will increase.
1.3 As organizational support [Organization-System interaction]increases, utilization will increase.
1.4 In the presence of negative user satisfaction [User-Systeminteraction], utilization will decrease.
1.5 In the presence of negative organizational support [Organization-System interaction], utilization will decrease.
Hypothesis 2: Regarding the antecedents of user satisfaction.
2.1 As task time [User-Task interaction] and perceived utility[System-Task interaction] increase, user satisfaction [User-Systeminteraction] will increase.
2.2 As task time [User-Task interaction] increases, user satisfaction[User-System interaction] will increase.
2.3 As perceived utility [System-Task interaction] increases, usersatisfaction [User-System interaction] will increase.
Question 1:Does themagnitude ofutilization of aninformationsystem changepredictablyaccording tochanges inprimary forceinteractions?
2.4 In the presence of negative task time [User-Task interaction], usersatisfaction [User-System interaction] will decrease.
10
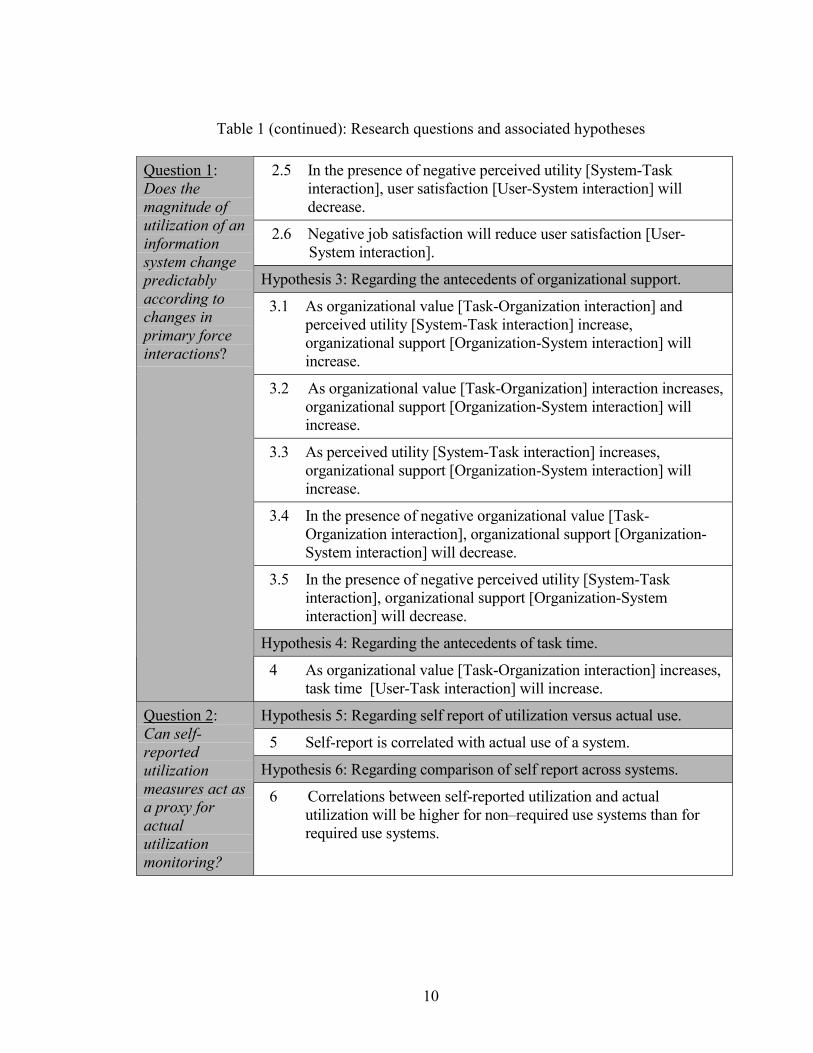
Table 1 (continued): Research questions and associated hypotheses
2.5 In the presence of negative perceived utility [System-Taskinteraction], user satisfaction [User-System interaction] willdecrease.
2.6 Negative job satisfaction will reduce user satisfaction [User-System interaction].
Hypothesis 3: Regarding the antecedents of organizational support.
3.1 As organizational value [Task-Organization interaction] andperceived utility [System-Task interaction] increase,organizational support [Organization-System interaction] willincrease.
3.2 As organizational value [Task-Organization] interaction increases,organizational support [Organization-System interaction] willincrease.
3.3 As perceived utility [System-Task interaction] increases,organizational support [Organization-System interaction] willincrease.
3.4 In the presence of negative organizational value [Task-Organization interaction], organizational support [Organization-System interaction] will decrease.
3.5 In the presence of negative perceived utility [System-Taskinteraction], organizational support [Organization-Systeminteraction] will decrease.
Hypothesis 4: Regarding the antecedents of task time.
Question 1:Does themagnitude ofutilization of aninformationsystem changepredictablyaccording tochanges inprimary forceinteractions?
4 As organizational value [Task-Organization interaction] increases,task time [User-Task interaction] will increase.
Hypothesis 5: Regarding self report of utilization versus actual use.
5 Self-report is correlated with actual use of a system.
Hypothesis 6: Regarding comparison of self report across systems.
Question 2:Can self-reportedutilizationmeasures act asa proxy foractualutilizationmonitoring?
6 Correlations between self-reported utilization and actualutilization will be higher for non�required use systems than forrequired use systems.
11
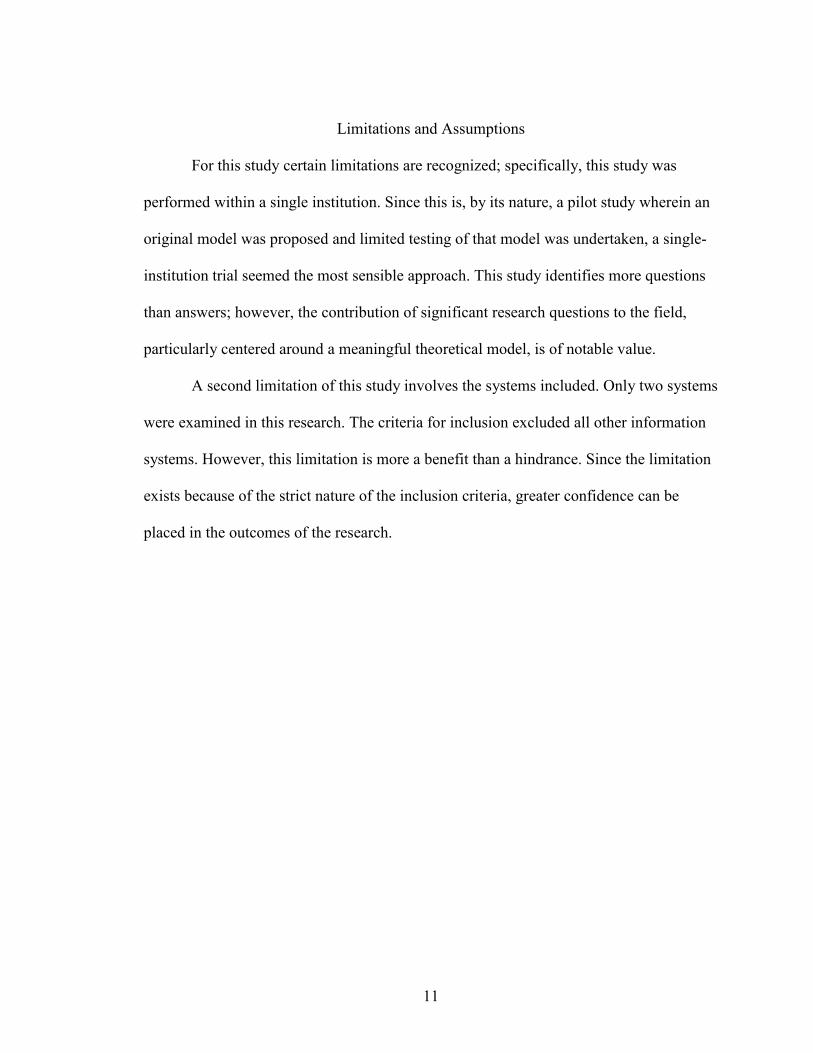
Limitations and Assumptions
For this study certain limitations are recognized; specifically, this study was
performed within a single institution. Since this is, by its nature, a pilot study wherein an
original model was proposed and limited testing of that model was undertaken, a single-
institution trial seemed the most sensible approach. This study identifies more questions
than answers; however, the contribution of significant research questions to the field,
particularly centered around a meaningful theoretical model, is of notable value.
A second limitation of this study involves the systems included. Only two systems
were examined in this research. The criteria for inclusion excluded all other information
systems. However, this limitation is more a benefit than a hindrance. Since the limitation
exists because of the strict nature of the inclusion criteria, greater confidence can be
placed in the outcomes of the research.
12
CHAPTER 2
REVIEW OF THE LITERATURE
Background
The following studies provide important background information for the research
and the development of the model proposed in this study. Many of these studies equate
measures of use with information systems �success.� However, utilization is not the only
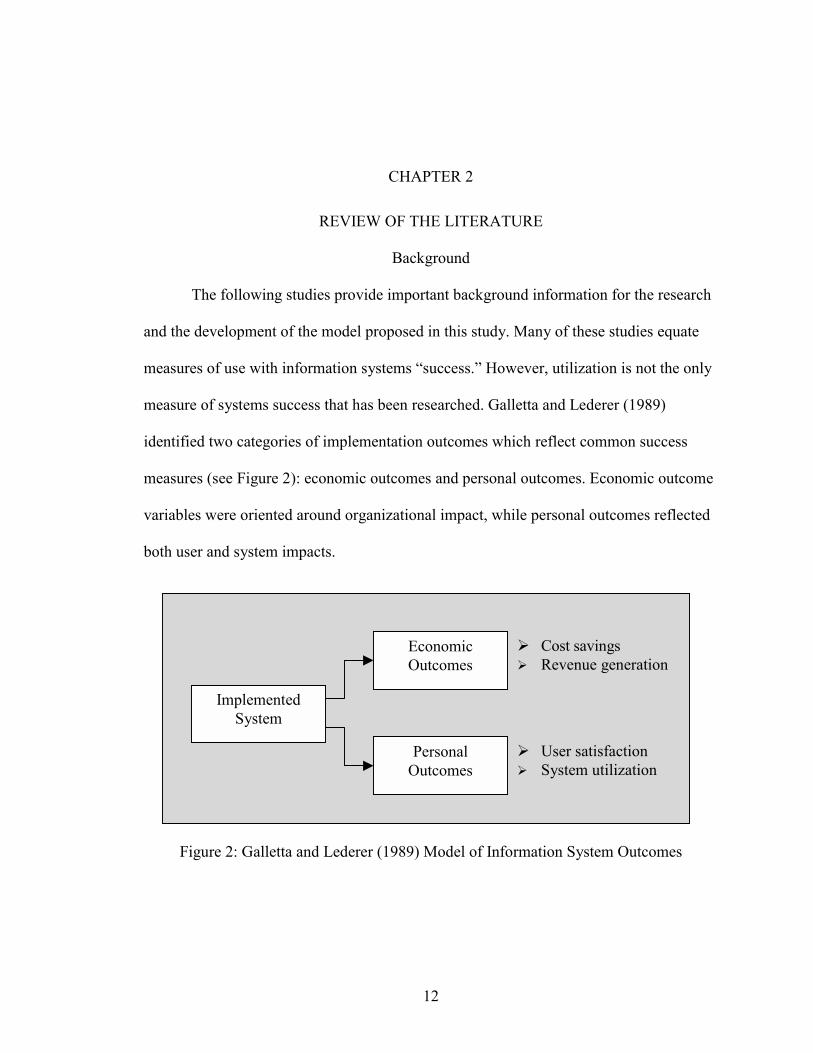
measure of systems success that has been researched. Galletta and Lederer (1989)
identified two categories of implementation outcomes which reflect common success
measures (see Figure 2): economic outcomes and personal outcomes. Economic outcome
variables were oriented around organizational impact, while personal outcomes reflected
both user and system impacts.
Figure 2: Galletta and Lederer (1989) Model of Information System Outcomes
ImplementedSystem
EconomicOutcomes
PersonalOutcomes
! Cost savings! Revenue generation
! User satisfaction! System utilization

13
Most studies have focused on identifying specific independent variables related to system
success rather than categorizating these variables under more general outcome categories.
Although a number of variables have been proposed and examined, somewhat of a
consensus about the more salient variables has been reached. The studies included in this
review reflect the breadth of independent variables which have been examined. Mainly
the literature concentrating on the variables which have been most robust across
populations and methodologies is presented.
Conrath and Sharma (1993) noted that the four most common measures of
information systems success found in the literature include (p. 269):
1. User satisfaction: �an esthetic evaluation measure�
2. System effectiveness: �the effectiveness of an information system in
meeting the organization�s needs�
3. Value: �perceived worth�
4. Utilization: �reported estimates of system usage�
Each of these measures has demonstrated significance in establishing the success of an
information system; however, Conrath and Sharma proposed an instrument that
combined global assessments of each of these measures, positing that measures of the
multi-faceted success construct appear to be more successfully derived by a
multidimensional instrument.
DeLone and McLean (1992) identified a total of six dimensions of Information
Systems (IS) success. Four of the six dimensions coincide with Conrath and Sharma�s
measures. DeLone and McLean�s list includes user satisfaction and utilization (use) along
with organizational effectiveness (compared to system effectiveness) and individual
14
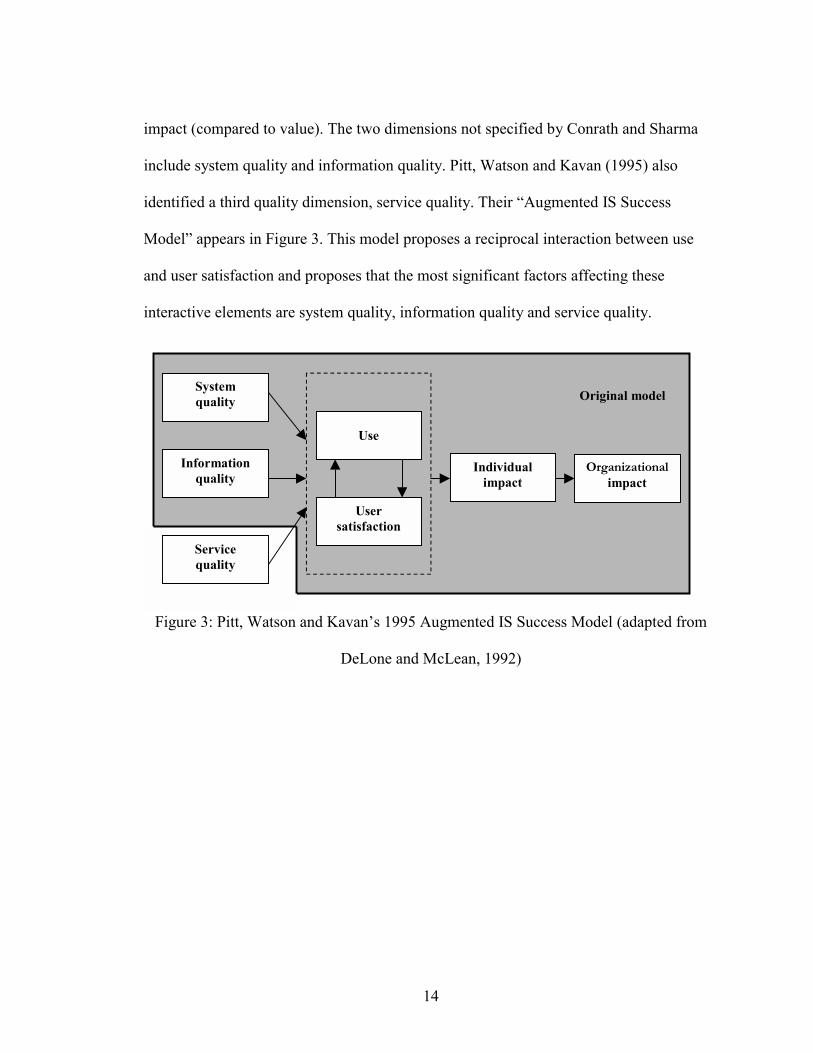
impact (compared to value). The two dimensions not specified by Conrath and Sharma
include system quality and information quality. Pitt, Watson and Kavan (1995) also
identified a third quality dimension, service quality. Their �Augmented IS Success
Model� appears in Figure 3. This model proposes a reciprocal interaction between use
and user satisfaction and proposes that the most significant factors affecting these
interactive elements are system quality, information quality and service quality.
Figure 3: Pitt, Watson and Kavan�s 1995 Augmented IS Success Model (adapted from
DeLone and McLean, 1992)
Servicequality
Informationquality
Systemquality
Use
Usersatisfaction
Individualimpact
Organizationalimpact
Original model
15
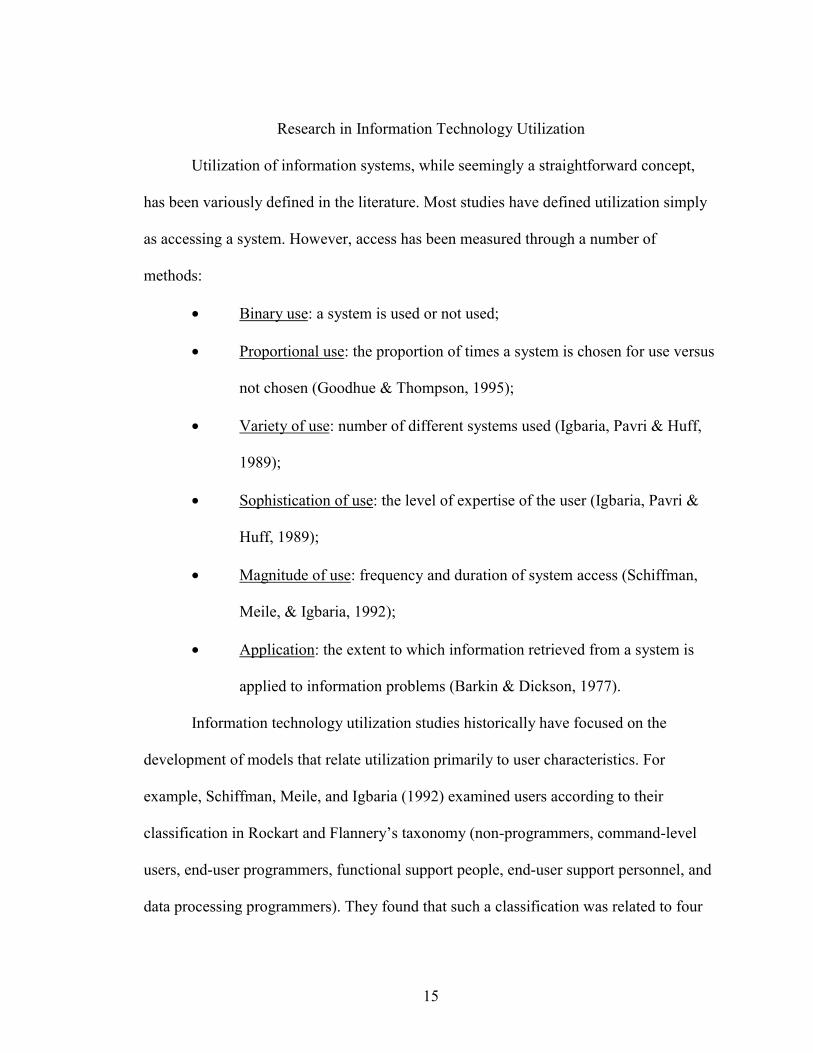
Research in Information Technology Utilization
Utilization of information systems, while seemingly a straightforward concept,
has been variously defined in the literature. Most studies have defined utilization simply
as accessing a system. However, access has been measured through a number of
methods:
• Binary use: a system is used or not used;
• Proportional use: the proportion of times a system is chosen for use versus
not chosen (Goodhue & Thompson, 1995);
• Variety of use: number of different systems used (Igbaria, Pavri & Huff,
1989);
• Sophistication of use: the level of expertise of the user (Igbaria, Pavri &
Huff, 1989);
• Magnitude of use: frequency and duration of system access (Schiffman,
Meile, & Igbaria, 1992);
• Application: the extent to which information retrieved from a system is
applied to information problems (Barkin & Dickson, 1977).
Information technology utilization studies historically have focused on the
development of models that relate utilization primarily to user characteristics. For
example, Schiffman, Meile, and Igbaria (1992) examined users according to their
classification in Rockart and Flannery�s taxonomy (non-programmers, command-level
users, end-user programmers, functional support people, end-user support personnel, and
data processing programmers). They found that such a classification was related to four
16
measures of system utilization: frequency of use, time of use, number of software
applications, and the number of business tasks.
Zmud (1979) also approached the technology utilization and success question
from the primary perspective of user characteristics. His early review of the IS �success�
literature allowed development of a model which recognized the impact of attitudinal and
cognitive influences on individual differences. These influences affected success directly
and indirectly through the involvement of users in system design characteristics. Zmud
also observed that the user satisfaction construct demonstrated consistent positive
associations with usage.
Some studies have also attempted to fit system characteristics into a theoretical
model; however, very few have recognized the more global orientation which
incorporates user, system, task, and organization attributes in a single model. Part of this
deficiency may be due to the difficulty in measuring enough representative attributes to
sufficiently represent a useful model. Borovits and Giladi�s (1993) research, while based
in a systems orientation, does attempt to bridge to a more global perspective by
incorporating �peopleware� as a component of systems success. Also, they recognize that
system performance can be considered on several levels, including the organizational
level, the IS level, the application level, and the job level. However their proposed model
is limited to measurement of utilization through a proportional approach combined with
cost information. Thus the model lacks incorporation of organizational, task and a
majority of user factors.
Other studies, while maintaining a user orientation, have indirectly incorporated
measures reflecting other primary factors. Igbaria and Parasuraman (1991) identified five
17
dimensions underlying attitudes towards computers which affected use: �perceived
utility; limited hardware/software capacity; problems in use; time requirements; and user-
friendliness (p. 563).� The interactions of user-system, and system-task can clearly be
seen in several of these dimensions. Robey (1979) also listed determinants of system use
found in the literature. Among the determinants reviewed by Robey were �user attitudes
and perceptions, technical quality of the system, performance, situational and personal
factors, and decision style (p. 528).�
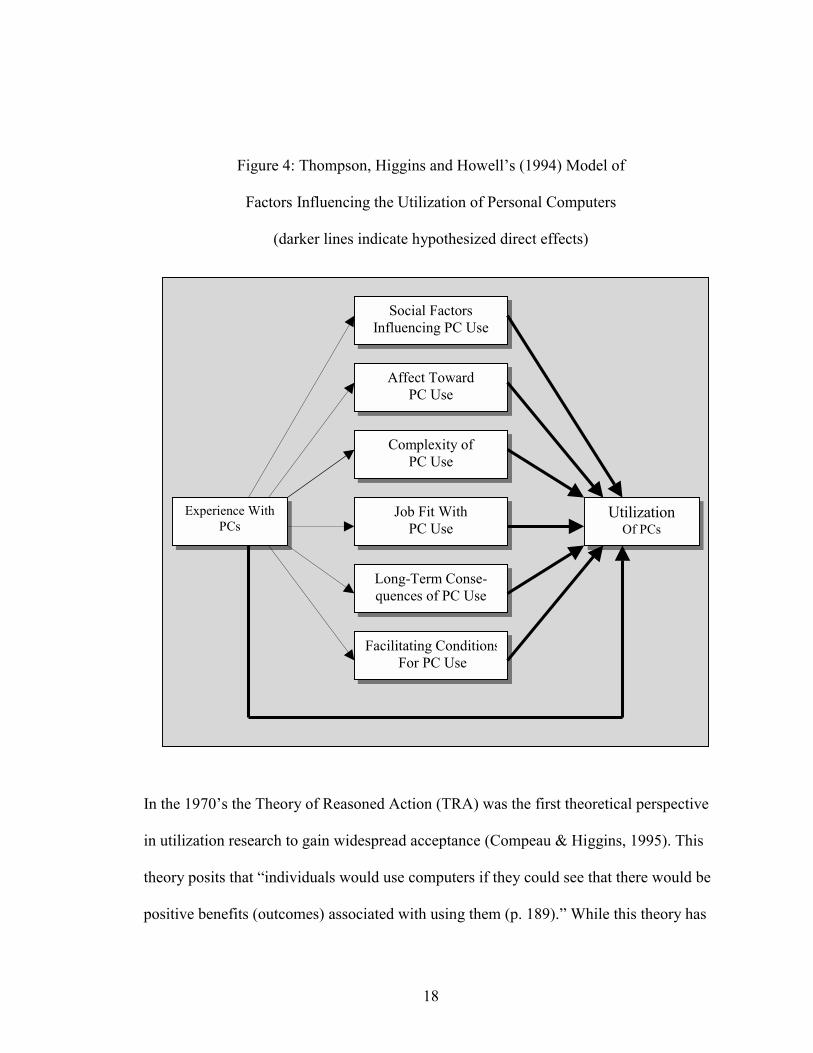
The combined effect of these user attributes and user perceptions over time is
directly influenced by specific experiences with various computer systems. This is the
basis for the 1994 research by Thompson, Higgins and Howell which tested a conceptual
model directly linking past experience with personal computers to current utilization of
personal computers (Figure 4). The results of their analysis indicated that:
The direct influence of experience was both statistically and substantively
significant (b = 0.23). . . The combined indirect effects of experience on
utilization was 0.22, dispersed as relatively small effects through the
intervening variables . . . This implies that indirect effects may be added to
provide additional understanding, but may provide little information with
respect to additional prediction of behavior (p. 181).
These findings support the idea that variability in effects of utilization are less likely to be
well accounted for by granular measurements of primary force characteristics than by
measurements of primary force interactions.
18
Figure 4: Thompson, Higgins and Howell�s (1994) Model of
Factors Influencing the Utilization of Personal Computers
(darker lines indicate hypothesized direct effects)
In the 1970�s the Theory of Reasoned Action (TRA) was the first theoretical perspective
in utilization research to gain widespread acceptance (Compeau & Higgins, 1995). This
theory posits that �individuals would use computers if they could see that there would be
positive benefits (outcomes) associated with using them (p. 189).� While this theory has
Experience WithPCs
UtilizationOf PCs
Facilitating ConditionsFor PC Use
Long-Term Conse-quences of PC Use
Job Fit WithPC Use
Complexity ofPC Use
Affect TowardPC Use
Social FactorsInfluencing PC Use
19
demonstrated widespread validity, it does not sufficiently account for all variables
necessary to explain utilization. Some researchers have suggested that beliefs about
outcomes are actually tempered by the user�s expectations about their own capabilities in
regard to the technology (Igbaria & Iivari, 1995). A variable added to the pool of
explanatory factors of utilization to reflect this expectation about one�s own capabilities
was �self-efficacy.� Taken from the Social Cognitive Theory of Albert Bandura, self-
efficacy is �the belief that one has the capability to perform a particular behavior
(Compeau & Higgins, 1995, p. 189).� In reference to technology use, self-efficacy �refers
to a judgment of one�s capability to use a computer.� Other factors influencing utilization
which have been identified from Social Cognitive Theory include encouragement by
others, others� use of technology, organizational support, outcome expectations, affect
and anxiety. Diffusion of innovation theory and adoption characteristics have also been
combined with the TRA model to predict system utilization (Moore & Benbasat, 1996).
In 1986 Fred Davis introduced an adaptation of TRA that he called the
Technology Acceptance Model (TAM). This adaptation was specifically designed to
model user acceptance of information systems in general (see Figure 5). In Davis,
Bagozzi and Warshaw�s (1989) words:
The goal of TAM is to provide an explanation of the determinants of
computer acceptance that is general, capable of explaining user behavior
across a broad range of end-user computing technologies and user
populations, while at the same time being both parsimonious and
theoretically justified. . . . A key purpose of TAM, therefore, is to provide
a basis for tracing the impact of external factors on internal beliefs,
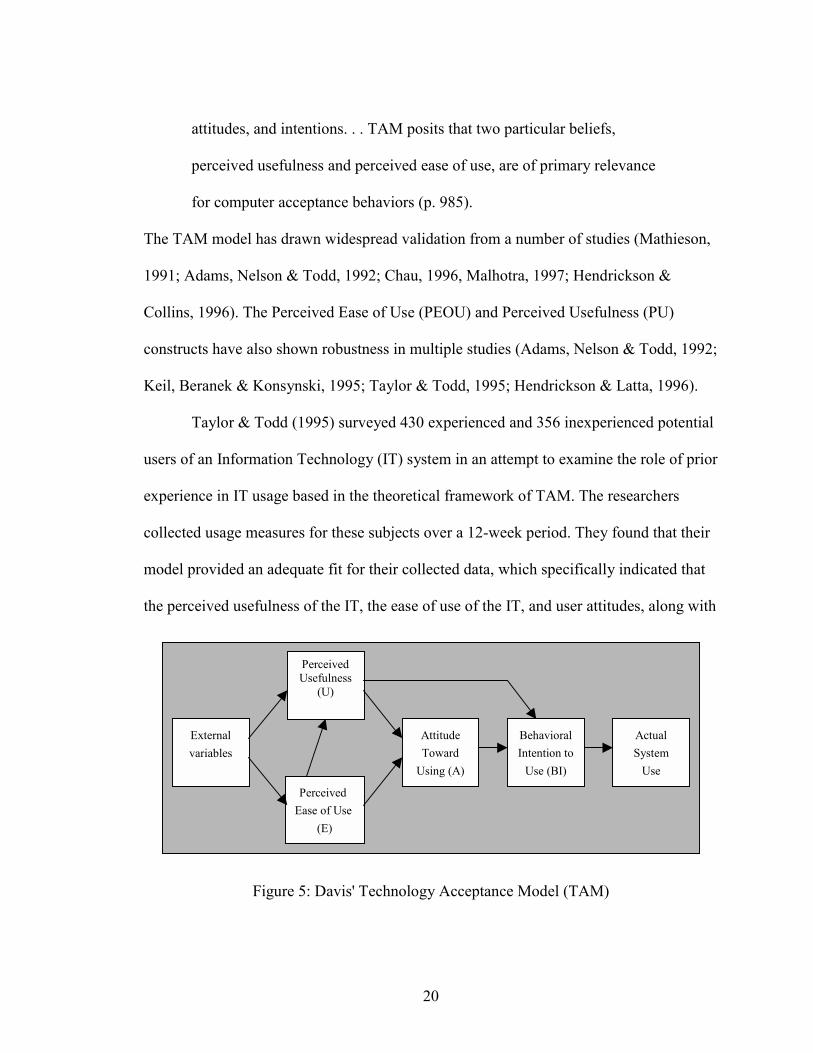
20
attitudes, and intentions. . . TAM posits that two particular beliefs,
perceived usefulness and perceived ease of use, are of primary relevance
for computer acceptance behaviors (p. 985).
The TAM model has drawn widespread validation from a number of studies (Mathieson,
1991; Adams, Nelson & Todd, 1992; Chau, 1996, Malhotra, 1997; Hendrickson &
Collins, 1996). The Perceived Ease of Use (PEOU) and Perceived Usefulness (PU)
constructs have also shown robustness in multiple studies (Adams, Nelson & Todd, 1992;
Keil, Beranek & Konsynski, 1995; Taylor & Todd, 1995; Hendrickson & Latta, 1996).
Taylor & Todd (1995) surveyed 430 experienced and 356 inexperienced potential
users of an Information Technology (IT) system in an attempt to examine the role of prior
experience in IT usage based in the theoretical framework of TAM. The researchers
collected usage measures for these subjects over a 12-week period. They found that their
model provided an adequate fit for their collected data, which specifically indicated that
the perceived usefulness of the IT, the ease of use of the IT, and user attitudes, along with
Figure 5: Davis' Technology Acceptance Model (TAM)
External
variables
PerceivedUsefulness
(U)
Attitude
Toward
Using (A)
Actual
System
Use
Behavioral
Intention to
Use (BI)
Perceived
Ease of Use
(E)
21
several other variables provided for a determination of IT usage. Predictive validity for
the Perceived Usefulness and Perceived Ease of Use constructs within the TAM model
has also been demonstrated (Szanja, 1994).
The roots of the perceived usefulness construct predate the TAM model. The
theoretical grounds for the construct can be found in expectancy theory. This theory
�asserts that the perceived relative attractiveness of various options is related to people�s
beliefs about the consequences to which each option will lead and their beliefs about the
desirability of these consequences (Chau, 1996, p.189).� Larcker and Lessig (1981)
examined constructs proposed in the literature related to the idea of perceived usefulness.
They identified two primary dimensions of perceived usefulness which they termed
�perceived useableness� and �perceived importance.� Perceived useableness reflects
whether the information format is �unambiguous, clear, or readable.� The formal
definition applied to this dimension would �refer to the information quality that allows a
decision maker to utilize the set as an input for problem solution.� Whether information
is �relevant, informative, meaningful, important, helpful, or significant� reflects the
perceived importance dimension. Formally stated, �perceived importance will refer to the
quality that causes a particular item set to acquire relevance to the decision maker (p.
123).� Adams, Nelson and Todd (1992) later set these two dimensions within the larger
context of the TAM.
Chin and Todd (1995) reviewed Adams, Nelson and Todd�s (1992) analysis of the
TAM and the question of bi-dimensional components of the perceived usefulness
construct. Chin and Todd found no empirical support for the separation of usefulness into
two dimensions, and criticized the analysis of Adams, et al. based on inappropriate cross
22
validation, item and construct confounds, the likelihood of capitalization of chance (due
to a small sample), and a lack of substantive theoretical rationale.
Recently another utilization model has been proposed in the literature. Goodhue
and Thompson (1995) proposed a model called the Technology-to-Performance Chain
(TPC) which asserts that �for an information technology to have a positive impact on
individual performance, the technology must be utilized, and the technology must be a
good fit with the tasks it supports (p. 213).� They developed their model by integrating
the previously disparate streams of research focusing on technology utilization and task-
technology fit (TTF). The utilization-focused research emphasizes �user attitudes and
beliefs to predict the utilization of information systems (p.214).� The task-technology fit
research has explored the performance impacts that result �when a technology provides
features and support that �fit� the requirements of a task (p.214).�
Central to Goodhue and Thompson�s proposals are the limitations they attribute to
pure utilization measures in isolation from other significant factors affecting performance
of the system and the user. They noted that �to the extent that utilization is not voluntary,
performance impacts will depend increasingly upon task-technology fit rather than
utilization (p. 216).� In regard to performance impacts, Goodhue and Thompson also
observed that
. . .there is little explicit recognition that more utilization of a system will
not necessarily lead to higher performance. Utilization of a poor system
(i.e. one with low TTF) will not improve performance, and poor systems
may be utilized extensively due to social factors, habit, ignorance,
availability, etc., even when utilization is voluntary.
23
Baroudi, Olson and Ives (1986) actually incorporated the idea of TTF into their
measures of system usage in the decade prior to Goodhue and Thompson�s efforts. In
their own words:
A set of activities typically performed or supervised by production
managers was identified from production management textbooks and
handbooks. The list of activities was reviewed by two experts in
production management who suggested minor modifications. A set of
questions was then formulated regarding a manager�s past use of
information systems to support the identified activities (p.234-5)
An effort has been made to integrate the TAM and TTF models since the theories
underlying both models have specific elements in common. These elements are derived
from the proposition that a persons engages in a behavior �because he or she has
evaluated the benefits of engaging in that behavior and expects a certain result (Dishaw &
Strong, 1997).� With high TTF, expected benefits should be more likely. Dishaw and
Strong (1997) demonstrated that while TAM and TTF both directly affect utilization,
TTF also �indirectly determines Perceived Usefulness through the mediation of Perceived
Ease of Use.�
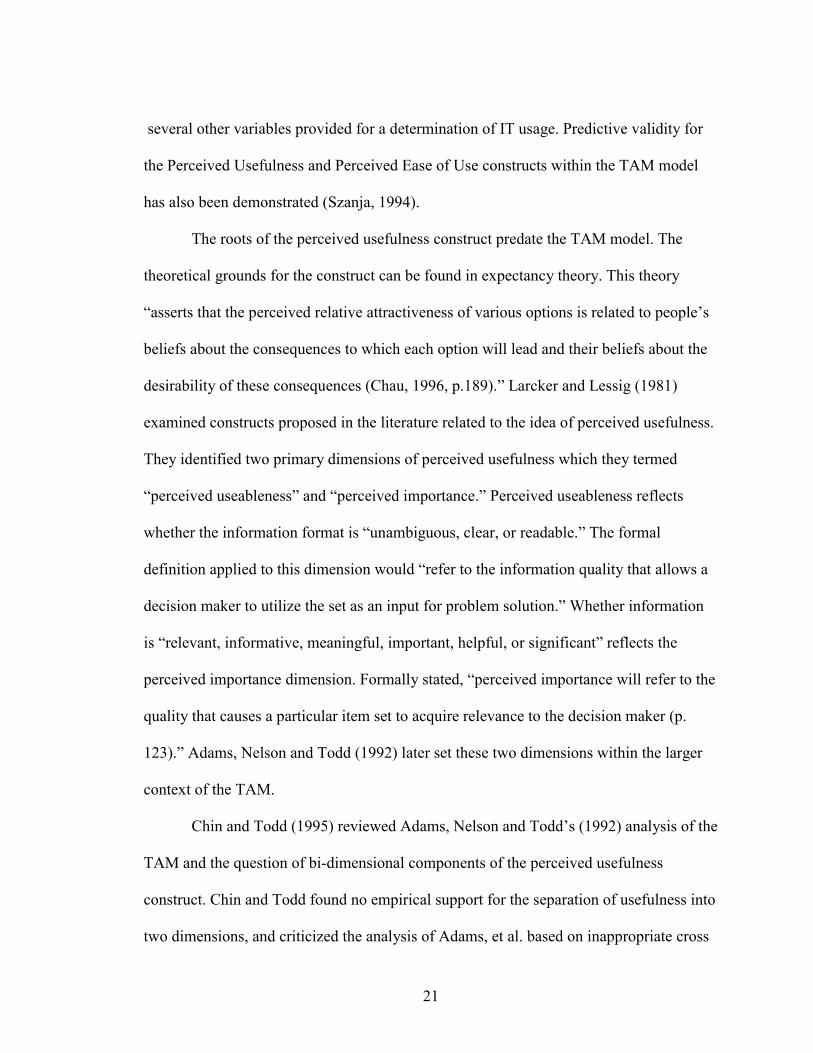
Igbaria, Parasuraman and Baroudi (1996) proposed a motivational model of
microcomputer usage which consolidated theoretical frameworks from much of the
previous utilization literature. Their model, presented in Figure 6, shows the effects of
concepts drawn from the TRA and TAM models along with other social and antecedent
variables. The model variables in this study accounted for 28 percent of the variance on
usage. The researchers suggested other variables which might help account for more
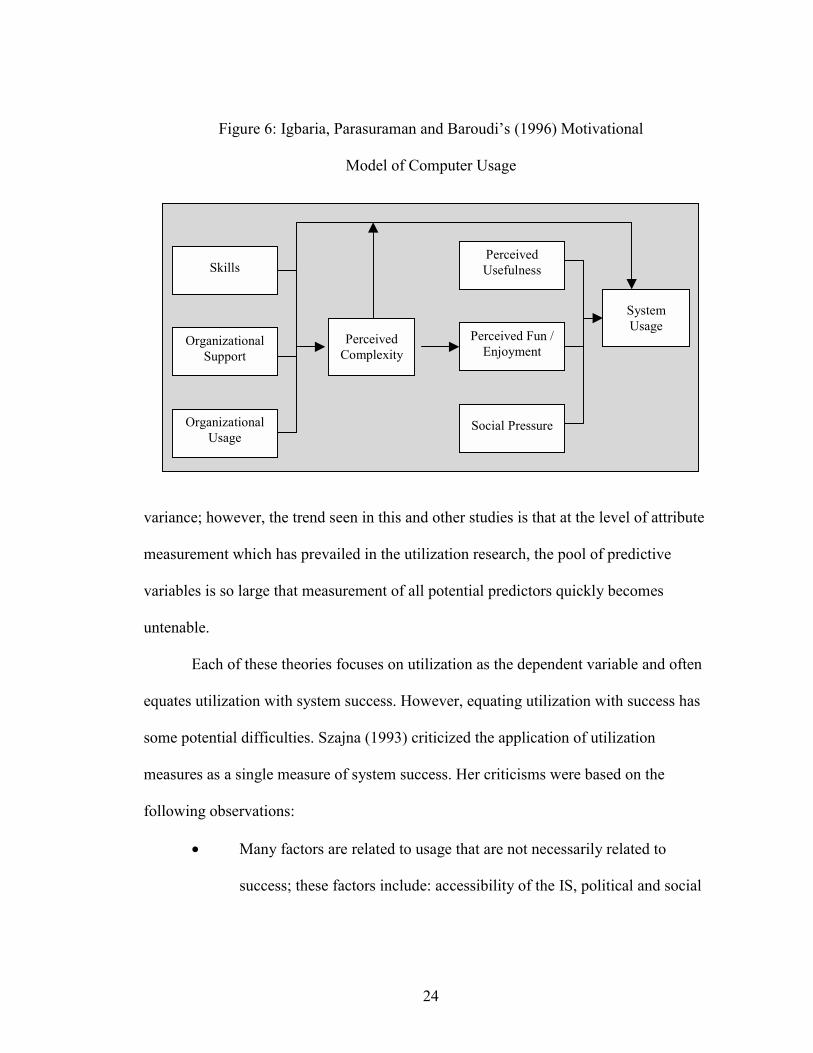
24
Figure 6: Igbaria, Parasuraman and Baroudi�s (1996) Motivational
Model of Computer Usage
variance; however, the trend seen in this and other studies is that at the level of attribute
measurement which has prevailed in the utilization research, the pool of predictive
variables is so large that measurement of all potential predictors quickly becomes
untenable.
Each of these theories focuses on utilization as the dependent variable and often
equates utilization with system success. However, equating utilization with success has
some potential difficulties. Szajna (1993) criticized the application of utilization
measures as a single measure of system success. Her criticisms were based on the
following observations:
• Many factors are related to usage that are not necessarily related to
success; these factors include: accessibility of the IS, political and social
PerceivedComplexity
SystemUsage
Skills
OrganizationalSupport
OrganizationalUsage
PerceivedUsefulness
Perceived Fun /Enjoyment
Social Pressure
25
pressure, users� prior computer experience, amount of training received,
amount of computer anxiety, and other individual user characteristics.
• Levels of usage are difficult to measure in terms of ideal or sufficient use.
Different systems or users may experience �successful� use with different
levels of use.
• The level of �voluntariness� can affect use of a system: �if no alternative
information source is available, or political/social influences exist, then
the decision to utilize the system may not be truly at the user�s command
(p. 148).�
• The relevance of the information system and its output to the decision-
making task can have a bearing upon the success of the system: �with
some usage measures an increase in usage can increase the time spent in
decision making and decrease the efficiency of the process (p. 149).�
Szajna�s criticisms are repeated in other studies and provide a caution to all research
which attempts to model utilization as a dependent variable without first recognizing the
precursors which affect both utilization and success.
26
Research in Information Technology Satisfaction
Research focusing on information technology satisfaction addresses as a primary
issue the definition of satisfaction itself. After a significant review of the pertinent
literature, a much cited study by Bailey and Pearson (1983) defined satisfaction as: �in a
given situation . . . the sum of one�s feelings or attitudes toward a variety of factors
affecting that situation (p. 531).� Bailey and Pearson also identified 36 distinct factors in
22 studies from the human-computer interaction literature which affect user satisfaction.
From these factors, they developed a semantic differential instrument which included
three additional factors for a total of 39 factors. This instrument represents an early
attempt at formalization of a measure for user satisfaction. However, the more significant
contribution of this study was the attempt to incorporate the concepts used in this
instrument into a formal definition of satisfaction, namely � the weighted sum of a user�s
positive or negative reaction to a set of 39 factors (p. 538)� or
Where Rij = The reaction to factor j by individual i and Wij = The importance of factor j to
individual i.
In a 1988 study, Doll and Torkzadeh piloted a 40-item questionnaire to assess
end-user computing satisfaction (EUCS). After multiple administrations and analysis of
the pilot form, a final instrument consisting of twelve items was derived. The components
contributing to this final satisfaction measure were identified under five categories:
content, accuracy, format, ease of use, and timeliness. Doll and Torkzadeh�s EUCS
∑=
=n
jijiji WRS
1
27
instrument has demonstrated continued reliability and validity in subsequent studies
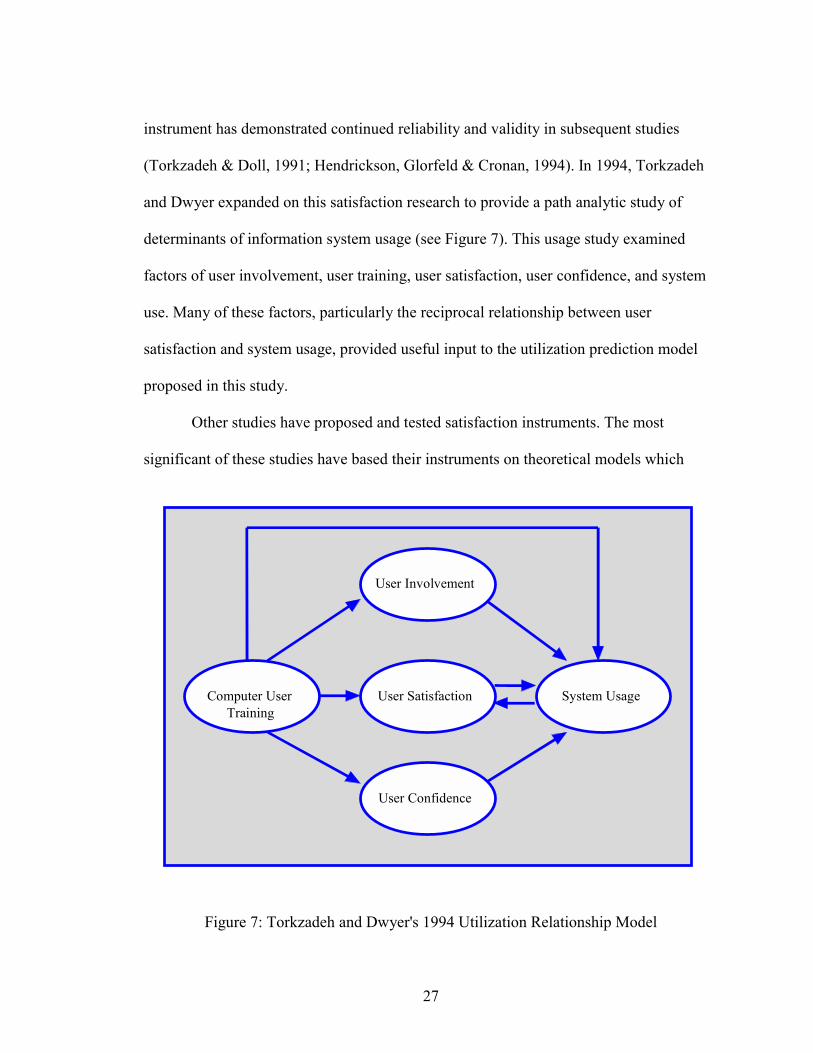
(Torkzadeh & Doll, 1991; Hendrickson, Glorfeld & Cronan, 1994). In 1994, Torkzadeh
and Dwyer expanded on this satisfaction research to provide a path analytic study of
determinants of information system usage (see Figure 7). This usage study examined
factors of user involvement, user training, user satisfaction, user confidence, and system
use. Many of these factors, particularly the reciprocal relationship between user
satisfaction and system usage, provided useful input to the utilization prediction model
proposed in this study.
Other studies have proposed and tested satisfaction instruments. The most
significant of these studies have based their instruments on theoretical models which
Figure 7: Torkzadeh and Dwyer's 1994 Utilization Relationship Model
User Satisfaction
User Confidence
System Usage
User Involvement
Computer UserTraining
28
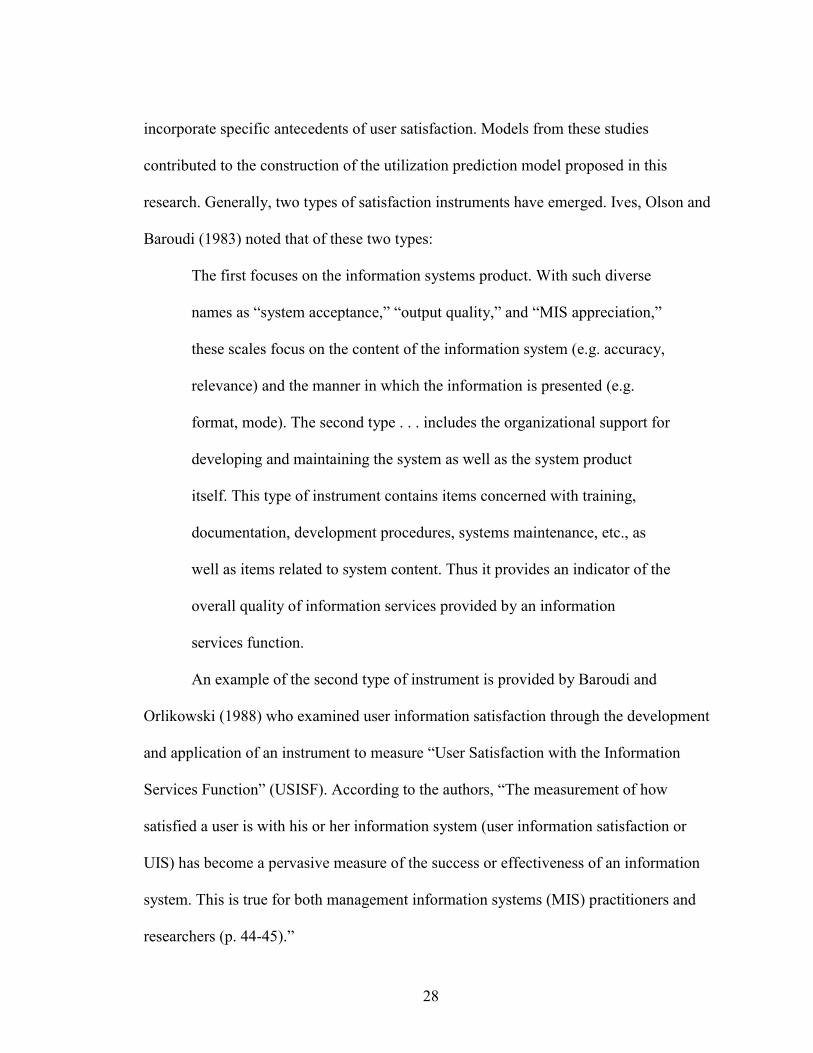
incorporate specific antecedents of user satisfaction. Models from these studies
contributed to the construction of the utilization prediction model proposed in this
research. Generally, two types of satisfaction instruments have emerged. Ives, Olson and
Baroudi (1983) noted that of these two types:
The first focuses on the information systems product. With such diverse
names as �system acceptance,� �output quality,� and �MIS appreciation,�
these scales focus on the content of the information system (e.g. accuracy,
relevance) and the manner in which the information is presented (e.g.
format, mode). The second type . . . includes the organizational support for
developing and maintaining the system as well as the system product
itself. This type of instrument contains items concerned with training,
documentation, development procedures, systems maintenance, etc., as
well as items related to system content. Thus it provides an indicator of the
overall quality of information services provided by an information
services function.
An example of the second type of instrument is provided by Baroudi and
Orlikowski (1988) who examined user information satisfaction through the development
and application of an instrument to measure �User Satisfaction with the Information
Services Function� (USISF). According to the authors, �The measurement of how
satisfied a user is with his or her information system (user information satisfaction or
UIS) has become a pervasive measure of the success or effectiveness of an information
system. This is true for both management information systems (MIS) practitioners and
researchers (p. 44-45).�
29
Kettinger and Lee (1994) also provide examples of the second type of satisfaction
instrument in their examination of the constructs of perceived service quality and user
satisfaction with the IS function. They compared SERVQUAL (an instrument from the
marketing literature measuring customer perceived service quality) and Baroudi and
Orlikowski�s 1988 USISF instrument. Their findings suggest that SERVQUAL may
provide more comprehensive measures of IS service quality. Kettinger and Lee also
discussed several important issues in regard to the measurement of service quality and
related constructs. However, both conceptual and empirical issues have been raised with
these service quality measures (Van Dyke, Kappelman, & Prybutok, 1999).
The expanding dependencies relating to user satisfaction were further explored in
another study by Igbaria and Nachman (1990). They examined correlates of satisfaction
and IT use in six different industries and found significant relationships between IT
satisfaction and the leadership styles of users, the availability/accessibility of IT, and the
computer anxiety of users. Lee, Kim, & Lee (1995) added to the pool of satisfaction
related variables by proposing a model that described relationships between the
acceptance, effectiveness and training components of information system
implementation. This model identified strong relationships between IS acceptance, IS
satisfaction, end-user ability and system utilization. The emphasis of the study was on the
need for training of end-users; however, the information concerning system utilization
provides insight into some potentially key causal factors.
In 1996 Kappelman expanded on earlier work focused on training as a
determinant of satisfaction. Kappelman posited that the psychological dimension of
�User System Involvement� is the actual precursor of satisfaction (and thus success) and
30
that user training represented only one factor contributing to the involvement construct.
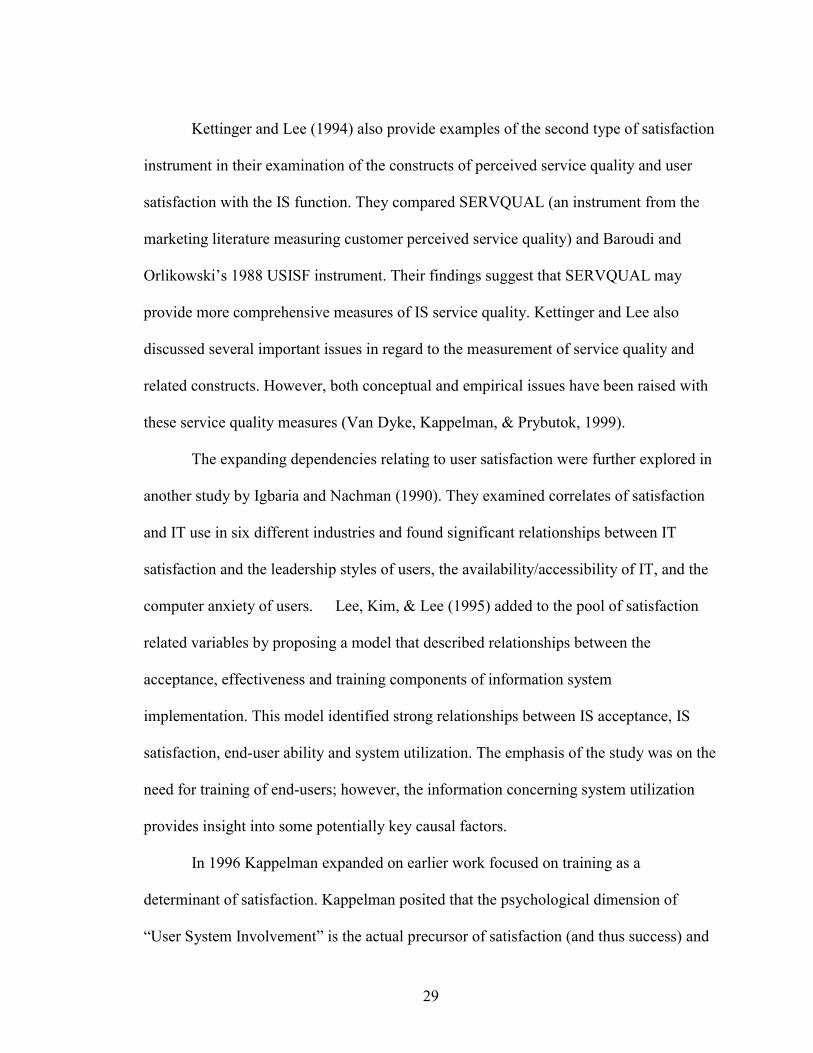
The user involvement construct was also expanded and amended by McKeen, Guimareas
and Wetherbe (1994) to include other types of involvement and to reflect the influence of
mediating variables. Figure 8 shows the relationships found in McKeen et al.�s results.
The influence of task and system characteristics has been added as mediating variables
and organizational attributes are inherent in the user participation, communication and
influence variables. Kim, Suh and Lee (1998) focused primarily upon the task uncertainty
characteristic in the development of a model predicting both user satisfaction and
utilization. In this, as in many recent studies, the relationships between task, user and
system continue to come to the forefront of model development and research.
Figure 8: McKeen, Guimareas and Wetherbe�s (1994) Relationships Found
among Research Variables
User Influence
User-DeveloperCommunication
Task ComplexitySystem Complexity
User Participation User Satisfaction
Independent Variables
Moderating Variables
Dependent Variable

31
Research in Adoption & Diffusion of Innovation
Rogers� diffusion process models have provided a significant theoretical
foundation for many studies since their proposal. Hightower and Brightman (1994)
reviewed five innovation attributes identified by Rogers that help explain adoption
decisions (p. 12):
1. Relative advantage is the degree to which an innovation is perceived as
being better than the idea it supersedes.
2. Compatibility is the degree to which an innovation is perceived as
consistent with the existing values, past experiences, and needs of
potential adopters.
3. Complexity is the degree to which an innovation is perceived as relatively
difficult to understand and use.
4. Trialability is the degree to which an innovation may be experimented
with on a limited basis.
5. Observability is the degree to which the results of an innovation are visible
to others.
Keil, Beranek and Konsynski (1995) examined the usefulness and ease of use (EOU)
constructs in relation to utilization through the diffusion of innovation literature.
Specifically, they state that �in diffusion of innovation terms, usefulness can be mapped
to the concept of �relative advantage,� or the degree to which the innovation is perceived
as better than existing practice (p. 77).� They also observe that EOU �can be viewed as
inversely related to the concept of �complexity� (p. 77).� Relating these constructs to
utilization, they call upon Davis, Bagozzi and Warshaw (1989) who suggested that �the
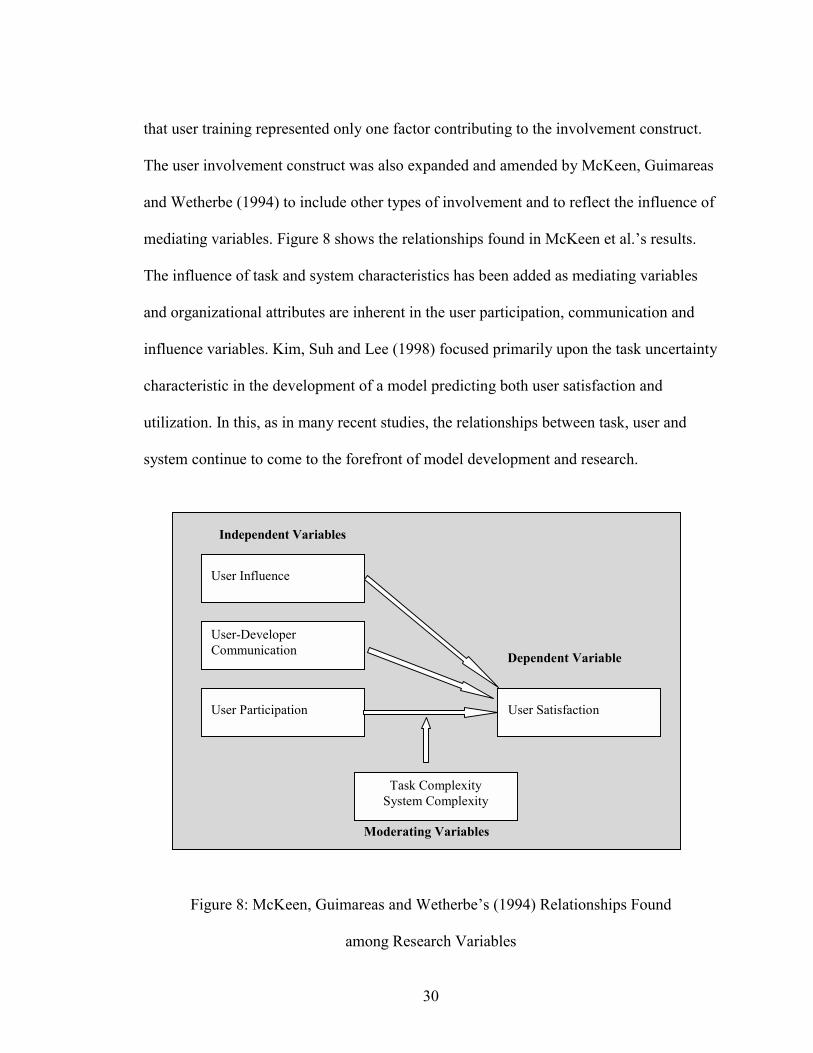
32
Figure 9: Usefulness/EOU Grid
primary impact of EOU on use is expressed indirectly through its effect on usefulness (p.
79).� Chin and Gopal (1995) reinforced the salience of this construct in a study about
adoption of group support systems (GSS) by finding that �relative advantage appears to
be the most important criterion for an individual when determining which GSS among
several is the best for that individual (p. 59).�
Keil et al. also present a framework for understanding the relationship of EOU
and usefulness to adoption which they called the �Usefulness/EOU Grid� (see Figure 9).
While crediting McLean for the basic framework, they describe �a 2x2 grid where each
quadrant represents a different combination of the two attributes.� They also point out
that �in the context of software development and implementation, the usefulness/EOU
grid provides a mechanism for discussing the current mix of usefulness and EOU and for
EOU
HighII
ToysIV
Super Tools
LowI
Rejects
IIIPower User Tools
Low High
Usefulness
33
plotting a future course if a different mix is desired (p. 78-79).� The quadrant that is
characterized by the highest degree of utilization is quadrant IV. Systems in this quadrant
possess both a high degree of EOU and usefulness. Thus, they are more likely to attract
initial use, and because of their applicability and benefit, likely to result in continued use.
Other studies have focused more on organizational aspects of adoption than user
characteristics. Iacovou, Benbasat, and Dexter (1995) examined three major factors that
influence IT adoption practices among small organizations. These factors were
organizational readiness, external pressures to adopt, and perceived benefits. The most
salient reason for adoption among these organizations was external pressures, especially
from trading partners. However, the benefits from adoption due to these external
pressures were found to be limited without an accompanying willingness and ability to
integrate the new technology into operational procedures.
Williams et al. (1997) introduced their research on organizational adoption of
electronic commerce with a review of organizational and inter-organizational factors
significant to adoption of technology in general. Factors mentioned include:
• Organizational structure: �a centralized decision-making structure may
facilitate . . . adoption�
• The degree to which �an innovation is perceived as being better than the
idea it supercedes�
• Consistency with current systems
• Support by top management and a management champion
• Adoption by similar firms or channel partners
• Endorsement of the technology by formal industry structures
34
• Dependence of trading partners
• The transaction climate
Premkumar and Ramamurthy (1995) mention other relative advantage concepts including
�the ability of the innovation to cut costs in operations, provide clerical efficiency,
provide timely and accurate decision making information, and aid in service
differentiation.�
Externalities can also play a significant role in the adoption of technologies.
Besley and Case (1993) reviewed various empirical approaches to the analysis of
technology adoption. In this review they also cited three sources of external influence on
adoption choices (p. 399):
i. Network Externalities.�Adopters care about how many other individuals
adopt because there is some public-good element to the technology.
ii. Market Power Externalities.�Adopters with market power will care about
adoption by others if adopting early implies some advantage in market
power.
iii. Learning Externalities.�[Adopters] may care about others� adoption
decisions if early adopters teach late adopters something.
The technology adoption and diffusion of innovation literature is quite broad and
meta-analysis of results from studies in this area can result in contradictory findings;
however, by segmenting this literature into logical categories, meta-analytical studies
become more consistent. Prescott and Conger (1995) illustrate this principle in their
summary of the diffusion of innovation (DOI) literature published between 1984 and
35
early 1995. They review 70 representative information technology-related DOI studies
and propose that the seemingly contradictory results obtained from DOI research can be
understood more clearly through the use of a classification scheme. In this scheme they
�distinguish between innovations according to their locus of impact (information system
[IS] unit, intra- or inter-organizational) and between studies according to their research
approach (factor or stage) (p. 21).� Primary comparisons were drawn within locus of
impact and research approach classifications; however, the authors also compared across
classifications. According to Prescott and Conger, the �classification scheme reveals that
the diffusion process for each type of innovation may be sensitive to different
environmental, managerial, technological or functional contingencies (p. 33).� Again, the
significance of these primary forces on IT outcomes is demonstrated and reinforces the
user, organizational, system and task constructs from yet another theoretical perspective.

36
CHAPTER 3
METHODOLOGY
Research Design
An efficient examination of the utilization prediction model involves the
following steps:
1. Use of the model to predict utilization for the impending technology
change.
2. Post-implementation measures of utilization for the new information
technology.
3. Comparison of predicted utilization with actual post-implementation
measures.
Two methodological needs are evident in examining this model. First, a method
of measuring technology use is required. Absolute utilization reflects actual time spent
using a system as reflected by both frequency and duration patterns. This type of
utilization can be determined by a combination of direct monitoring (through audit file
analysis) and user self-report.
The second methodological need is for a method of measurement of the
interactions enumerated in the utilization prediction model. The most practical approach
to measurement is through surveys since the majority of the variables can only be elicited
through direct user response. Each of the variables in the model has been previously
measured as independent construct through various survey tools. A combination of these

37
tools which have demonstrated sufficient reliability and validity will be applied in this
study to describe the interactions in the proposed model.
The testing of this model can be best accomplished in an environment where the
utilization index values are most likely to be extremely high or low. The health care field
offers such an environment. Health care organizations tend to lag behind other business
entities in their adoption of new organization-wide information technology; however,
within each organization enclaves of early adopters will exist. This polarization along the
lines of information technology adoption makes extremes of utilization behavior more
likely. Also, health care organizations are eager to test new methodologies for predicting
information technology viability due to extreme competition present in the current
marketplace.
An attempt was made to first apply this methodology within a specialized tertiary
care facility, a private, not-for-profit pediatric hospital. All information systems
scheduled for implementation at the hospital which served as the study environment were
examined to determine suitability for inclusion in this research according to the following
criteria:
• The system should have a sufficiently large user population from which to
draw significant statistics.
• The system should provide for logging of user activities through
generation of automated audit files.
• The system should be scheduled for implementation within six calendar
months.
38
Only two systems met the specified criteria. The first of these systems is an enterprise-
wide system which serves as both an employee scheduling system and an employee
information system. No system previously provided this type of functionality access
across the hospital. The second information system selected for inclusion provides access
to education materials designed to be distributed to patients and their families by care
providers. It was implemented within the context of the hospital�s newly created Intranet.
Previously this information was accessed through an internally designed system that
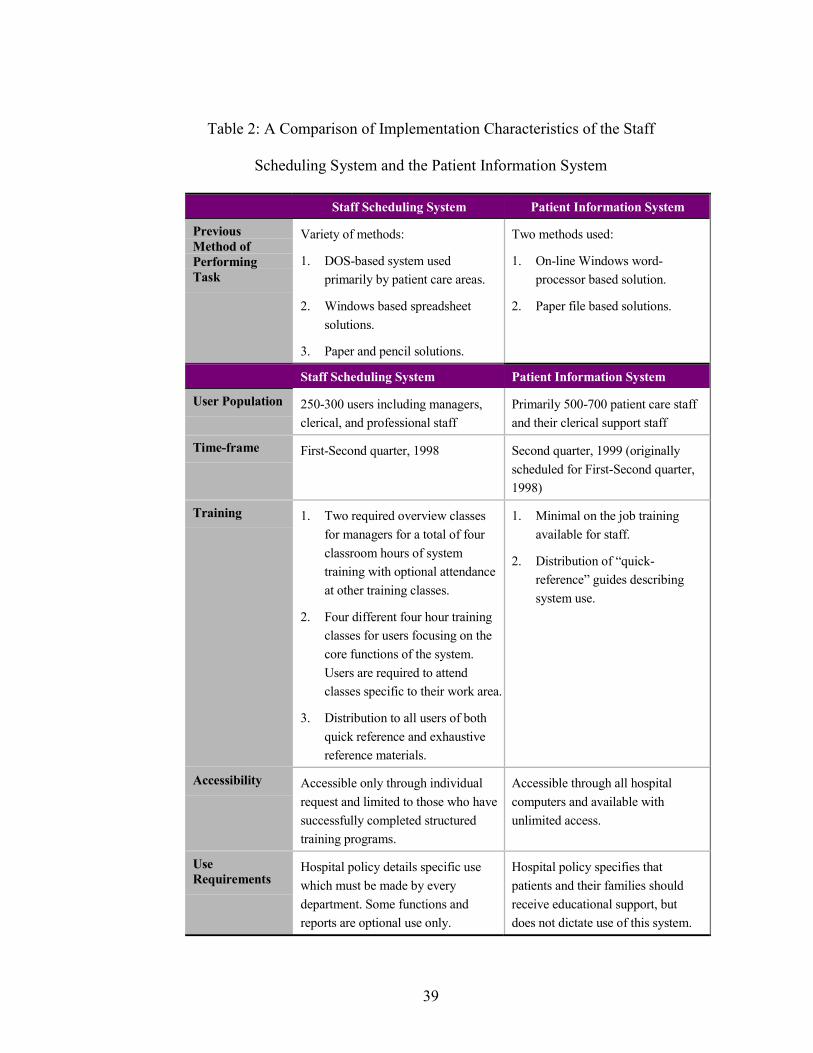
provided for limited printing of information. A comparison for both systems is included
in Table 2. This table summarizes the previous method of performing tasks, user
population, time-frame for the study, training on each system, system accessibility and
use requirements.
39
Table 2: A Comparison of Implementation Characteristics of the Staff
Scheduling System and the Patient Information System
Staff Scheduling System Patient Information System
PreviousMethod ofPerformingTask
Variety of methods:
1. DOS-based system used
primarily by patient care areas.
2. Windows based spreadsheet
solutions.
3. Paper and pencil solutions.
Two methods used:
1. On-line Windows word-
processor based solution.
2. Paper file based solutions.
Staff Scheduling System Patient Information System
User Population 250-300 users including managers,
clerical, and professional staff
Primarily 500-700 patient care staff
and their clerical support staff
Time-frame First-Second quarter, 1998 Second quarter, 1999 (originally
scheduled for First-Second quarter,
1998)
Training 1. Two required overview classes
for managers for a total of four
classroom hours of system
training with optional attendance
at other training classes.
2. Four different four hour training
classes for users focusing on the
core functions of the system.
Users are required to attend
classes specific to their work area.
3. Distribution to all users of both
quick reference and exhaustive
reference materials.
1. Minimal on the job training
available for staff.
2. Distribution of �quick-
reference� guides describing
system use.
Accessibility Accessible only through individual
request and limited to those who have
successfully completed structured
training programs.
Accessible through all hospital
computers and available with
unlimited access.
UseRequirements
Hospital policy details specific use
which must be made by every
department. Some functions and
reports are optional use only.
Hospital policy specifies that
patients and their families should
receive educational support, but
does not dictate use of this system.
40
Model Specifications
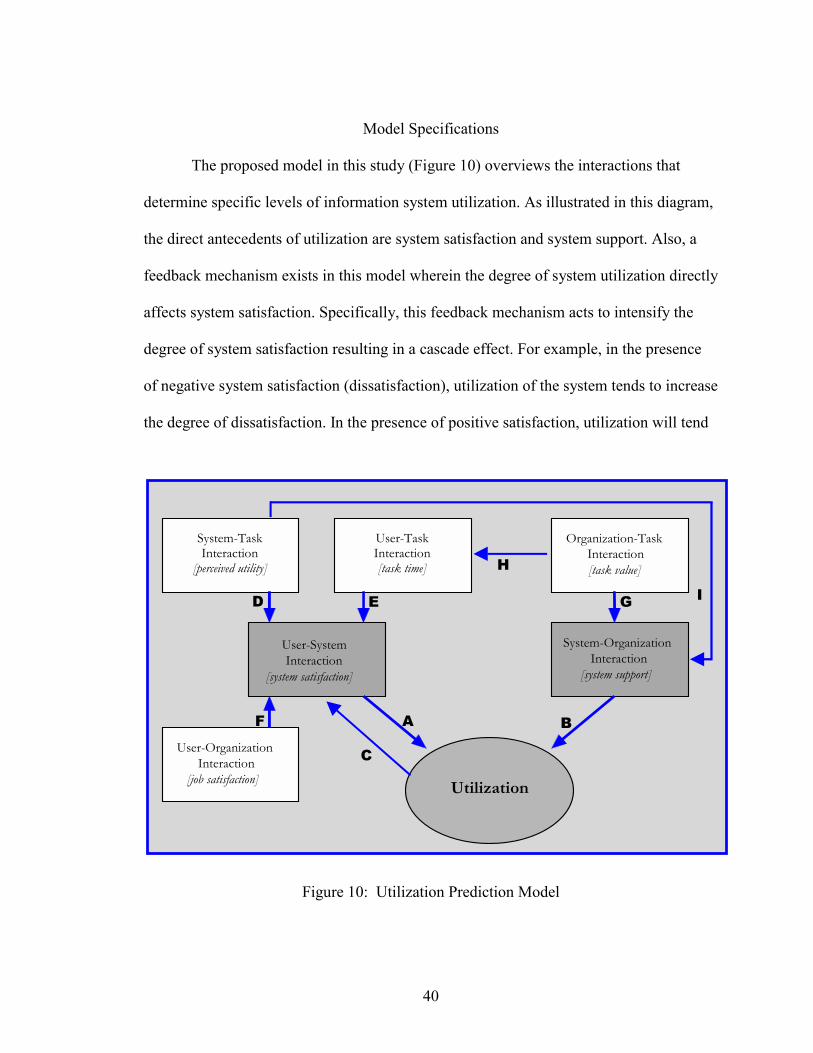
The proposed model in this study (Figure 10) overviews the interactions that
determine specific levels of information system utilization. As illustrated in this diagram,
the direct antecedents of utilization are system satisfaction and system support. Also, a
feedback mechanism exists in this model wherein the degree of system utilization directly
affects system satisfaction. Specifically, this feedback mechanism acts to intensify the
degree of system satisfaction resulting in a cascade effect. For example, in the presence
of negative system satisfaction (dissatisfaction), utilization of the system tends to increase
the degree of dissatisfaction. In the presence of positive satisfaction, utilization will tend
Figure 10: Utilization Prediction Model
System-TaskInteraction
[perceived utility]
User-TaskInteraction[task time]
Organization-TaskInteraction[task value]
User-SystemInteraction
[system satisfaction]
System-OrganizationInteraction
[system support]
User-OrganizationInteraction
[job satisfaction] Utilization
G
BF
H
D E I
A
C
41
to increase satisfaction even more. However, these tendencies present in the feedback
mechanism can be overwhelmed by extreme values of other factors in the model.
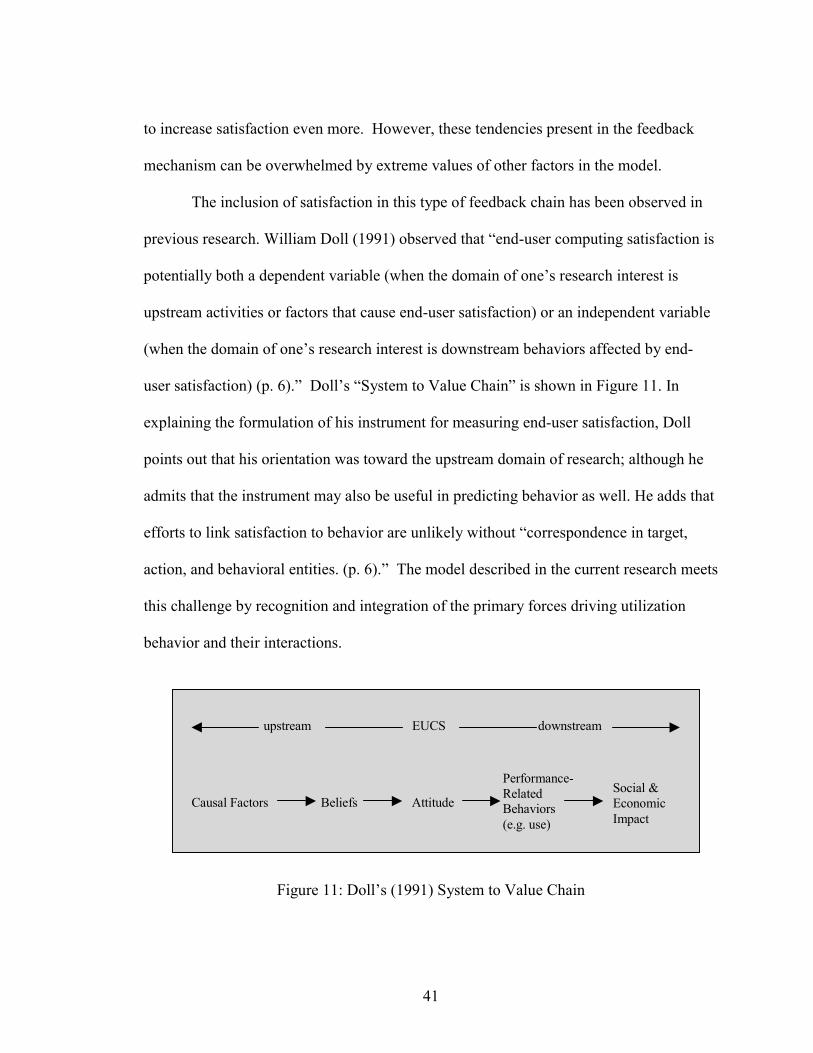
The inclusion of satisfaction in this type of feedback chain has been observed in
previous research. William Doll (1991) observed that �end-user computing satisfaction is
potentially both a dependent variable (when the domain of one�s research interest is
upstream activities or factors that cause end-user satisfaction) or an independent variable
(when the domain of one�s research interest is downstream behaviors affected by end-
user satisfaction) (p. 6).� Doll�s �System to Value Chain� is shown in Figure 11. In
explaining the formulation of his instrument for measuring end-user satisfaction, Doll
points out that his orientation was toward the upstream domain of research; although he
admits that the instrument may also be useful in predicting behavior as well. He adds that
efforts to link satisfaction to behavior are unlikely without �correspondence in target,
action, and behavioral entities. (p. 6).� The model described in the current research meets
this challenge by recognition and integration of the primary forces driving utilization
behavior and their interactions.
Figure 11: Doll�s (1991) System to Value Chain
upstream EUCS downstream
Causal Factors Beliefs Attitude
Performance-RelatedBehaviors(e.g. use)
Social &EconomicImpact
42
Hypotheses
Several hypotheses were used to address the research questions in this study. The
following hypotheses have been listed under the research question that they are designed to
address.
Question 1: Does the magnitude of utilization of an information system change
predictably according to changes in primary force interactions?
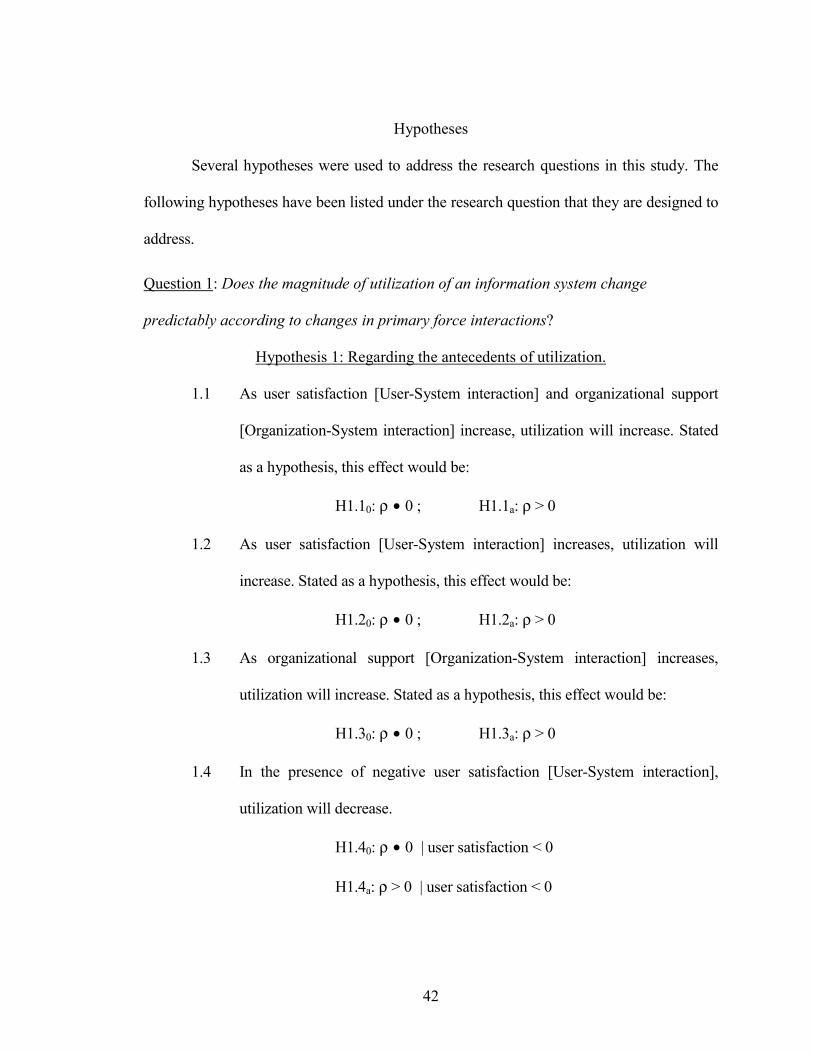
Hypothesis 1: Regarding the antecedents of utilization.
1.1 As user satisfaction [User-System interaction] and organizational support
[Organization-System interaction] increase, utilization will increase. Stated
as a hypothesis, this effect would be:
H1.10: ρ • 0 ; H1.1a: ρ > 0
1.2 As user satisfaction [User-System interaction] increases, utilization will
increase. Stated as a hypothesis, this effect would be:
H1.20: ρ • 0 ; H1.2a: ρ > 0
1.3 As organizational support [Organization-System interaction] increases,
utilization will increase. Stated as a hypothesis, this effect would be:
H1.30: ρ • 0 ; H1.3a: ρ > 0
1.4 In the presence of negative user satisfaction [User-System interaction],
utilization will decrease.
H1.40: ρ • 0 | user satisfaction < 0
H1.4a: ρ > 0 | user satisfaction < 0
43
1.5 In the presence of negative organizational support [Organization-System
interaction], utilization will decrease.
H1.50: ρ • 0 | organizational support < 0
H1.5a: ρ > 0 | organizational support < 0
Hypothesis 2: Regarding the antecedents of user satisfaction.
2.1 As task time [User-Task interaction] and perceived utility [System-Task
interaction] increase, user satisfaction [User-System interaction] will
increase.
H2.10: ρ • 0 ; H2.1a: ρ > 0
2.2 As task time [User-Task interaction] increases, user satisfaction [User-
System interaction] will increase.
H2.20: ρ • 0 ; H2.2a: ρ > 0
2.3 As perceived utility [System-Task interaction] increases, user satisfaction
[User-System interaction] will increase.
H2.30: ρ • 0 ; H2.3a: ρ > 0
2.4 In the presence of negative task time [User-Task interaction], user
satisfaction [User-System interaction] will decrease.
H2.40: ρ • 0 | task time < 0
H2.4a: ρ > 0 | task time < 0
44
2.5 In the presence of negative perceived utility [System-Task interaction], user
satisfaction [User-System interaction] will decrease.
H2.50: ρ • 0 | perceived utility< 0
H2.5a: ρ > 0 | perceived utility< 0
2.6 Negative job satisfaction will reduce user satisfaction [User-System
interaction].
H2.60: ρ • 0 Job-Satisfaction < 0
H2.6a: ρ > 0 Job-Satisfaction < 0
Hypothesis 3: Regarding the antecedents of organizational support.
3.1 As organizational value [Task-Organization interaction] and perceived
utility [System-Task interaction] increase, organizational support
[Organization-System interaction] will increase.
H3.10: ρ • 0 ; H3.1a: ρ > 0
3.2 As organizational value [Task-Organization] interaction increases,
organizational support [Organization-System interaction] will increase.
H3.20: ρ • 0 ; H3.2a: ρ > 0
3.3 As perceived utility [System-Task interaction] increases, organizational
support [Organization-System interaction] will increase.
H3.30: ρ • 0 ; H3.3a: ρ > 0
45
3.4 In the presence of negative organizational value [Task-Organization
interaction], organizational support [Organization-System interaction] will
decrease.
H3.40: ρ • 0 | organizational value < 0
H3.4a: ρ > 0 | organizational value < 0
3.5 In the presence of negative perceived utility [System-Task interaction],
organizational support [Organization-System interaction] will decrease.
H3.50: ρ • 0 | perceived utility< 0
H3.5a: ρ > 0 | perceived utility< 0
Hypothesis 4: Regarding the antecedents of task time.
4 As organizational value [Task-Organization interaction] increases, task time
[User-Task interaction] will increase.
H40: ρ • 0 ; H4a: ρ > 0
Question 2: Can self-reported utilization measures act as a proxy for actual utilization
monitoring?
Hypothesis 5: Regarding self report of utilization versus actual use.
5 Self-report is correlated with actual use of a system.
H60: ρ = 0 ; H6a: ρ ≠ 0
Hypothesis 6: Regarding comparison of self report across systems.
6 Correlations between self-reported utilization and actual utilization will be
higher for non�required use systems than for required use systems.
H70: ρ1 • ρ2; H7a: ρ1 > ρ2
46
Discussion of Hypotheses
Each of the hypotheses in this research reflects interactions within the causal model
described in Figure 10 (p. 40). The model itself was tested to determine its viability;
however, the research hypotheses themselves provide additional non-causal insights into
the nature of the constructs involved within the model. To assist in understanding the
relationship of each hypothesis to the proposed causal model, the following discussion will
include the capitalized letters from Figure 10 (labeled A through I, see p. 40) which directly
concern each hypothesis.
Hypothesis 1.1 concerns the two primary force interactions which have the most
direct influence on utilization: user satisfaction (effect A) and organizational support (effect
B). This hypothesis states that positive values of these elements result in increased
utilization. Hypotheses 1.2-1.3 address the individual effects A and B, while hypothesis
1.4-1.5 state that negative effects from either A or B result in decreased utilization.
Hypothesis 2.1 predicts that user satisfaction increases as task time (effect E) and
perceived utility (effect D) increase. The individual effects (E and D) are described in
hypotheses 2.2-2.3. These effects are reversed in hypotheses 2.4-5 with the presence of
either negative task time (effect E) or negative perceived utility (effect D). Negative job
satisfaction (effect F) also can influence user satisfaction as described in hypothesis 2.6.
In this model, organizational support increases as Organizational Task Value (effect
G) and perceived utility (effect I) increase. This relationship is stated in hypothesis 3.1-3.3
and expanded in hypotheses 3.4-3.5 which predict that negative Organizational Task Value
(effect G) or negative perceived utility (effect I) cause organizational support to decrease.
47
Additional effects in this model include Organizational Task Value (effect H) which can
act to increase task time as seen in Hypothesis 4.
The measures in this study include both self-report and audit log measures. The
final two hypotheses concern the relationship between these two types of measures.
Hypothesis 5 posits that a significant relation exists between the self-report measures and
the audit log data. Hypothesis 6 further explores this relationship by asserting that higher
correlations exist between the self-report measures and the audit log data for non-required
systems that for required systems. In this study, the staff scheduling system is a required-
use system and the patient education system is a non-required-use system.
48
Subject Selection
All users of the two systems included in this study were involved as subjects.
Access to the scheduling system is only granted to employees who have been through
specific training for the system and who have a need to access the system. All managerial
staff in the hospital were trained to use the system. Also, each department within the
hospital is required to have support staff trained to maintain the system.
The second system included in this study, the patient education system, did not
have an initially well-defined user population. Access to this system was provided through
the hospital�s Intranet to all employees in the hospital who use computers. No special
training or �need to access� is required for patient education system users.
Due to the level of organizational support within the hospital for both of these
systems, all employees who access these systems were targeted for inclusion in this study.
There was minimal overlap between user populations due to the intended use of each
system.
49
Data Gathering
Three approaches to data gathering were pursued. Automated system audit files
were analyzed to determine utilization information for the systems in this study. These files
contain the following information:
1. User
2. Date and time of use
3. Activity performed
The second approach to data gathering was through user surveys. These surveys
were applied to corroborate audit file statistics, measure antecedent variables and test the
viability of this study�s predictive utilization model. The third approach to data gathering
involved mining data from current information systems to retrieve demographic data for
each of the subjects in this study. This indirect approach to demographic data collection
facilitated shorter survey administration in other phases of this study.
A total of three different surveys were used. Each of these surveys had overlapping
items as well as unique items due to the timing of survey administration. Surveys were
administered to gather the information specified in Table 3. Scales used in the final phase
of data analysis are in boldface type.
Users of the staffing system attended formal training where they completed a pre-
training survey at the beginning of class and a post-training survey at the end of class.
Patient education system users did not attend formal training and therefore completed only
the �Pre-Training� survey upon their initial use of the patient education system. Users of
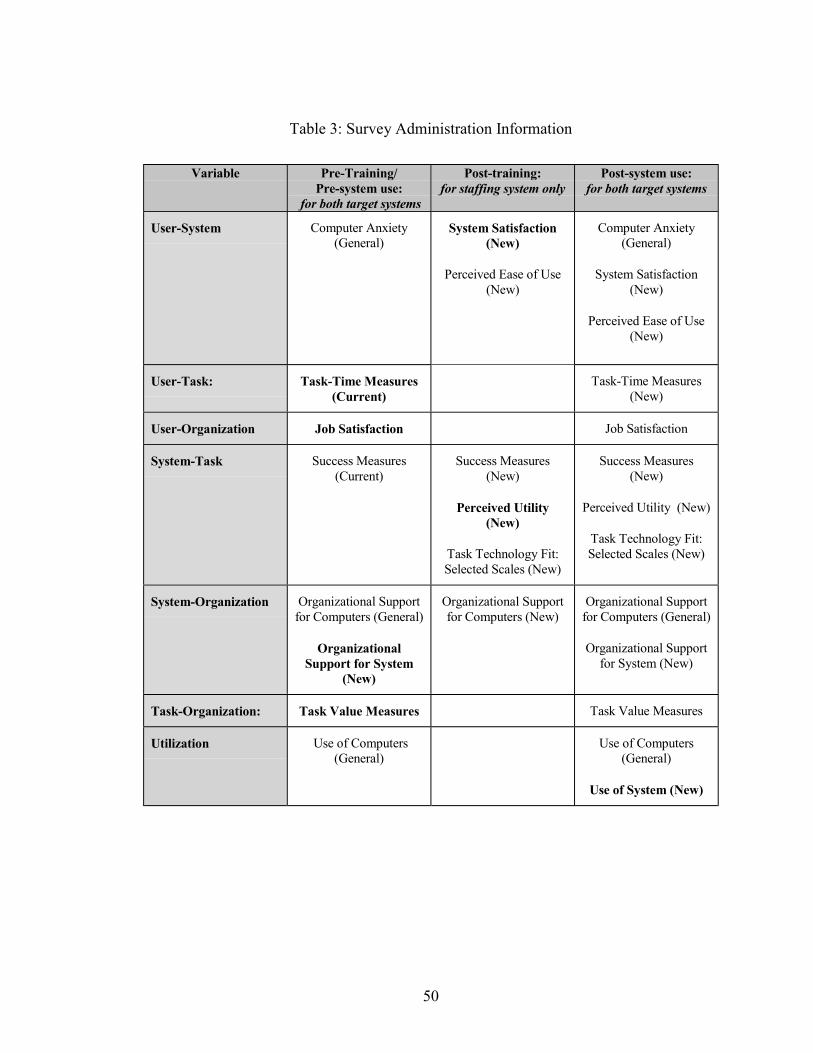
50
Table 3: Survey Administration Information
Variable Pre-Training/Pre-system use:
for both target systems
Post-training:for staffing system only
Post-system use:for both target systems
User-System Computer Anxiety(General)
System Satisfaction(New)
Perceived Ease of Use(New)
Computer Anxiety(General)
System Satisfaction(New)
Perceived Ease of Use(New)
User-Task: Task-Time Measures(Current)
Task-Time Measures(New)
User-Organization Job Satisfaction Job Satisfaction
System-Task Success Measures(Current)
Success Measures(New)
Perceived Utility(New)
Task Technology Fit:Selected Scales (New)
Success Measures(New)
Perceived Utility (New)
Task Technology Fit:Selected Scales (New)
System-Organization Organizational Supportfor Computers (General)
OrganizationalSupport for System
(New)
Organizational Supportfor Computers (New)
Organizational Supportfor Computers (General)
Organizational Supportfor System (New)
Task-Organization: Task Value Measures Task Value Measures
Utilization Use of Computers(General)
Use of Computers(General)
Use of System (New)
51
both systems were sent a post-system use survey six weeks after their respective system
was �live.�
Surveys were initially designed to be administered electronically since all
members of the targeted user populations had demonstrated proficiency in the use of
computer applications including Microsoft Windows�, electronic mail and Netscape
Navigator�. For users of the scheduling system, the survey was delivered in class
through a custom designed Microsoft Access� program which presented one question at
a time while preventing subjects from skipping questions or returning to previously
answered questions. For surveys administered outside of the classroom, the initial survey
for the patient education system and the follow-up survey for the scheduling system, this
same mechanism was used with one change. To deliver the survey tool to the users, a
compressed Microsoft Access� database was delivered to the users via email. This
compressed database actually stored user responses in a linked master survey database on
the hospital�s computer network.
The follow-up survey for the patient education system users presented some
difficulties. The hospital was in the process of upgrading all Microsoft software when the
survey administration dates arrived. In order to reach all users with the follow-up survey,
the survey had to be distributed by interdepartmental mail. This unfortunately resulted in
a significantly smaller response set for the patient education system follow-up survey.
Items from each of the surveys are included in the Appendix along with relevant response
scales. Survey questions were derived from already existent instruments. Validity and
reliability of the included measurement scales were assumed based upon previous
development and testing of each instrument in the literature. Where feasible, responses
52
were gathered based on a 7-point Likert scale. For items whose original design required
an alternate response scale, original instrument response scale construction was used.
Each survey item was tested in a pilot administration using two groups of ten
reviewers. The first pilot group reviewed item phrasing, construction, and face validity of
the staffing system user surveys. The second pilot group provided the same type of
analysis for the patient education system surveys. There was no membership overlap
between pilot groups. Also, pilot group members were not included in the primary study.
Results from the pilot study were collected and analyzed for feedback. Based upon the
pilot, one question from the �Success� scale was omitted due to lack of clarity and item
relevance. This scale was also omitted from the analysis phase of this research. Also,
some clarifications were added where such changes would not substantially change the
content of a question.
Utilization measures were taken from instruments designed by Igbaria and Iivari
(1995) and Torkzadeh and Dwyer (1994). These instruments were selected due to their
repeated use in the literature and their scope in measurement of the utilization construct.
They focus on two types of utilization: general use of computers and use of a specific
application. In the initial survey, only general use of computers was measured. In the
four-week follow-up survey, both general use of computers and use of the specific
application involved in this study were examined.
The user-system interaction was addressed through the use of three different
scales. Kernan and Howard�s Computer Anxiety scale (Montazemi, Cameron & Gupta,
1996) was used to determine the user�s attitude toward computers in general both before
and after use of the application of concern. The remaining two scales were used to
53
measure user attitudes and perceptions specific to the systems included in this study.
System satisfaction was measured through the use of Doll and Torkzadeh�s (1988) 12-
item scale which has been examined repeatedly for both reliability and validity. Finally,
Davis� Perceived Ease of Use measure as formulated by Montazemi, Cameron and Gupta
(1996) and Keil, Beranek and Konsynski (1995) was included.
The user-task interaction represented by information requirement was addressed
through task time measures adapted from Igbaria & Iivari (1995). These measures are
task specific and require the subject to estimate the frequency and duration of tasks. Time
estimates concerning tasks were made before and after introduction of new technology.
These estimates reflect time to accomplish a task using methods current at the time of
evaluation.
Job satisfaction, the user-organization interaction proxy, was measured using
Hackman and Oldham�s 1975 five-item Job Diagnostic Survey, General Job Satisfaction
scale. This scale was selected due to its recognized reliability and validity in the
literature. Also, normative data for this scale is available for health care workers.
The system-task interaction was described using scales which measure task
technology fit, general system success and perceived utility. Selected scales from
Goodhue and Thompson�s (1995) Task-Technology Fit measure were included as well as
Conrath and Sharma�s (1993) success measures. The success measures are oriented
around users� perceptions of effectiveness, value and the overall satisfaction in relation to
specific tasks accomplished by the system. Davis� perceived utility measure as
formulated by Montazemi, Cameron and Gupta (1996); Keil, Beranek and Konsynski
54
(1995); and Igbaria and Iivari (1995) provided the final scale included to measure the
system-task interaction.
Management support of the system, the measure of system-organization
interaction, was elicited through a 4-item scale developed by Igbaria and Iivari (1995)
and a 4-item scale developed by Thompson, Higgins and Howell (1994). These scales
were adopted to measure perceived organizational support of computers in general and of
the specific systems included in this study.
Finally, the value of a task or information was measured using adaptations of
Conrath and Sharma�s (1993) success measures. The expectations and value items from
these measures were adapted by omitting references to specific systems, thereby retaining
a focus on the value of specific tasks.
55
Data Analysis
Several different analysis methods were used to examine the data gathered in this
study. The majority of the analysis was performed in SAS for Windows�, version 8.0.
Data coding, scatterplots, and other graphical analysis were performed in Microsoft
Excel�, version 97. Initially, descriptive statistics were compiled to facilitate a general
description of both the subjects and the data. Following this initial analysis, a
correlational matrix of all independent variables was constructed to assist in further
interpretation of the data. Subsequent to these initial data descriptive attempts, n size for
both system subject groups was finalized. To be included in succeeding analysis, subjects
were required to meet the following criteria:
1. Demonstrate at least one access of specified system during the 100 day
data gathering period. This criteria insured that subjects who completed
surveys, but never had opportunity to access the system were not included
in the analysis.
2. Complete all survey questions comprising scales used in final analysis.
The statistical methods used in this research require no missing variables
among subjects.
After identification of final subject groups, consideration was given as to the feasibility of
combination versus comparison of subject groups. N size of approximately 100 subjects
is recommend as a minimum for path analysis. If each group of users included sufficient
subjects to provide for a comparative analysis wherein model testing between these
groups could occur, a more robust analysis would be possible. However, patient
56
education subject group size was of concern, therefore the following steps were
performed to determine the possibility of pooling subjects for a path analytic approach:
1. Demographic comparisons across subject groups,
2. Exploratory factor analysis to determine if subject groups� variables
loaded on the same factors.
Exploratory Factor Analysis
Exploratory factor analysis served two purposes. The first purpose, as mentioned
previously, allowed testing for similarity across subject groups. A second purpose was to
provide insight into the congruence of meaningful dimensions of the observed data and
theorized constructs. The primary forces should be evident in loadings across dimensions
where the combinations of forces represent meaningful demonstrations of the prediction
model�s elements. Extraction of factors was performed using the principal axis method.
Factors were rotated first to an orthogonal then to an oblique solution to assist in factor
interpretation. Each observed variable in this analysis was expected to have a factorial
complexity of one, indicating that each variable would have a significant loading on only
one factor.
Structured Equation Modeling
The use of structural equation modeling (SEM) to test causal relationships in
research models has increased during the last decade. While this technique can provide
powerful insights into specific models, it also requires careful use and justification. Chin
and Todd (1995) caution that these techniques �may lead to inappropriate conclusions if
statistical criteria are permitted to drive analysis and override substantive understanding
of a problem (p. 237).�
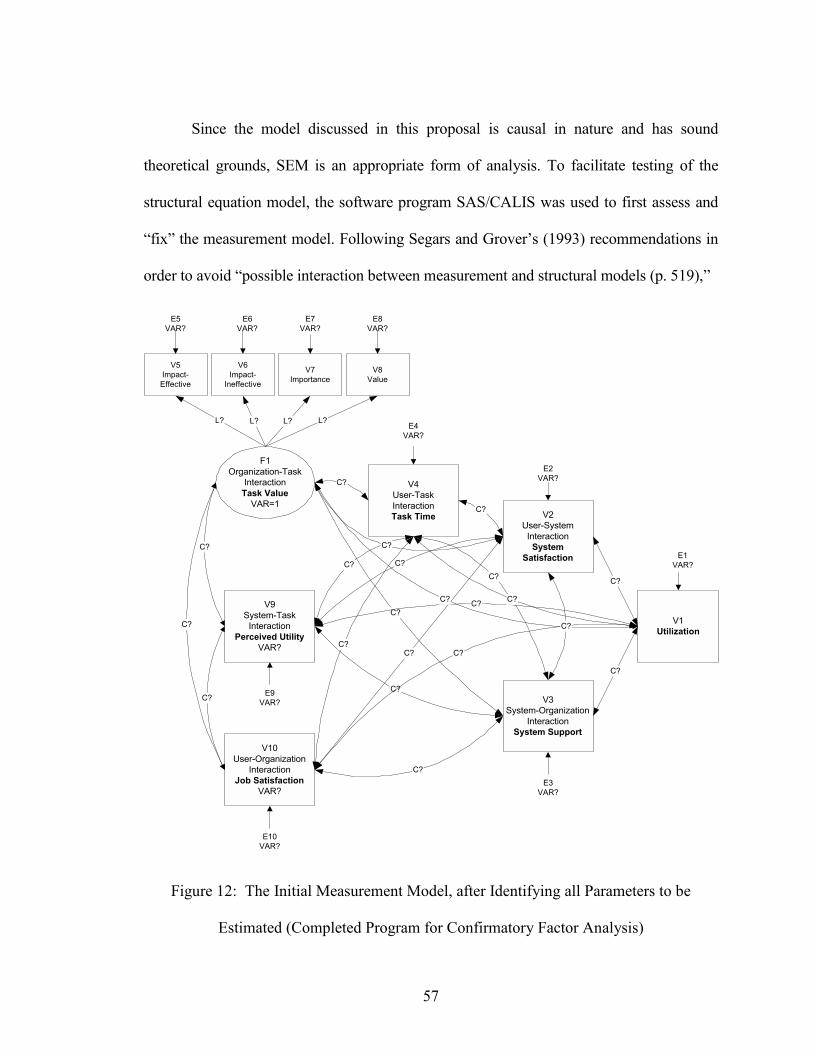
57
Since the model discussed in this proposal is causal in nature and has sound
theoretical grounds, SEM is an appropriate form of analysis. To facilitate testing of the
structural equation model, the software program SAS/CALIS was used to first assess and
�fix� the measurement model. Following Segars and Grover�s (1993) recommendations in
order to avoid �possible interaction between measurement and structural models (p. 519),�
V4User-TaskInteractionTask Time
V10User-Organization
InteractionJob Satisfaction
VAR?
V3System-Organization
InteractionSystem Support
C?
C?
C?
C?
C?
C?
C?
C?
C?
C?
C?
E1VAR?
E2VAR?
E4VAR?
E3VAR?
V9System-Task
InteractionPerceived Utility
VAR?
V1Utilization
F1Organization-Task
InteractionTask Value
VAR=1V2
User-SystemInteraction
SystemSatisfaction
V5Impact-Effective
V6Impact-
Ineffective
V7Importance
E5VAR?
E6VAR?
E7VAR?
L? L? L?
V8Value
E8VAR?
L?
C?
C?
C?C?
C?
C?
C?
C?
C?
C?
E9VAR?
E10VAR?
Figure 12: The Initial Measurement Model, after Identifying all Parameters to be
Estimated (Completed Program for Confirmatory Factor Analysis)
58
the assessment sequence consisted of fitting the utilization prediction model to sample data
and an iterative evaluation of the solution in terms of parameter estimates and goodness of
fit followed by modification of the model to improve its fit to the data. The initial
measurement model shown in Figure 12 actually comprises a confirmatory factor analysis
as all variable are allowed to freely covary. Bentler�s (1989) nomenclature conventions
were followed in identification of model variables and graphical construction. The letter
�F� (for Factor) is used to label the latent variable in the model, while the letter �V� (for
Variable) is used to identify the manifest variables in the model.
According to Hatcher (1994, p. 345), �a measurement model is a factor-analytic
model in which you will identify the latent constructs of interest and indicate which
observed variables will be used to measure each latent construct.� In Figure 12, one
latent variable is identified (F1: Task Value), while all other variables are included as
manifest. Manifest variables are directly measured while latent variables are inferred
from their influence on manifest variables. Each of the manifest variables in this model
are actually constructs represented by single multi-item scales. The Task Value latent
variable is estimated as the result of a combination of single item predictors. Although
multi-item scales are preferred to single-item predictors of latent variables, practical
considerations about survey length precluded this approach. Each latent variable should
minimally have three predictors and the obvious implications for survey size are evident.
In Figure 12, covariances between variables are indicated with curved, double-
headed arrows. Residual or error terms are indicated for all endogenous variables (those
causally affected by other variables). The variance of the latent variable has been fixed at
one to address the scale indeterminancy problem, while manifest variable variances are
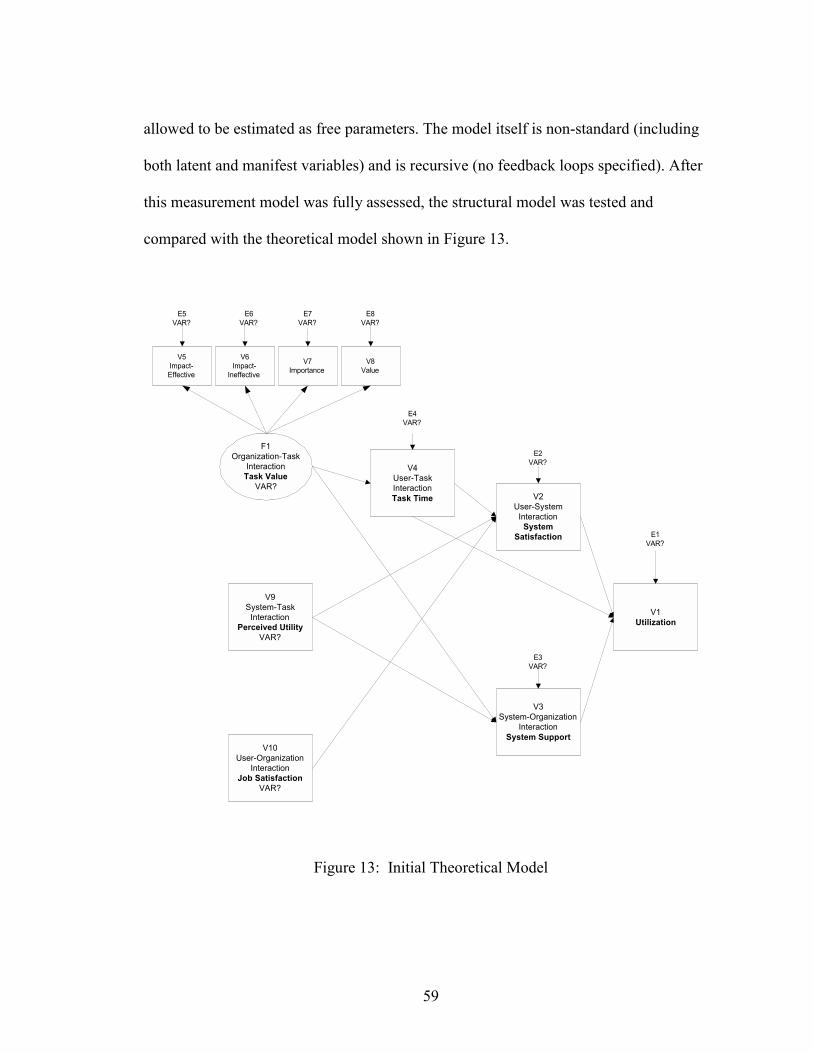
59
allowed to be estimated as free parameters. The model itself is non-standard (including
both latent and manifest variables) and is recursive (no feedback loops specified). After
this measurement model was fully assessed, the structural model was tested and
compared with the theoretical model shown in Figure 13.
Figure 13: Initial Theoretical Model
V4User-TaskInteractionTask Time
V10User-Organization
InteractionJob Satisfaction
VAR?
V3System-Organization
InteractionSystem Support
E1VAR?
E2VAR?
E4VAR?
E3VAR?
V9System-Task
InteractionPerceived Utility
VAR?
V1Utilization
F1Organization-Task
InteractionTask Value
VAR?V2
User-SystemInteraction
SystemSatisfaction
V5Impact-Effective
V6Impact-
Ineffective
V7Importance
E5VAR?
E6VAR?
E7VAR?
V8Value
E8VAR?

60
Necessary Conditions for Path Analysis
The use of path analysis requires that certain perquisites are met regarding both
the data used and the model being tested. The following assumptions are required
(Hatcher, 1994, p. 148-9):
• Interval- or ratio-level measurement
• Minimal number of values (able to assume a minimum of four values)
• Normally distributed data (removal of outliers should be considered if data
are markedly non-normal)
• Linear and additive relationships (not curvilinear or interactive
relationships between independent and dependent variables)
• Absence of multicollinearity (where strong intercorrelations exist between
variables)
• Absence of measurement error (antecedent variables as perfectly reliable
indicators of underlying concepts)
• Inclusion of all nontrivial cases (if met, this indicates self-containment and
non-correlated residuals)
• Overidentified model (model includes more equations than unknowns,
simple recursive models are always overidentified)
• Minimal number of observations (large sample procedures with
approximately 100 subjects or 5 subjects for each parameter to be
estimated)
• At least three indicator variables per latent factor (four were initially
identified for F1: Task Value)
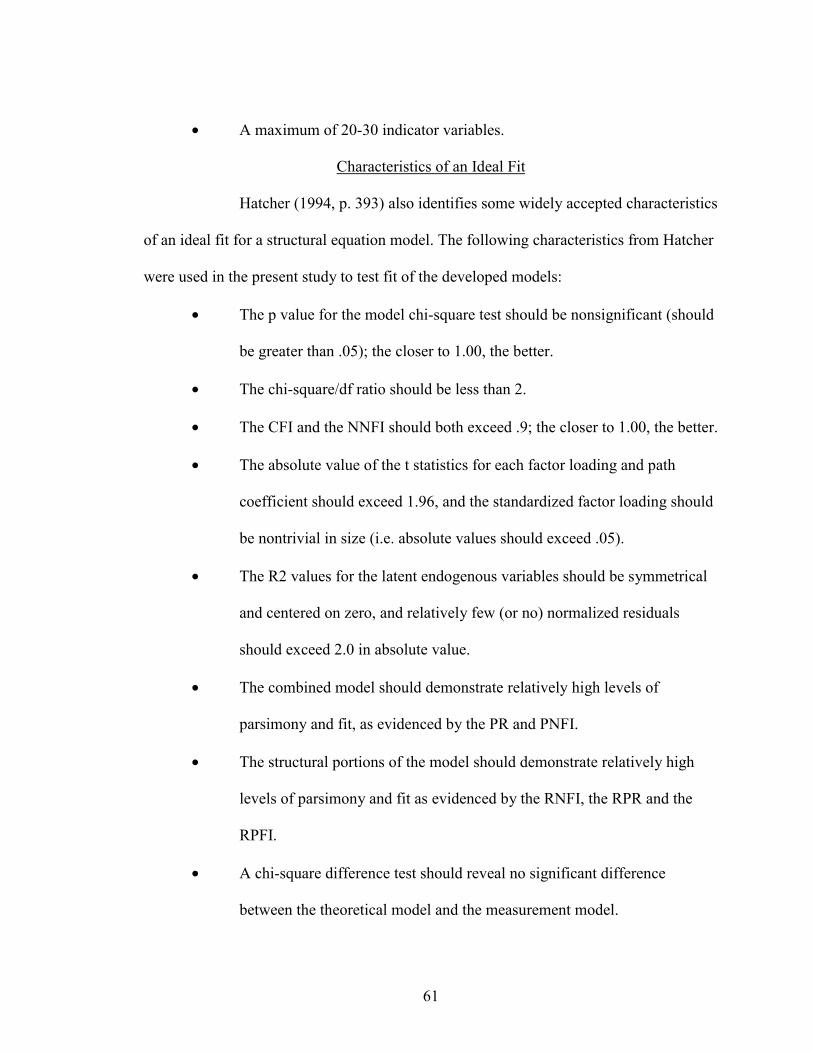
61
• A maximum of 20-30 indicator variables.
Characteristics of an Ideal Fit
Hatcher (1994, p. 393) also identifies some widely accepted characteristics
of an ideal fit for a structural equation model. The following characteristics from Hatcher
were used in the present study to test fit of the developed models:
• The p value for the model chi-square test should be nonsignificant (should
be greater than .05); the closer to 1.00, the better.
• The chi-square/df ratio should be less than 2.
• The CFI and the NNFI should both exceed .9; the closer to 1.00, the better.
• The absolute value of the t statistics for each factor loading and path
coefficient should exceed 1.96, and the standardized factor loading should
be nontrivial in size (i.e. absolute values should exceed .05).
• The R2 values for the latent endogenous variables should be symmetrical
and centered on zero, and relatively few (or no) normalized residuals
should exceed 2.0 in absolute value.
• The combined model should demonstrate relatively high levels of
parsimony and fit, as evidenced by the PR and PNFI.
• The structural portions of the model should demonstrate relatively high
levels of parsimony and fit as evidenced by the RNFI, the RPR and the
RPFI.
• A chi-square difference test should reveal no significant difference
between the theoretical model and the measurement model.
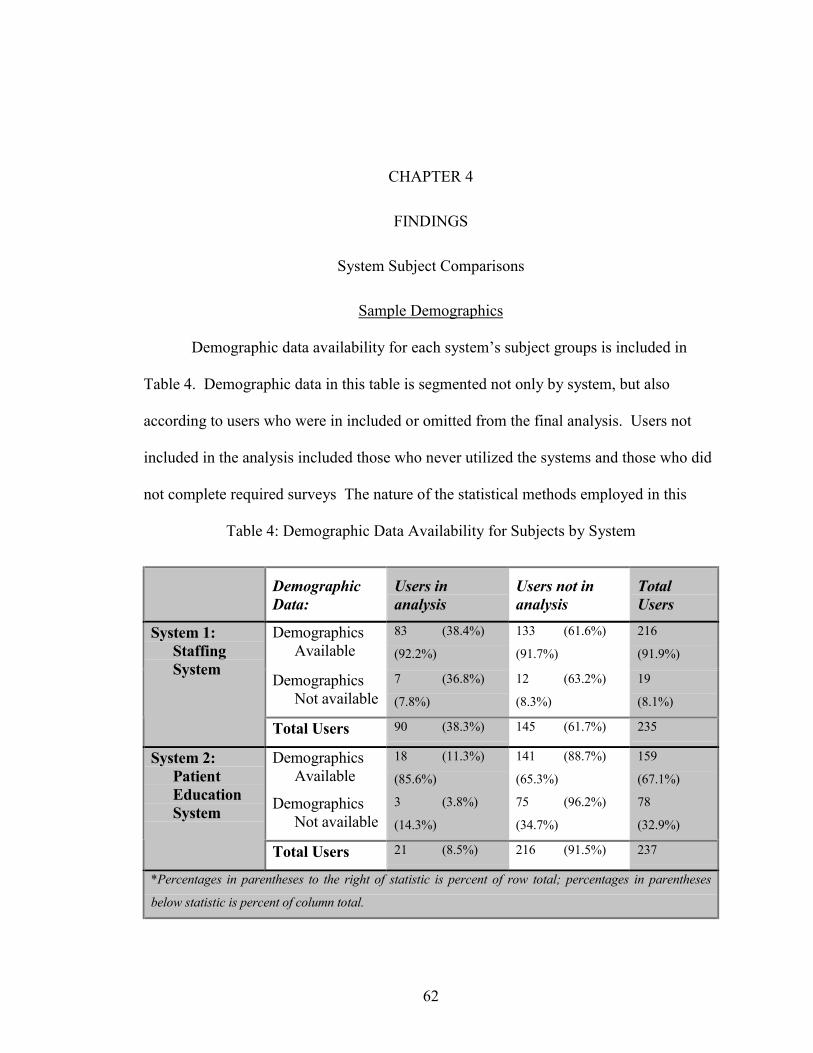
62
CHAPTER 4
FINDINGS
System Subject Comparisons
Sample Demographics
Demographic data availability for each system�s subject groups is included in
Table 4. Demographic data in this table is segmented not only by system, but also
according to users who were in included or omitted from the final analysis. Users not
included in the analysis included those who never utilized the systems and those who did
not complete required surveys The nature of the statistical methods employed in this
Table 4: Demographic Data Availability for Subjects by System
DemographicData:
Users inanalysis
Users not inanalysis
TotalUsers
DemographicsAvailable
83 (38.4%)
(92.2%)
133 (61.6%)
(91.7%)
216
(91.9%)
DemographicsNot available
7 (36.8%)
(7.8%)
12 (63.2%)
(8.3%)
19
(8.1%)
System 1:StaffingSystem
Total Users 90 (38.3%) 145 (61.7%) 235
DemographicsAvailable
18 (11.3%)
(85.6%)
141 (88.7%)
(65.3%)
159
(67.1%)
DemographicsNot available
3 (3.8%)
(14.3%)
75 (96.2%)
(34.7%)
78
(32.9%)
System 2:PatientEducationSystem
Total Users 21 (8.5%) 216 (91.5%) 237
*Percentages in parentheses to the right of statistic is percent of row total; percentages in parentheses
below statistic is percent of column total.
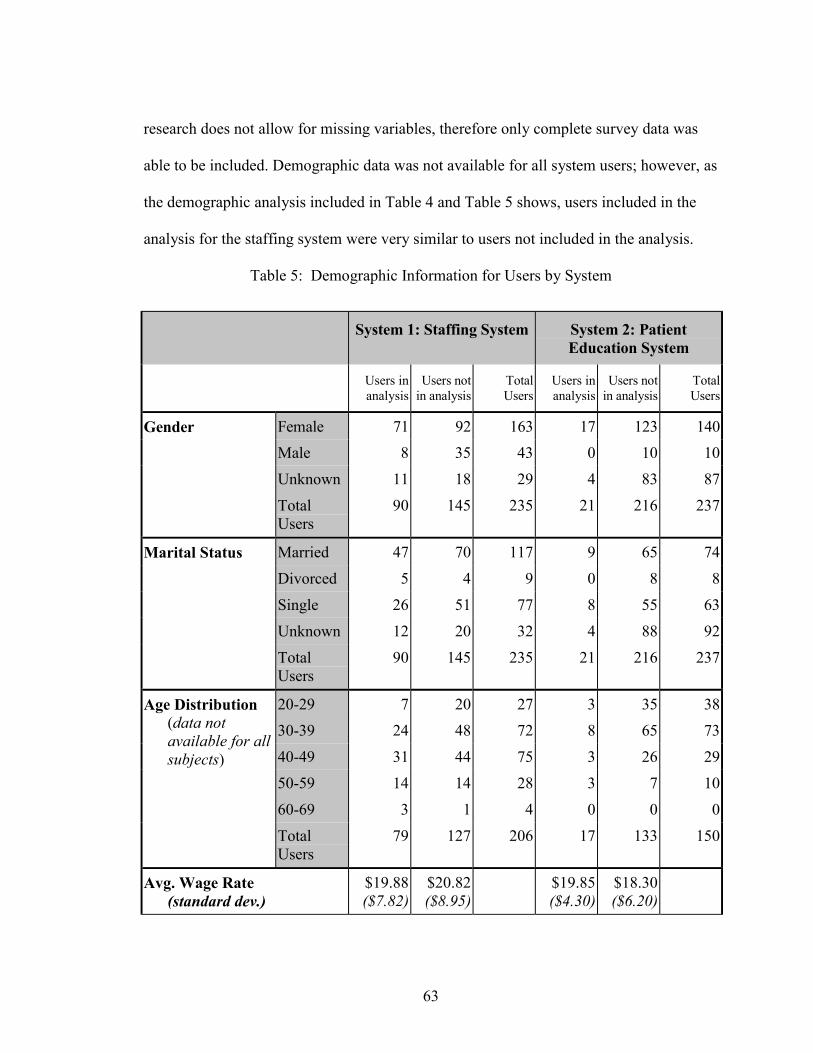
63
research does not allow for missing variables, therefore only complete survey data was
able to be included. Demographic data was not available for all system users; however, as
the demographic analysis included in Table 4 and Table 5 shows, users included in the
analysis for the staffing system were very similar to users not included in the analysis.
Table 5: Demographic Information for Users by System
System 1: Staffing System System 2: PatientEducation System
Users inanalysis
Users notin analysis
TotalUsers
Users inanalysis
Users notin analysis
TotalUsers
Gender Female 71 92 163 17 123 140
Male 8 35 43 0 10 10
Unknown 11 18 29 4 83 87
TotalUsers
90 145 235 21 216 237
Marital Status Married 47 70 117 9 65 74
Divorced 5 4 9 0 8 8
Single 26 51 77 8 55 63
Unknown 12 20 32 4 88 92
TotalUsers
90 145 235 21 216 237
20-29 7 20 27 3 35 38
30-39 24 48 72 8 65 73
40-49 31 44 75 3 26 29
50-59 14 14 28 3 7 10
60-69 3 1 4 0 0 0
Age Distribution(data notavailable for allsubjects)
TotalUsers
79 127 206 17 133 150
Avg. Wage Rate(standard dev.)
$19.88($7.82)
$20.82($8.95)
$19.85($4.30)
$18.30($6.20)
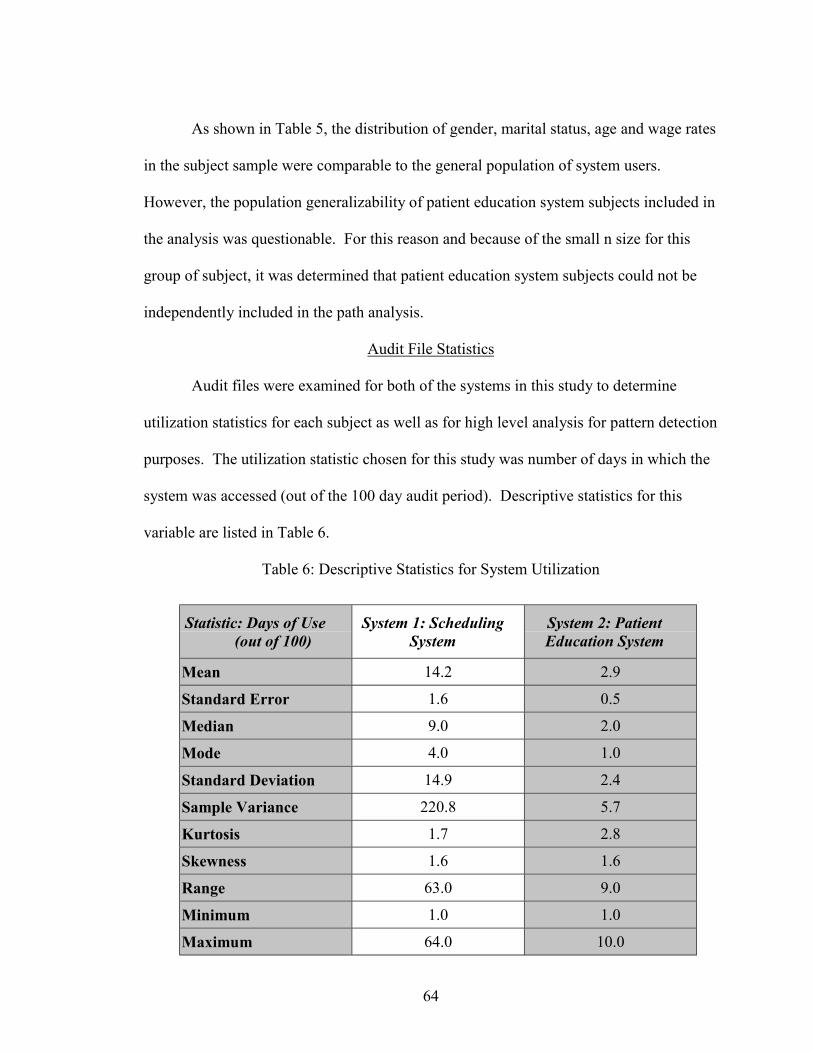
64
As shown in Table 5, the distribution of gender, marital status, age and wage rates
in the subject sample were comparable to the general population of system users.
However, the population generalizability of patient education system subjects included in
the analysis was questionable. For this reason and because of the small n size for this
group of subject, it was determined that patient education system subjects could not be
independently included in the path analysis.
Audit File Statistics
Audit files were examined for both of the systems in this study to determine
utilization statistics for each subject as well as for high level analysis for pattern detection
purposes. The utilization statistic chosen for this study was number of days in which the
system was accessed (out of the 100 day audit period). Descriptive statistics for this
variable are listed in Table 6.
Table 6: Descriptive Statistics for System Utilization
Statistic: Days of Use(out of 100)
System 1: SchedulingSystem
System 2: PatientEducation System
Mean 14.2 2.9
Standard Error 1.6 0.5
Median 9.0 2.0
Mode 4.0 1.0
Standard Deviation 14.9 2.4
Sample Variance 220.8 5.7
Kurtosis 1.7 2.8
Skewness 1.6 1.6
Range 63.0 9.0
Minimum 1.0 1.0
Maximum 64.0 10.0
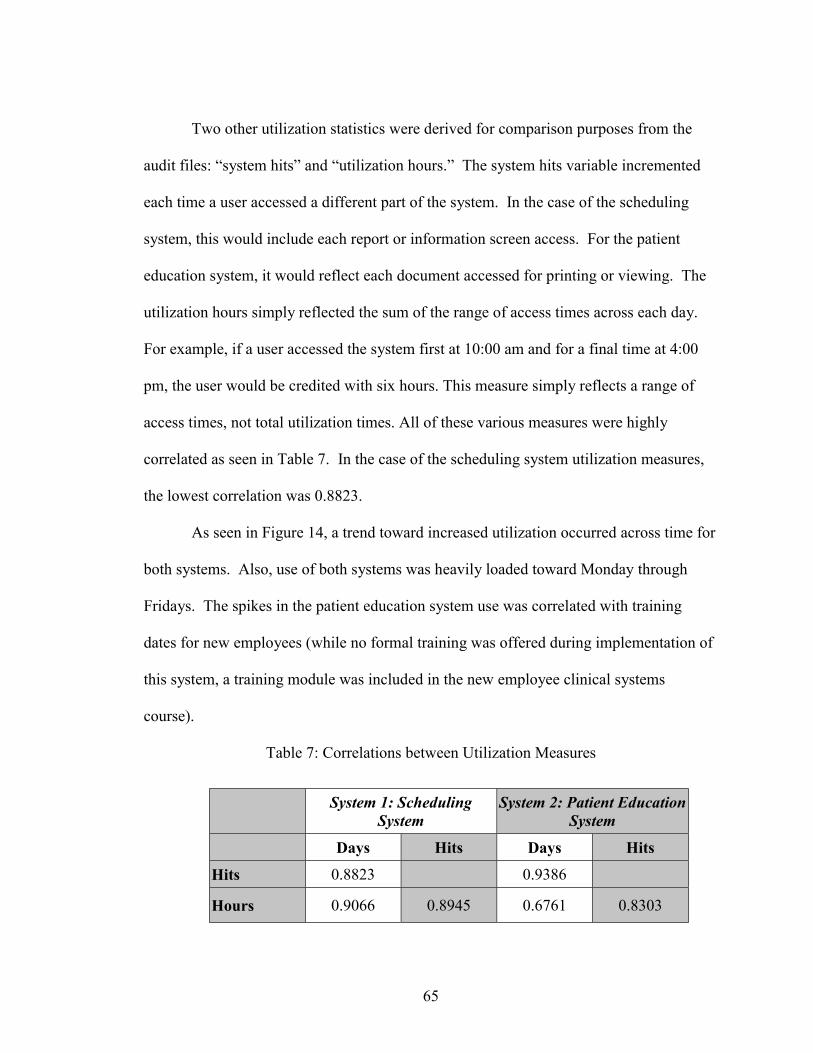
65
Two other utilization statistics were derived for comparison purposes from the
audit files: �system hits� and �utilization hours.� The system hits variable incremented
each time a user accessed a different part of the system. In the case of the scheduling
system, this would include each report or information screen access. For the patient
education system, it would reflect each document accessed for printing or viewing. The
utilization hours simply reflected the sum of the range of access times across each day.
For example, if a user accessed the system first at 10:00 am and for a final time at 4:00
pm, the user would be credited with six hours. This measure simply reflects a range of
access times, not total utilization times. All of these various measures were highly
correlated as seen in Table 7. In the case of the scheduling system utilization measures,
the lowest correlation was 0.8823.
As seen in Figure 14, a trend toward increased utilization occurred across time for
both systems. Also, use of both systems was heavily loaded toward Monday through
Fridays. The spikes in the patient education system use was correlated with training
dates for new employees (while no formal training was offered during implementation of
this system, a training module was included in the new employee clinical systems
course).
Table 7: Correlations between Utilization Measures
System 1: SchedulingSystem
System 2: Patient EducationSystem
Days Hits Days Hits
Hits 0.8823 0.9386
Hours 0.9066 0.8945 0.6761 0.8303
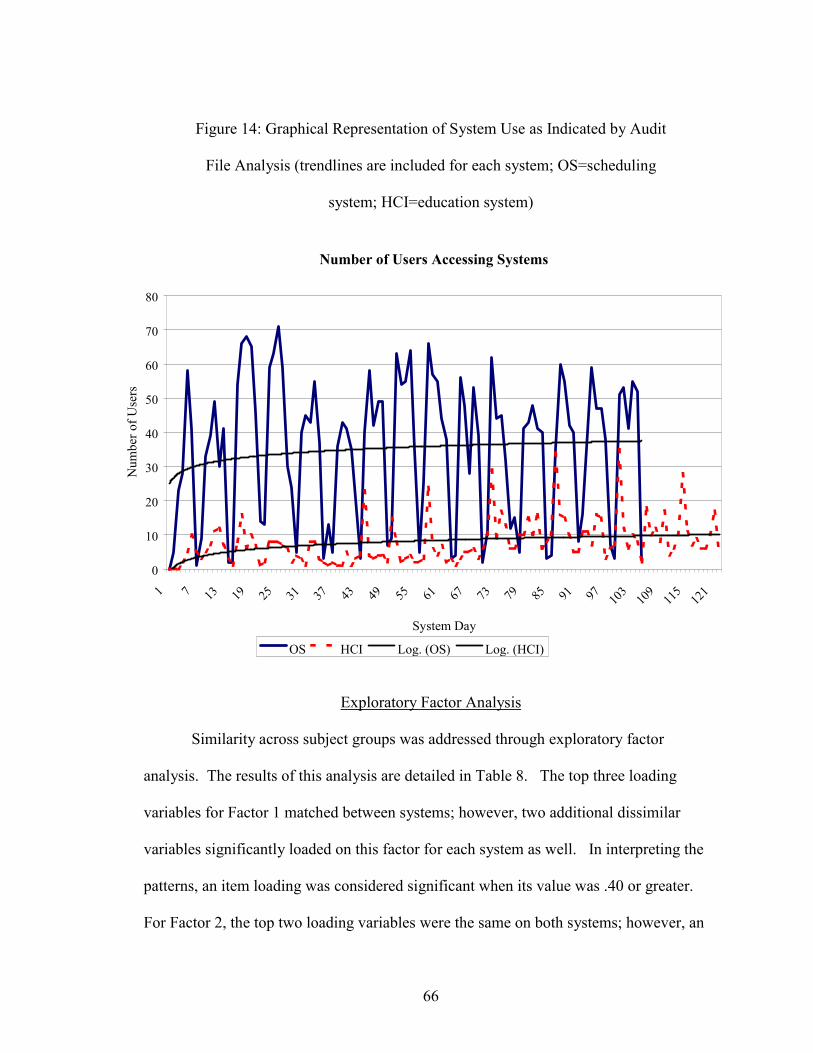
66
Figure 14: Graphical Representation of System Use as Indicated by Audit
File Analysis (trendlines are included for each system; OS=scheduling
system; HCI=education system)
Exploratory Factor Analysis
Similarity across subject groups was addressed through exploratory factor
analysis. The results of this analysis are detailed in Table 8. The top three loading
variables for Factor 1 matched between systems; however, two additional dissimilar
variables significantly loaded on this factor for each system as well. In interpreting the
patterns, an item loading was considered significant when its value was .40 or greater.
For Factor 2, the top two loading variables were the same on both systems; however, an
Number of Users Accessing Systems
0
10
20
30
40
50
60
70
80
1 7 13 19 25 31 37 43 49 55 61 67 73 79 85 91 97 103
109
115
121
System Day
Num
ber
of U
sers
OS HCI Log. (OS) Log. (HCI)
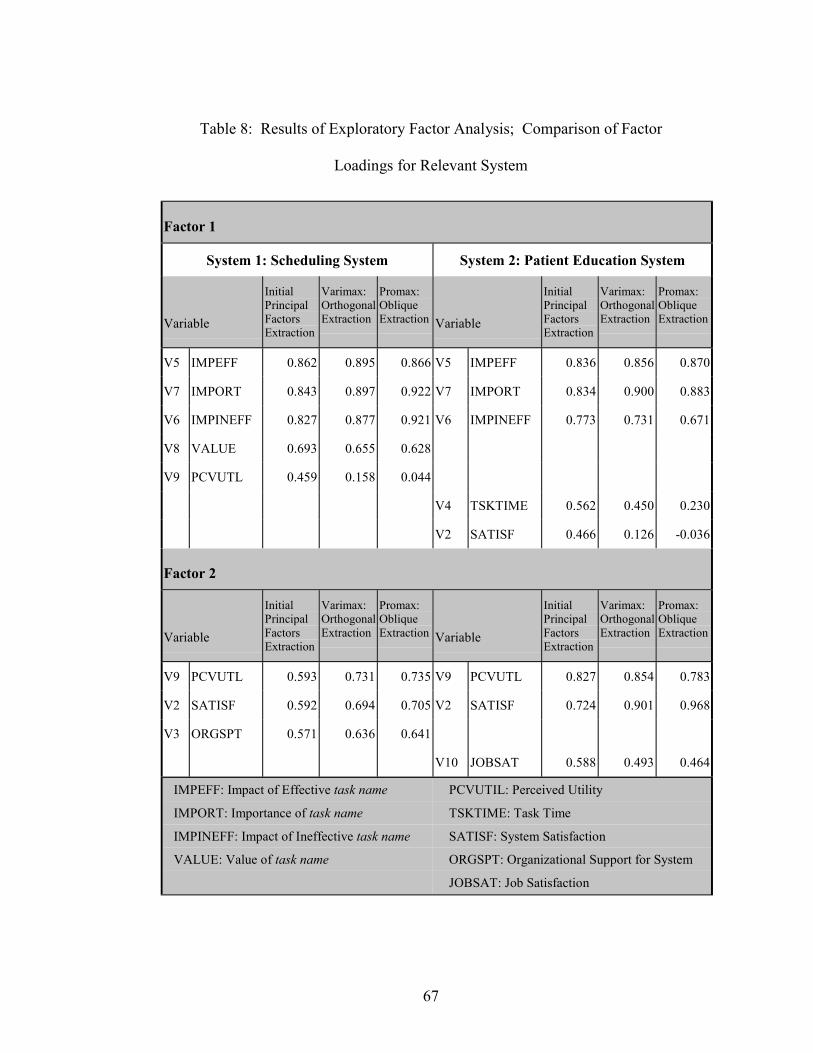
67
Table 8: Results of Exploratory Factor Analysis; Comparison of Factor
Loadings for Relevant System
Factor 1
System 1: Scheduling System System 2: Patient Education System
Variable
InitialPrincipalFactorsExtraction
Varimax:OrthogonalExtraction
Promax:ObliqueExtraction Variable
InitialPrincipalFactorsExtraction
Varimax:OrthogonalExtraction
Promax:ObliqueExtraction
V5 IMPEFF 0.862 0.895 0.866 V5 IMPEFF 0.836 0.856 0.870
V7 IMPORT 0.843 0.897 0.922 V7 IMPORT 0.834 0.900 0.883
V6 IMPINEFF 0.827 0.877 0.921 V6 IMPINEFF 0.773 0.731 0.671
V8 VALUE 0.693 0.655 0.628
V9 PCVUTL 0.459 0.158 0.044
V4 TSKTIME 0.562 0.450 0.230
V2 SATISF 0.466 0.126 -0.036
Factor 2
Variable
InitialPrincipalFactorsExtraction
Varimax:OrthogonalExtraction
Promax:ObliqueExtraction Variable
InitialPrincipalFactorsExtraction
Varimax:OrthogonalExtraction
Promax:ObliqueExtraction
V9 PCVUTL 0.593 0.731 0.735 V9 PCVUTL 0.827 0.854 0.783
V2 SATISF 0.592 0.694 0.705 V2 SATISF 0.724 0.901 0.968
V3 ORGSPT 0.571 0.636 0.641
V10 JOBSAT 0.588 0.493 0.464
IMPEFF: Impact of Effective task name
IMPORT: Importance of task name
IMPINEFF: Impact of Ineffective task name
VALUE: Value of task name
PCVUTIL: Perceived Utility
TSKTIME: Task Time
SATISF: System Satisfaction
ORGSPT: Organizational Support for System
JOBSAT: Job Satisfaction
68
additional dissimilar variable significantly loaded for each system as well. The total
number of factors extracted for each system also differed. Based on the results of this
factor analysis, it was clear that while definite similarities existed between the two
systems, enough significant differences were also present so that pooling data from the
two groups might prove a somewhat haphazard endeavor.
The magnitude of factor loadings was extremely consistent for the antecedents of
the latent variable in the path model, Task Value. Variables 5-8 clearly provided insight
into the same contract when examined through this exploratory analysis. Factor loadings
were of much lower magnitude for other antecedent variables indicating a lower level of
similarity across primary forces. This result is consistent with the proposition that each
primary force is unique in its contribution to the predictive model. As expected, each
observed variable had a factorial complexity of one in the rotated factor pattern
(promax/oblique).
69
Model Analysis
Confirmatory Factor Analysis
Due to the small n size of the patient education system subject group and the
inability to pool subjects as noted by the exploratory factor analysis, only the scheduling
system subjects were included in subsequent model development and analysis in the
structural equation modeling portions of this research.
The fit of the initial measurement model was first tested with confirmatory factor
analysis in order to �fix� the theoretical model. The test for significance of covariance
values in this model is the t test. The tested confirmatory model with t values entered is
displayed in Figure 15. Significant covariations are indicated with dark double-headed
arrows. Maximum-likelihood parameter estimation was applied once multivariate
normality and observation independence were established since this method is scale
invariant and recognized as most appropriate for small sample sizes (Saris & Stronkhorst,
1984, p.173).
In the initial analysis, four subjects demonstrated significant kurtosis due to their
characteristics as multivariate outliers. No significant commonalities were found
between these subjects, either in utilization statistics, survey responses or demographics.
They were identified initially as extreme contributors to kurtosis, driving the overall
kurtosis index to over 30, through the PROC CALIS module in SAS. A procedure to
identify potential weighting of the outliers calculated all weights as one except for the
four outliers who would require significantly diminished weightings. A decision was
made to omit the subjects based on the extreme nature of the multivariate outlier problem
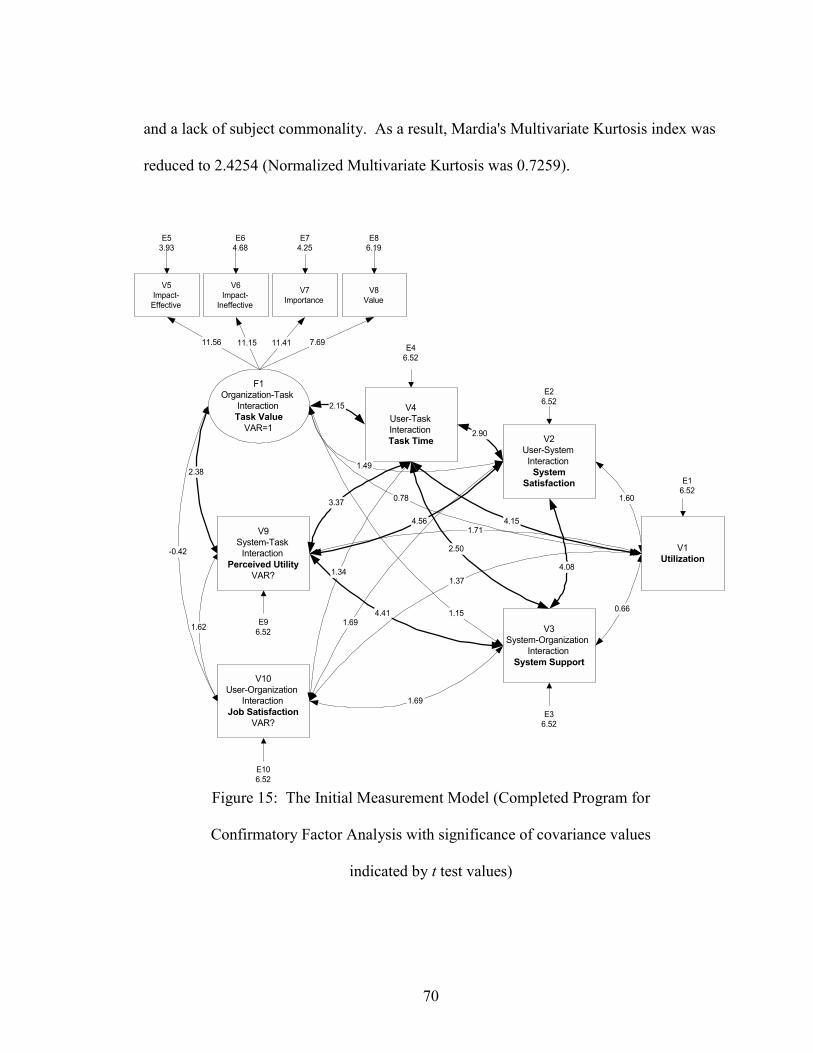
70
and a lack of subject commonality. As a result, Mardia's Multivariate Kurtosis index was
reduced to 2.4254 (Normalized Multivariate Kurtosis was 0.7259).
Figure 15: The Initial Measurement Model (Completed Program for
Confirmatory Factor Analysis with significance of covariance values
indicated by t test values)
V4User-TaskInteractionTask Time
V10User-Organization
InteractionJob Satisfaction
VAR?
V3System-Organization
InteractionSystem Support
4.56
4.41
2.90
1.69
2.15
1.15 0.66
1.60
2.38
-0.42
1.62
E16.52
E26.52
E46.52
E36.52
V9System-Task
InteractionPerceived Utility
VAR?
V1Utilization
F1Organization-Task
InteractionTask Value
VAR=1V2
User-SystemInteraction
SystemSatisfaction
V5Impact-
Effective
V6Impact-
Ineffective
V7Importance
E53.93
E64.68
E74.25
11.56 11.15 11.41
V8Value
E86.19
7.69
3.37
1.69
1.341.37
1.71
2.50
0.78
1.49
4.15
4.08
E96.52
E106.52
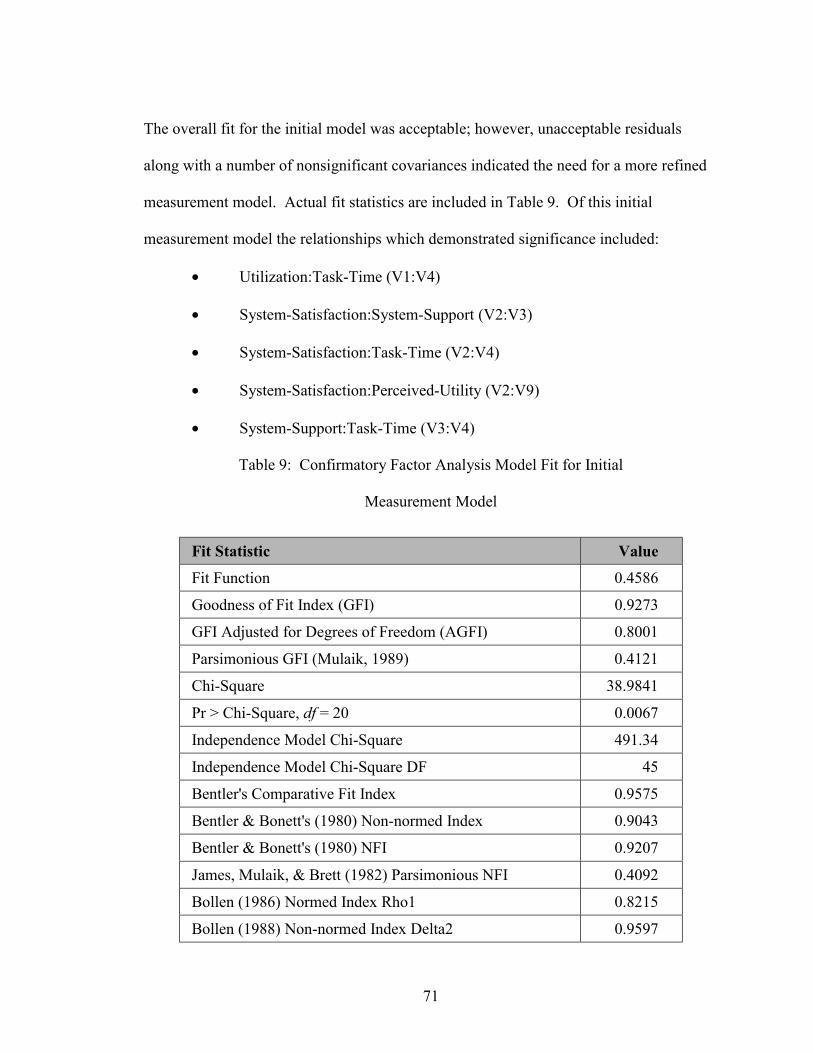
71
The overall fit for the initial model was acceptable; however, unacceptable residuals
along with a number of nonsignificant covariances indicated the need for a more refined
measurement model. Actual fit statistics are included in Table 9. Of this initial
measurement model the relationships which demonstrated significance included:
• Utilization:Task-Time (V1:V4)
• System-Satisfaction:System-Support (V2:V3)
• System-Satisfaction:Task-Time (V2:V4)
• System-Satisfaction:Perceived-Utility (V2:V9)
• System-Support:Task-Time (V3:V4)
Table 9: Confirmatory Factor Analysis Model Fit for Initial
Measurement Model
Fit Statistic Value
Fit Function 0.4586
Goodness of Fit Index (GFI) 0.9273
GFI Adjusted for Degrees of Freedom (AGFI) 0.8001
Parsimonious GFI (Mulaik, 1989) 0.4121
Chi-Square 38.9841
Pr > Chi-Square, df = 20 0.0067
Independence Model Chi-Square 491.34
Independence Model Chi-Square DF 45
Bentler's Comparative Fit Index 0.9575
Bentler & Bonett's (1980) Non-normed Index 0.9043
Bentler & Bonett's (1980) NFI 0.9207
James, Mulaik, & Brett (1982) Parsimonious NFI 0.4092
Bollen (1986) Normed Index Rho1 0.8215
Bollen (1988) Non-normed Index Delta2 0.9597
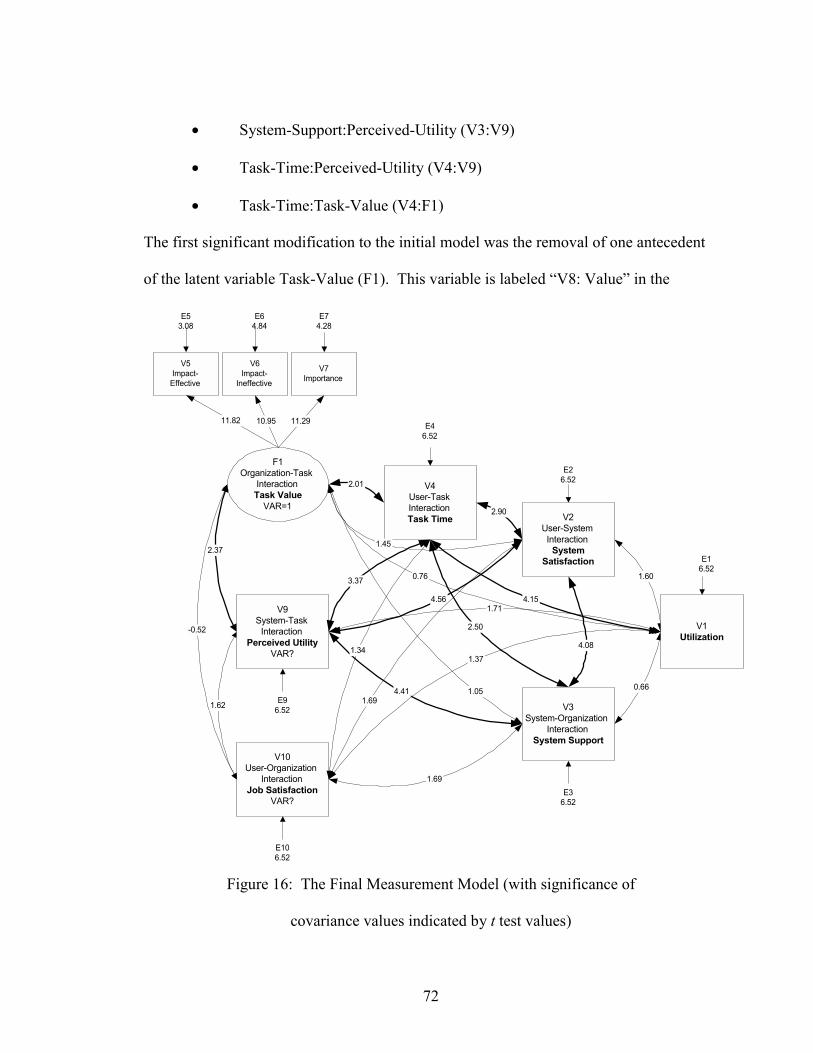
72
• System-Support:Perceived-Utility (V3:V9)
• Task-Time:Perceived-Utility (V4:V9)
• Task-Time:Task-Value (V4:F1)
The first significant modification to the initial model was the removal of one antecedent
of the latent variable Task-Value (F1). This variable is labeled �V8: Value� in the
Figure 16: The Final Measurement Model (with significance of
covariance values indicated by t test values)
V4User-TaskInteractionTask Time
V10User-Organization
InteractionJob Satisfaction
VAR?
V3System-Organization
InteractionSystem Support
4.56
4.41
2.90
1.69
2.01
1.05 0.66
1.60
2.37
-0.52
1.62
E16.52
E26.52
E46.52
E36.52
V9System-Task
InteractionPerceived Utility
VAR?
V1Utilization
F1Organization-Task
InteractionTask Value
VAR=1V2
User-SystemInteraction
SystemSatisfaction
V5Impact-
Effective
V6Impact-
Ineffective
V7Importance
E53.08
E64.84
E74.28
11.82 10.95 11.29
3.37
1.69
1.341.37
1.71
2.50
0.76
1.45
4.15
4.08
E96.52
E106.52
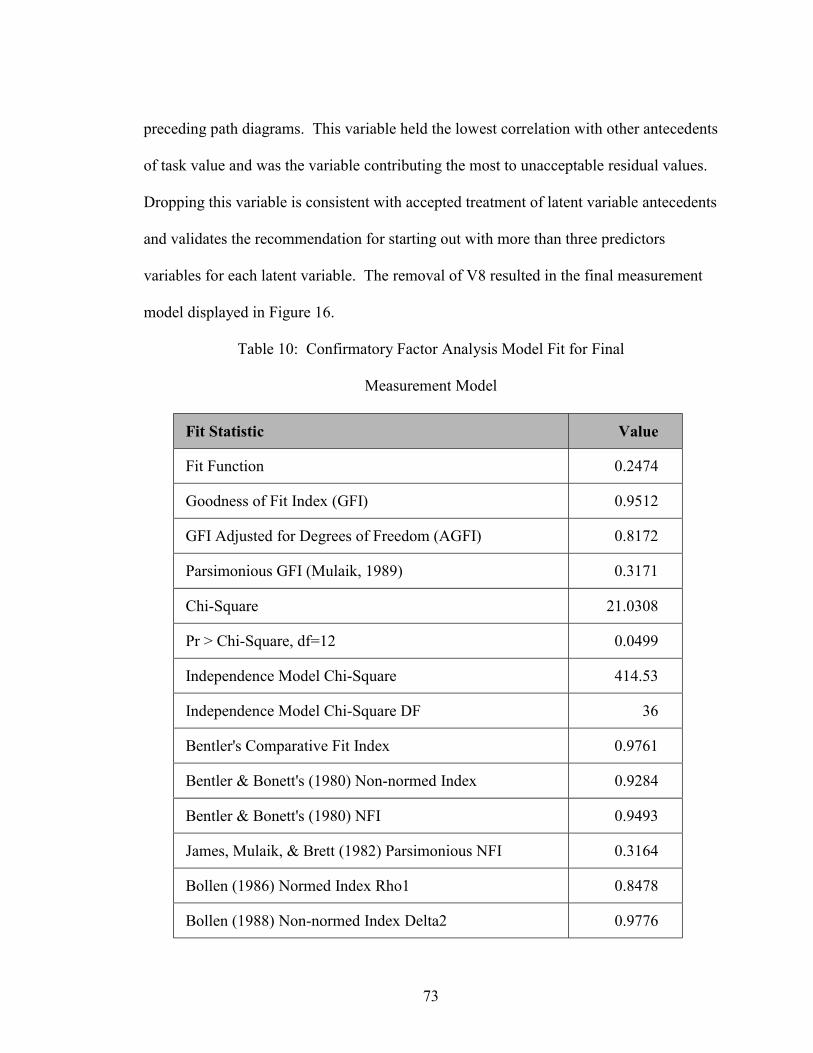
73
preceding path diagrams. This variable held the lowest correlation with other antecedents
of task value and was the variable contributing the most to unacceptable residual values.
Dropping this variable is consistent with accepted treatment of latent variable antecedents
and validates the recommendation for starting out with more than three predictors
variables for each latent variable. The removal of V8 resulted in the final measurement
model displayed in Figure 16.
Table 10: Confirmatory Factor Analysis Model Fit for Final
Measurement Model
Fit Statistic Value
Fit Function 0.2474
Goodness of Fit Index (GFI) 0.9512
GFI Adjusted for Degrees of Freedom (AGFI) 0.8172
Parsimonious GFI (Mulaik, 1989) 0.3171
Chi-Square 21.0308
Pr > Chi-Square, df=12 0.0499
Independence Model Chi-Square 414.53
Independence Model Chi-Square DF 36
Bentler's Comparative Fit Index 0.9761
Bentler & Bonett's (1980) Non-normed Index 0.9284
Bentler & Bonett's (1980) NFI 0.9493
James, Mulaik, & Brett (1982) Parsimonious NFI 0.3164
Bollen (1986) Normed Index Rho1 0.8478
Bollen (1988) Non-normed Index Delta2 0.9776
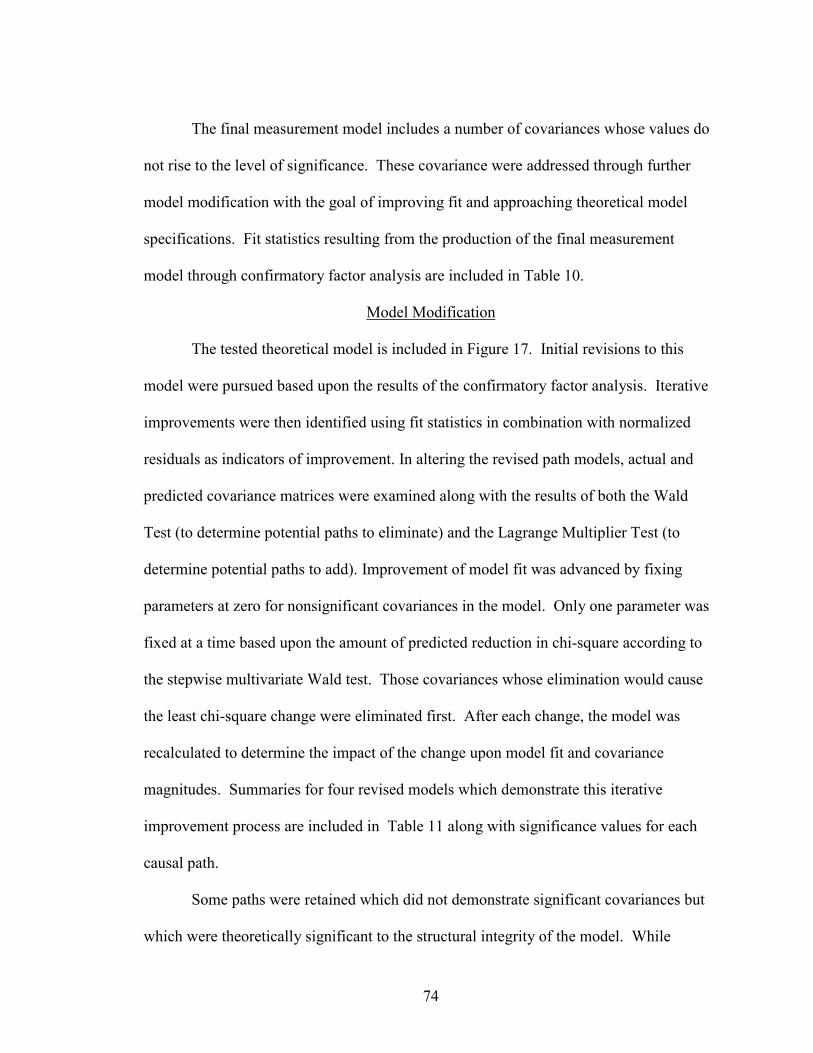
74
The final measurement model includes a number of covariances whose values do
not rise to the level of significance. These covariance were addressed through further
model modification with the goal of improving fit and approaching theoretical model
specifications. Fit statistics resulting from the production of the final measurement
model through confirmatory factor analysis are included in Table 10.
Model Modification
The tested theoretical model is included in Figure 17. Initial revisions to this
model were pursued based upon the results of the confirmatory factor analysis. Iterative
improvements were then identified using fit statistics in combination with normalized
residuals as indicators of improvement. In altering the revised path models, actual and
predicted covariance matrices were examined along with the results of both the Wald
Test (to determine potential paths to eliminate) and the Lagrange Multiplier Test (to
determine potential paths to add). Improvement of model fit was advanced by fixing
parameters at zero for nonsignificant covariances in the model. Only one parameter was
fixed at a time based upon the amount of predicted reduction in chi-square according to
the stepwise multivariate Wald test. Those covariances whose elimination would cause
the least chi-square change were eliminated first. After each change, the model was
recalculated to determine the impact of the change upon model fit and covariance
magnitudes. Summaries for four revised models which demonstrate this iterative
improvement process are included in Table 11 along with significance values for each
causal path.
Some paths were retained which did not demonstrate significant covariances but
which were theoretically significant to the structural integrity of the model. While
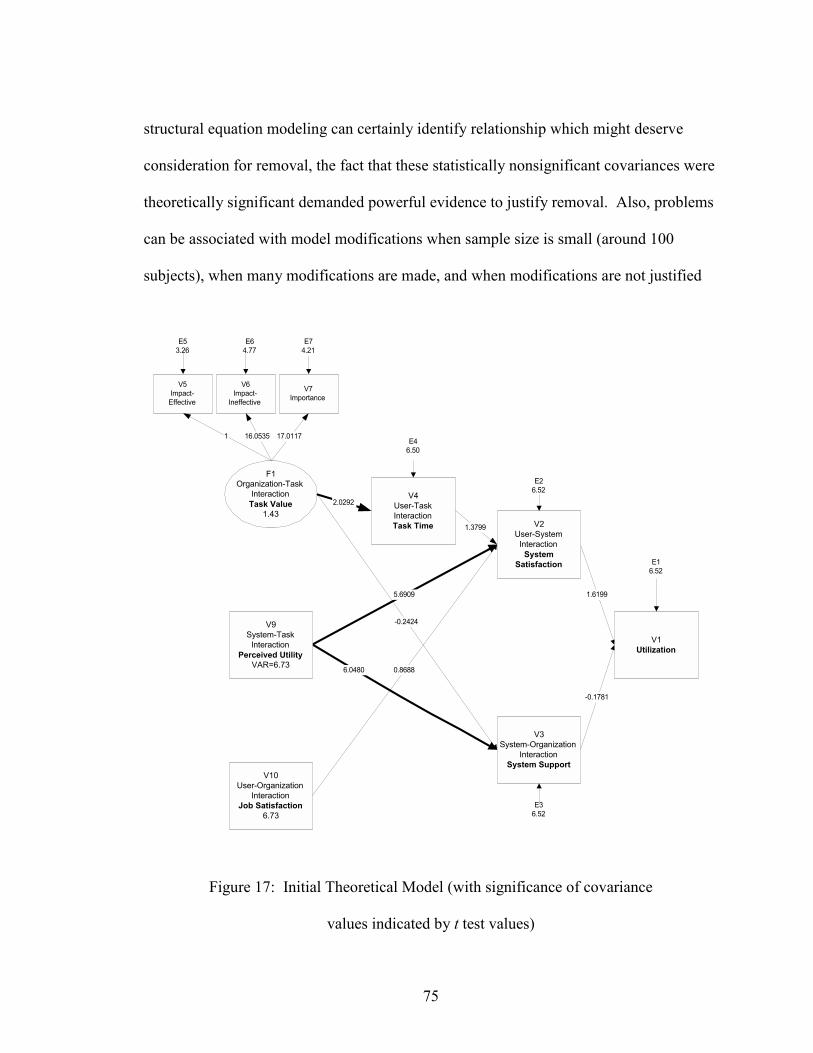
75
structural equation modeling can certainly identify relationship which might deserve
consideration for removal, the fact that these statistically nonsignificant covariances were
theoretically significant demanded powerful evidence to justify removal. Also, problems
can be associated with model modifications when sample size is small (around 100
subjects), when many modifications are made, and when modifications are not justified
Figure 17: Initial Theoretical Model (with significance of covariance
values indicated by t test values)
V4User-TaskInteractionTask Time
V10User-Organization
InteractionJob Satisfaction
6.73
V3System-Organization
InteractionSystem Support
5.6909
6.0480
-0.1781
1.6199
E16.52
E26.52
E46.50
E36.52
V9System-Task
InteractionPerceived Utility
VAR=6.73
V1Utilization
F1Organization-Task
InteractionTask Value
1.43V2
User-SystemInteraction
SystemSatisfaction
V5Impact-Effective
V6Impact-
Ineffective
V7Importance
E53.26
E64.77
E74.21
1 16.0535 17.0117
1.3799
0.8688
-0.2424
2.0292

76
according to theory or prior research (Hatcher, 1994, p. 199). Therefore, modifications
were kept to a minimum and only modifications that reflected �good� theory were made.
The revised models developed in this analysis met each of the prerequisite
conditions for path analysis. Interval level of measurement was present with most
variables able to assume up to seven values. Outliers were identified and removed in a
few justified instances to maintain a relatively normal distribution of data.
Further analysis demonstrated linear additive relationships between independent and
dependent variables. Strong intercorrelations only existed between antecedents of the
single latent variable, which is actually a desirable characteristic for demonstration of
scale reliability. The single latent variable had sufficient number of indicators and the
model had an appropriate number of indicators overall as well. The model is desirably
overidentified since it is a simple recursive model. All nontrivial cases were included
due to the design of the study; elimination of subjects was only due to incomplete survey
data and trivial outliers. Finally the theoretical foundations of the scales used in the
developed models contributes to the minimization of measurement error.
Figure 18 illustrates the significance of the causal relationships in the fourth
revised model. The largest asymptotically standardized residual for this model retained a
value of 1.85267, below the maximum recommended of 2.0. R-square values for each
endogenous manifest variable in the model are listed in Table 11. Of particular note are
the R-square values for utilization (V1), system satisfaction (V2) and organizational
support (V3). A comparison between the relationships in the fourth revised model and
the relationships in the initial theoretical model shows that the following combinations
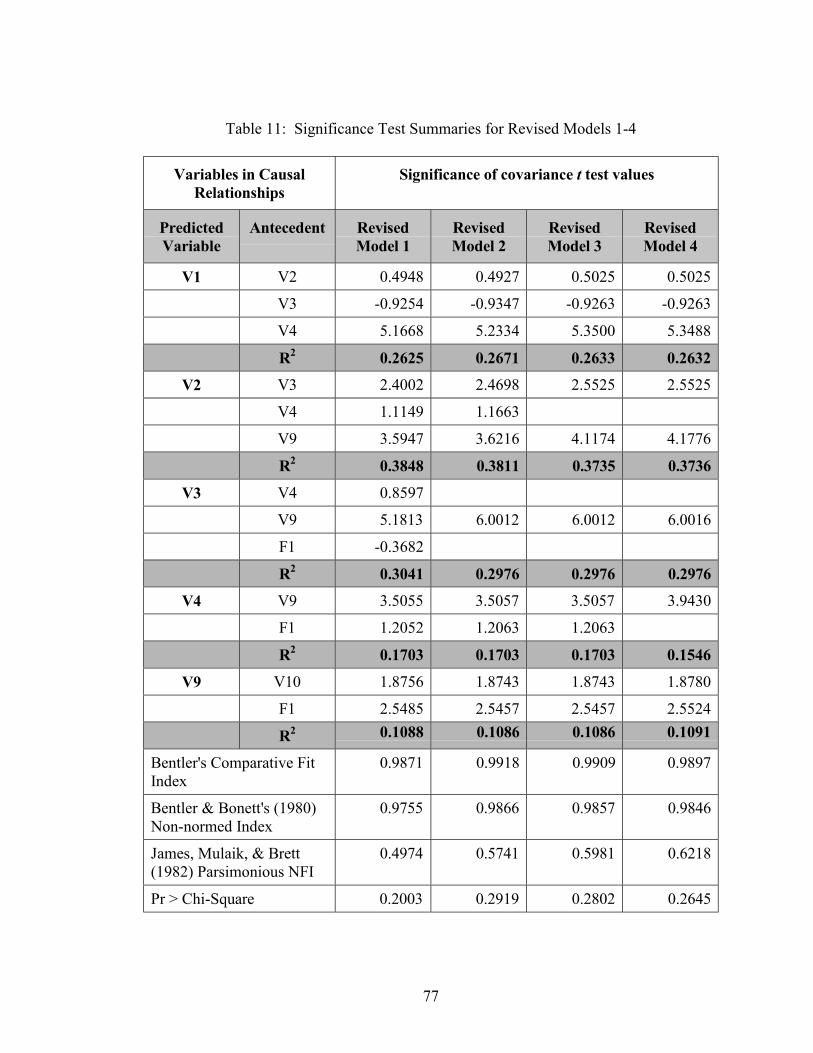
77
Table 11: Significance Test Summaries for Revised Models 1-4
Variables in CausalRelationships
Significance of covariance t test values
PredictedVariable
Antecedent RevisedModel 1
RevisedModel 2
RevisedModel 3
RevisedModel 4
V1 V2 0.4948 0.4927 0.5025 0.5025
V3 -0.9254 -0.9347 -0.9263 -0.9263
V4 5.1668 5.2334 5.3500 5.3488
R2 0.2625 0.2671 0.2633 0.2632
V2 V3 2.4002 2.4698 2.5525 2.5525
V4 1.1149 1.1663
V9 3.5947 3.6216 4.1174 4.1776
R2 0.3848 0.3811 0.3735 0.3736
V3 V4 0.8597
V9 5.1813 6.0012 6.0012 6.0016
F1 -0.3682
R2 0.3041 0.2976 0.2976 0.2976
V4 V9 3.5055 3.5057 3.5057 3.9430
F1 1.2052 1.2063 1.2063
R2 0.1703 0.1703 0.1703 0.1546
V9 V10 1.8756 1.8743 1.8743 1.8780
F1 2.5485 2.5457 2.5457 2.5524
R2 0.1088 0.1086 0.1086 0.1091
Bentler's Comparative FitIndex
0.9871 0.9918 0.9909 0.9897
Bentler & Bonett's (1980)Non-normed Index
0.9755 0.9866 0.9857 0.9846
James, Mulaik, & Brett(1982) Parsimonious NFI
0.4974 0.5741 0.5981 0.6218
Pr > Chi-Square 0.2003 0.2919 0.2802 0.2645
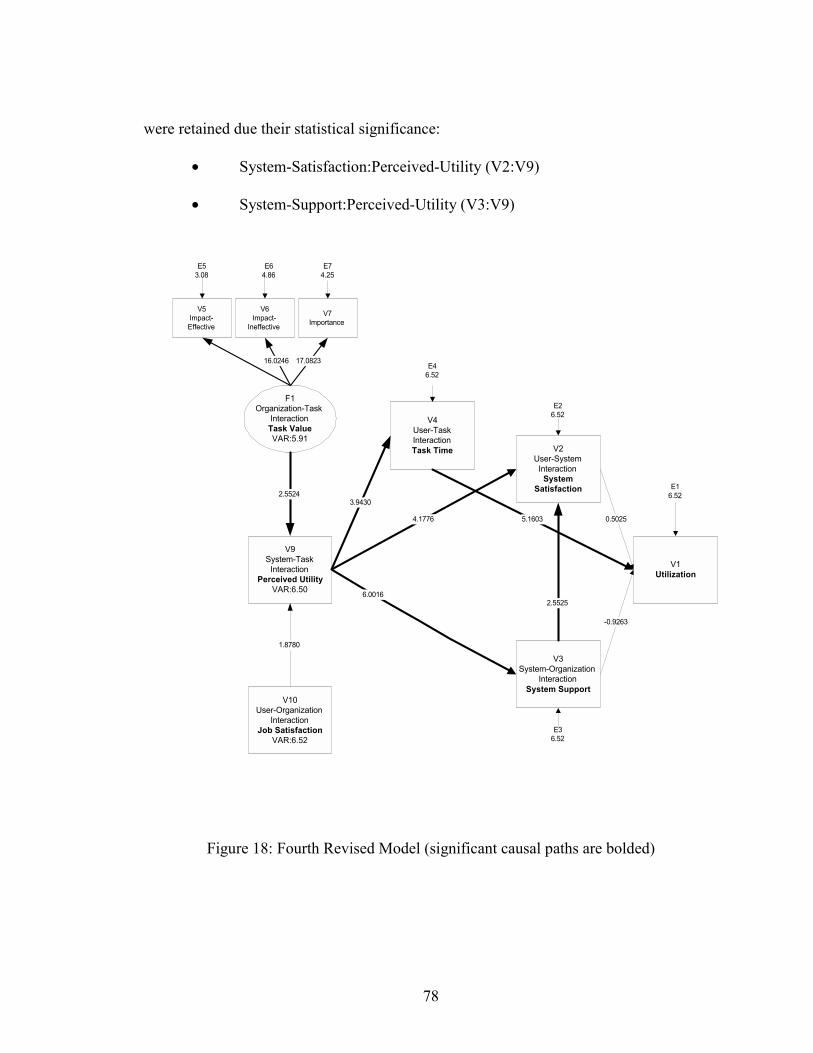
78
were retained due their statistical significance:
• System-Satisfaction:Perceived-Utility (V2:V9)
• System-Support:Perceived-Utility (V3:V9)
Figure 18: Fourth Revised Model (significant causal paths are bolded)
V4User-TaskInteractionTask Time
V10User-Organization
InteractionJob Satisfaction
VAR:6.52
V3System-Organization
InteractionSystem Support
4.1776
6.0016
-0.9263
0.5025
E16.52
E26.52
E46.52
E36.52
V9System-Task
InteractionPerceived Utility
VAR:6.50
V1Utilization
F1Organization-Task
InteractionTask ValueVAR:5.91
V2User-System
InteractionSystem
Satisfaction
V5Impact-Effective
V6Impact-
Ineffective
V7Importance
E53.08
E64.86
E74.25
16.0246 17.0823
3.9430
5.1603
2.5525
1.8780
2.5524
79
Paths that fell out from the initial theoretical model were:
• System-Satisfaction:Task-Time (V2:V4)
• System-Satisfaction:Job-Satisfaction (V2:V10)
• Task-Value:System-Support (F1:V3)
• Task-Value:Task-Time (F1:V4)
Paths that were retained due to their theoretical significance, but which did not
demonstrate significance in this analyses were:
• Utilization:System-Satisfaction (V1:V2)
• Utilization:System-Support (V1:V3)
Paths that were added in model modification which were not in the original theoretical
model were:
• Utilization:Task-Time (V1:V4)
• System-Satisfaction:System-Support (V2:V3)
• Task-Time:Perceived-Utility (V4:V9)
• Task-Value:Perceived-Utility (F1:V9)
• Job-Satisfaction: Perceived-Utility (V10:V9)
In total four paths were dropped from the original theoretical model and five paths were
added. The overall fit for the initial model was excellent.
The characteristics of an ideal fit as listed by Hatcher (1994, p. 393) were
matched quite well by the revised model. The p value for the model chi-square test
ranged from 0.2003 for revised model 1 to 0.2919 for revised model 2. All models met
the characteristic of Chi-square nonsignificance and all chi-square/df ratio were less than
80
2 (highest was 1.257). The CFI and the NNFI both exceeded .9 for all revised models,
the lowest CFI was 0.9871 and NNFI was 0.9755.
The absolute value of the t statistics for most factor loadings and path coefficients
exceeded 1.96. The exceptions were those causal relationships which were deemed to be
theoretically significant but not statistically significant as noted earlier in these results.
All relationships with nontrivial standardized factor loadings were removed subsequent to
revised model 1 (absolute values exceeded .05). No latent endogenous variables were
included in these models; therefore the symmetry characteristics of such variables were
not relevant for this study. No normalized residuals exceeded 2.0 in absolute value
(highest was 1.85267).
Controlling for the complexity of models through parsimony indices is routinely
recommended by most researchers (Marsh, Balla & Hau, 1996, p.324). The fourth
revised combined model demonstrated the highest levels of parsimony and fit compared
to other models as demonstrated by the parsimony ratio (PR) and the parsimonious
normed-fit index (PNFI) with PR=0.6667 and PNFI=0.6218. The structural portions of
all revised models demonstrated high levels of parsimony and fit as well, evidenced by
the relative normed-fit index (RNFI) with all values exceeding 1.0000. Relative
parsimony ratios (RPR) and relative parsimonious fit indexes (RPFI) could not be
calculated because of the nonstandard nature of the model. Table 12 contains summaries
of these statistics for all models.
Chi-square difference tests were performed for each model with results for each
test included in Table 13. The chi-square difference tests were performed by comparing
each model of interest to the final measurement model. As expected, significant
81
differences exist with the null model and the uncorrelated model. The initial theoretical
model also demonstrated significant differences from the measurement model (p<0.001).
This difference indicates weakness in the original specification of the theoretical model;
however, the revised models derived from the combination of the confirmatory factor
analysis and the theoretical model showed no significant difference from the
measurement model.
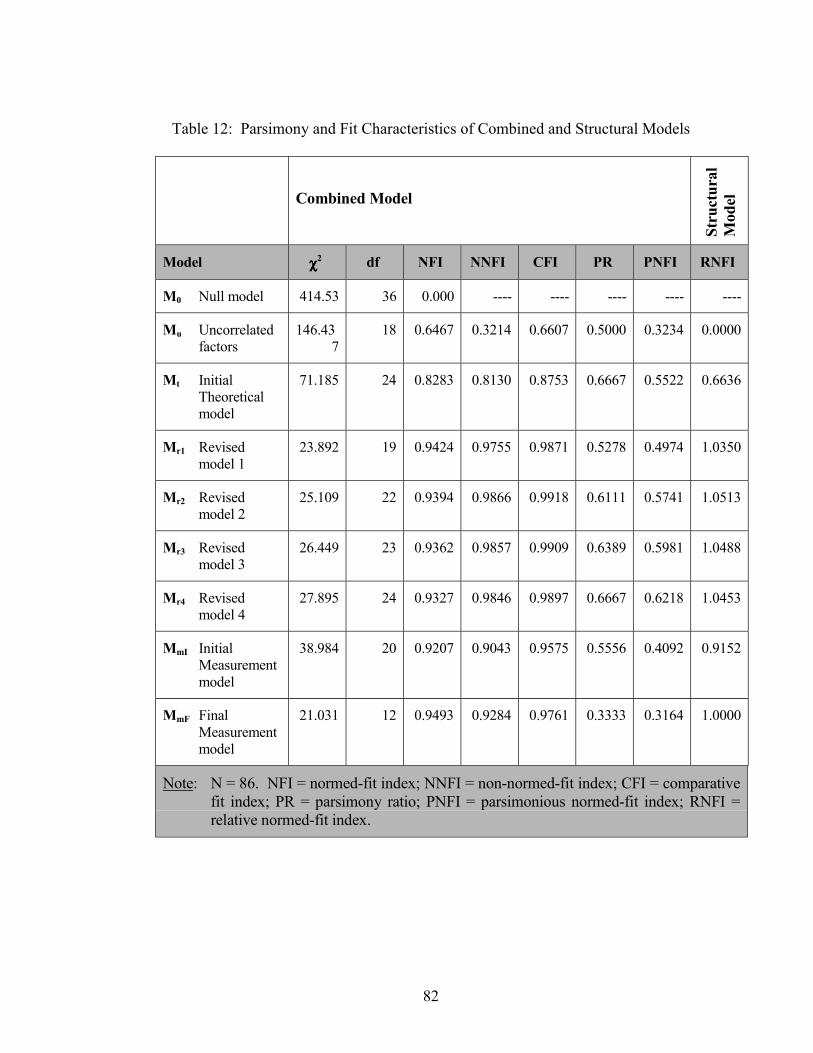
82
Table 12: Parsimony and Fit Characteristics of Combined and Structural Models
Combined Model
Stru
ctur
alM
odel
Model χχχχ2 df NFI NNFI CFI PR PNFI RNFI
M0 Null model 414.53 36 0.000 ---- ---- ---- ---- ----
Mu Uncorrelatedfactors
146.437
18 0.6467 0.3214 0.6607 0.5000 0.3234 0.0000
Mt InitialTheoreticalmodel
71.185 24 0.8283 0.8130 0.8753 0.6667 0.5522 0.6636
Mr1 Revisedmodel 1
23.892 19 0.9424 0.9755 0.9871 0.5278 0.4974 1.0350
Mr2 Revisedmodel 2
25.109 22 0.9394 0.9866 0.9918 0.6111 0.5741 1.0513
Mr3 Revisedmodel 3
26.449 23 0.9362 0.9857 0.9909 0.6389 0.5981 1.0488
Mr4 Revisedmodel 4
27.895 24 0.9327 0.9846 0.9897 0.6667 0.6218 1.0453
MmI InitialMeasurementmodel
38.984 20 0.9207 0.9043 0.9575 0.5556 0.4092 0.9152
MmF FinalMeasurementmodel
21.031 12 0.9493 0.9284 0.9761 0.3333 0.3164 1.0000
Note: N = 86. NFI = normed-fit index; NNFI = non-normed-fit index; CFI = comparativefit index; PR = parsimony ratio; PNFI = parsimonious normed-fit index; RNFI =relative normed-fit index.
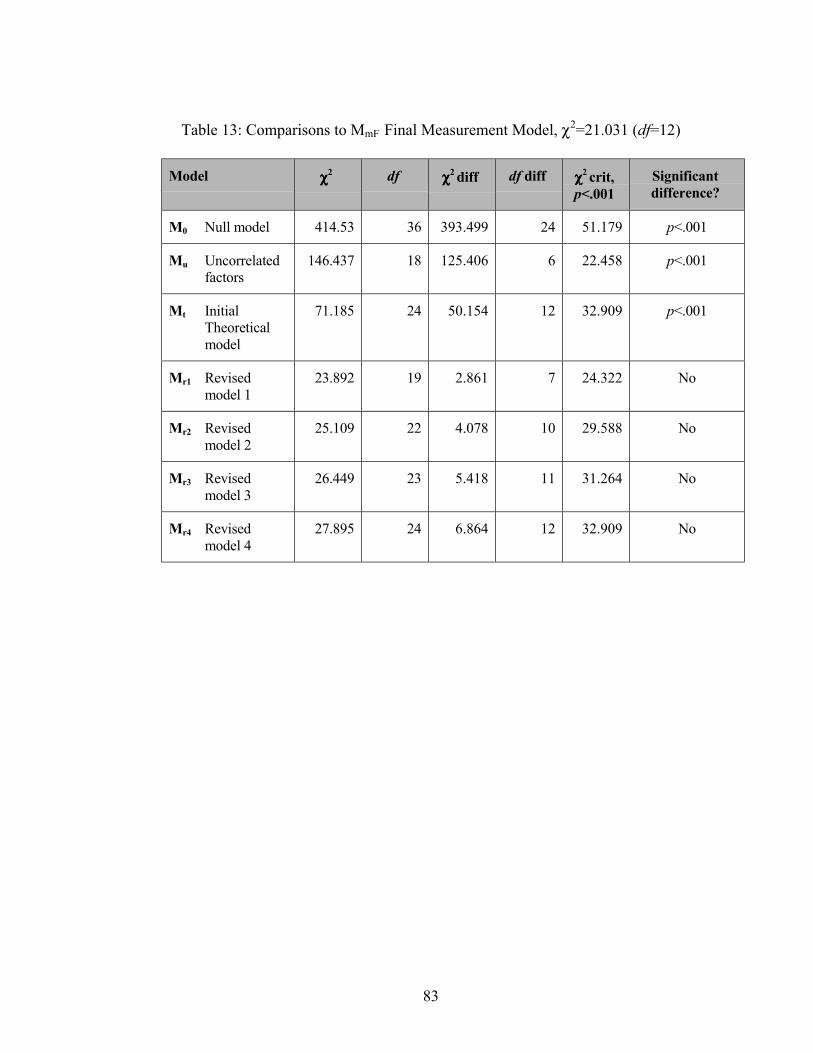
83
Table 13: Comparisons to MmF Final Measurement Model, χ2=21.031 (df=12)
Model χχχχ2 df χχχχ2 diff df diff χχχχ2 crit,p<.001
Significantdifference?
M0 Null model 414.53 36 393.499 24 51.179 p<.001
Mu Uncorrelatedfactors
146.437 18 125.406 6 22.458 p<.001
Mt InitialTheoreticalmodel
71.185 24 50.154 12 32.909 p<.001
Mr1 Revisedmodel 1
23.892 19 2.861 7 24.322 No
Mr2 Revisedmodel 2
25.109 22 4.078 10 29.588 No
Mr3 Revisedmodel 3
26.449 23 5.418 11 31.264 No
Mr4 Revisedmodel 4
27.895 24 6.864 12 32.909 No
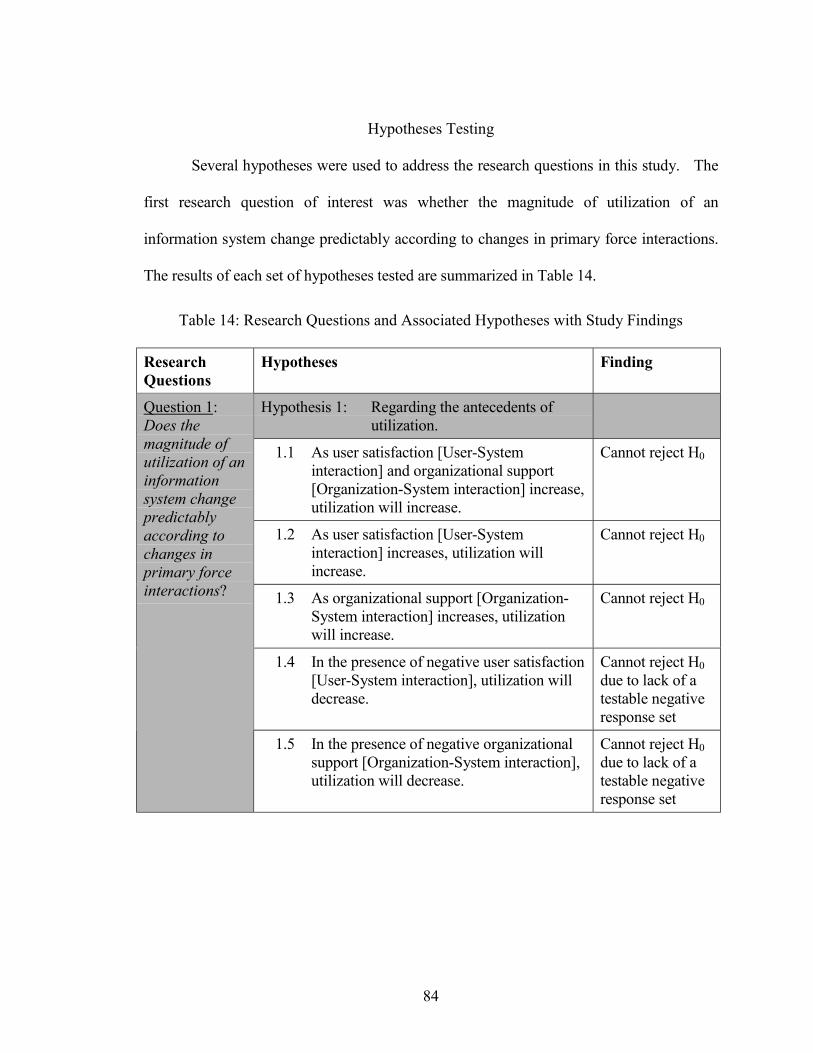
84
Hypotheses Testing
Several hypotheses were used to address the research questions in this study. The
first research question of interest was whether the magnitude of utilization of an
information system change predictably according to changes in primary force interactions.
The results of each set of hypotheses tested are summarized in Table 14.
Table 14: Research Questions and Associated Hypotheses with Study Findings
ResearchQuestions
Hypotheses Finding
Hypothesis 1: Regarding the antecedents ofutilization.
1.1 As user satisfaction [User-Systeminteraction] and organizational support[Organization-System interaction] increase,utilization will increase.
Cannot reject H0
1.2 As user satisfaction [User-Systeminteraction] increases, utilization willincrease.
Cannot reject H0
1.3 As organizational support [Organization-System interaction] increases, utilizationwill increase.
Cannot reject H0
1.4 In the presence of negative user satisfaction[User-System interaction], utilization willdecrease.
Cannot reject H0
due to lack of atestable negativeresponse set
Question 1:Does themagnitude ofutilization of aninformationsystem changepredictablyaccording tochanges inprimary forceinteractions?
1.5 In the presence of negative organizationalsupport [Organization-System interaction],utilization will decrease.
Cannot reject H0
due to lack of atestable negativeresponse set
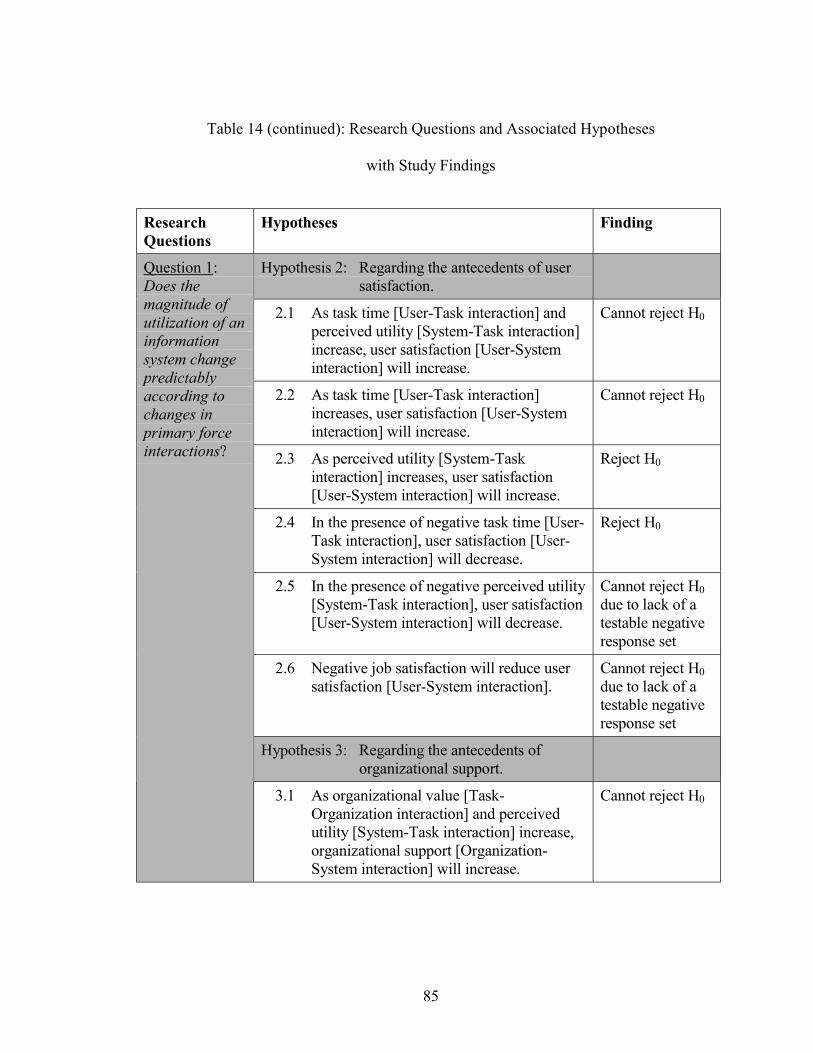
85
Table 14 (continued): Research Questions and Associated Hypotheses
with Study Findings
ResearchQuestions
Hypotheses Finding
Hypothesis 2: Regarding the antecedents of usersatisfaction.
2.1 As task time [User-Task interaction] andperceived utility [System-Task interaction]increase, user satisfaction [User-Systeminteraction] will increase.
Cannot reject H0
2.2 As task time [User-Task interaction]increases, user satisfaction [User-Systeminteraction] will increase.
Cannot reject H0
2.3 As perceived utility [System-Taskinteraction] increases, user satisfaction[User-System interaction] will increase.
Reject H0
2.4 In the presence of negative task time [User-Task interaction], user satisfaction [User-System interaction] will decrease.
Reject H0
2.5 In the presence of negative perceived utility[System-Task interaction], user satisfaction[User-System interaction] will decrease.
Cannot reject H0
due to lack of atestable negativeresponse set
2.6 Negative job satisfaction will reduce usersatisfaction [User-System interaction].
Cannot reject H0
due to lack of atestable negativeresponse set
Hypothesis 3: Regarding the antecedents oforganizational support.
Question 1:Does themagnitude ofutilization of aninformationsystem changepredictablyaccording tochanges inprimary forceinteractions?
3.1 As organizational value [Task-Organization interaction] and perceivedutility [System-Task interaction] increase,organizational support [Organization-System interaction] will increase.
Cannot reject H0
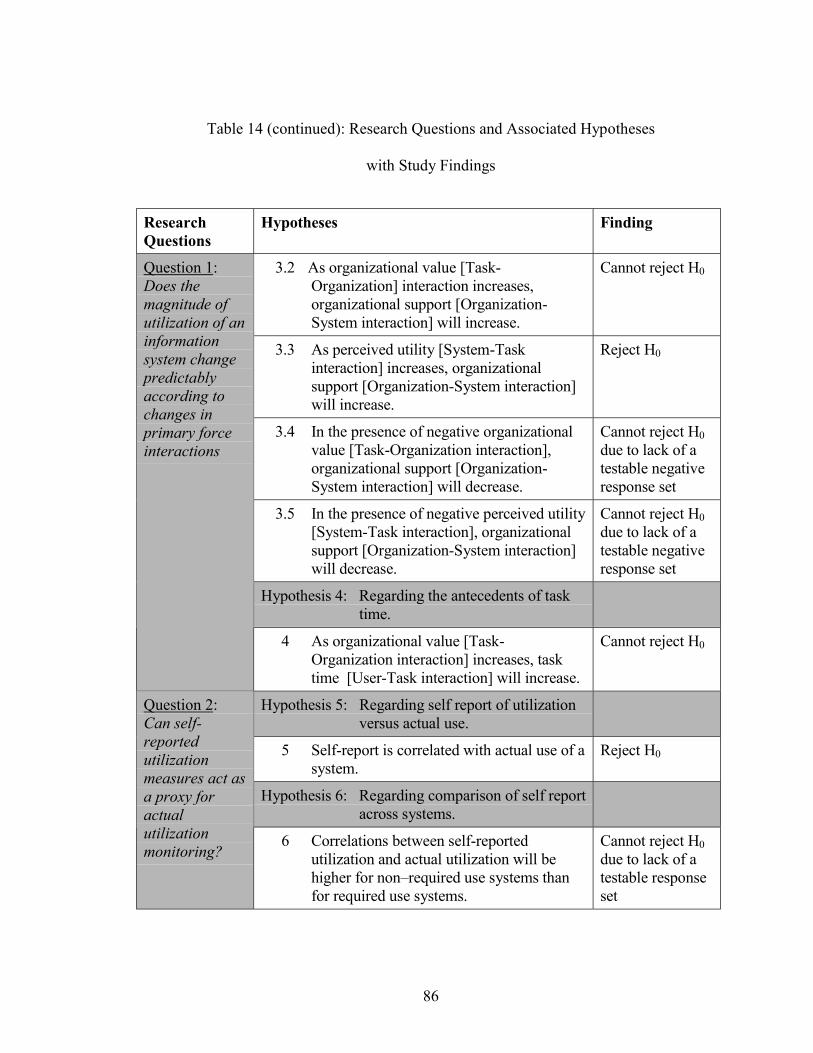
86
Table 14 (continued): Research Questions and Associated Hypotheses
with Study Findings
ResearchQuestions
Hypotheses Finding
3.2 As organizational value [Task-Organization] interaction increases,organizational support [Organization-System interaction] will increase.
Cannot reject H0
3.3 As perceived utility [System-Taskinteraction] increases, organizationalsupport [Organization-System interaction]will increase.
Reject H0
3.4 In the presence of negative organizationalvalue [Task-Organization interaction],organizational support [Organization-System interaction] will decrease.
Cannot reject H0
due to lack of atestable negativeresponse set
3.5 In the presence of negative perceived utility[System-Task interaction], organizationalsupport [Organization-System interaction]will decrease.
Cannot reject H0
due to lack of atestable negativeresponse set
Hypothesis 4: Regarding the antecedents of tasktime.
Question 1:Does themagnitude ofutilization of aninformationsystem changepredictablyaccording tochanges inprimary forceinteractions
4 As organizational value [Task-Organization interaction] increases, tasktime [User-Task interaction] will increase.
Cannot reject H0
Hypothesis 5: Regarding self report of utilizationversus actual use.
5 Self-report is correlated with actual use of asystem.
Reject H0
Hypothesis 6: Regarding comparison of self reportacross systems.
Question 2:Can self-reportedutilizationmeasures act asa proxy foractualutilizationmonitoring?
6 Correlations between self-reportedutilization and actual utilization will behigher for non�required use systems thanfor required use systems.
Cannot reject H0
due to lack of atestable responseset
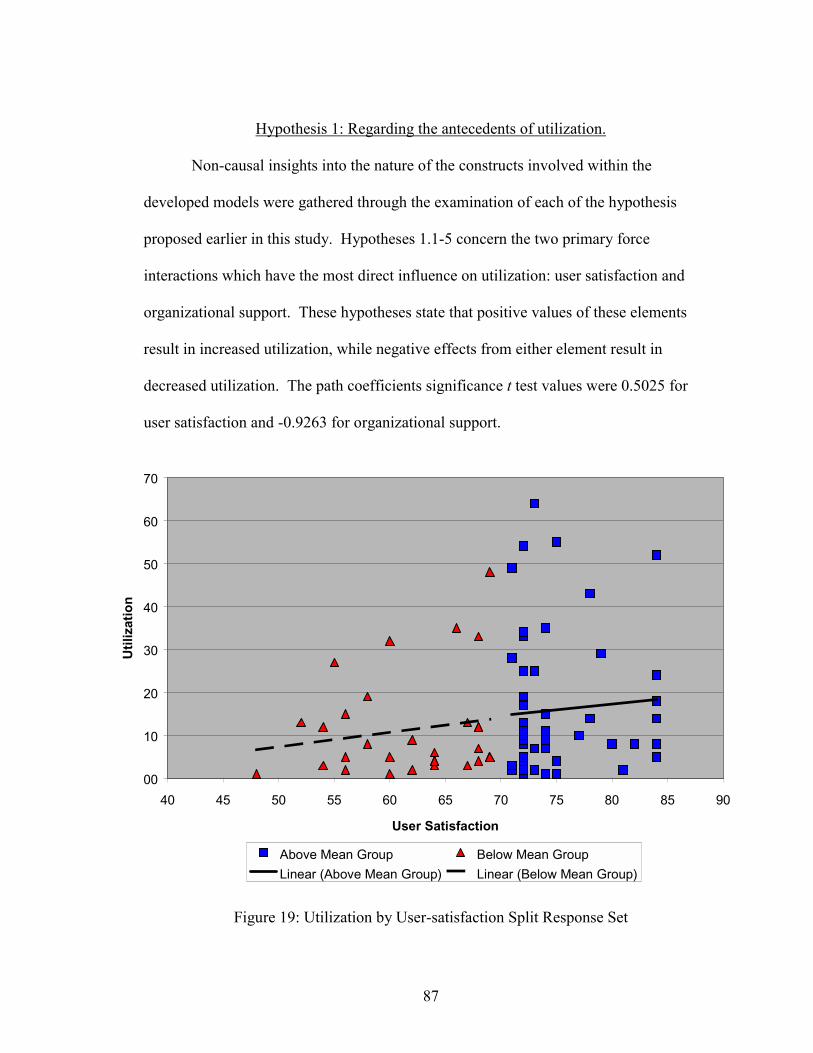
87
Hypothesis 1: Regarding the antecedents of utilization.
Non-causal insights into the nature of the constructs involved within the
developed models were gathered through the examination of each of the hypothesis
proposed earlier in this study. Hypotheses 1.1-5 concern the two primary force
interactions which have the most direct influence on utilization: user satisfaction and
organizational support. These hypotheses state that positive values of these elements
result in increased utilization, while negative effects from either element result in
decreased utilization. The path coefficients significance t test values were 0.5025 for
user satisfaction and -0.9263 for organizational support.
Figure 19: Utilization by User-satisfaction Split Response Set
00
10
20
30
40
50
60
70
40 45 50 55 60 65 70 75 80 85 90
User Satisfaction
Uti
lizat
ion
Above Mean Group Below Mean Group
Linear (Above Mean Group) Linear (Below Mean Group)
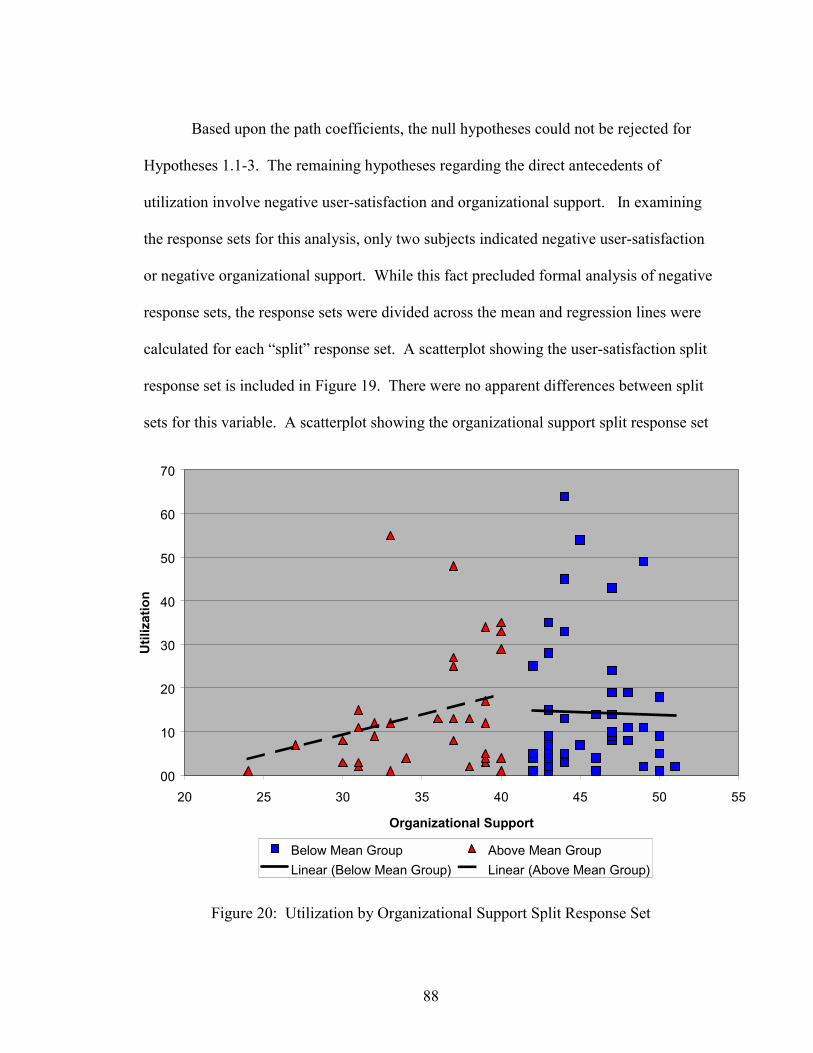
88
Based upon the path coefficients, the null hypotheses could not be rejected for
Hypotheses 1.1-3. The remaining hypotheses regarding the direct antecedents of
utilization involve negative user-satisfaction and organizational support. In examining
the response sets for this analysis, only two subjects indicated negative user-satisfaction
or negative organizational support. While this fact precluded formal analysis of negative
response sets, the response sets were divided across the mean and regression lines were
calculated for each �split� response set. A scatterplot showing the user-satisfaction split
response set is included in Figure 19. There were no apparent differences between split
sets for this variable. A scatterplot showing the organizational support split response set
Figure 20: Utilization by Organizational Support Split Response Set
00
10
20
30
40
50
60
70
20 25 30 35 40 45 50 55
Organizational Support
Uti
lizat
ion
Below Mean Group Above Mean Group
Linear (Below Mean Group) Linear (Above Mean Group)
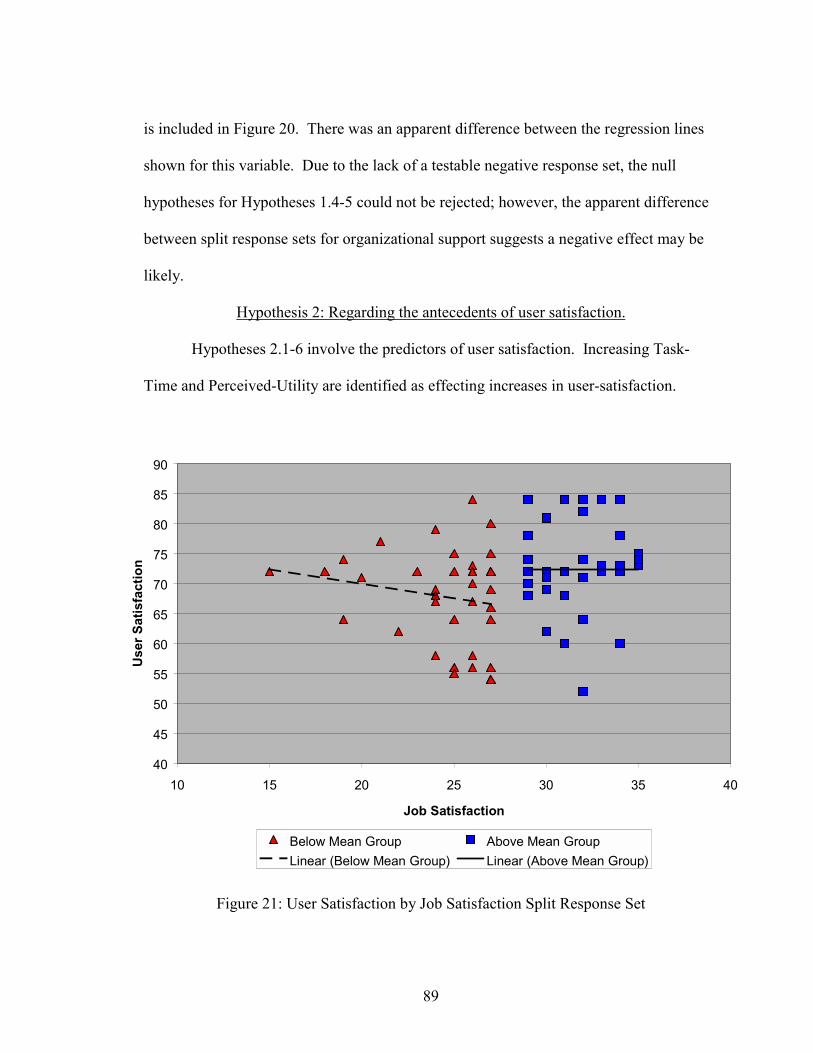
89
is included in Figure 20. There was an apparent difference between the regression lines
shown for this variable. Due to the lack of a testable negative response set, the null
hypotheses for Hypotheses 1.4-5 could not be rejected; however, the apparent difference
between split response sets for organizational support suggests a negative effect may be
likely.
Hypothesis 2: Regarding the antecedents of user satisfaction.
Hypotheses 2.1-6 involve the predictors of user satisfaction. Increasing Task-
Time and Perceived-Utility are identified as effecting increases in user-satisfaction.
Figure 21: User Satisfaction by Job Satisfaction Split Response Set
40
45
50
55
60
65
70
75
80
85
90
10 15 20 25 30 35 40
Job Satisfaction
Us
er
Sa
tis
fac
tio
n
Below Mean Group Above Mean Group
Linear (Below Mean Group) Linear (Above Mean Group)
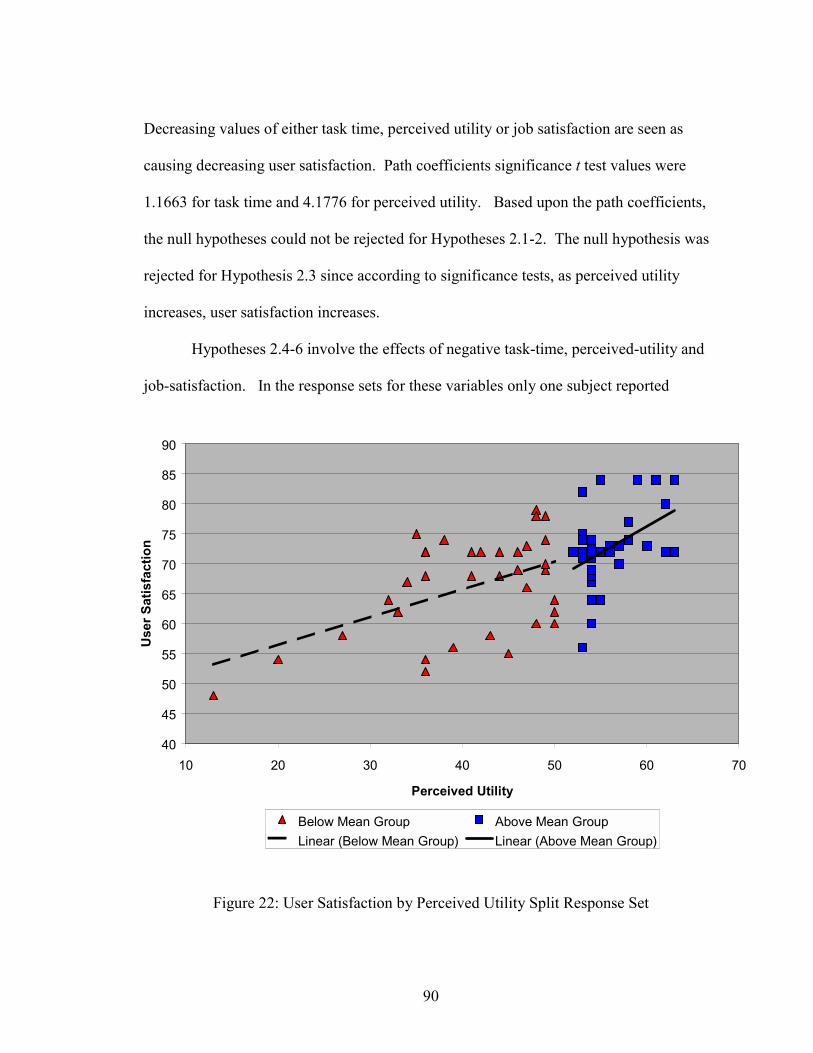
90
Decreasing values of either task time, perceived utility or job satisfaction are seen as
causing decreasing user satisfaction. Path coefficients significance t test values were
1.1663 for task time and 4.1776 for perceived utility. Based upon the path coefficients,
the null hypotheses could not be rejected for Hypotheses 2.1-2. The null hypothesis was
rejected for Hypothesis 2.3 since according to significance tests, as perceived utility
increases, user satisfaction increases.
Hypotheses 2.4-6 involve the effects of negative task-time, perceived-utility and
job-satisfaction. In the response sets for these variables only one subject reported
Figure 22: User Satisfaction by Perceived Utility Split Response Set
40
45
50
55
60
65
70
75
80
85
90
10 20 30 40 50 60 70
Perceived Utility
Us
er
Sa
tis
fac
tio
n
Below Mean Group Above Mean Group
Linear (Below Mean Group) Linear (Above Mean Group)
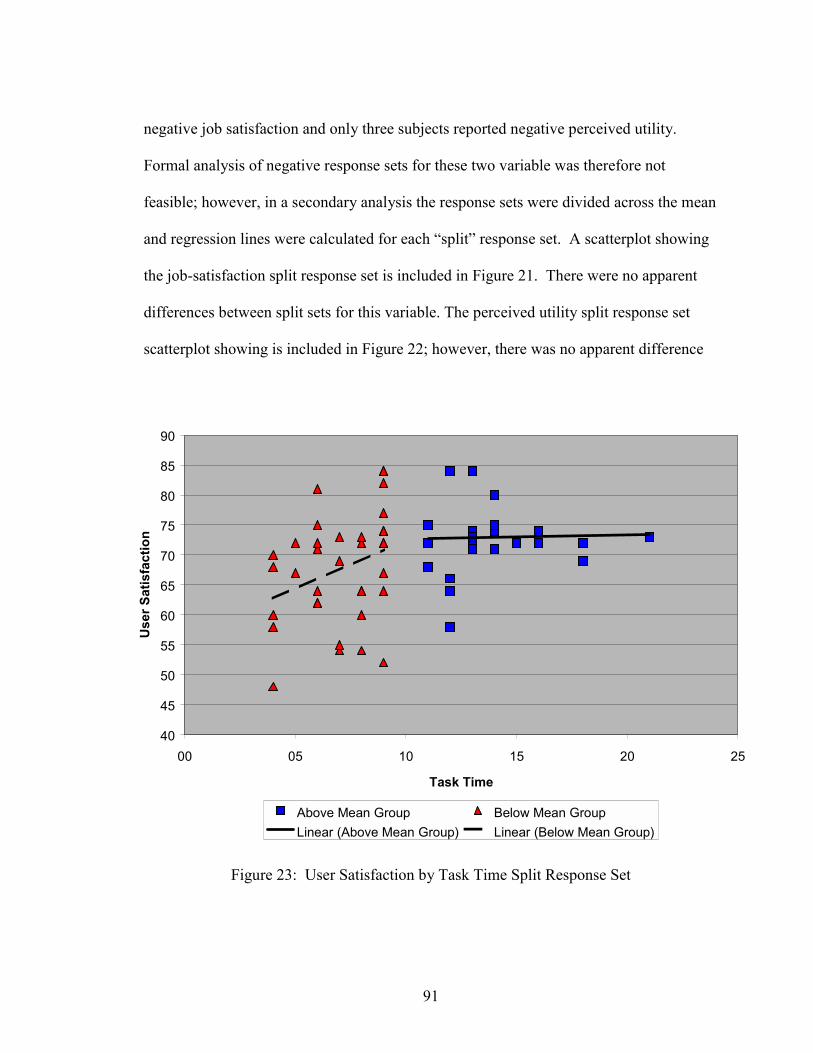
91
negative job satisfaction and only three subjects reported negative perceived utility.
Formal analysis of negative response sets for these two variable was therefore not
feasible; however, in a secondary analysis the response sets were divided across the mean
and regression lines were calculated for each �split� response set. A scatterplot showing
the job-satisfaction split response set is included in Figure 21. There were no apparent
differences between split sets for this variable. The perceived utility split response set
scatterplot showing is included in Figure 22; however, there was no apparent difference
Figure 23: User Satisfaction by Task Time Split Response Set
40
45
50
55
60
65
70
75
80
85
90
00 05 10 15 20 25
Task Time
Us
er
Sa
tis
fac
tio
n
Above Mean Group Below Mean Group
Linear (Above Mean Group) Linear (Below Mean Group)
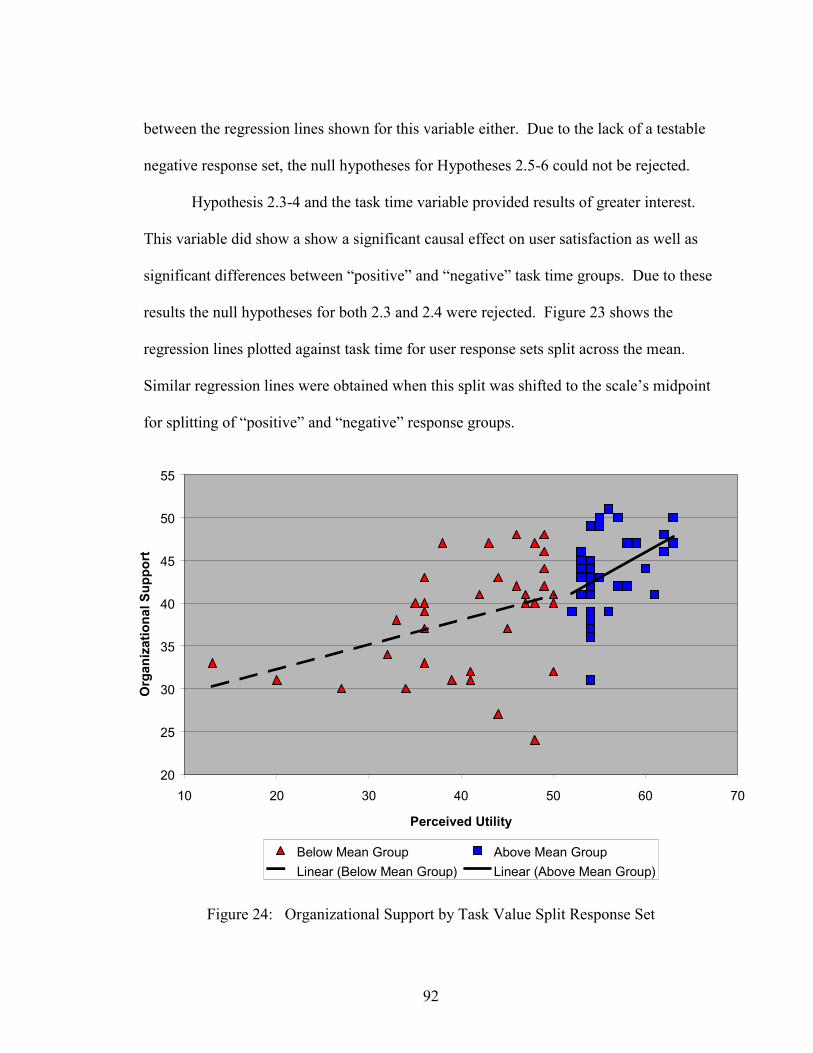
92
between the regression lines shown for this variable either. Due to the lack of a testable
negative response set, the null hypotheses for Hypotheses 2.5-6 could not be rejected.
Hypothesis 2.3-4 and the task time variable provided results of greater interest.
This variable did show a show a significant causal effect on user satisfaction as well as
significant differences between �positive� and �negative� task time groups. Due to these
results the null hypotheses for both 2.3 and 2.4 were rejected. Figure 23 shows the
regression lines plotted against task time for user response sets split across the mean.
Similar regression lines were obtained when this split was shifted to the scale�s midpoint
for splitting of �positive� and �negative� response groups.
Figure 24: Organizational Support by Task Value Split Response Set
20
25
30
35
40
45
50
55
10 20 30 40 50 60 70
Perceived Utility
Org
aniz
atio
nal
Su
pp
ort
Below Mean Group Above Mean Group
Linear (Below Mean Group) Linear (Above Mean Group)
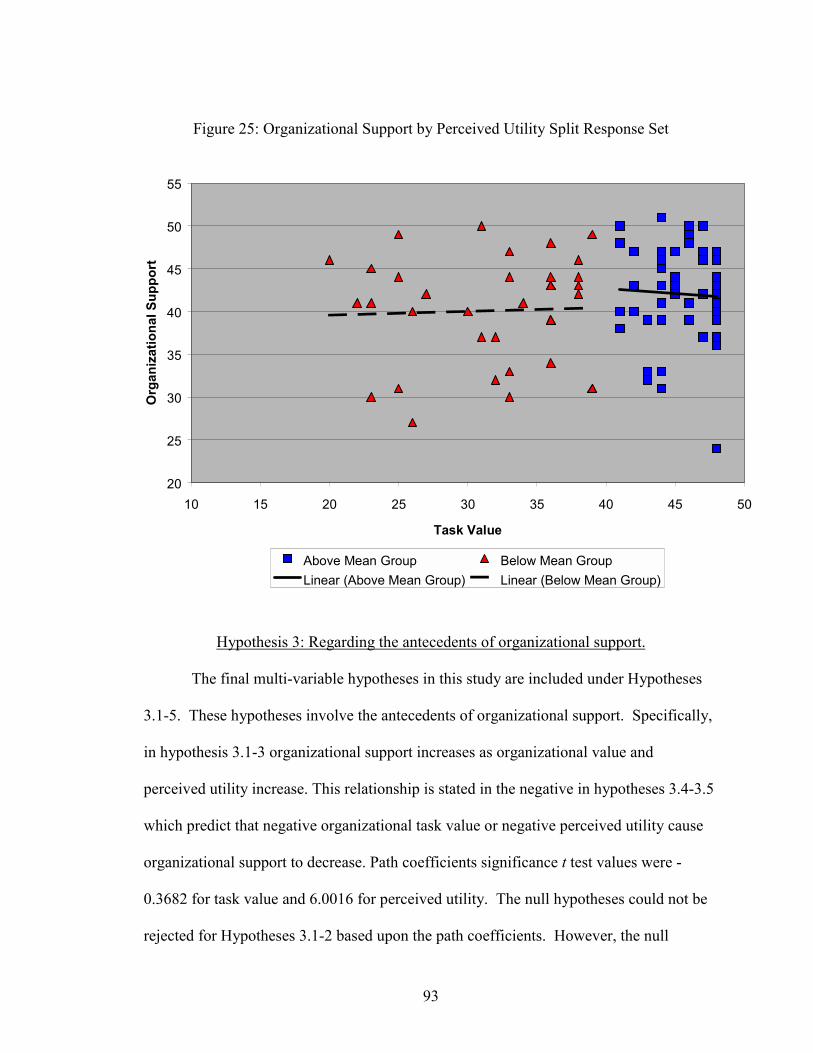
93
Figure 25: Organizational Support by Perceived Utility Split Response Set
Hypothesis 3: Regarding the antecedents of organizational support.
The final multi-variable hypotheses in this study are included under Hypotheses
3.1-5. These hypotheses involve the antecedents of organizational support. Specifically,
in hypothesis 3.1-3 organizational support increases as organizational value and
perceived utility increase. This relationship is stated in the negative in hypotheses 3.4-3.5
which predict that negative organizational task value or negative perceived utility cause
organizational support to decrease. Path coefficients significance t test values were -
0.3682 for task value and 6.0016 for perceived utility. The null hypotheses could not be
rejected for Hypotheses 3.1-2 based upon the path coefficients. However, the null
20
25
30
35
40
45
50
55
10 15 20 25 30 35 40 45 50
Task Value
Org
aniz
atio
nal
Su
pp
ort
Above Mean Group Below Mean Group
Linear (Above Mean Group) Linear (Below Mean Group)
94
hypothesis was rejected for Hypothesis 3.3 since the significance value of t=6.0016
indicated a definite increase in perceived utility as user satisfaction increases. Figure 24
shows regression lines plotted against organizational support for user response sets split
across the task value mean, while Figure 25 shows the perceived utility split response set.
Insufficient number of negative responses of were received to accurately judge the effects
of negative task value and of negative perceived utility of organizational support;
therefore, the null hypotheses for Hypotheses 3.4-5 could not be rejected.
Hypothesis 4: Regarding the antecedents of task time
Hypothesis 4 addresses the effects of increasing organizational value on task time.
Organizational value�s effect on task time dropped out in the first revised model due to
nonsignificant causal effects. As a result the null hypothesis could not be rejected in the
case of Hypothesis 4.
Hypothesis 5: Regarding self report of utilization versus actual use and
Hypothesis 6: Regarding comparison of self report across systems
A combination of audit file and survey data were gathered to address Hypothesis
5 and 6. Table 15 shows the correlations and associated probabilities between utilization
and the survey questions that were asked. For Hypotheses 5 the null hypothesis was
easily rejected. The final hypotheses predicted differences between reported utilization
and actual utilization for subjects in the staff scheduling system group and subjects in the
patient education system group. This prediction was based upon the requirements for use
of each system. Use of the scheduling system was mandated by the hospital, while use of
the education system was less required. Unfortunately the subject size of the education
system group resulted in an untestable situation for Hypothesis 6.
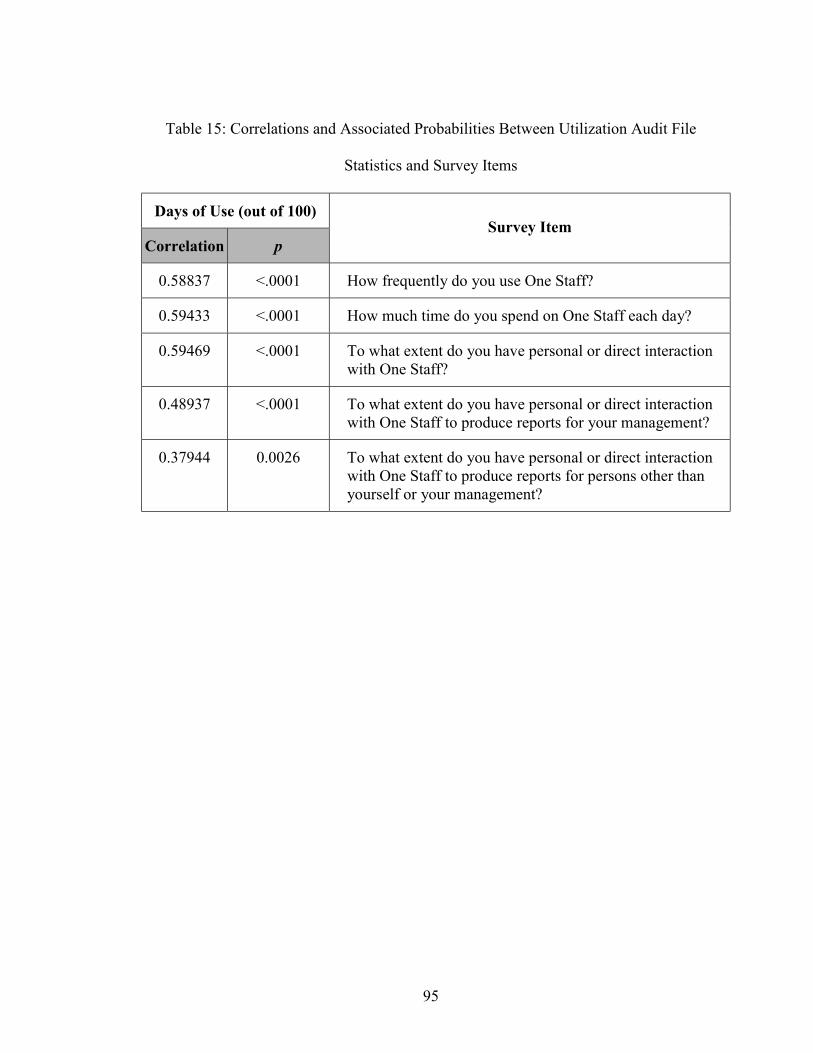
95
Table 15: Correlations and Associated Probabilities Between Utilization Audit File
Statistics and Survey Items
Days of Use (out of 100)
Correlation pSurvey Item
0.58837 <.0001 How frequently do you use One Staff?
0.59433 <.0001 How much time do you spend on One Staff each day?
0.59469 <.0001 To what extent do you have personal or direct interactionwith One Staff?
0.48937 <.0001 To what extent do you have personal or direct interactionwith One Staff to produce reports for your management?
0.37944 0.0026 To what extent do you have personal or direct interactionwith One Staff to produce reports for persons other thanyourself or your management?
96
CHAPTER 5
CONCLUSIONS AND SUMMARY
Performance of Utilization Model
The magnitude of utilization of an information system does change predictably
according to changes in primary force interactions as described in this analysis. Based
upon the findings of this study, the following conclusions were derived:
• The utilization prediction model described in this study provided a good
theoretical and quantitative fit.
• The most significant direct predictor of utilization was task-time.
• The most significant indirect predictor of utilization was perceived utility.
• User satisfaction was predicted by organizational support and perceived
utility.
• Perceived utility also predicted task time and organizational support.
• Task value predicted perceived utility.
• Self report and actual utilization were significantly correlated.
The challenge in retaining opportunities for practical application of this model
like many models is in restraining the number of measures required without impairing the
predictive ability . Often, through the use of simplified heuristics, results such as those
found in this study can be projected into easier use. Some possible heuristics generated
from this study�s conclusions include:
97
• When a system is perceived as useful in accomplishing a task that a person
normally performs, the person will use the system.
• The more time a person spends on a given task, the greater the likelihood
that the person will use an automated solution which helps with that task
when one is available.
• The more an organization supports a system and the system is seen as
useful, the greater the likelihood that employees will be satisfied with the
system.
• The more perceived value a task has, the more likely a person is to
perceive as useful an information system designed to facilitate that task
Each of these conclusions and proposed heuristics were derived from a model
which accounted for 26.7 percent of the variance in utilization. This percentage exceeds
that accounted for by most studies. And although the sample size in this study bordered
on being minimally acceptable, the strong theoretical foundations of the model and the
amount of variance in the response sets allowed for an effective analysis.
98
Considerations for Future Research
Continued efforts to improve upon existing utilization prediction models are
inevitable since abundant resources are necessary for the implementation of any
information technology. The current study has contributed a model which builds upon
past theory while proposing a practical approach to measurement of predictive variables.
Future research testing this model and its component interactions could assess the
robustness of the model as well as providing greater insight into the relative significance
of each causal factor. Longitudinal studies examining the performance of the utilization
prediction model across the information system life cycle could also offer further
understanding of this model. Future research involving larger and diverse subject pools
could also add to generalizability of the model. Further structural development of the
model could involve the following foci:
• Incorporation of feedback mechanisms within the model developed in this
study would likely provide a more satisfactory model fit were a large
enough sample size available.
• Replacement of manifest variables, particularly the user satisfaction and
organizational support variables, with latent variables measuring the same
constructs could contribute added strength to the model�s predictive
power.
Any further research examining the model within this study will contribute to the
understanding of the ability of the interaction approach to develop useful theory. In the
current study, the examination of pairs of variables formed the basis for the utilization
prediction model. This type of interaction approach can also be seen in the underlying
99
mechanisms of principal components analysis as well as other factor analytic methods.
The study of variable interactions, as opposed to the study of isolated variables, provides
for the inclusion of fewer constructs within a model as well as reflecting more accurately
the operation of these variables in the �real world.� As is evident from the overview of
primary forces in this study, the confluence of increasing numbers of variable interactions
offers insight into many predictive model challenges. Future research which examines
this utilization model can further demonstrate the robustness of the approach and the
utilization model across divergent groups of users, organizations, systems and tasks.

100
APPENDIX A
USER SURVEYS
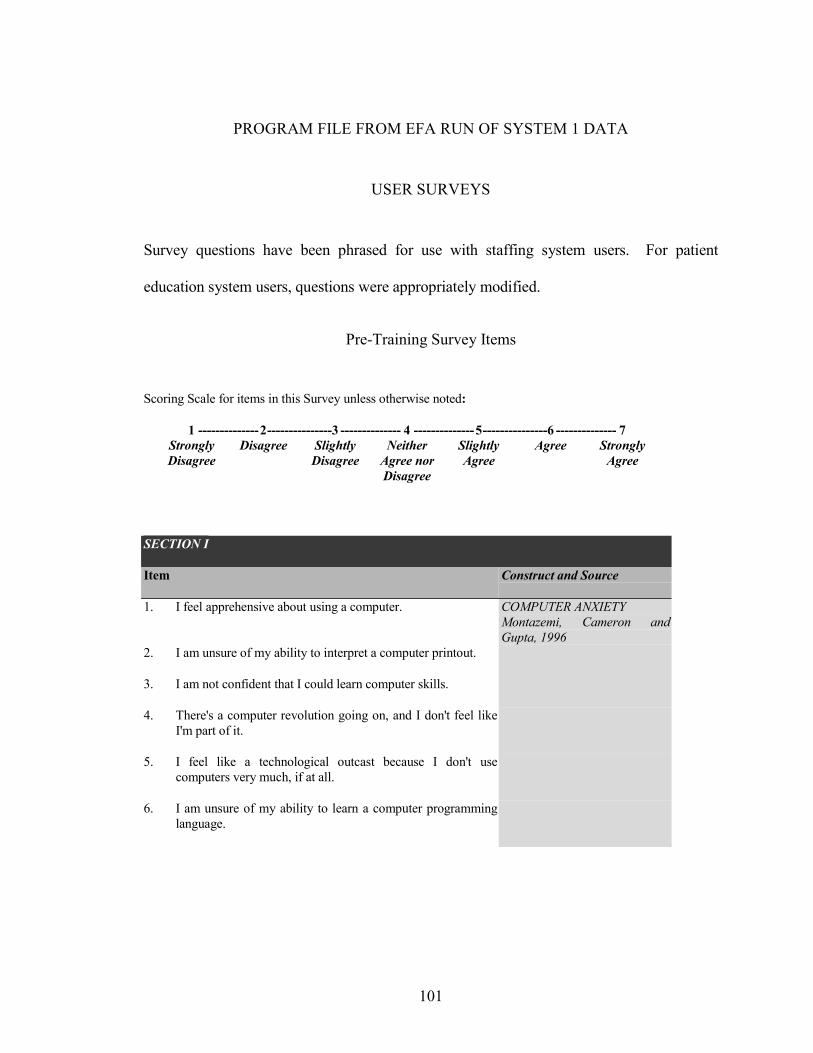
101
PROGRAM FILE FROM EFA RUN OF SYSTEM 1 DATA
USER SURVEYS
Survey questions have been phrased for use with staffing system users. For patient
education system users, questions were appropriately modified.
Pre-Training Survey Items
Scoring Scale for items in this Survey unless otherwise noted:
1 --------------2---------------3 -------------- 4 --------------5---------------6 -------------- 7Strongly Disagree Slightly Neither Slightly Agree StronglyDisagree Disagree Agree nor Agree Agree
Disagree
SECTION I
Item Construct and Source
1. I feel apprehensive about using a computer. COMPUTER ANXIETYMontazemi, Cameron andGupta, 1996
2. I am unsure of my ability to interpret a computer printout.
3. I am not confident that I could learn computer skills.
4. There's a computer revolution going on, and I don't feel likeI'm part of it.
5. I feel like a technological outcast because I don't usecomputers very much, if at all.
6. I am unsure of my ability to learn a computer programminglanguage.
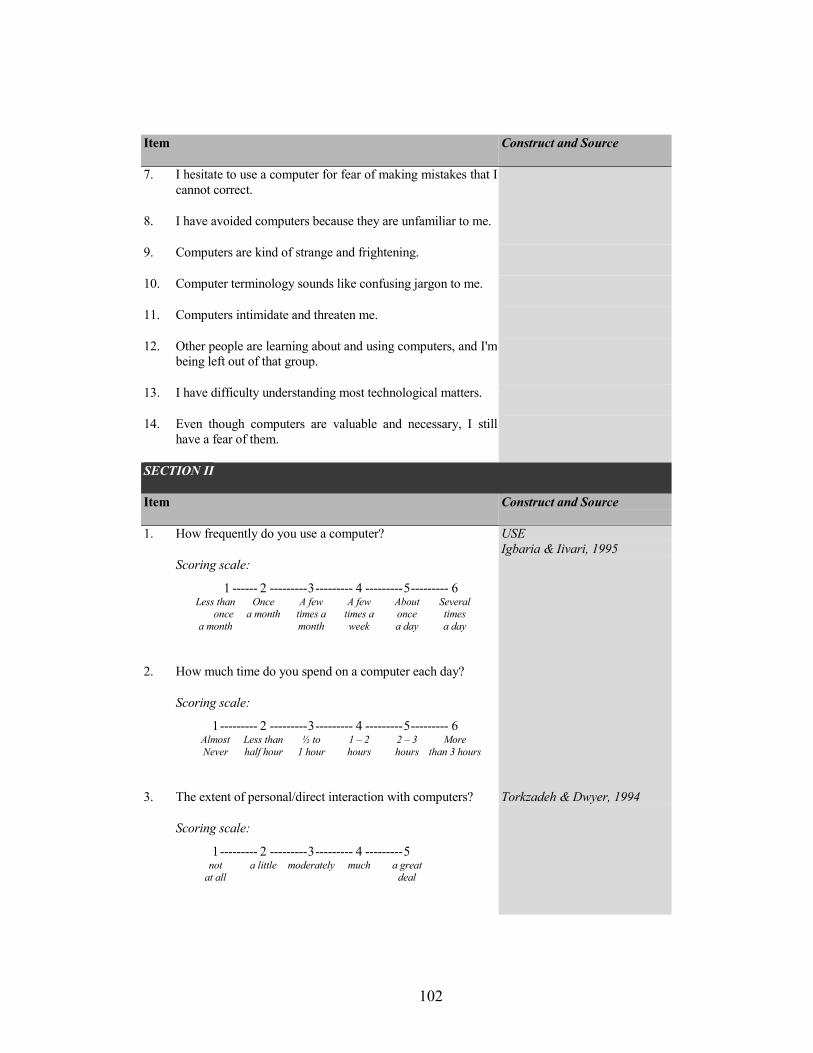
102
Item Construct and Source
7. I hesitate to use a computer for fear of making mistakes that Icannot correct.
8. I have avoided computers because they are unfamiliar to me.
9. Computers are kind of strange and frightening.
10. Computer terminology sounds like confusing jargon to me.
11. Computers intimidate and threaten me.
12. Other people are learning about and using computers, and I'mbeing left out of that group.
13. I have difficulty understanding most technological matters.
14. Even though computers are valuable and necessary, I stillhave a fear of them.
SECTION II
Item Construct and Source
1. How frequently do you use a computer?
Scoring scale:
1 ------ 2 ---------3--------- 4 ---------5--------- 6Less than Once A few A few About Several
once a month times a times a once timesa month month week a day a day
2. How much time do you spend on a computer each day?
Scoring scale:
1--------- 2 ---------3--------- 4 ---------5--------- 6Almost Less than ½ to 1 � 2 2 � 3 MoreNever half hour 1 hour hours hours than 3 hours
USEIgbaria & Iivari, 1995
3. The extent of personal/direct interaction with computers?
Scoring scale:
1--------- 2 ---------3--------- 4 ---------5not a little moderately much a great
at all deal
Torkzadeh & Dwyer, 1994
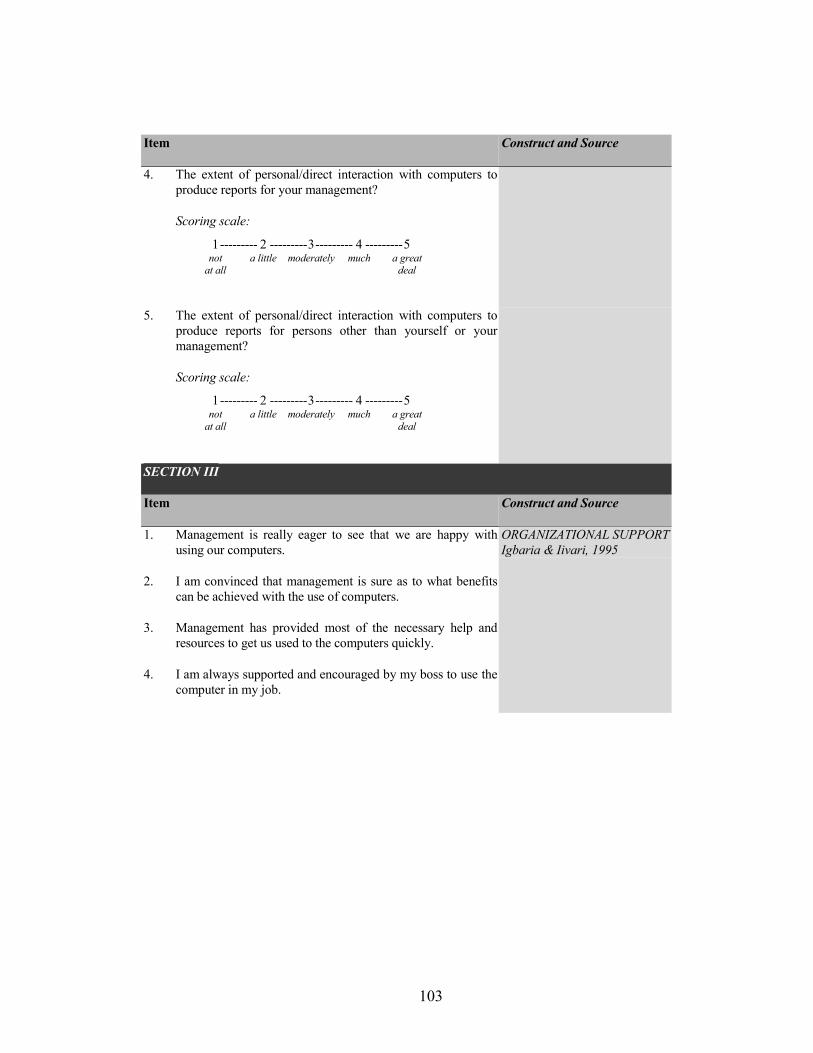
103
Item Construct and Source
4. The extent of personal/direct interaction with computers toproduce reports for your management?
Scoring scale:
1--------- 2 ---------3--------- 4 ---------5not a little moderately much a great
at all deal
5. The extent of personal/direct interaction with computers toproduce reports for persons other than yourself or yourmanagement?
Scoring scale:
1--------- 2 ---------3--------- 4 ---------5not a little moderately much a great
at all deal
SECTION III
Item Construct and Source
1. Management is really eager to see that we are happy withusing our computers.
2. I am convinced that management is sure as to what benefitscan be achieved with the use of computers.
3. Management has provided most of the necessary help andresources to get us used to the computers quickly.
4. I am always supported and encouraged by my boss to use thecomputer in my job.
ORGANIZATIONAL SUPPORTIgbaria & Iivari, 1995
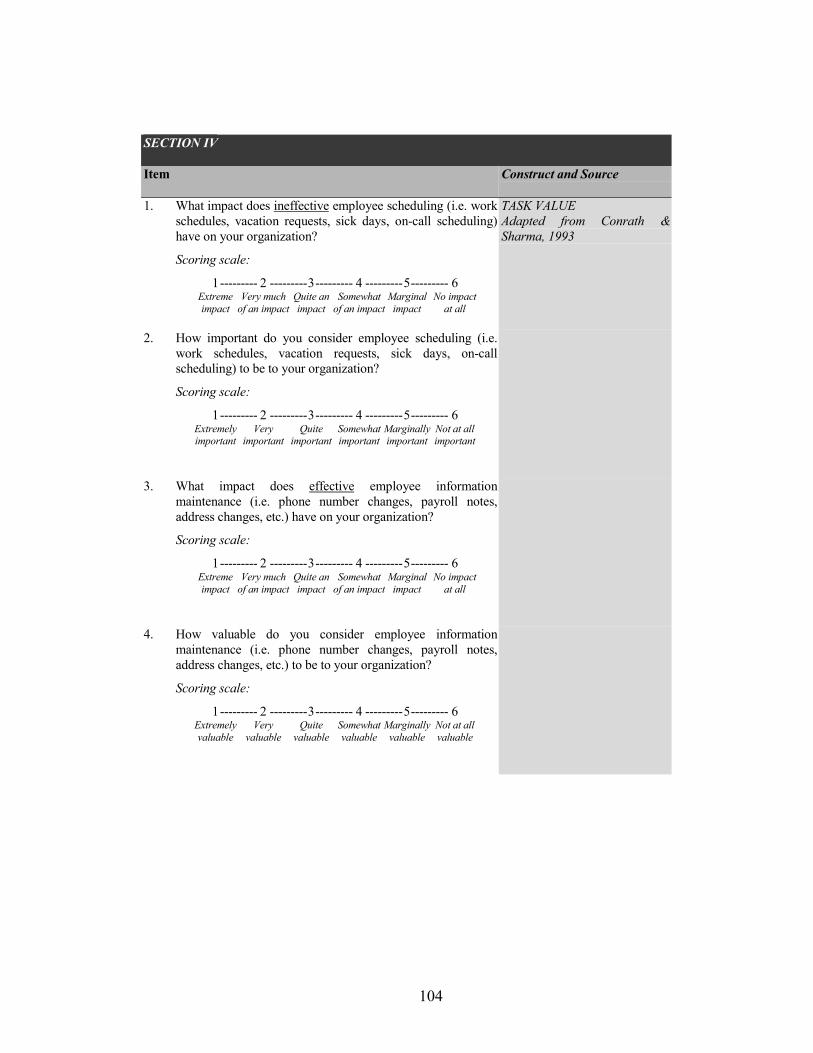
104
SECTION IV
Item Construct and Source
1. What impact does ineffective employee scheduling (i.e. workschedules, vacation requests, sick days, on-call scheduling)have on your organization?
Scoring scale:
1--------- 2 ---------3--------- 4 ---------5--------- 6Extreme Very much Quite an Somewhat Marginal No impactimpact of an impact impact of an impact impact at all
TASK VALUEAdapted from Conrath &Sharma, 1993
2. How important do you consider employee scheduling (i.e.work schedules, vacation requests, sick days, on-callscheduling) to be to your organization?
Scoring scale:
1--------- 2 ---------3--------- 4 ---------5--------- 6Extremely Very Quite Somewhat Marginally Not at allimportant important important important important important
3. What impact does effective employee informationmaintenance (i.e. phone number changes, payroll notes,address changes, etc.) have on your organization?
Scoring scale:
1--------- 2 ---------3--------- 4 ---------5--------- 6Extreme Very much Quite an Somewhat Marginal No impactimpact of an impact impact of an impact impact at all
4. How valuable do you consider employee informationmaintenance (i.e. phone number changes, payroll notes,address changes, etc.) to be to your organization?
Scoring scale:
1--------- 2 ---------3--------- 4 ---------5--------- 6Extremely Very Quite Somewhat Marginally Not at allvaluable valuable valuable valuable valuable valuable
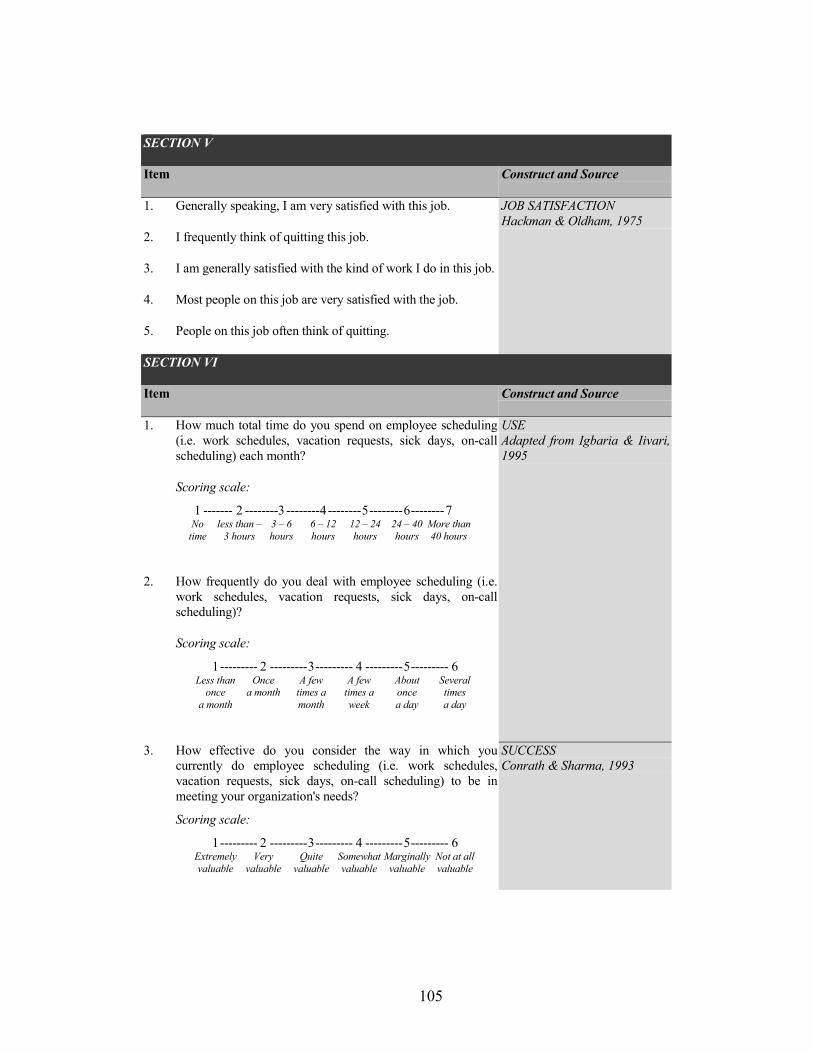
105
SECTION V
Item Construct and Source
1. Generally speaking, I am very satisfied with this job.
2. I frequently think of quitting this job.
3. I am generally satisfied with the kind of work I do in this job.
4. Most people on this job are very satisfied with the job.
5. People on this job often think of quitting.
JOB SATISFACTIONHackman & Oldham, 1975
SECTION VI
Item Construct and Source
1. How much total time do you spend on employee scheduling(i.e. work schedules, vacation requests, sick days, on-callscheduling) each month?
Scoring scale:
1 ------- 2 --------3 --------4--------5--------6--------7No less than � 3 � 6 6 � 12 12 � 24 24 � 40 More than
time 3 hours hours hours hours hours 40 hours
2. How frequently do you deal with employee scheduling (i.e.work schedules, vacation requests, sick days, on-callscheduling)?
Scoring scale:
1--------- 2 ---------3--------- 4 ---------5--------- 6Less than Once A few A few About Several
once a month times a times a once timesa month month week a day a day
USEAdapted from Igbaria & Iivari,1995
3. How effective do you consider the way in which youcurrently do employee scheduling (i.e. work schedules,vacation requests, sick days, on-call scheduling) to be inmeeting your organization's needs?
Scoring scale:
1--------- 2 ---------3--------- 4 ---------5--------- 6Extremely Very Quite Somewhat Marginally Not at allvaluable valuable valuable valuable valuable valuable
SUCCESSConrath & Sharma, 1993
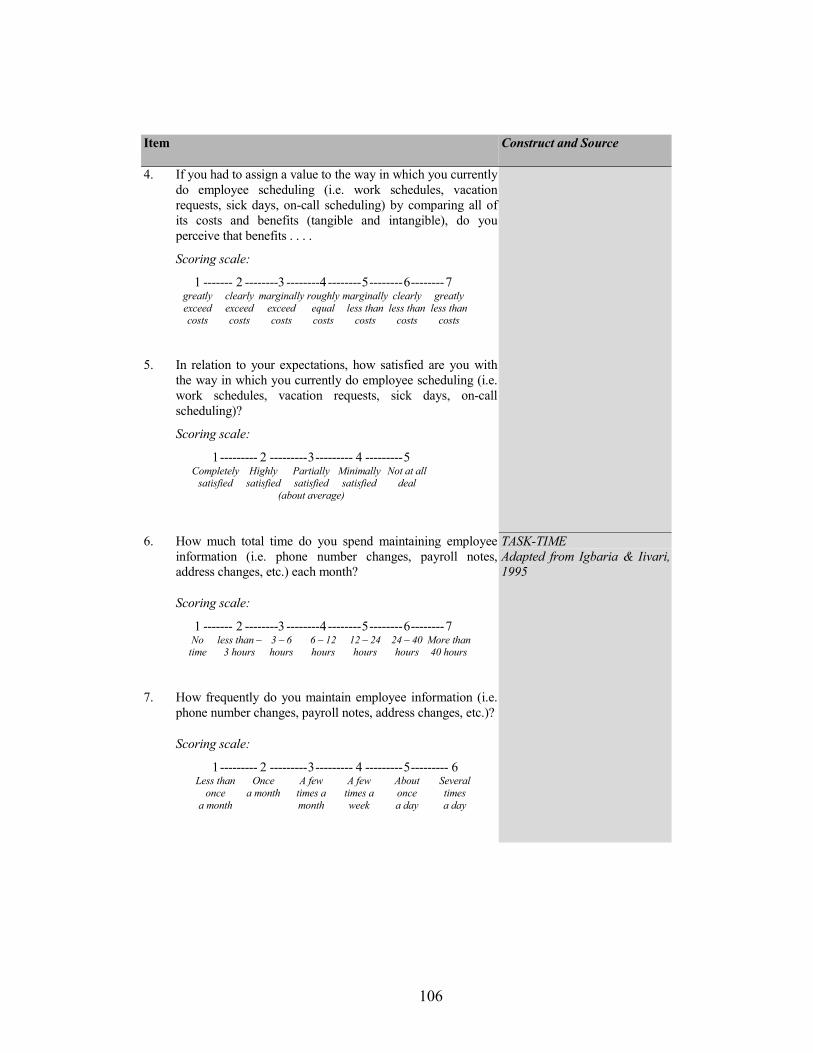
106
Item Construct and Source
4. If you had to assign a value to the way in which you currentlydo employee scheduling (i.e. work schedules, vacationrequests, sick days, on-call scheduling) by comparing all ofits costs and benefits (tangible and intangible), do youperceive that benefits . . . .
Scoring scale:
1 ------- 2 --------3 --------4--------5--------6--------7greatly clearly marginally roughly marginally clearly greatlyexceed exceed exceed equal less than less than less thancosts costs costs costs costs costs costs
5. In relation to your expectations, how satisfied are you withthe way in which you currently do employee scheduling (i.e.work schedules, vacation requests, sick days, on-callscheduling)?
Scoring scale:
1--------- 2 ---------3--------- 4 ---------5Completely Highly Partially Minimally Not at all
satisfied satisfied satisfied satisfied deal(about average)
6. How much total time do you spend maintaining employeeinformation (i.e. phone number changes, payroll notes,address changes, etc.) each month?
Scoring scale:
1 ------- 2 --------3 --------4--------5--------6--------7No less than � 3 � 6 6 � 12 12 � 24 24 � 40 More than
time 3 hours hours hours hours hours 40 hours
7. How frequently do you maintain employee information (i.e.phone number changes, payroll notes, address changes, etc.)?
Scoring scale:
1--------- 2 ---------3--------- 4 ---------5--------- 6Less than Once A few A few About Several
once a month times a times a once timesa month month week a day a day
TASK-TIMEAdapted from Igbaria & Iivari,1995
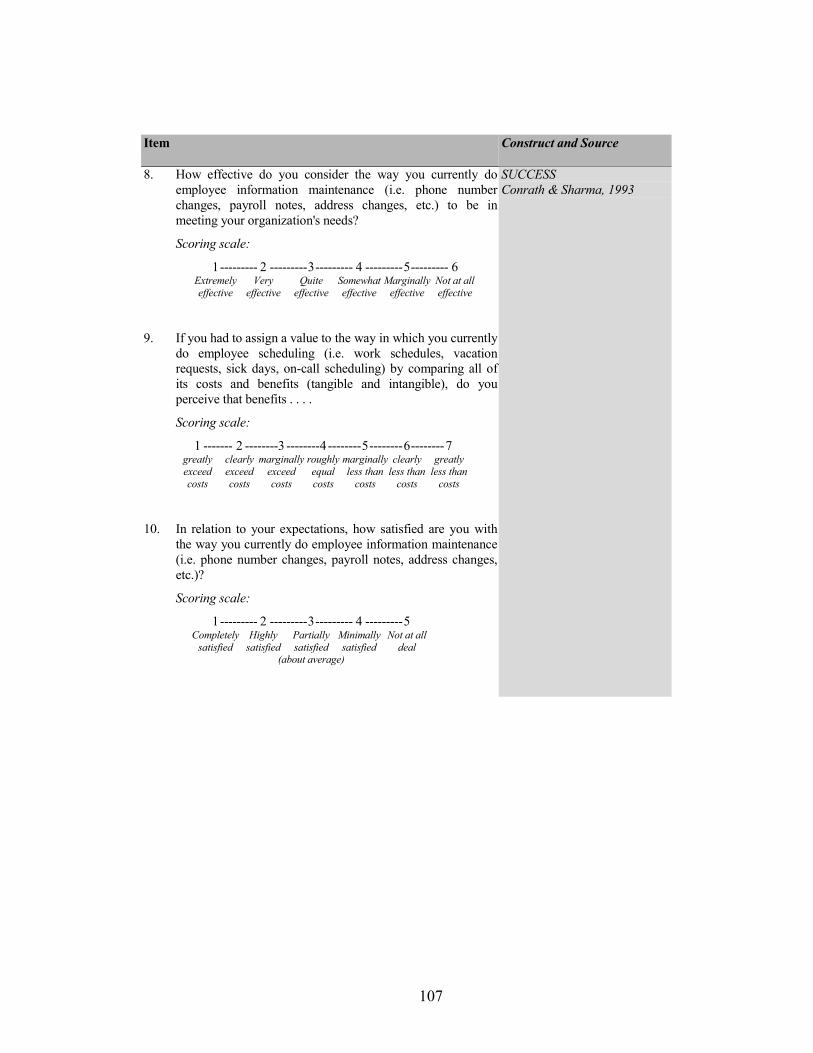
107
Item Construct and Source
8. How effective do you consider the way you currently doemployee information maintenance (i.e. phone numberchanges, payroll notes, address changes, etc.) to be inmeeting your organization's needs?
Scoring scale:
1--------- 2 ---------3--------- 4 ---------5--------- 6Extremely Very Quite Somewhat Marginally Not at alleffective effective effective effective effective effective
9. If you had to assign a value to the way in which you currentlydo employee scheduling (i.e. work schedules, vacationrequests, sick days, on-call scheduling) by comparing all ofits costs and benefits (tangible and intangible), do youperceive that benefits . . . .
Scoring scale:
1 ------- 2 --------3 --------4--------5--------6--------7greatly clearly marginally roughly marginally clearly greatlyexceed exceed exceed equal less than less than less thancosts costs costs costs costs costs costs
10. In relation to your expectations, how satisfied are you withthe way you currently do employee information maintenance(i.e. phone number changes, payroll notes, address changes,etc.)?
Scoring scale:
1--------- 2 ---------3--------- 4 ---------5Completely Highly Partially Minimally Not at all
satisfied satisfied satisfied satisfied deal(about average)
SUCCESSConrath & Sharma, 1993

108
Item Construct and Source
11. What impact does effective employee scheduling (i.e. workschedules, vacation requests, sick days, on-call scheduling)have on your organization?
Scoring scale:
1--------- 2 ---------3--------- 4 ---------5--------- 6Extreme Very much Quite an Somewhat Marginal No impactimpact of an impact impact of an impact impact at all
TASK VALUEAdapted from Conrath &Sharma, 1993
12. How valuable do you consider employee scheduling (i.e.work schedules, vacation requests, sick days, on-callscheduling) to be to your organization?
Scoring scale:
1--------- 2 ---------3--------- 4 ---------5--------- 6Extremely Very Quite Somewhat Marginally Not at allvaluable valuable valuable valuable valuable valuable
13. What impact does ineffective employee informationmaintenance (i.e. phone number changes, payroll notes,address changes, etc.) have on your organization?
Scoring scale:
1--------- 2 ---------3--------- 4 ---------5--------- 6Extreme Very much Quite an Somewhat Marginal No impactimpact of an impact impact of an impact impact at all
14. How important do you consider employee informationmaintenance (i.e. phone number changes, payroll notes,address changes, etc.) to be to your organization?
Scoring scale:
1--------- 2 ---------3--------- 4 ---------5--------- 6Extremely Very Quite Somewhat Marginally Not at allimportant important important important important important
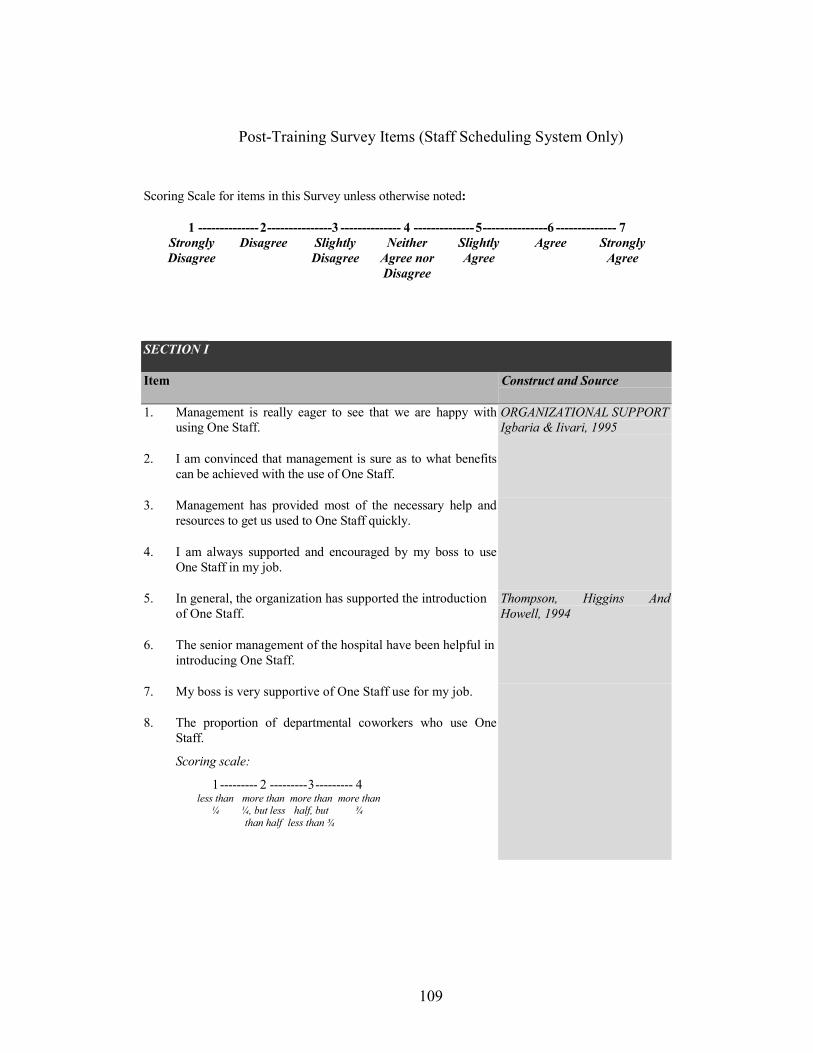
109
Post-Training Survey Items (Staff Scheduling System Only)
Scoring Scale for items in this Survey unless otherwise noted:
1 --------------2---------------3 -------------- 4 --------------5---------------6 -------------- 7Strongly Disagree Slightly Neither Slightly Agree StronglyDisagree Disagree Agree nor Agree Agree
Disagree
SECTION I
Item Construct and Source
1. Management is really eager to see that we are happy withusing One Staff.
2. I am convinced that management is sure as to what benefitscan be achieved with the use of One Staff.
ORGANIZATIONAL SUPPORTIgbaria & Iivari, 1995
3. Management has provided most of the necessary help andresources to get us used to One Staff quickly.
4. I am always supported and encouraged by my boss to useOne Staff in my job.
5. In general, the organization has supported the introductionof One Staff.
6. The senior management of the hospital have been helpful inintroducing One Staff.
Thompson, Higgins AndHowell, 1994
7. My boss is very supportive of One Staff use for my job.
8. The proportion of departmental coworkers who use OneStaff.
Scoring scale:
1--------- 2 ---------3--------- 4less than more than more than more than
¼ ¼, but less half, but ¾than half less than ¾
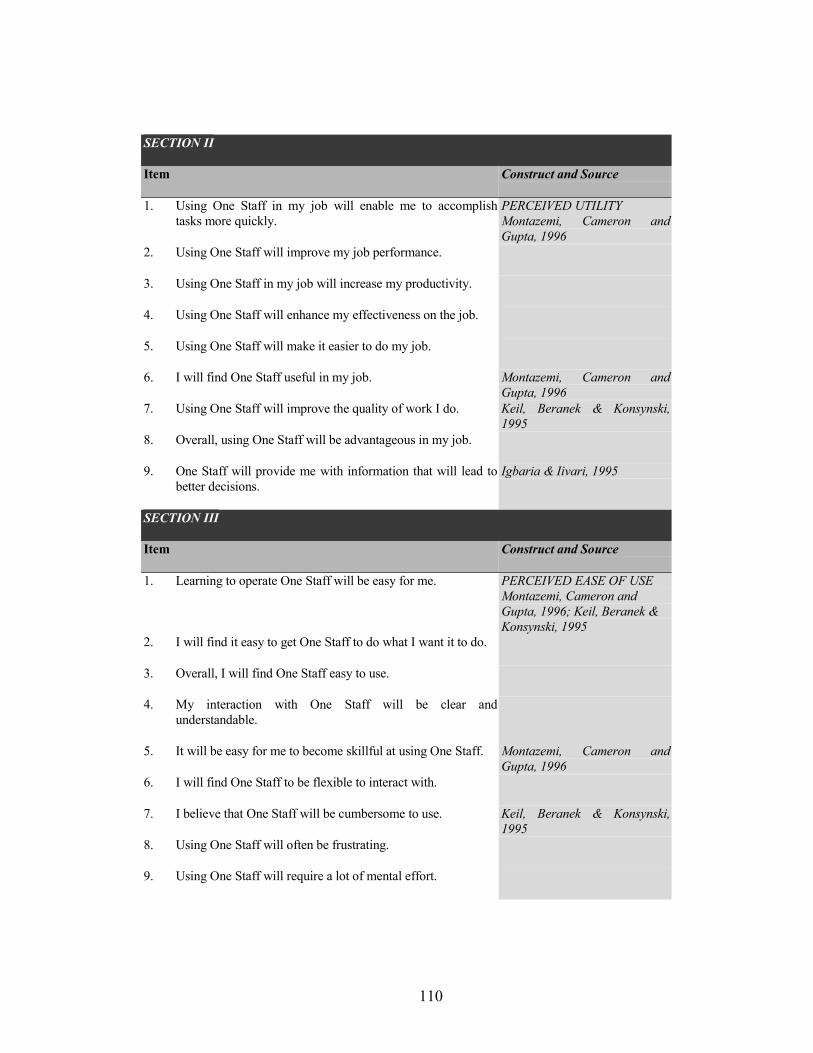
110
SECTION II
Item Construct and Source
1. Using One Staff in my job will enable me to accomplishtasks more quickly.
PERCEIVED UTILITYMontazemi, Cameron andGupta, 1996
2. Using One Staff will improve my job performance.
3. Using One Staff in my job will increase my productivity.
4. Using One Staff will enhance my effectiveness on the job.
5. Using One Staff will make it easier to do my job.
6. I will find One Staff useful in my job. Montazemi, Cameron andGupta, 1996
7. Using One Staff will improve the quality of work I do. Keil, Beranek & Konsynski,1995
8. Overall, using One Staff will be advantageous in my job.
9. One Staff will provide me with information that will lead tobetter decisions.
Igbaria & Iivari, 1995
SECTION III
Item Construct and Source
1. Learning to operate One Staff will be easy for me. PERCEIVED EASE OF USEMontazemi, Cameron andGupta, 1996; Keil, Beranek &Konsynski, 1995
2. I will find it easy to get One Staff to do what I want it to do.
3. Overall, I will find One Staff easy to use.
4. My interaction with One Staff will be clear andunderstandable.
5. It will be easy for me to become skillful at using One Staff. Montazemi, Cameron andGupta, 1996
6. I will find One Staff to be flexible to interact with.
7. I believe that One Staff will be cumbersome to use. Keil, Beranek & Konsynski,1995
8. Using One Staff will often be frustrating.
9. Using One Staff will require a lot of mental effort.
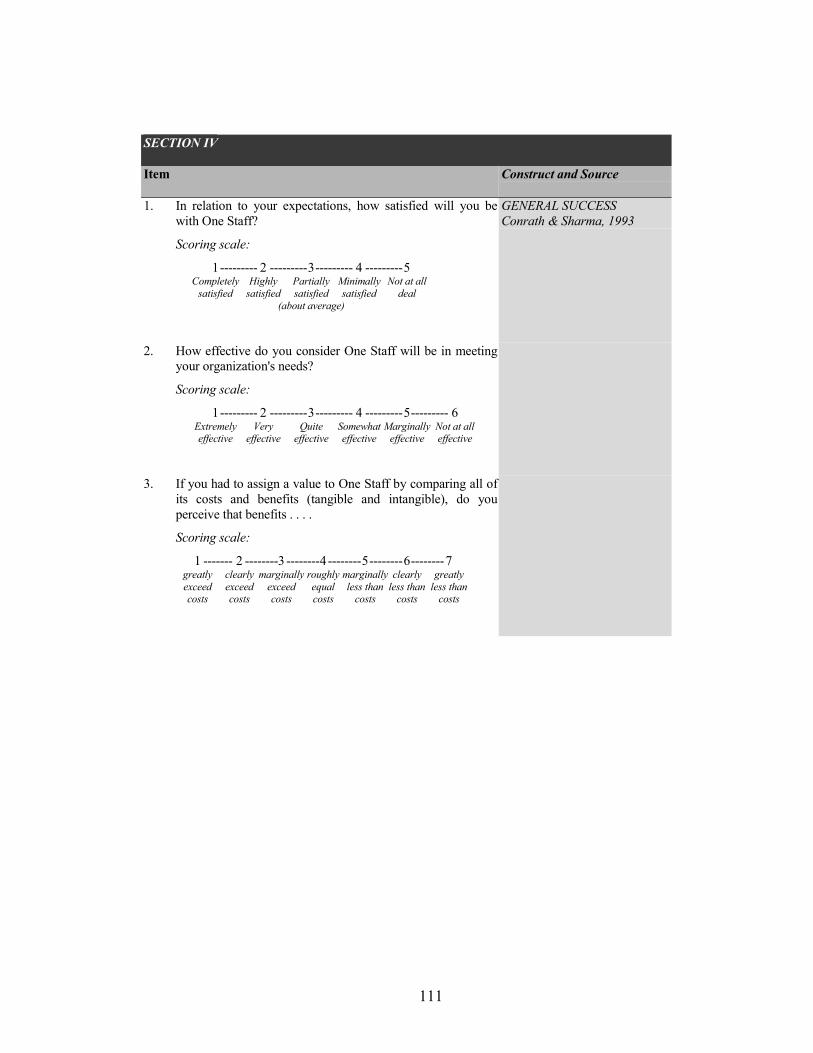
111
SECTION IV
Item Construct and Source
1. In relation to your expectations, how satisfied will you bewith One Staff?
Scoring scale:
1--------- 2 ---------3--------- 4 ---------5Completely Highly Partially Minimally Not at all
satisfied satisfied satisfied satisfied deal(about average)
GENERAL SUCCESSConrath & Sharma, 1993
2. How effective do you consider One Staff will be in meetingyour organization's needs?
Scoring scale:
1--------- 2 ---------3--------- 4 ---------5--------- 6Extremely Very Quite Somewhat Marginally Not at alleffective effective effective effective effective effective
3. If you had to assign a value to One Staff by comparing all ofits costs and benefits (tangible and intangible), do youperceive that benefits . . . .
Scoring scale:
1 ------- 2 --------3 --------4--------5--------6--------7greatly clearly marginally roughly marginally clearly greatlyexceed exceed exceed equal less than less than less thancosts costs costs costs costs costs costs
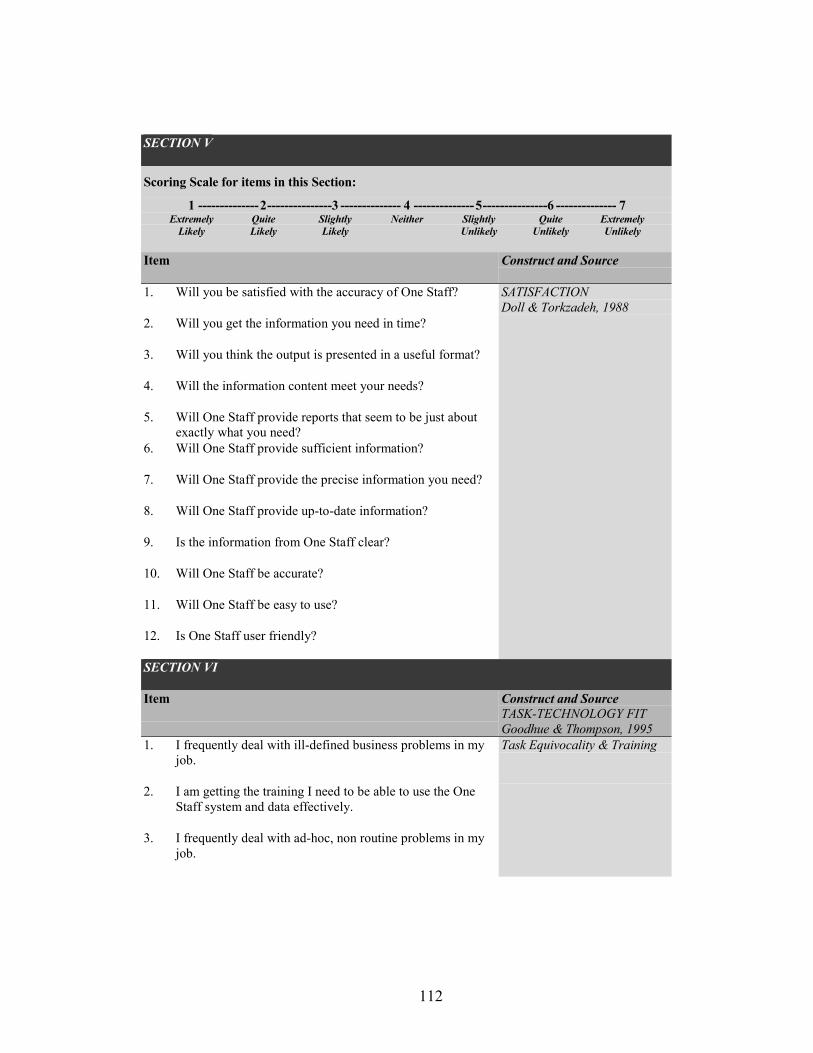
112
SECTION V
Scoring Scale for items in this Section:
1 --------------2---------------3 -------------- 4 --------------5---------------6 -------------- 7Extremely Quite Slightly Neither Slightly Quite Extremely
Likely Likely Likely Unlikely Unlikely Unlikely
Item Construct and Source
1. Will you be satisfied with the accuracy of One Staff?
2. Will you get the information you need in time?
3. Will you think the output is presented in a useful format?
4. Will the information content meet your needs?
5. Will One Staff provide reports that seem to be just aboutexactly what you need?
6. Will One Staff provide sufficient information?
7. Will One Staff provide the precise information you need?
8. Will One Staff provide up-to-date information?
9. Is the information from One Staff clear?
10. Will One Staff be accurate?
11. Will One Staff be easy to use?
12. Is One Staff user friendly?
SATISFACTIONDoll & Torkzadeh, 1988
SECTION VI
Item Construct and SourceTASK-TECHNOLOGY FITGoodhue & Thompson, 1995
1. I frequently deal with ill-defined business problems in myjob.
Task Equivocality & Training
2. I am getting the training I need to be able to use the OneStaff system and data effectively.
3. I frequently deal with ad-hoc, non routine problems in myjob.
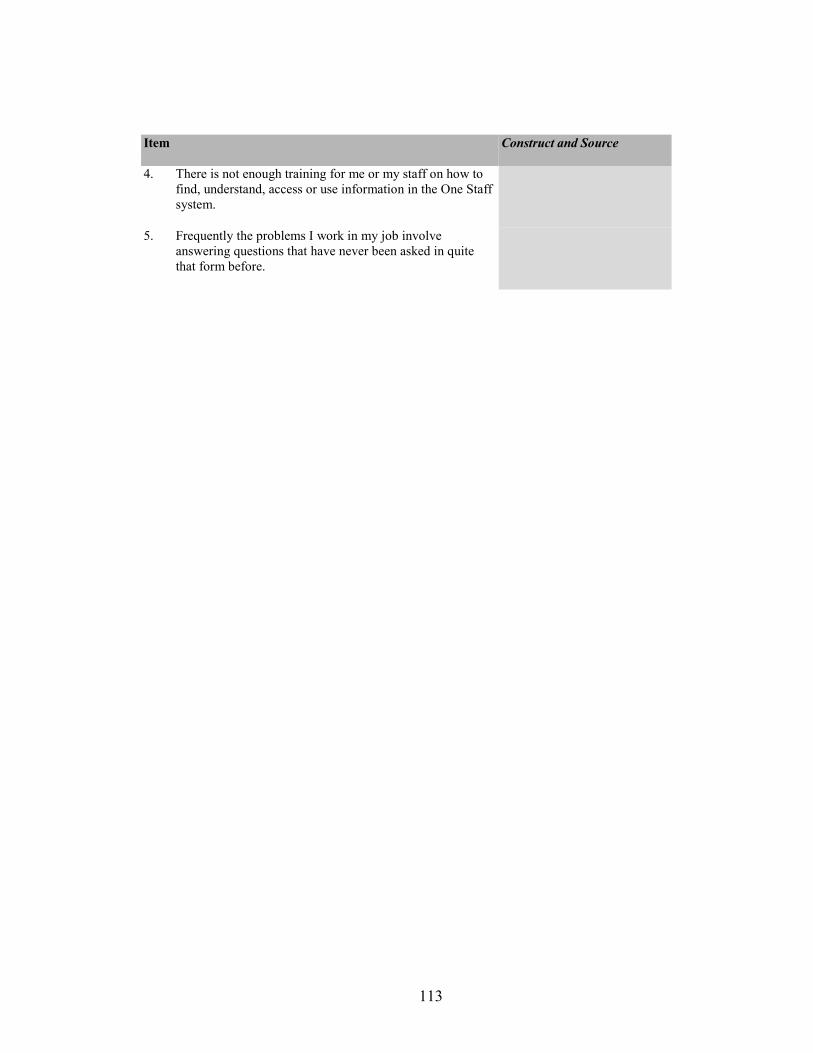
113
Item Construct and Source
4. There is not enough training for me or my staff on how tofind, understand, access or use information in the One Staffsystem.
5. Frequently the problems I work in my job involveanswering questions that have never been asked in quitethat form before.
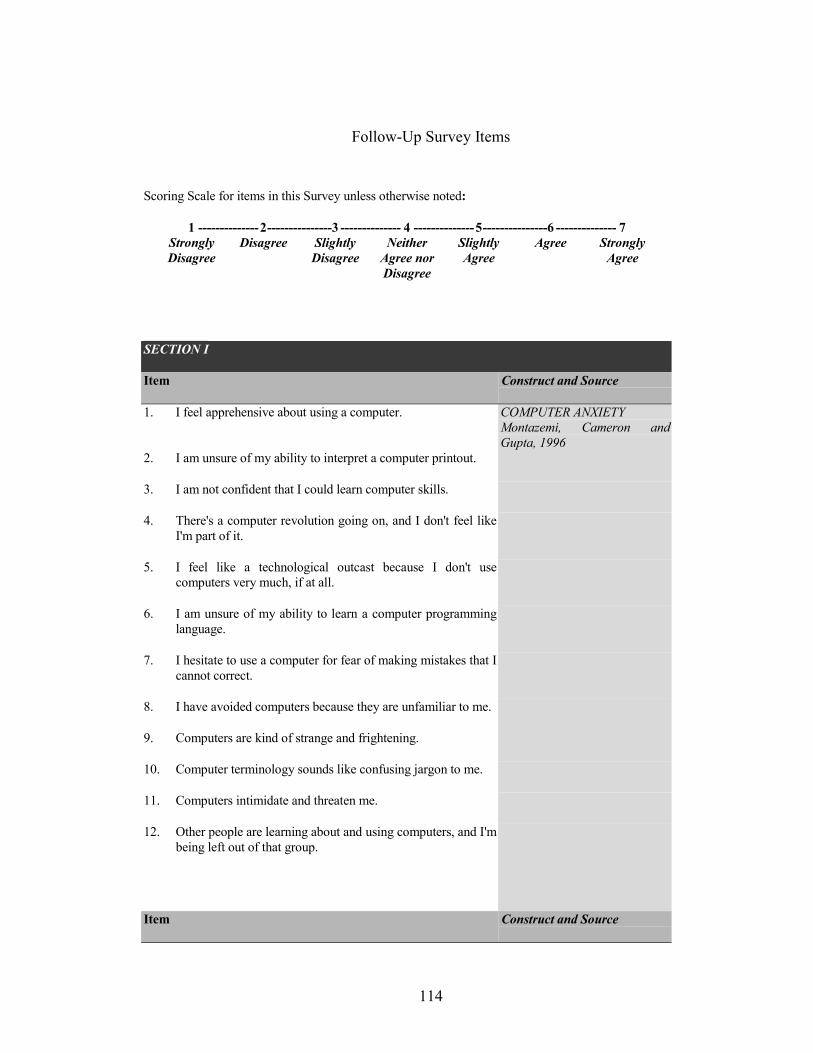
114
Follow-Up Survey Items
Scoring Scale for items in this Survey unless otherwise noted:
1 --------------2---------------3 -------------- 4 --------------5---------------6 -------------- 7Strongly Disagree Slightly Neither Slightly Agree StronglyDisagree Disagree Agree nor Agree Agree
Disagree
SECTION I
Item Construct and Source
1. I feel apprehensive about using a computer. COMPUTER ANXIETYMontazemi, Cameron andGupta, 1996
2. I am unsure of my ability to interpret a computer printout.
3. I am not confident that I could learn computer skills.
4. There's a computer revolution going on, and I don't feel likeI'm part of it.
5. I feel like a technological outcast because I don't usecomputers very much, if at all.
6. I am unsure of my ability to learn a computer programminglanguage.
7. I hesitate to use a computer for fear of making mistakes that Icannot correct.
8. I have avoided computers because they are unfamiliar to me.
9. Computers are kind of strange and frightening.
10. Computer terminology sounds like confusing jargon to me.
11. Computers intimidate and threaten me.
12. Other people are learning about and using computers, and I'mbeing left out of that group.
Item Construct and Source
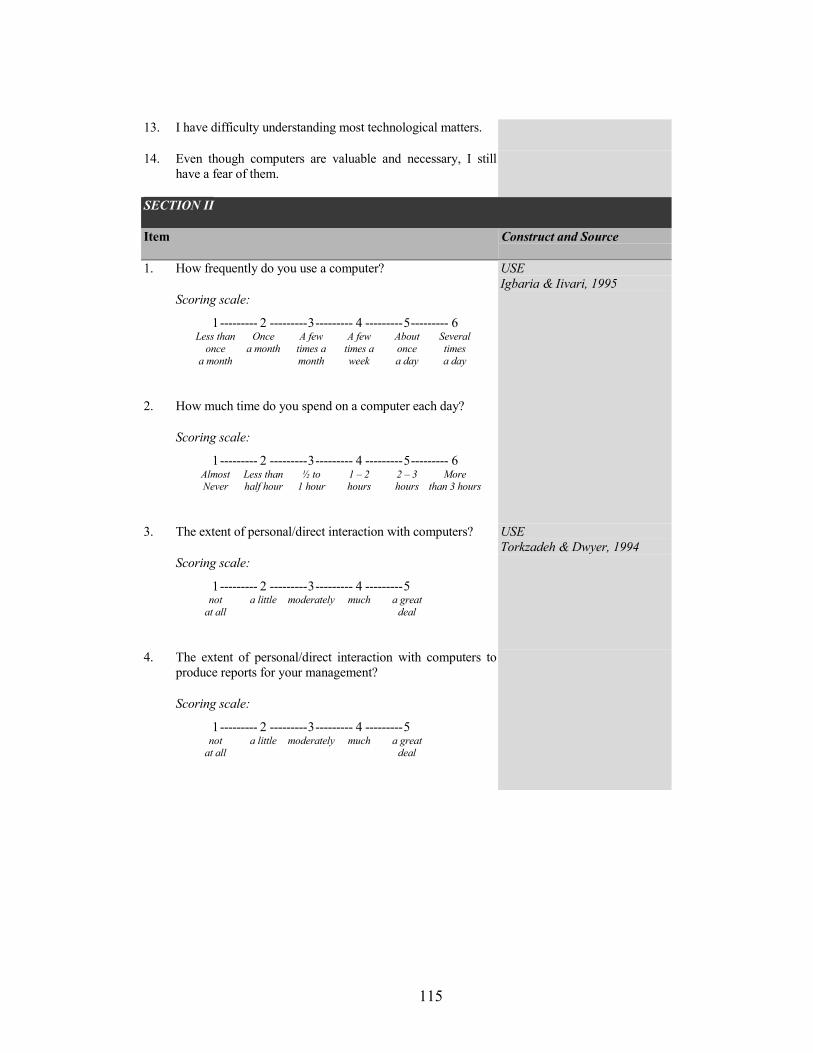
115
13. I have difficulty understanding most technological matters.
14. Even though computers are valuable and necessary, I stillhave a fear of them.
SECTION II
Item Construct and Source
1. How frequently do you use a computer?
Scoring scale:
1--------- 2 ---------3--------- 4 ---------5--------- 6Less than Once A few A few About Several
once a month times a times a once timesa month month week a day a day
2. How much time do you spend on a computer each day?
Scoring scale:
1--------- 2 ---------3--------- 4 ---------5--------- 6Almost Less than ½ to 1 � 2 2 � 3 MoreNever half hour 1 hour hours hours than 3 hours
USEIgbaria & Iivari, 1995
3. The extent of personal/direct interaction with computers?
Scoring scale:
1--------- 2 ---------3--------- 4 ---------5not a little moderately much a great
at all deal
USETorkzadeh & Dwyer, 1994
4. The extent of personal/direct interaction with computers toproduce reports for your management?
Scoring scale:
1--------- 2 ---------3--------- 4 ---------5not a little moderately much a great
at all deal
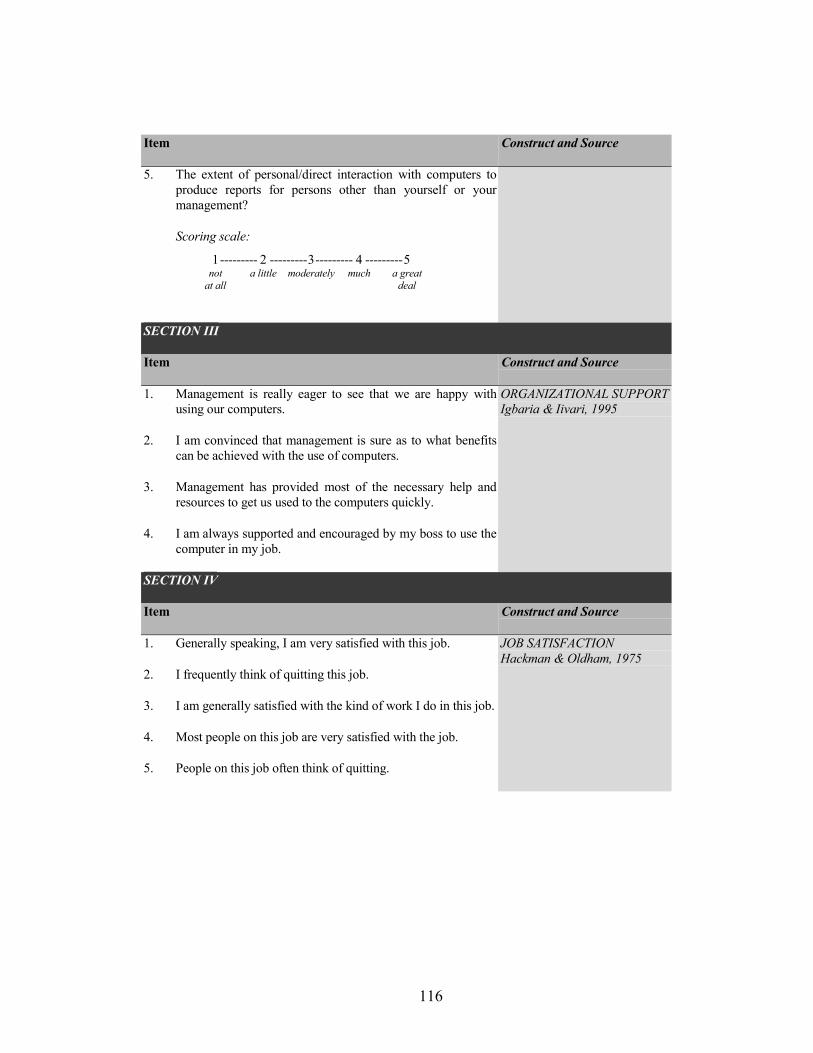
116
Item Construct and Source
5. The extent of personal/direct interaction with computers toproduce reports for persons other than yourself or yourmanagement?
Scoring scale:
1--------- 2 ---------3--------- 4 ---------5not a little moderately much a great
at all deal
SECTION III
Item Construct and Source
1. Management is really eager to see that we are happy withusing our computers.
2. I am convinced that management is sure as to what benefitscan be achieved with the use of computers.
3. Management has provided most of the necessary help andresources to get us used to the computers quickly.
4. I am always supported and encouraged by my boss to use thecomputer in my job.
ORGANIZATIONAL SUPPORTIgbaria & Iivari, 1995
SECTION IV
Item Construct and Source
1. Generally speaking, I am very satisfied with this job.
2. I frequently think of quitting this job.
3. I am generally satisfied with the kind of work I do in this job.
4. Most people on this job are very satisfied with the job.
5. People on this job often think of quitting.
JOB SATISFACTIONHackman & Oldham, 1975
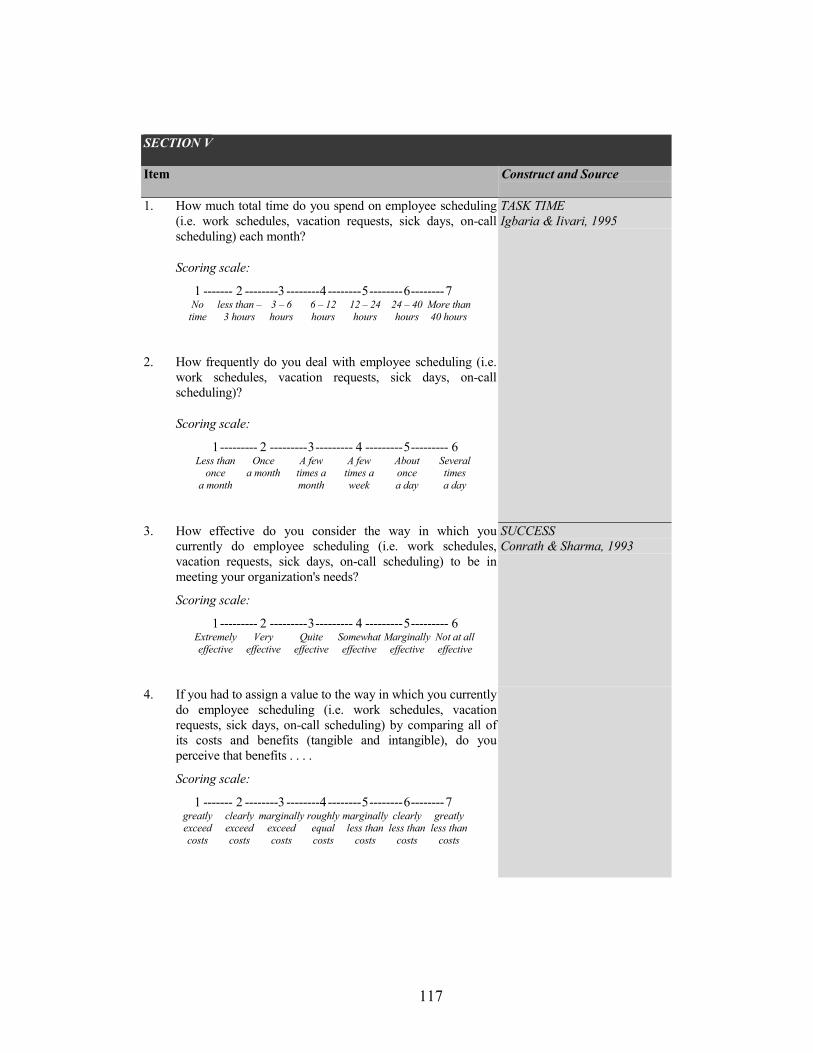
117
SECTION V
Item Construct and Source
1. How much total time do you spend on employee scheduling(i.e. work schedules, vacation requests, sick days, on-callscheduling) each month?
Scoring scale:
1 ------- 2 --------3 --------4--------5--------6--------7No less than � 3 � 6 6 � 12 12 � 24 24 � 40 More than
time 3 hours hours hours hours hours 40 hours
2. How frequently do you deal with employee scheduling (i.e.work schedules, vacation requests, sick days, on-callscheduling)?
Scoring scale:
1--------- 2 ---------3--------- 4 ---------5--------- 6Less than Once A few A few About Several
once a month times a times a once timesa month month week a day a day
TASK TIMEIgbaria & Iivari, 1995
3. How effective do you consider the way in which youcurrently do employee scheduling (i.e. work schedules,vacation requests, sick days, on-call scheduling) to be inmeeting your organization's needs?
Scoring scale:
1--------- 2 ---------3--------- 4 ---------5--------- 6Extremely Very Quite Somewhat Marginally Not at alleffective effective effective effective effective effective
SUCCESSConrath & Sharma, 1993
4. If you had to assign a value to the way in which you currentlydo employee scheduling (i.e. work schedules, vacationrequests, sick days, on-call scheduling) by comparing all ofits costs and benefits (tangible and intangible), do youperceive that benefits . . . .
Scoring scale:
1 ------- 2 --------3 --------4--------5--------6--------7greatly clearly marginally roughly marginally clearly greatlyexceed exceed exceed equal less than less than less thancosts costs costs costs costs costs costs
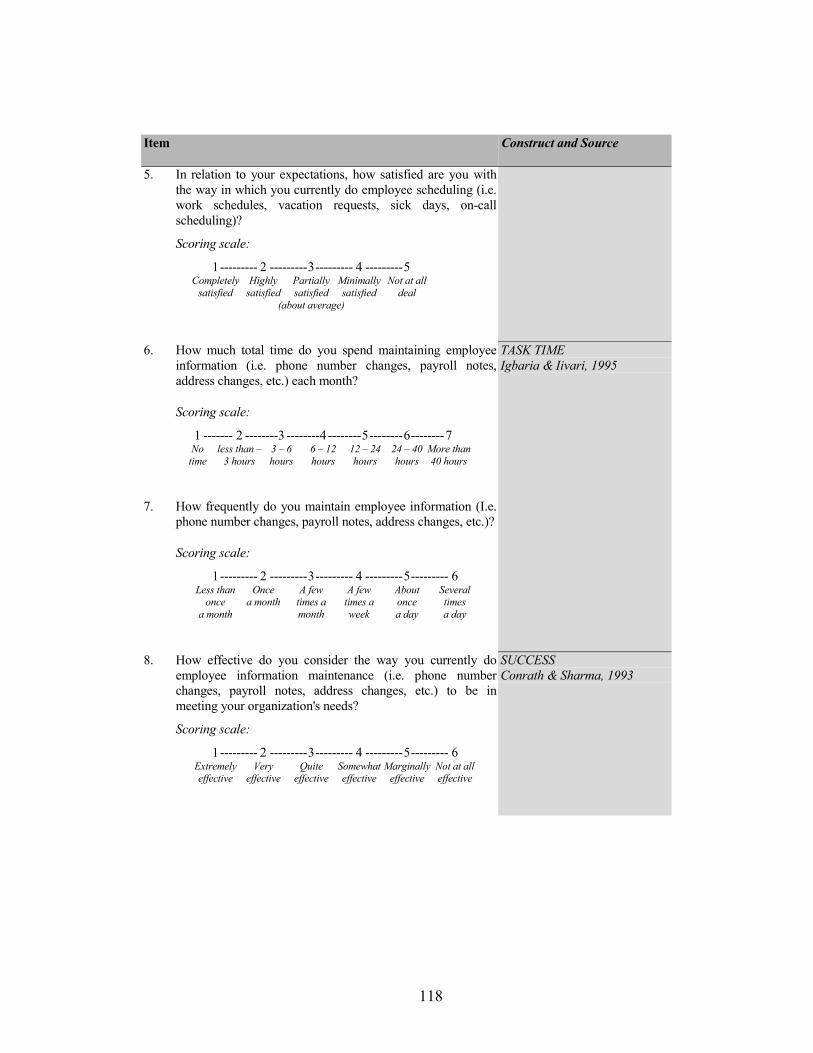
118
Item Construct and Source
5. In relation to your expectations, how satisfied are you withthe way in which you currently do employee scheduling (i.e.work schedules, vacation requests, sick days, on-callscheduling)?
Scoring scale:
1--------- 2 ---------3--------- 4 ---------5Completely Highly Partially Minimally Not at all
satisfied satisfied satisfied satisfied deal(about average)
6. How much total time do you spend maintaining employeeinformation (i.e. phone number changes, payroll notes,address changes, etc.) each month?
Scoring scale:
1 ------- 2 --------3 --------4--------5--------6--------7No less than � 3 � 6 6 � 12 12 � 24 24 � 40 More than
time 3 hours hours hours hours hours 40 hours
7. How frequently do you maintain employee information (I.e.phone number changes, payroll notes, address changes, etc.)?
Scoring scale:
1--------- 2 ---------3--------- 4 ---------5--------- 6Less than Once A few A few About Several
once a month times a times a once timesa month month week a day a day
TASK TIMEIgbaria & Iivari, 1995
8. How effective do you consider the way you currently doemployee information maintenance (i.e. phone numberchanges, payroll notes, address changes, etc.) to be inmeeting your organization's needs?
Scoring scale:
1--------- 2 ---------3--------- 4 ---------5--------- 6Extremely Very Quite Somewhat Marginally Not at alleffective effective effective effective effective effective
SUCCESSConrath & Sharma, 1993
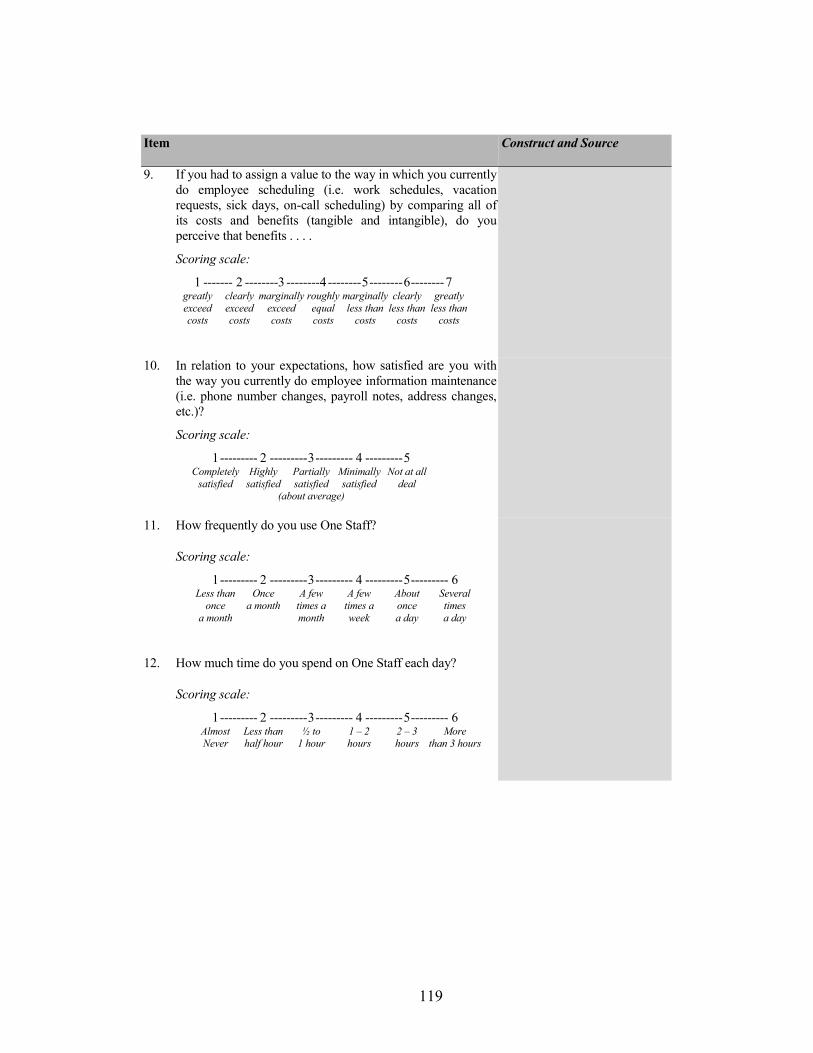
119
Item Construct and Source
9. If you had to assign a value to the way in which you currentlydo employee scheduling (i.e. work schedules, vacationrequests, sick days, on-call scheduling) by comparing all ofits costs and benefits (tangible and intangible), do youperceive that benefits . . . .
Scoring scale:
1 ------- 2 --------3 --------4--------5--------6--------7greatly clearly marginally roughly marginally clearly greatlyexceed exceed exceed equal less than less than less thancosts costs costs costs costs costs costs
10. In relation to your expectations, how satisfied are you withthe way you currently do employee information maintenance(i.e. phone number changes, payroll notes, address changes,etc.)?
Scoring scale:
1--------- 2 ---------3--------- 4 ---------5Completely Highly Partially Minimally Not at all
satisfied satisfied satisfied satisfied deal(about average)
11. How frequently do you use One Staff?
Scoring scale:
1--------- 2 ---------3--------- 4 ---------5--------- 6Less than Once A few A few About Several
once a month times a times a once timesa month month week a day a day
12. How much time do you spend on One Staff each day?
Scoring scale:
1--------- 2 ---------3--------- 4 ---------5--------- 6Almost Less than ½ to 1 � 2 2 � 3 MoreNever half hour 1 hour hours hours than 3 hours
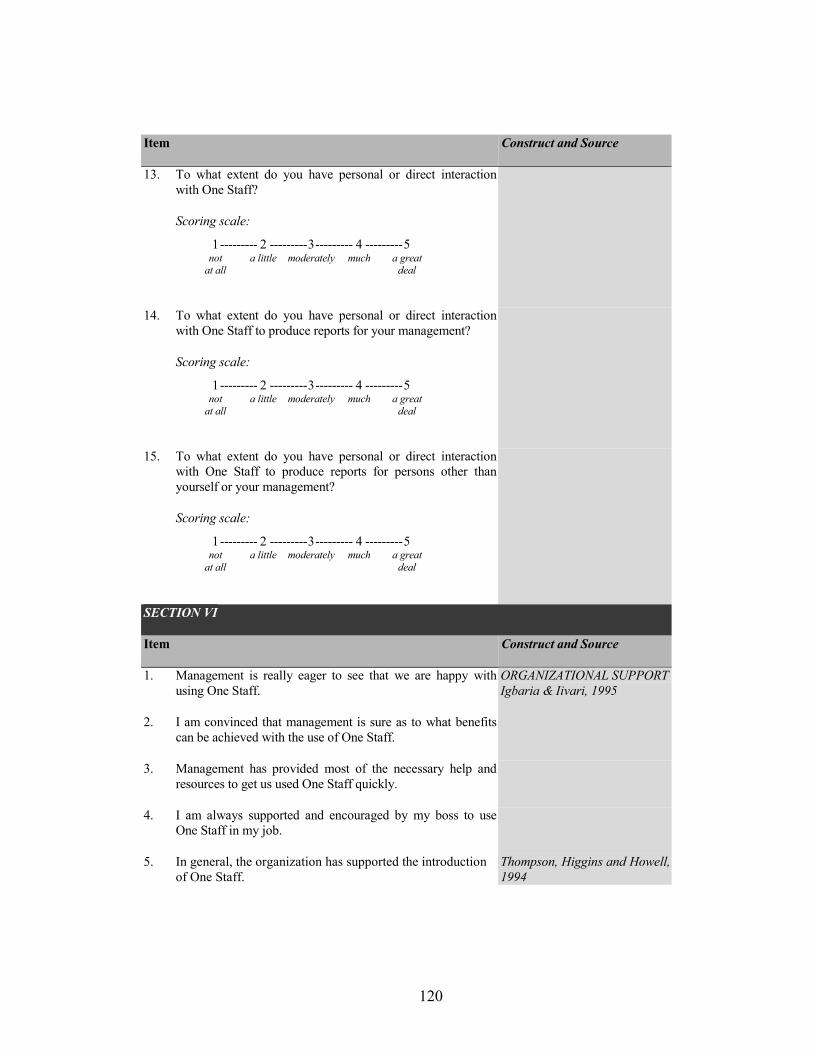
120
Item Construct and Source
13. To what extent do you have personal or direct interactionwith One Staff?
Scoring scale:
1--------- 2 ---------3--------- 4 ---------5not a little moderately much a great
at all deal
14. To what extent do you have personal or direct interactionwith One Staff to produce reports for your management?
Scoring scale:
1--------- 2 ---------3--------- 4 ---------5not a little moderately much a great
at all deal
15. To what extent do you have personal or direct interactionwith One Staff to produce reports for persons other thanyourself or your management?
Scoring scale:
1--------- 2 ---------3--------- 4 ---------5not a little moderately much a great
at all deal
SECTION VI
Item Construct and Source
1. Management is really eager to see that we are happy withusing One Staff.
2. I am convinced that management is sure as to what benefitscan be achieved with the use of One Staff.
ORGANIZATIONAL SUPPORTIgbaria & Iivari, 1995
3. Management has provided most of the necessary help andresources to get us used One Staff quickly.
4. I am always supported and encouraged by my boss to useOne Staff in my job.
5. In general, the organization has supported the introductionof One Staff.
Thompson, Higgins and Howell,1994
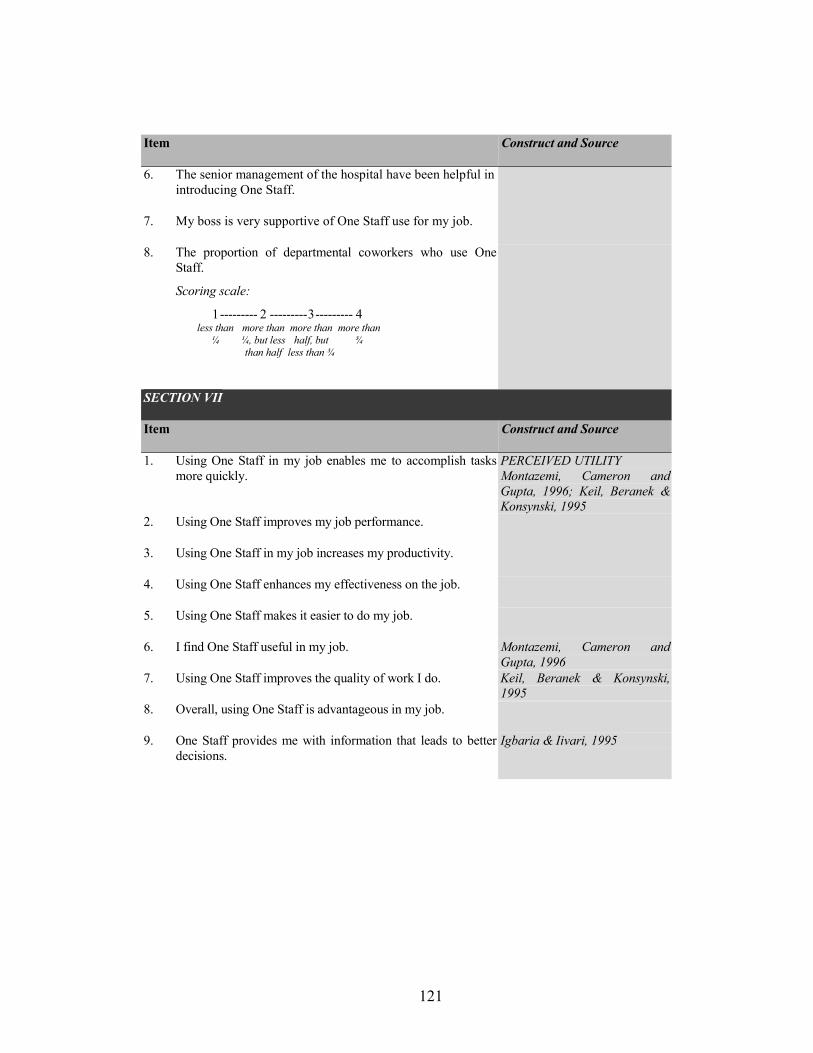
121
Item Construct and Source
6. The senior management of the hospital have been helpful inintroducing One Staff.
7. My boss is very supportive of One Staff use for my job.
8. The proportion of departmental coworkers who use OneStaff.
Scoring scale:
1--------- 2 ---------3--------- 4less than more than more than more than
¼ ¼, but less half, but ¾than half less than ¾
SECTION VII
Item Construct and Source
1. Using One Staff in my job enables me to accomplish tasksmore quickly.
PERCEIVED UTILITYMontazemi, Cameron andGupta, 1996; Keil, Beranek &Konsynski, 1995
2. Using One Staff improves my job performance.
3. Using One Staff in my job increases my productivity.
4. Using One Staff enhances my effectiveness on the job.
5. Using One Staff makes it easier to do my job.
6. I find One Staff useful in my job. Montazemi, Cameron andGupta, 1996
7. Using One Staff improves the quality of work I do. Keil, Beranek & Konsynski,1995
8. Overall, using One Staff is advantageous in my job.
9. One Staff provides me with information that leads to betterdecisions.
Igbaria & Iivari, 1995
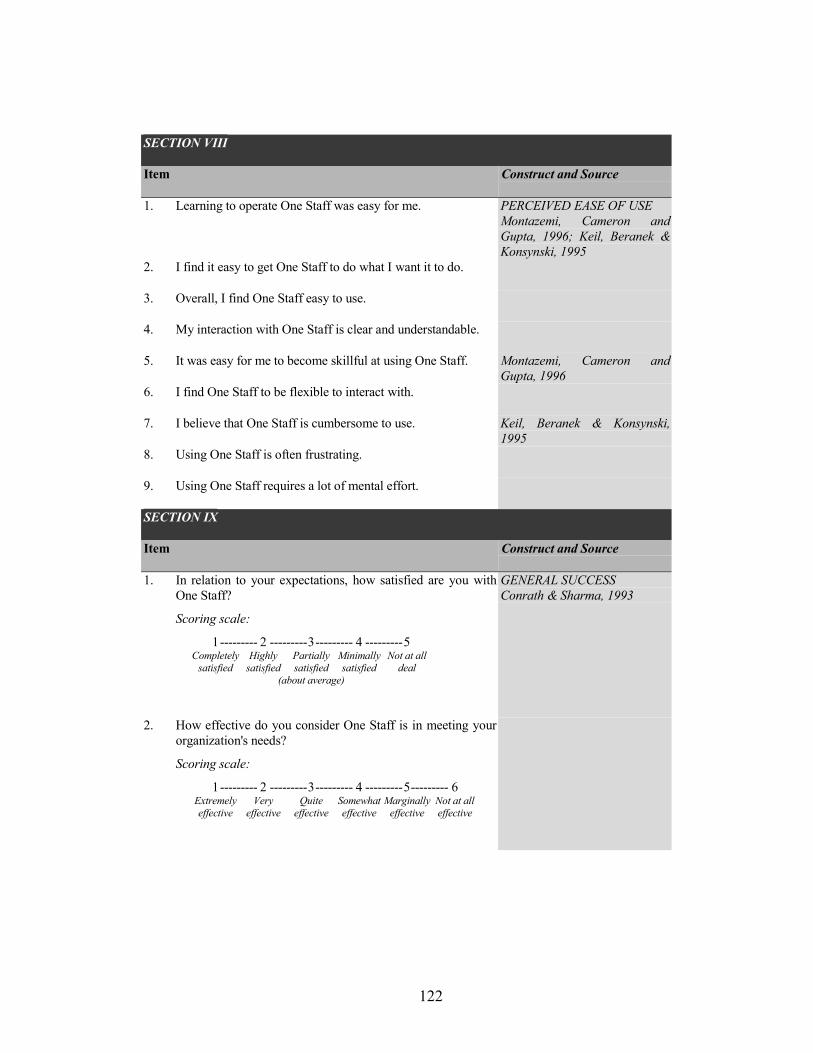
122
SECTION VIII
Item Construct and Source
1. Learning to operate One Staff was easy for me. PERCEIVED EASE OF USEMontazemi, Cameron andGupta, 1996; Keil, Beranek &Konsynski, 1995
2. I find it easy to get One Staff to do what I want it to do.
3. Overall, I find One Staff easy to use.
4. My interaction with One Staff is clear and understandable.
5. It was easy for me to become skillful at using One Staff. Montazemi, Cameron andGupta, 1996
6. I find One Staff to be flexible to interact with.
7. I believe that One Staff is cumbersome to use. Keil, Beranek & Konsynski,1995
8. Using One Staff is often frustrating.
9. Using One Staff requires a lot of mental effort.
SECTION IX
Item Construct and Source
1. In relation to your expectations, how satisfied are you withOne Staff?
Scoring scale:
1--------- 2 ---------3--------- 4 ---------5Completely Highly Partially Minimally Not at all
satisfied satisfied satisfied satisfied deal(about average)
GENERAL SUCCESSConrath & Sharma, 1993
2. How effective do you consider One Staff is in meeting yourorganization's needs?
Scoring scale:
1--------- 2 ---------3--------- 4 ---------5--------- 6Extremely Very Quite Somewhat Marginally Not at alleffective effective effective effective effective effective
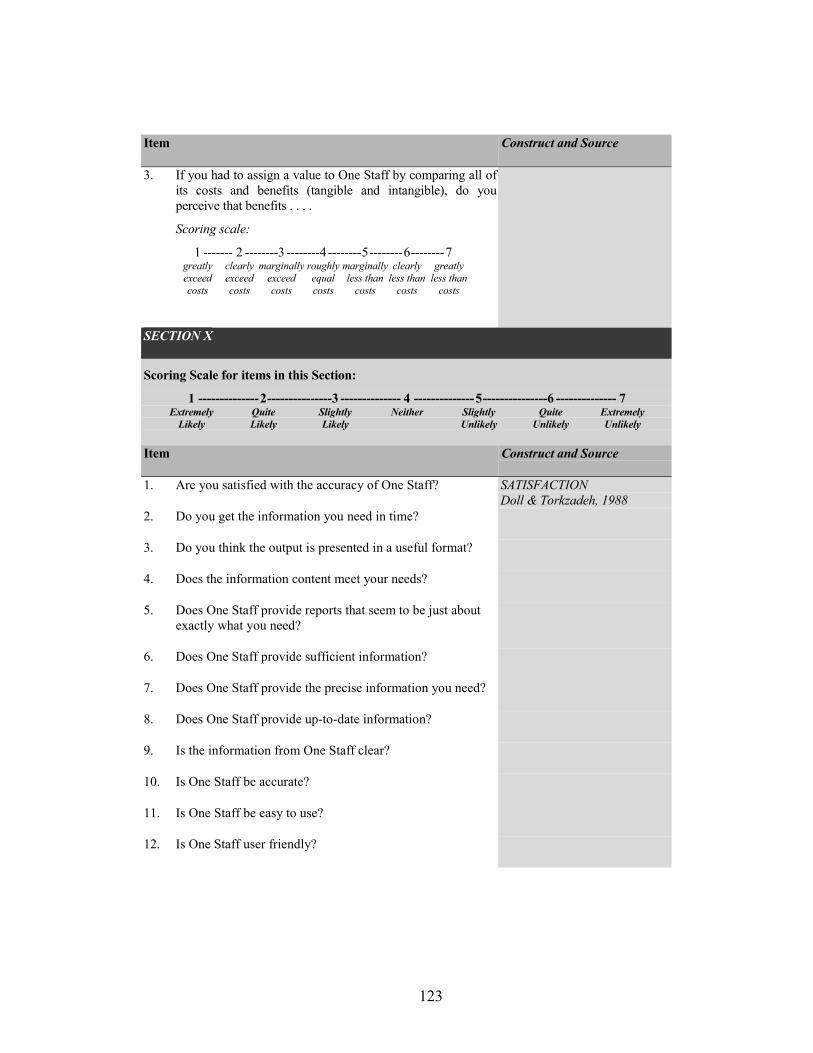
123
Item Construct and Source
3. If you had to assign a value to One Staff by comparing all ofits costs and benefits (tangible and intangible), do youperceive that benefits . . . .
Scoring scale:
1 ------- 2 --------3 --------4--------5--------6--------7greatly clearly marginally roughly marginally clearly greatlyexceed exceed exceed equal less than less than less thancosts costs costs costs costs costs costs
SECTION X
Scoring Scale for items in this Section:
1 --------------2---------------3 -------------- 4 --------------5---------------6 -------------- 7Extremely Quite Slightly Neither Slightly Quite Extremely
Likely Likely Likely Unlikely Unlikely Unlikely
Item Construct and Source
1. Are you satisfied with the accuracy of One Staff? SATISFACTIONDoll & Torkzadeh, 1988
2. Do you get the information you need in time?
3. Do you think the output is presented in a useful format?
4. Does the information content meet your needs?
5. Does One Staff provide reports that seem to be just aboutexactly what you need?
6. Does One Staff provide sufficient information?
7. Does One Staff provide the precise information you need?
8. Does One Staff provide up-to-date information?
9. Is the information from One Staff clear?
10. Is One Staff be accurate?
11. Is One Staff be easy to use?
12. Is One Staff user friendly?
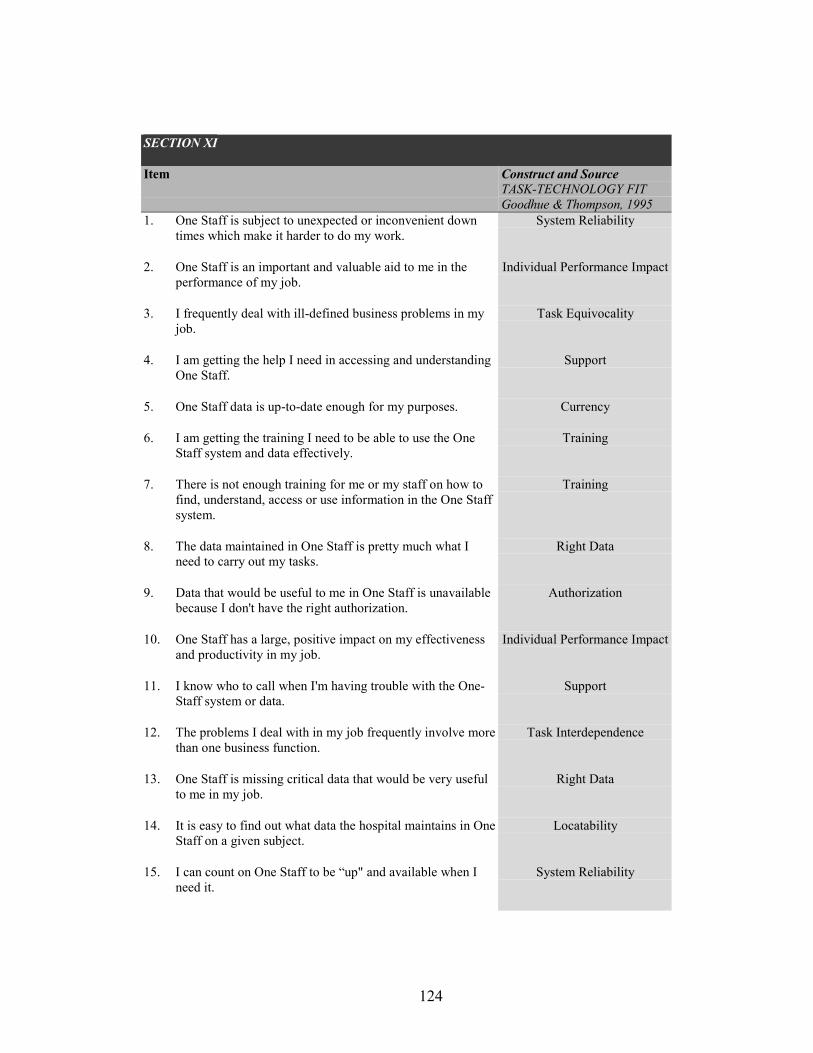
124
SECTION XI
Item Construct and SourceTASK-TECHNOLOGY FITGoodhue & Thompson, 1995
1. One Staff is subject to unexpected or inconvenient downtimes which make it harder to do my work.
System Reliability
2. One Staff is an important and valuable aid to me in theperformance of my job.
Individual Performance Impact
3. I frequently deal with ill-defined business problems in myjob.
Task Equivocality
4. I am getting the help I need in accessing and understandingOne Staff.
Support
5. One Staff data is up-to-date enough for my purposes. Currency
6. I am getting the training I need to be able to use the OneStaff system and data effectively.
Training
7. There is not enough training for me or my staff on how tofind, understand, access or use information in the One Staffsystem.
Training
8. The data maintained in One Staff is pretty much what Ineed to carry out my tasks.
Right Data
9. Data that would be useful to me in One Staff is unavailablebecause I don't have the right authorization.
Authorization
10. One Staff has a large, positive impact on my effectivenessand productivity in my job.
Individual Performance Impact
11. I know who to call when I'm having trouble with the One-Staff system or data.
Support
12. The problems I deal with in my job frequently involve morethan one business function.
Task Interdependence
13. One Staff is missing critical data that would be very usefulto me in my job.
Right Data
14. It is easy to find out what data the hospital maintains in OneStaff on a given subject.
Locatability
15. I can count on One Staff to be �up" and available when Ineed it.
System Reliability

125
Item Construct and Source
16. The problems I deal with in my job frequently involve morethan one business function.
Task Interdependence
17. How dependent are you on One Staff in your job? Dependence
18. Sufficiently detailed data is maintained by the hospital inOne Staff.
Right Level of Detail
19. It is easy to get assistance when I have questions orproblems finding or using data in One Staff.
Support
20. On the One Staff system and reports I deal with, the exactmeaning of the data elements is either obvious, or easy tofind out.
Meaning
21. One Staff is subject to frequent problems and crashes. System Reliability
22. I frequently deal with ad-hoc, non-routine problems in myjob.
Task Equivocality
23. Frequently the problems I work with in my job involveanswering questions that have never been asked in quitethat form before.
Task Equivocality
24. The exact definition of One Staff data relating to my tasksis easy to find out.
Meaning
25. It is easy to locate hospital or departmental data in OneStaff on a particular issue, even if I haven't used that databefore.
Locatability
26. I can't get data that is current enough to meet my job needsfrom One Staff.
Currency
27. One Staff maintains data at an appropriate level of detail formy department's tasks.
Right Level of Detail
28. Getting authorization to access data in One Staff that wouldbe useful in my job is time consuming and difficult.
Authorization
126
APPENDIX B
SAS PROGRAM FILES AND OUTPUT
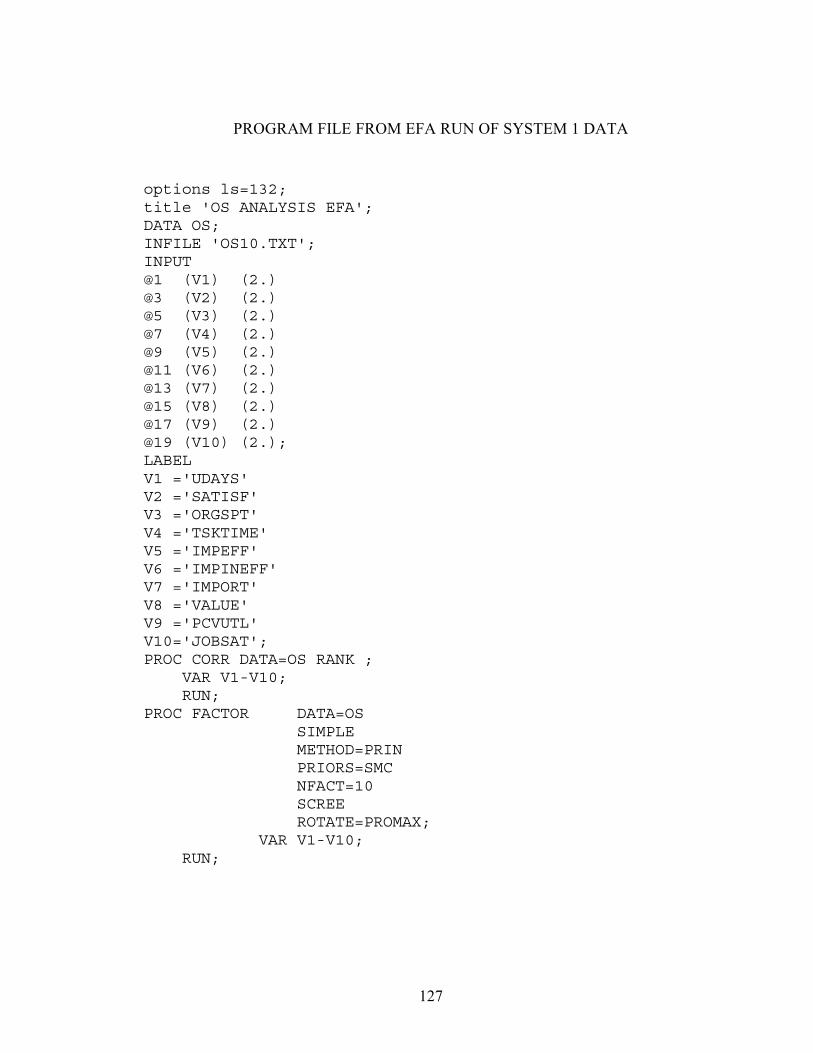
127
PROGRAM FILE FROM EFA RUN OF SYSTEM 1 DATA
options ls=132;title 'OS ANALYSIS EFA';DATA OS;INFILE 'OS10.TXT';INPUT@1 (V1) (2.)@3 (V2) (2.)@5 (V3) (2.)@7 (V4) (2.)@9 (V5) (2.)@11 (V6) (2.)@13 (V7) (2.)@15 (V8) (2.)@17 (V9) (2.)@19 (V10) (2.);LABELV1 ='UDAYS'V2 ='SATISF'V3 ='ORGSPT'V4 ='TSKTIME'V5 ='IMPEFF'V6 ='IMPINEFF'V7 ='IMPORT'V8 ='VALUE'V9 ='PCVUTL'V10='JOBSAT';PROC CORR DATA=OS RANK ; VAR V1-V10; RUN;PROC FACTOR DATA=OS SIMPLE METHOD=PRIN PRIORS=SMC NFACT=10 SCREE ROTATE=PROMAX; VAR V1-V10; RUN;
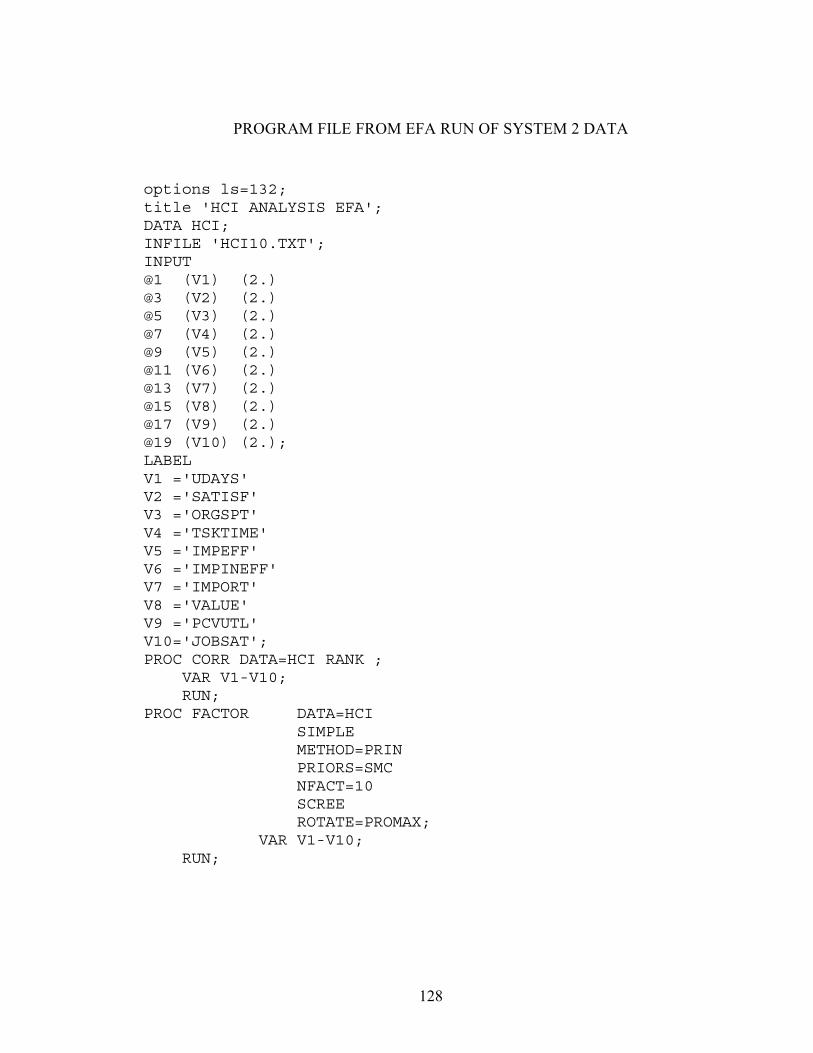
128
PROGRAM FILE FROM EFA RUN OF SYSTEM 2 DATA
options ls=132;title 'HCI ANALYSIS EFA';DATA HCI;INFILE 'HCI10.TXT';INPUT@1 (V1) (2.)@3 (V2) (2.)@5 (V3) (2.)@7 (V4) (2.)@9 (V5) (2.)@11 (V6) (2.)@13 (V7) (2.)@15 (V8) (2.)@17 (V9) (2.)@19 (V10) (2.);LABELV1 ='UDAYS'V2 ='SATISF'V3 ='ORGSPT'V4 ='TSKTIME'V5 ='IMPEFF'V6 ='IMPINEFF'V7 ='IMPORT'V8 ='VALUE'V9 ='PCVUTL'V10='JOBSAT';PROC CORR DATA=HCI RANK ; VAR V1-V10; RUN;PROC FACTOR DATA=HCI SIMPLE METHOD=PRIN PRIORS=SMC NFACT=10 SCREE ROTATE=PROMAX; VAR V1-V10; RUN;
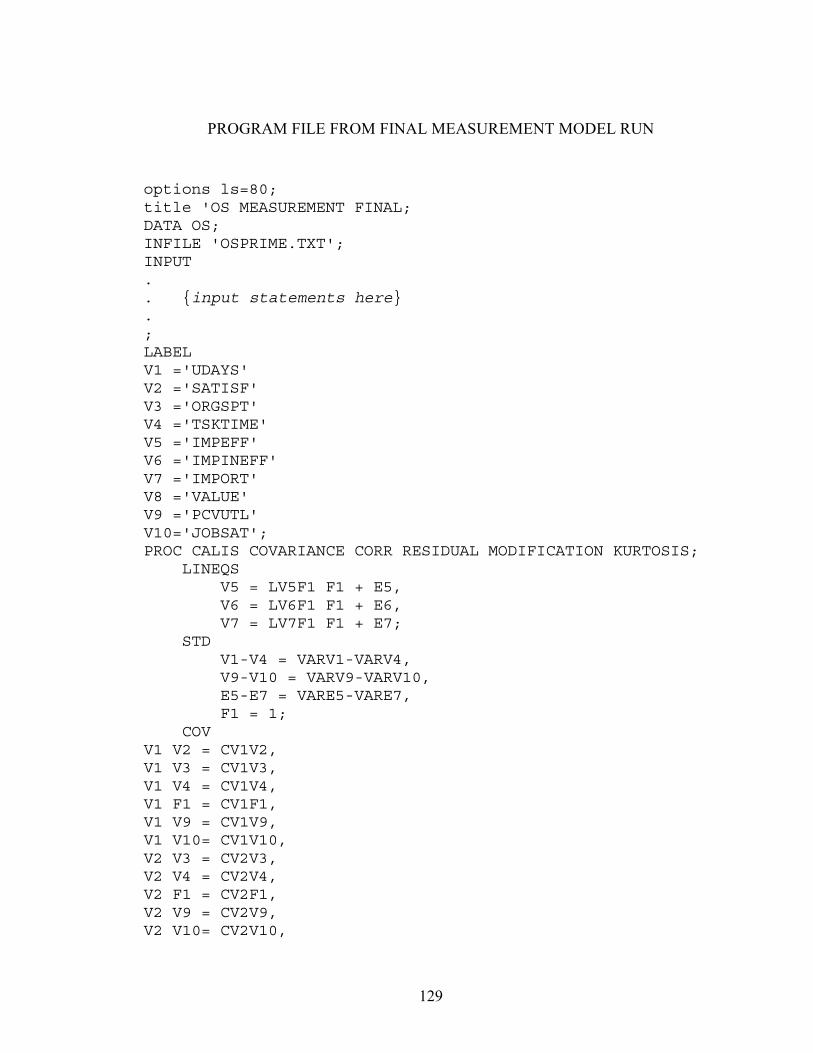
129
PROGRAM FILE FROM FINAL MEASUREMENT MODEL RUN
options ls=80;title 'OS MEASUREMENT FINAL;DATA OS;INFILE 'OSPRIME.TXT';INPUT.. {input statements here}.;LABELV1 ='UDAYS'V2 ='SATISF'V3 ='ORGSPT'V4 ='TSKTIME'V5 ='IMPEFF'V6 ='IMPINEFF'V7 ='IMPORT'V8 ='VALUE'V9 ='PCVUTL'V10='JOBSAT';PROC CALIS COVARIANCE CORR RESIDUAL MODIFICATION KURTOSIS; LINEQS V5 = LV5F1 F1 + E5, V6 = LV6F1 F1 + E6, V7 = LV7F1 F1 + E7; STD V1-V4 = VARV1-VARV4, V9-V10 = VARV9-VARV10, E5-E7 = VARE5-VARE7, F1 = 1; COVV1 V2 = CV1V2,V1 V3 = CV1V3,V1 V4 = CV1V4,V1 F1 = CV1F1,V1 V9 = CV1V9,V1 V10= CV1V10,V2 V3 = CV2V3,V2 V4 = CV2V4,V2 F1 = CV2F1,V2 V9 = CV2V9,V2 V10= CV2V10,
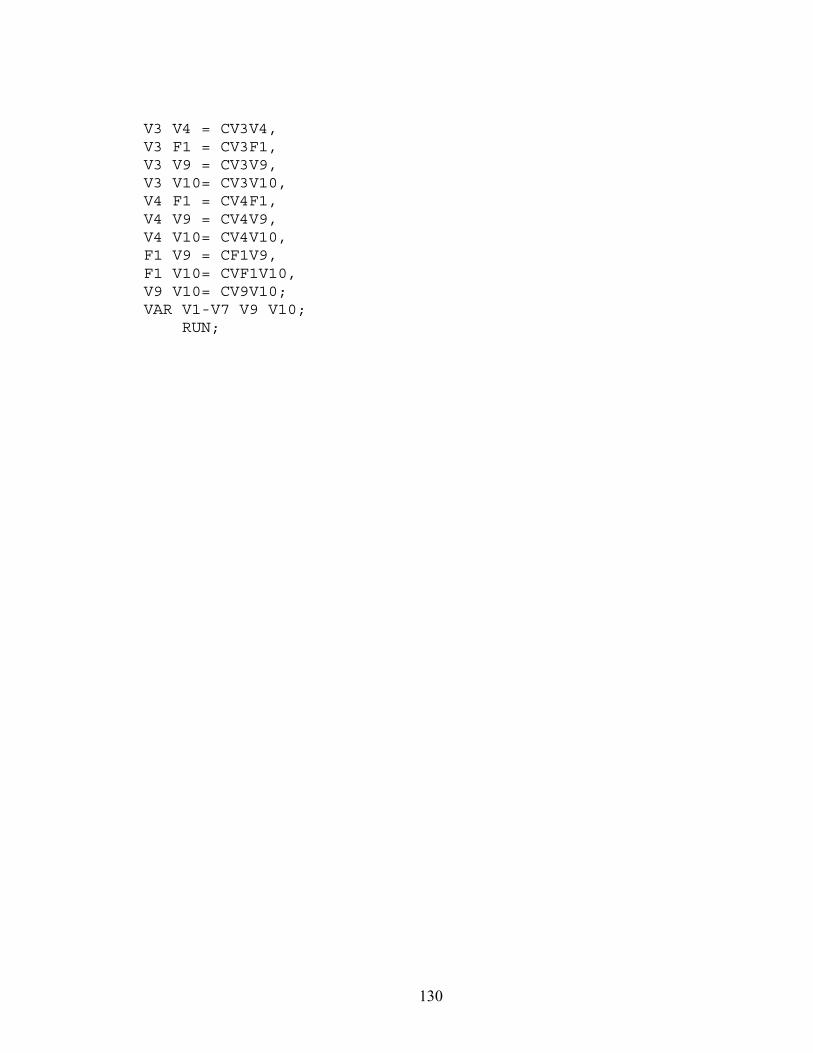
130
V3 V4 = CV3V4,V3 F1 = CV3F1,V3 V9 = CV3V9,V3 V10= CV3V10,V4 F1 = CV4F1,V4 V9 = CV4V9,V4 V10= CV4V10,F1 V9 = CF1V9,F1 V10= CVF1V10,V9 V10= CV9V10;VAR V1-V7 V9 V10; RUN;
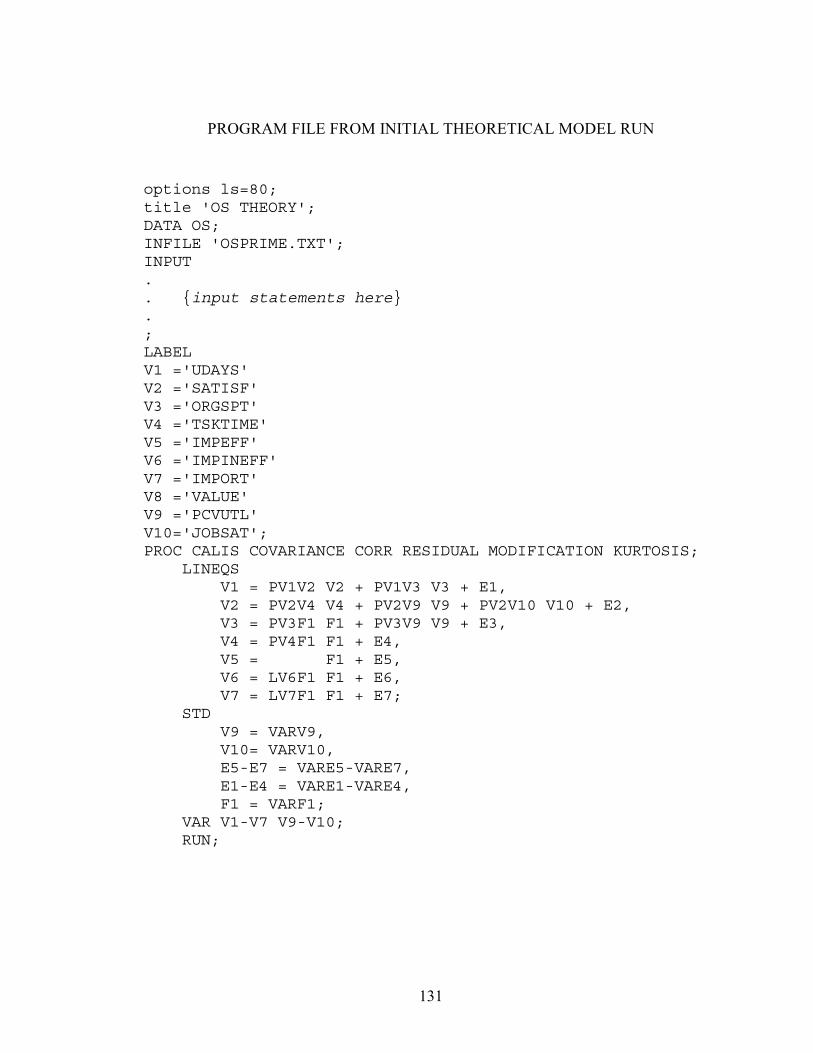
131
PROGRAM FILE FROM INITIAL THEORETICAL MODEL RUN
options ls=80;title 'OS THEORY';DATA OS;INFILE 'OSPRIME.TXT';INPUT.. {input statements here}.;LABELV1 ='UDAYS'V2 ='SATISF'V3 ='ORGSPT'V4 ='TSKTIME'V5 ='IMPEFF'V6 ='IMPINEFF'V7 ='IMPORT'V8 ='VALUE'V9 ='PCVUTL'V10='JOBSAT';PROC CALIS COVARIANCE CORR RESIDUAL MODIFICATION KURTOSIS; LINEQS V1 = PV1V2 V2 + PV1V3 V3 + E1, V2 = PV2V4 V4 + PV2V9 V9 + PV2V10 V10 + E2, V3 = PV3F1 F1 + PV3V9 V9 + E3, V4 = PV4F1 F1 + E4, V5 = F1 + E5, V6 = LV6F1 F1 + E6, V7 = LV7F1 F1 + E7; STD V9 = VARV9, V10= VARV10, E5-E7 = VARE5-VARE7, E1-E4 = VARE1-VARE4, F1 = VARF1; VAR V1-V7 V9-V10; RUN;
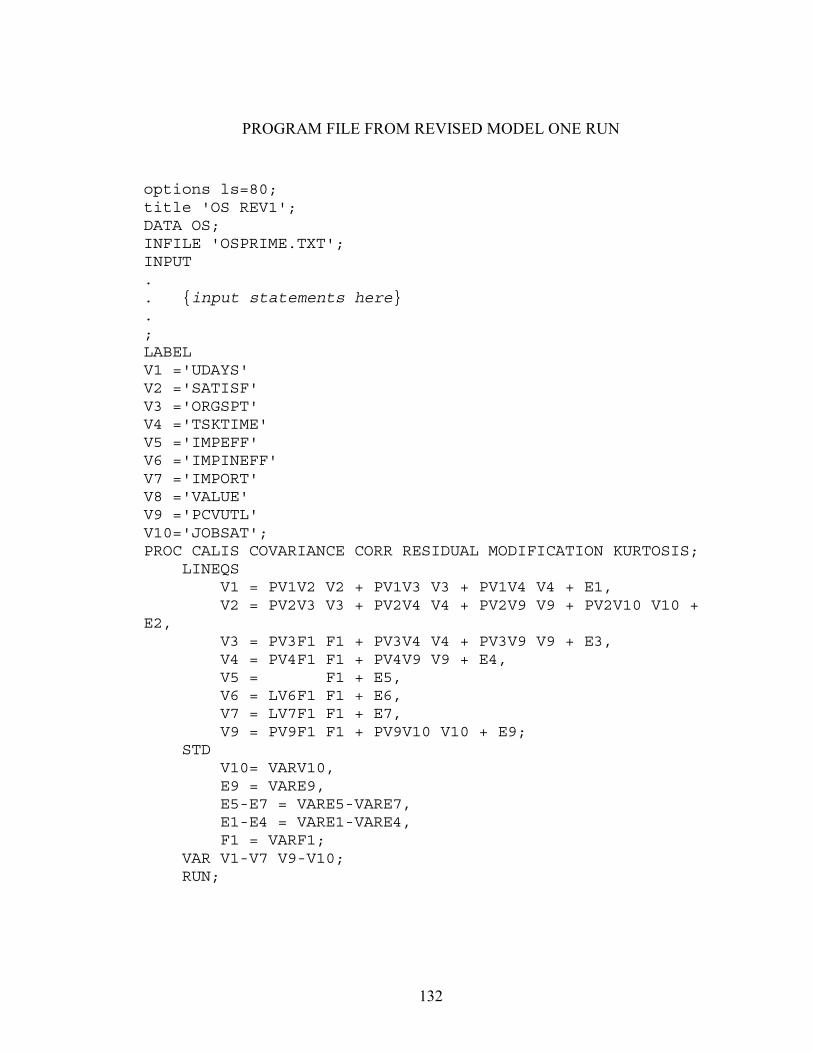
132
PROGRAM FILE FROM REVISED MODEL ONE RUN
options ls=80;title 'OS REV1';DATA OS;INFILE 'OSPRIME.TXT';INPUT.. {input statements here}.;LABELV1 ='UDAYS'V2 ='SATISF'V3 ='ORGSPT'V4 ='TSKTIME'V5 ='IMPEFF'V6 ='IMPINEFF'V7 ='IMPORT'V8 ='VALUE'V9 ='PCVUTL'V10='JOBSAT';PROC CALIS COVARIANCE CORR RESIDUAL MODIFICATION KURTOSIS; LINEQS V1 = PV1V2 V2 + PV1V3 V3 + PV1V4 V4 + E1, V2 = PV2V3 V3 + PV2V4 V4 + PV2V9 V9 + PV2V10 V10 +E2, V3 = PV3F1 F1 + PV3V4 V4 + PV3V9 V9 + E3, V4 = PV4F1 F1 + PV4V9 V9 + E4, V5 = F1 + E5, V6 = LV6F1 F1 + E6, V7 = LV7F1 F1 + E7, V9 = PV9F1 F1 + PV9V10 V10 + E9; STD V10= VARV10, E9 = VARE9, E5-E7 = VARE5-VARE7, E1-E4 = VARE1-VARE4, F1 = VARF1; VAR V1-V7 V9-V10; RUN;
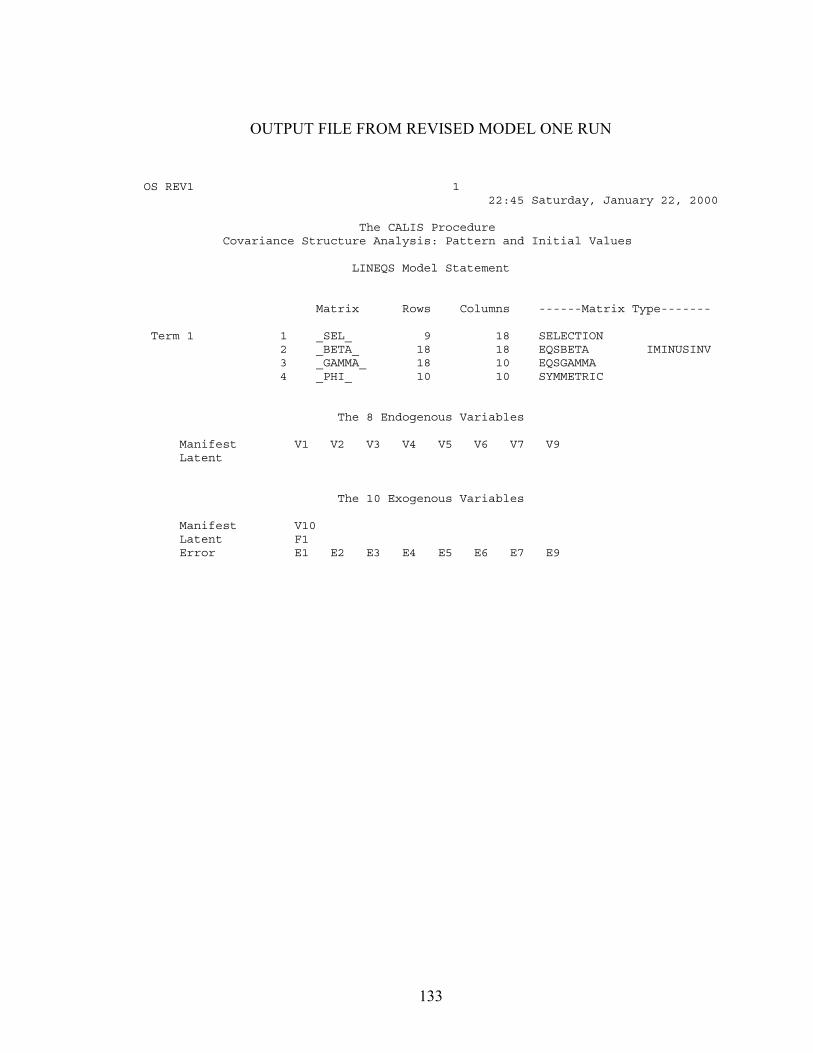
133
OUTPUT FILE FROM REVISED MODEL ONE RUN
OS REV1 1 22:45 Saturday, January 22, 2000
The CALIS Procedure Covariance Structure Analysis: Pattern and Initial Values
LINEQS Model Statement
Matrix Rows Columns ------Matrix Type-------
Term 1 1 _SEL_ 9 18 SELECTION 2 _BETA_ 18 18 EQSBETA IMINUSINV 3 _GAMMA_ 18 10 EQSGAMMA 4 _PHI_ 10 10 SYMMETRIC
The 8 Endogenous Variables
Manifest V1 V2 V3 V4 V5 V6 V7 V9 Latent
The 10 Exogenous Variables
Manifest V10 Latent F1 Error E1 E2 E3 E4 E5 E6 E7 E9
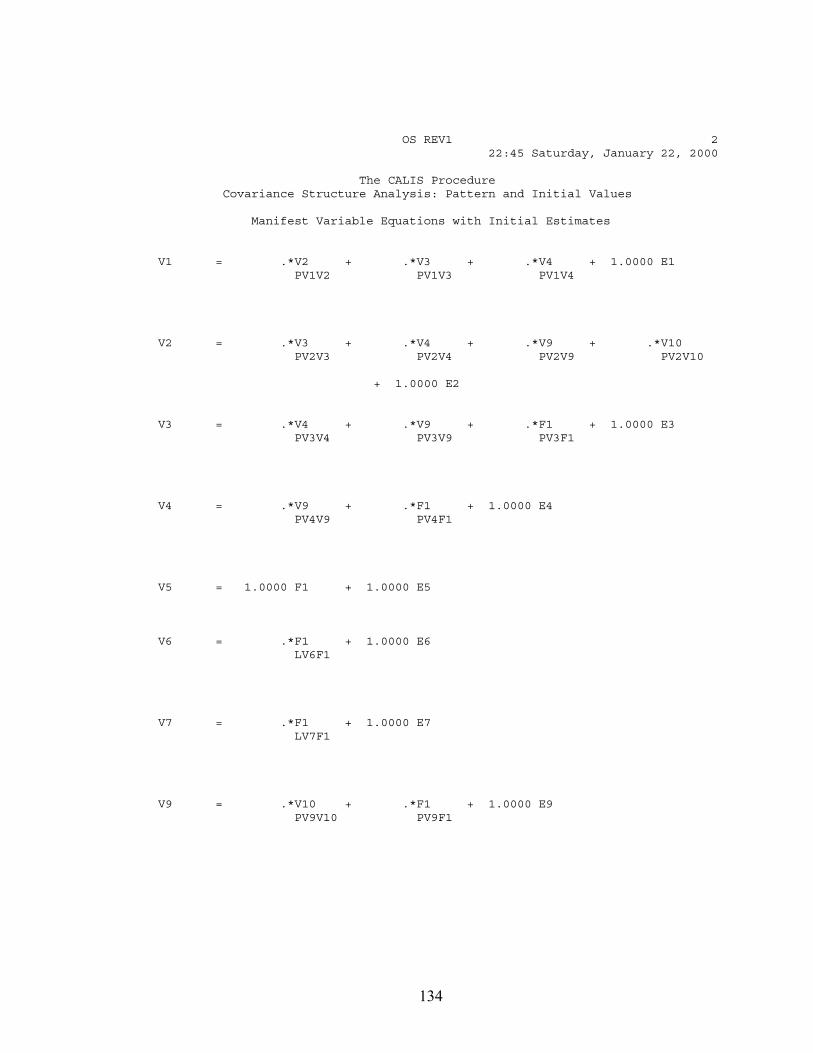
134
OS REV1 2 22:45 Saturday, January 22, 2000
The CALIS Procedure Covariance Structure Analysis: Pattern and Initial Values
Manifest Variable Equations with Initial Estimates
V1 = .*V2 + .*V3 + .*V4 + 1.0000 E1 PV1V2 PV1V3 PV1V4
V2 = .*V3 + .*V4 + .*V9 + .*V10 PV2V3 PV2V4 PV2V9 PV2V10
+ 1.0000 E2
V3 = .*V4 + .*V9 + .*F1 + 1.0000 E3 PV3V4 PV3V9 PV3F1
V4 = .*V9 + .*F1 + 1.0000 E4 PV4V9 PV4F1
V5 = 1.0000 F1 + 1.0000 E5
V6 = .*F1 + 1.0000 E6 LV6F1
V7 = .*F1 + 1.0000 E7 LV7F1
V9 = .*V10 + .*F1 + 1.0000 E9 PV9V10 PV9F1
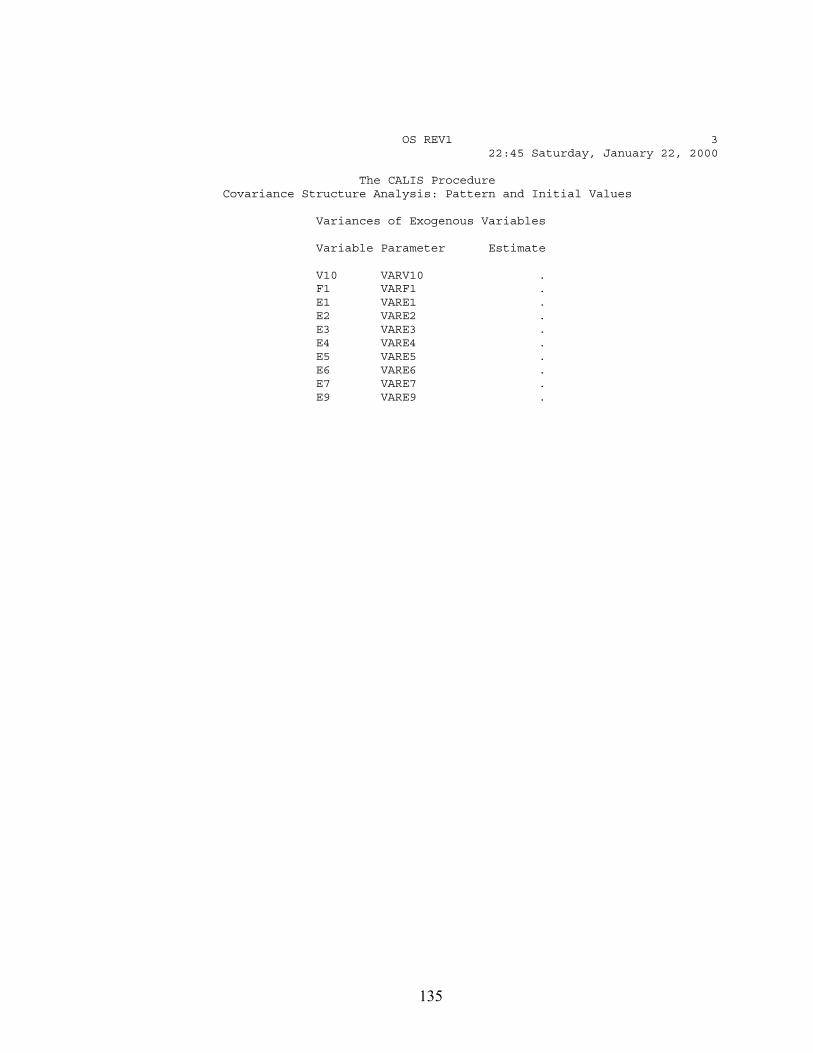
135
OS REV1 3 22:45 Saturday, January 22, 2000
The CALIS Procedure Covariance Structure Analysis: Pattern and Initial Values
Variances of Exogenous Variables
Variable Parameter Estimate
V10 VARV10 . F1 VARF1 . E1 VARE1 . E2 VARE2 . E3 VARE3 . E4 VARE4 . E5 VARE5 . E6 VARE6 . E7 VARE7 . E9 VARE9 .
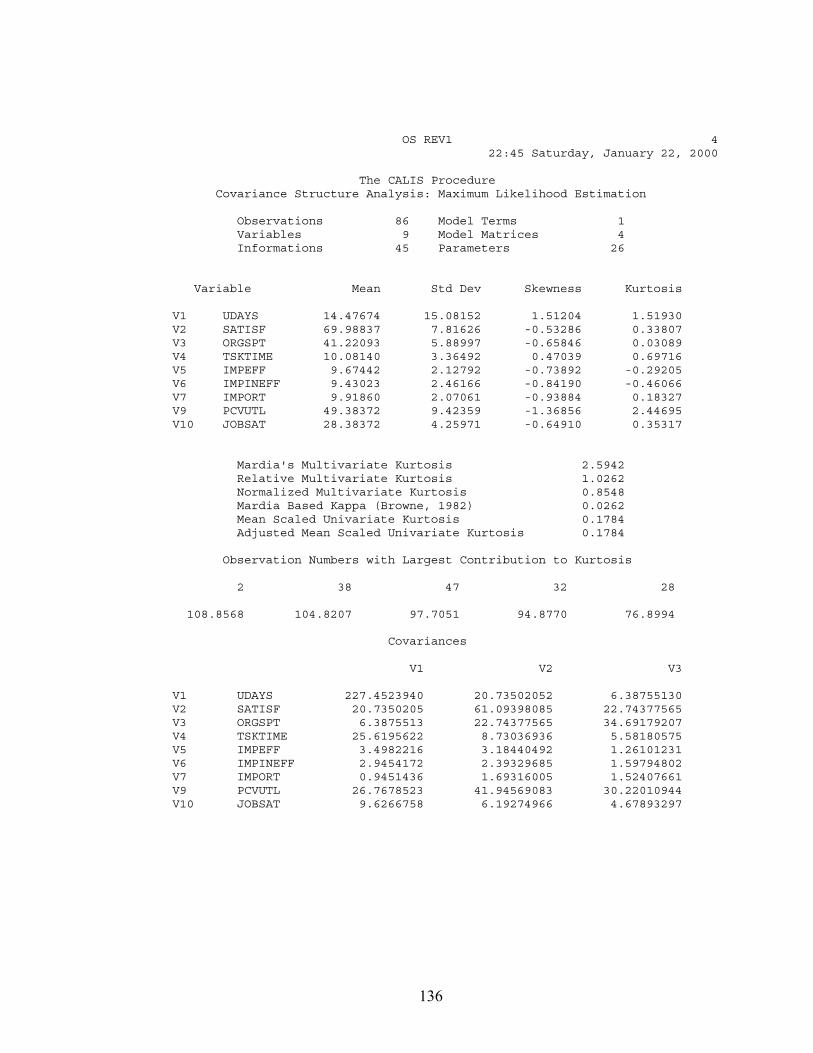
136
OS REV1 4 22:45 Saturday, January 22, 2000
The CALIS Procedure Covariance Structure Analysis: Maximum Likelihood Estimation
Observations 86 Model Terms 1 Variables 9 Model Matrices 4 Informations 45 Parameters 26
Variable Mean Std Dev Skewness Kurtosis
V1 UDAYS 14.47674 15.08152 1.51204 1.51930 V2 SATISF 69.98837 7.81626 -0.53286 0.33807 V3 ORGSPT 41.22093 5.88997 -0.65846 0.03089 V4 TSKTIME 10.08140 3.36492 0.47039 0.69716 V5 IMPEFF 9.67442 2.12792 -0.73892 -0.29205 V6 IMPINEFF 9.43023 2.46166 -0.84190 -0.46066 V7 IMPORT 9.91860 2.07061 -0.93884 0.18327 V9 PCVUTL 49.38372 9.42359 -1.36856 2.44695 V10 JOBSAT 28.38372 4.25971 -0.64910 0.35317
Mardia's Multivariate Kurtosis 2.5942 Relative Multivariate Kurtosis 1.0262 Normalized Multivariate Kurtosis 0.8548 Mardia Based Kappa (Browne, 1982) 0.0262 Mean Scaled Univariate Kurtosis 0.1784 Adjusted Mean Scaled Univariate Kurtosis 0.1784
Observation Numbers with Largest Contribution to Kurtosis
2 38 47 32 28
108.8568 104.8207 97.7051 94.8770 76.8994
Covariances
V1 V2 V3
V1 UDAYS 227.4523940 20.73502052 6.38755130 V2 SATISF 20.7350205 61.09398085 22.74377565 V3 ORGSPT 6.3875513 22.74377565 34.69179207 V4 TSKTIME 25.6195622 8.73036936 5.58180575 V5 IMPEFF 3.4982216 3.18440492 1.26101231 V6 IMPINEFF 2.9454172 2.39329685 1.59794802 V7 IMPORT 0.9451436 1.69316005 1.52407661 V9 PCVUTL 26.7678523 41.94569083 30.22010944 V10 JOBSAT 9.6266758 6.19274966 4.67893297
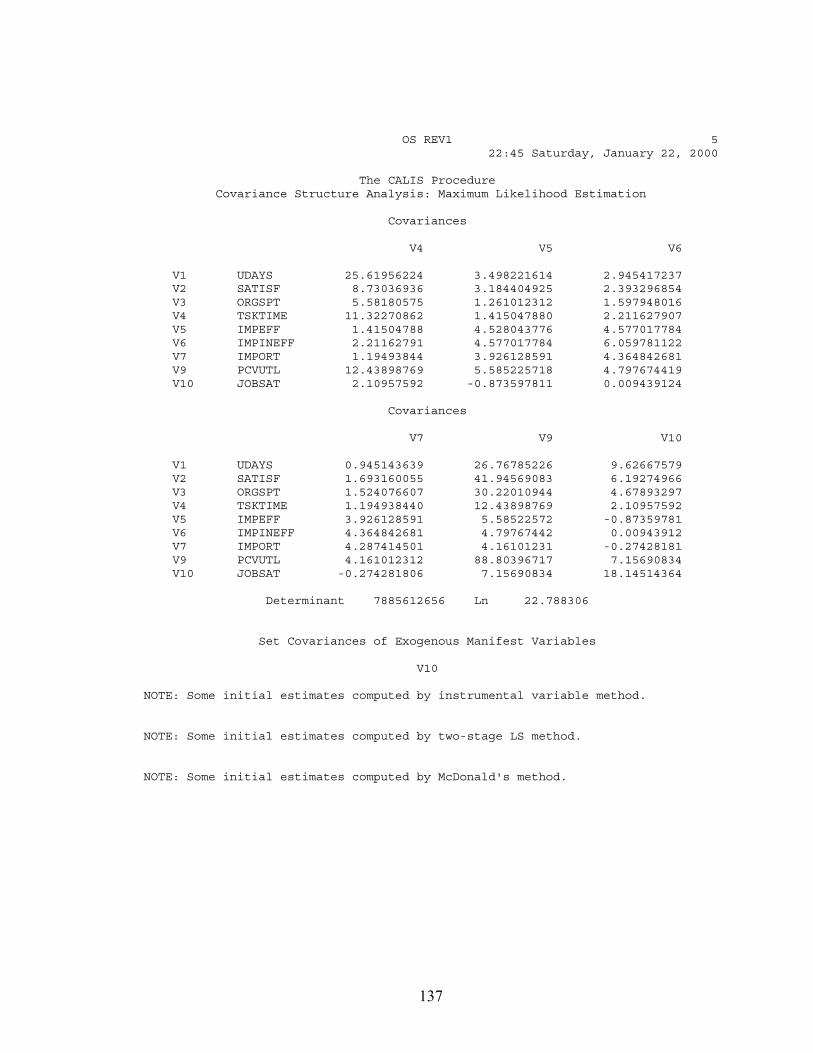
137
OS REV1 5 22:45 Saturday, January 22, 2000
The CALIS Procedure Covariance Structure Analysis: Maximum Likelihood Estimation
Covariances
V4 V5 V6
V1 UDAYS 25.61956224 3.498221614 2.945417237 V2 SATISF 8.73036936 3.184404925 2.393296854 V3 ORGSPT 5.58180575 1.261012312 1.597948016 V4 TSKTIME 11.32270862 1.415047880 2.211627907 V5 IMPEFF 1.41504788 4.528043776 4.577017784 V6 IMPINEFF 2.21162791 4.577017784 6.059781122 V7 IMPORT 1.19493844 3.926128591 4.364842681 V9 PCVUTL 12.43898769 5.585225718 4.797674419 V10 JOBSAT 2.10957592 -0.873597811 0.009439124
Covariances
V7 V9 V10
V1 UDAYS 0.945143639 26.76785226 9.62667579 V2 SATISF 1.693160055 41.94569083 6.19274966 V3 ORGSPT 1.524076607 30.22010944 4.67893297 V4 TSKTIME 1.194938440 12.43898769 2.10957592 V5 IMPEFF 3.926128591 5.58522572 -0.87359781 V6 IMPINEFF 4.364842681 4.79767442 0.00943912 V7 IMPORT 4.287414501 4.16101231 -0.27428181 V9 PCVUTL 4.161012312 88.80396717 7.15690834 V10 JOBSAT -0.274281806 7.15690834 18.14514364
Determinant 7885612656 Ln 22.788306
Set Covariances of Exogenous Manifest Variables
V10
NOTE: Some initial estimates computed by instrumental variable method.
NOTE: Some initial estimates computed by two-stage LS method.
NOTE: Some initial estimates computed by McDonald's method.
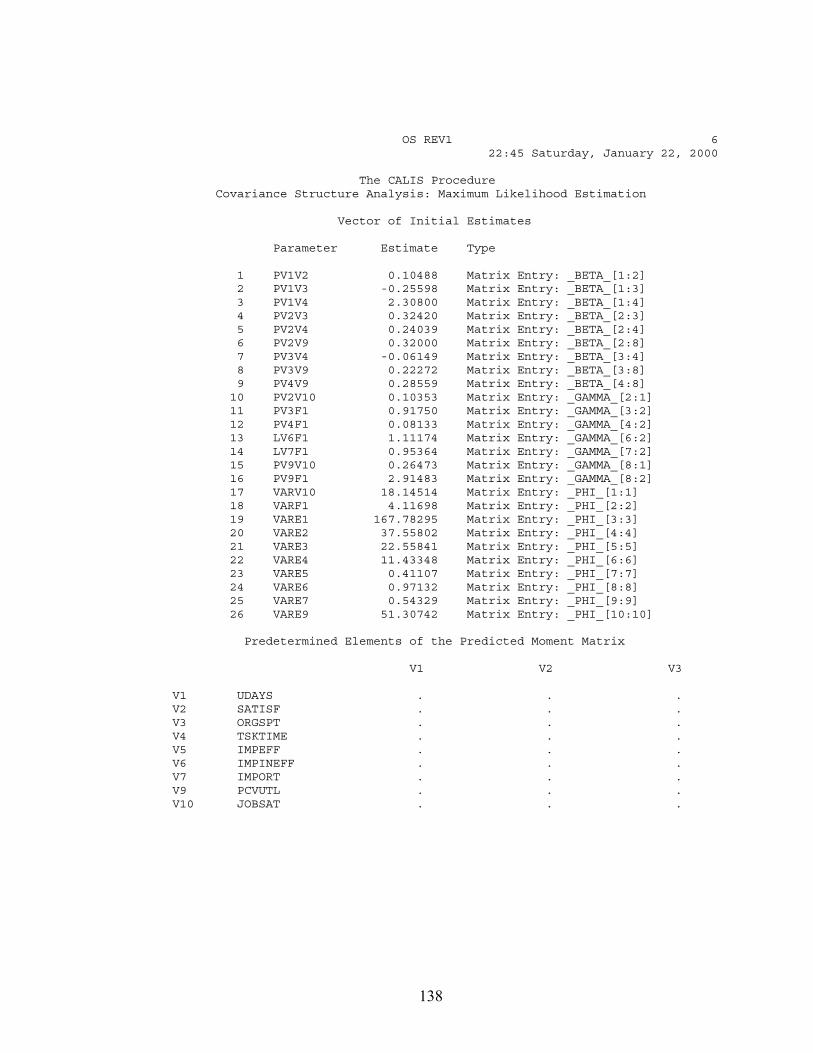
138
OS REV1 6 22:45 Saturday, January 22, 2000
The CALIS Procedure Covariance Structure Analysis: Maximum Likelihood Estimation
Vector of Initial Estimates
Parameter Estimate Type
1 PV1V2 0.10488 Matrix Entry: _BETA_[1:2] 2 PV1V3 -0.25598 Matrix Entry: _BETA_[1:3] 3 PV1V4 2.30800 Matrix Entry: _BETA_[1:4] 4 PV2V3 0.32420 Matrix Entry: _BETA_[2:3] 5 PV2V4 0.24039 Matrix Entry: _BETA_[2:4] 6 PV2V9 0.32000 Matrix Entry: _BETA_[2:8] 7 PV3V4 -0.06149 Matrix Entry: _BETA_[3:4] 8 PV3V9 0.22272 Matrix Entry: _BETA_[3:8] 9 PV4V9 0.28559 Matrix Entry: _BETA_[4:8] 10 PV2V10 0.10353 Matrix Entry: _GAMMA_[2:1] 11 PV3F1 0.91750 Matrix Entry: _GAMMA_[3:2] 12 PV4F1 0.08133 Matrix Entry: _GAMMA_[4:2] 13 LV6F1 1.11174 Matrix Entry: _GAMMA_[6:2] 14 LV7F1 0.95364 Matrix Entry: _GAMMA_[7:2] 15 PV9V10 0.26473 Matrix Entry: _GAMMA_[8:1] 16 PV9F1 2.91483 Matrix Entry: _GAMMA_[8:2] 17 VARV10 18.14514 Matrix Entry: _PHI_[1:1] 18 VARF1 4.11698 Matrix Entry: _PHI_[2:2] 19 VARE1 167.78295 Matrix Entry: _PHI_[3:3] 20 VARE2 37.55802 Matrix Entry: _PHI_[4:4] 21 VARE3 22.55841 Matrix Entry: _PHI_[5:5] 22 VARE4 11.43348 Matrix Entry: _PHI_[6:6] 23 VARE5 0.41107 Matrix Entry: _PHI_[7:7] 24 VARE6 0.97132 Matrix Entry: _PHI_[8:8] 25 VARE7 0.54329 Matrix Entry: _PHI_[9:9] 26 VARE9 51.30742 Matrix Entry: _PHI_[10:10]
Predetermined Elements of the Predicted Moment Matrix
V1 V2 V3
V1 UDAYS . . . V2 SATISF . . . V3 ORGSPT . . . V4 TSKTIME . . . V5 IMPEFF . . . V6 IMPINEFF . . . V7 IMPORT . . . V9 PCVUTL . . . V10 JOBSAT . . .
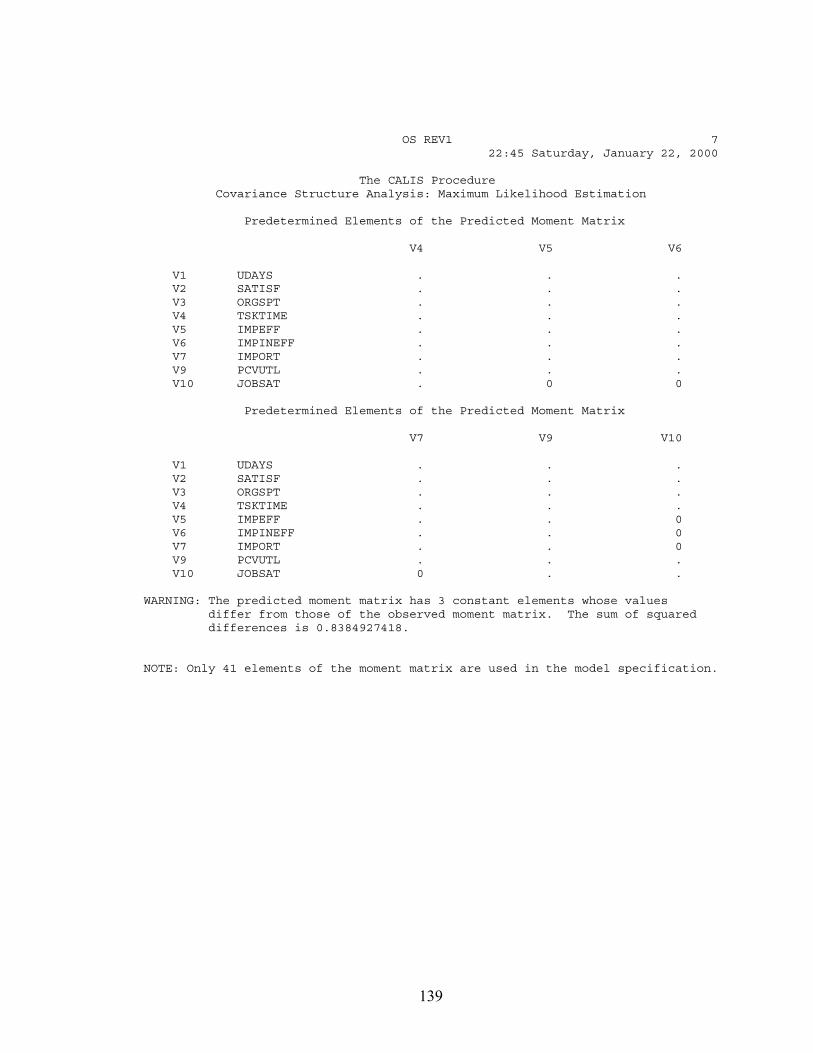
139
OS REV1 7 22:45 Saturday, January 22, 2000
The CALIS Procedure Covariance Structure Analysis: Maximum Likelihood Estimation
Predetermined Elements of the Predicted Moment Matrix
V4 V5 V6
V1 UDAYS . . . V2 SATISF . . . V3 ORGSPT . . . V4 TSKTIME . . . V5 IMPEFF . . . V6 IMPINEFF . . . V7 IMPORT . . . V9 PCVUTL . . . V10 JOBSAT . 0 0
Predetermined Elements of the Predicted Moment Matrix
V7 V9 V10
V1 UDAYS . . . V2 SATISF . . . V3 ORGSPT . . . V4 TSKTIME . . . V5 IMPEFF . . 0 V6 IMPINEFF . . 0 V7 IMPORT . . 0 V9 PCVUTL . . . V10 JOBSAT 0 . .
WARNING: The predicted moment matrix has 3 constant elements whose values differ from those of the observed moment matrix. The sum of squared differences is 0.8384927418.
NOTE: Only 41 elements of the moment matrix are used in the model specification.
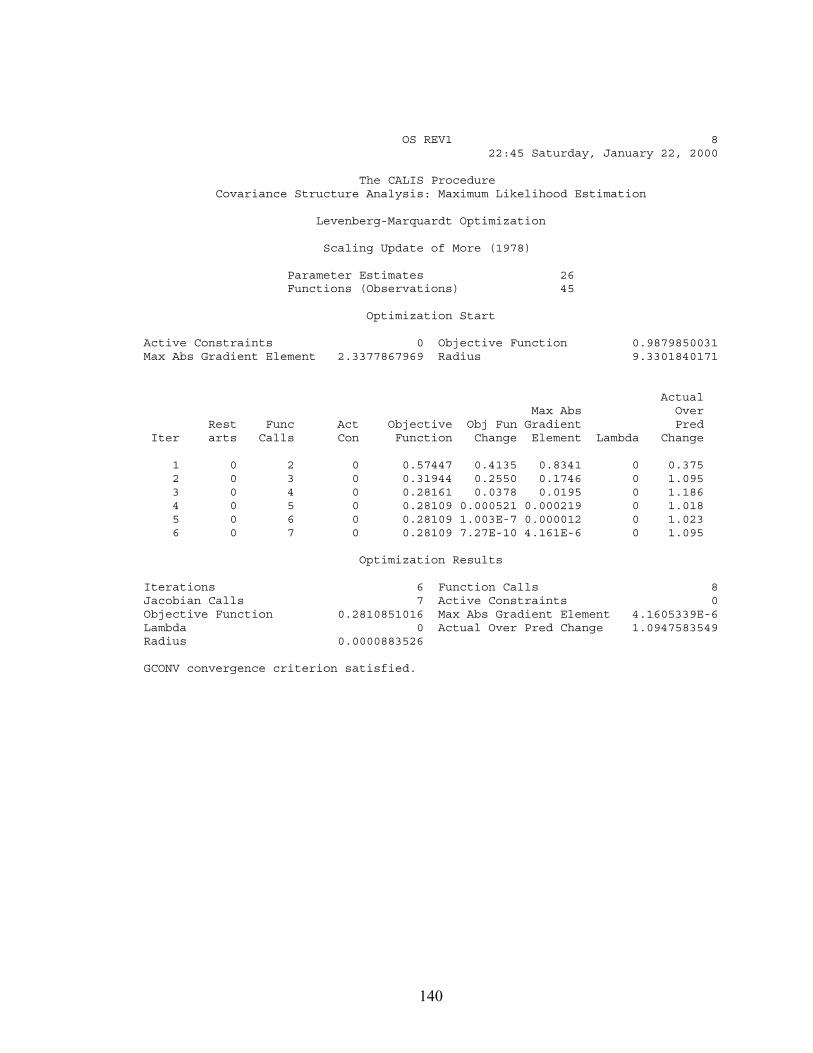
140
OS REV1 8 22:45 Saturday, January 22, 2000
The CALIS Procedure Covariance Structure Analysis: Maximum Likelihood Estimation
Levenberg-Marquardt Optimization
Scaling Update of More (1978)
Parameter Estimates 26 Functions (Observations) 45
Optimization Start
Active Constraints 0 Objective Function 0.9879850031Max Abs Gradient Element 2.3377867969 Radius 9.3301840171
Actual Max Abs Over Rest Func Act Objective Obj Fun Gradient Pred Iter arts Calls Con Function Change Element Lambda Change
1 0 2 0 0.57447 0.4135 0.8341 0 0.375 2 0 3 0 0.31944 0.2550 0.1746 0 1.095 3 0 4 0 0.28161 0.0378 0.0195 0 1.186 4 0 5 0 0.28109 0.000521 0.000219 0 1.018 5 0 6 0 0.28109 1.003E-7 0.000012 0 1.023 6 0 7 0 0.28109 7.27E-10 4.161E-6 0 1.095
Optimization Results
Iterations 6 Function Calls 8Jacobian Calls 7 Active Constraints 0Objective Function 0.2810851016 Max Abs Gradient Element 4.1605339E-6Lambda 0 Actual Over Pred Change 1.0947583549Radius 0.0000883526
GCONV convergence criterion satisfied.
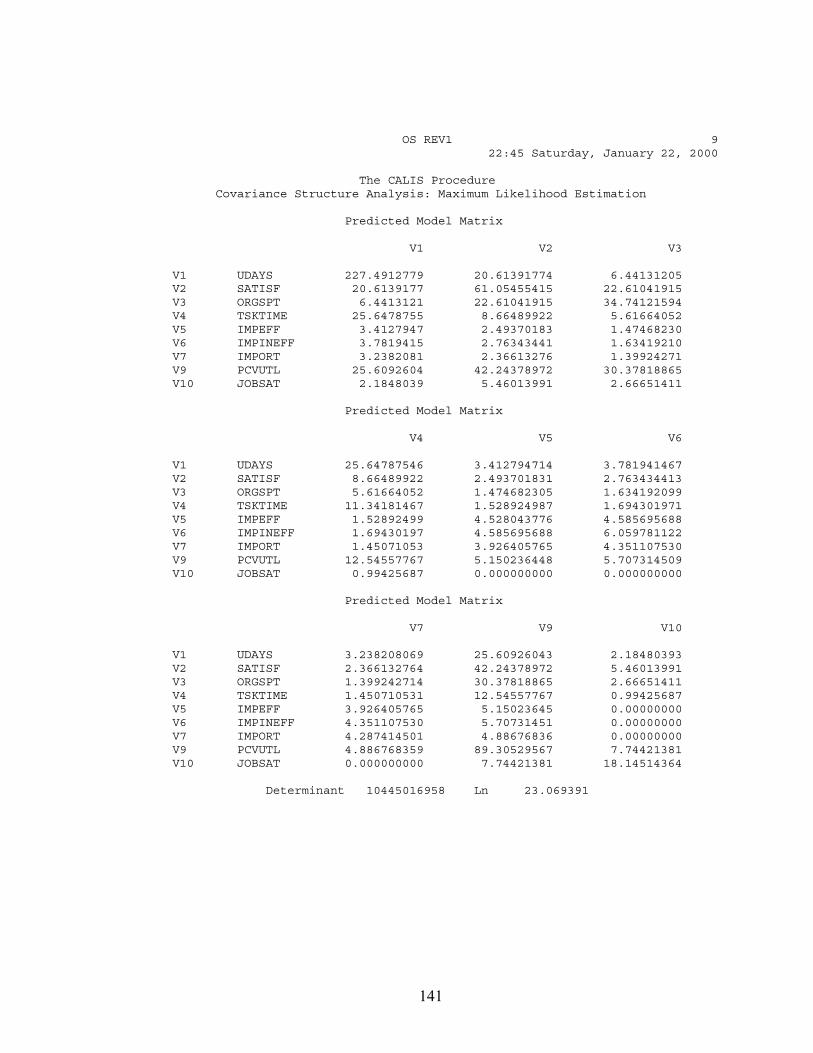
141
OS REV1 9 22:45 Saturday, January 22, 2000
The CALIS Procedure Covariance Structure Analysis: Maximum Likelihood Estimation
Predicted Model Matrix
V1 V2 V3
V1 UDAYS 227.4912779 20.61391774 6.44131205 V2 SATISF 20.6139177 61.05455415 22.61041915 V3 ORGSPT 6.4413121 22.61041915 34.74121594 V4 TSKTIME 25.6478755 8.66489922 5.61664052 V5 IMPEFF 3.4127947 2.49370183 1.47468230 V6 IMPINEFF 3.7819415 2.76343441 1.63419210 V7 IMPORT 3.2382081 2.36613276 1.39924271 V9 PCVUTL 25.6092604 42.24378972 30.37818865 V10 JOBSAT 2.1848039 5.46013991 2.66651411
Predicted Model Matrix
V4 V5 V6
V1 UDAYS 25.64787546 3.412794714 3.781941467 V2 SATISF 8.66489922 2.493701831 2.763434413 V3 ORGSPT 5.61664052 1.474682305 1.634192099 V4 TSKTIME 11.34181467 1.528924987 1.694301971 V5 IMPEFF 1.52892499 4.528043776 4.585695688 V6 IMPINEFF 1.69430197 4.585695688 6.059781122 V7 IMPORT 1.45071053 3.926405765 4.351107530 V9 PCVUTL 12.54557767 5.150236448 5.707314509 V10 JOBSAT 0.99425687 0.000000000 0.000000000
Predicted Model Matrix
V7 V9 V10
V1 UDAYS 3.238208069 25.60926043 2.18480393 V2 SATISF 2.366132764 42.24378972 5.46013991 V3 ORGSPT 1.399242714 30.37818865 2.66651411 V4 TSKTIME 1.450710531 12.54557767 0.99425687 V5 IMPEFF 3.926405765 5.15023645 0.00000000 V6 IMPINEFF 4.351107530 5.70731451 0.00000000 V7 IMPORT 4.287414501 4.88676836 0.00000000 V9 PCVUTL 4.886768359 89.30529567 7.74421381 V10 JOBSAT 0.000000000 7.74421381 18.14514364
Determinant 10445016958 Ln 23.069391
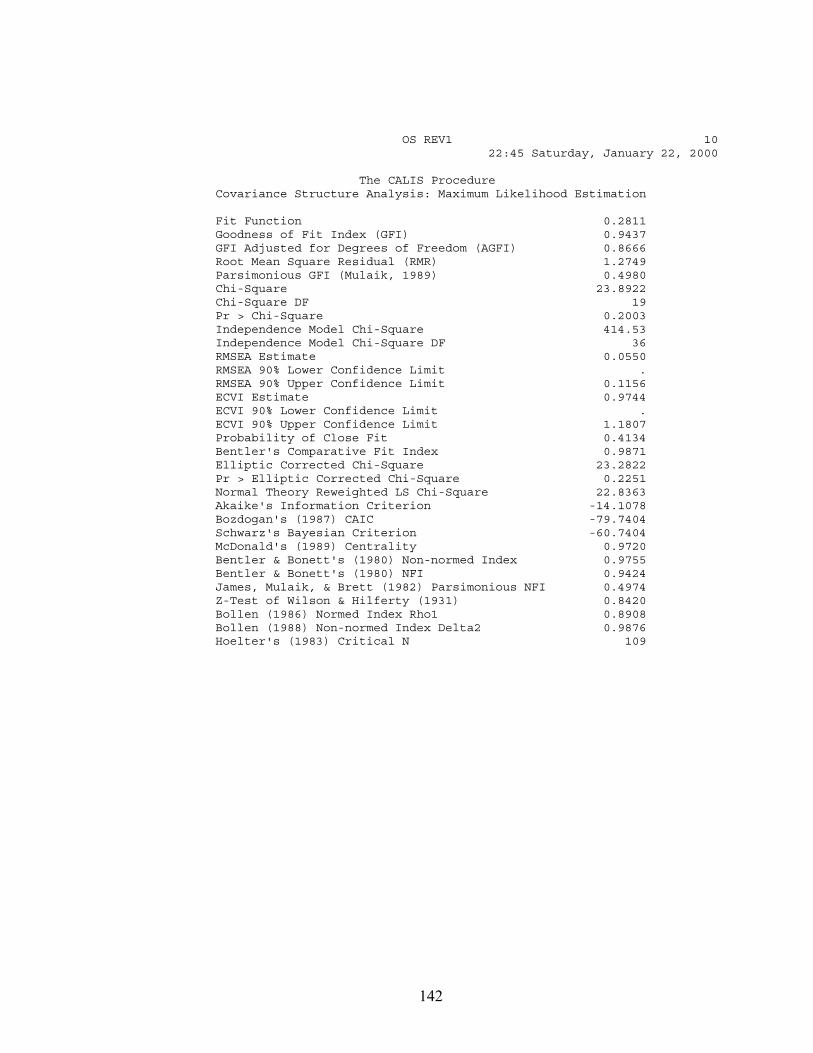
142
OS REV1 10 22:45 Saturday, January 22, 2000
The CALIS Procedure Covariance Structure Analysis: Maximum Likelihood Estimation
Fit Function 0.2811 Goodness of Fit Index (GFI) 0.9437 GFI Adjusted for Degrees of Freedom (AGFI) 0.8666 Root Mean Square Residual (RMR) 1.2749 Parsimonious GFI (Mulaik, 1989) 0.4980 Chi-Square 23.8922 Chi-Square DF 19 Pr > Chi-Square 0.2003 Independence Model Chi-Square 414.53 Independence Model Chi-Square DF 36 RMSEA Estimate 0.0550 RMSEA 90% Lower Confidence Limit . RMSEA 90% Upper Confidence Limit 0.1156 ECVI Estimate 0.9744 ECVI 90% Lower Confidence Limit . ECVI 90% Upper Confidence Limit 1.1807 Probability of Close Fit 0.4134 Bentler's Comparative Fit Index 0.9871 Elliptic Corrected Chi-Square 23.2822 Pr > Elliptic Corrected Chi-Square 0.2251 Normal Theory Reweighted LS Chi-Square 22.8363 Akaike's Information Criterion -14.1078 Bozdogan's (1987) CAIC -79.7404 Schwarz's Bayesian Criterion -60.7404 McDonald's (1989) Centrality 0.9720 Bentler & Bonett's (1980) Non-normed Index 0.9755 Bentler & Bonett's (1980) NFI 0.9424 James, Mulaik, & Brett (1982) Parsimonious NFI 0.4974 Z-Test of Wilson & Hilferty (1931) 0.8420 Bollen (1986) Normed Index Rho1 0.8908 Bollen (1988) Non-normed Index Delta2 0.9876 Hoelter's (1983) Critical N 109
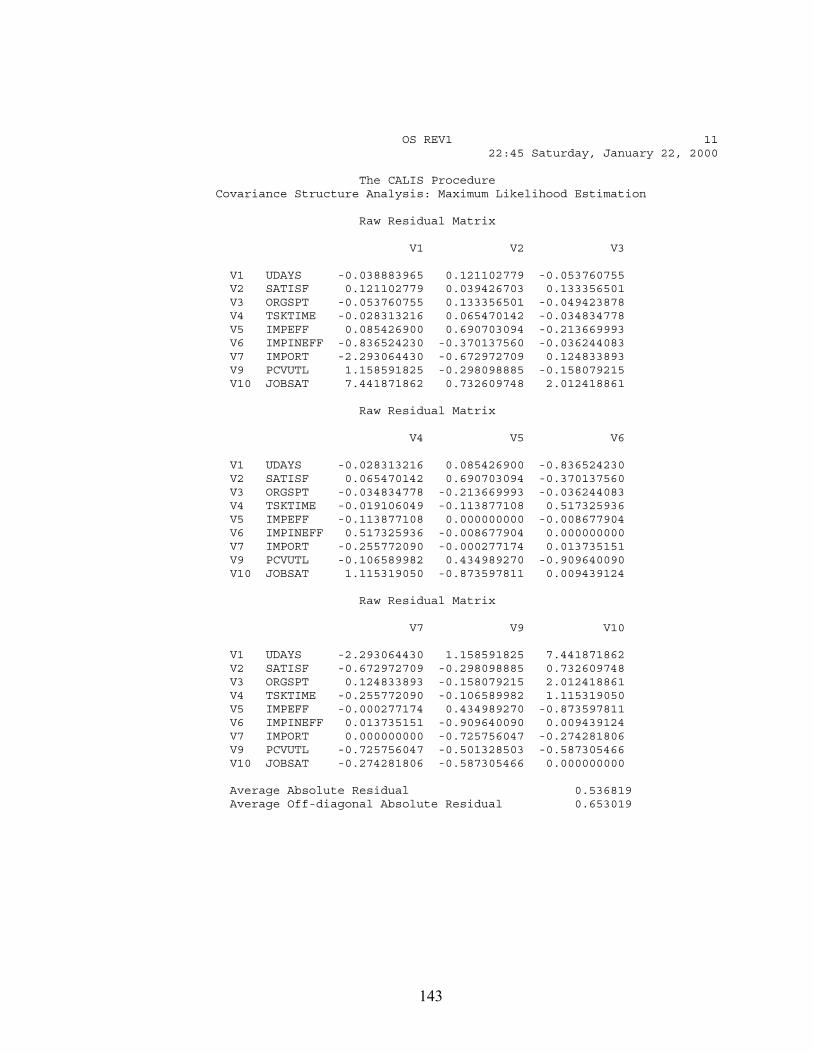
143
OS REV1 11 22:45 Saturday, January 22, 2000
The CALIS Procedure Covariance Structure Analysis: Maximum Likelihood Estimation
Raw Residual Matrix
V1 V2 V3
V1 UDAYS -0.038883965 0.121102779 -0.053760755 V2 SATISF 0.121102779 0.039426703 0.133356501 V3 ORGSPT -0.053760755 0.133356501 -0.049423878 V4 TSKTIME -0.028313216 0.065470142 -0.034834778 V5 IMPEFF 0.085426900 0.690703094 -0.213669993 V6 IMPINEFF -0.836524230 -0.370137560 -0.036244083 V7 IMPORT -2.293064430 -0.672972709 0.124833893 V9 PCVUTL 1.158591825 -0.298098885 -0.158079215 V10 JOBSAT 7.441871862 0.732609748 2.012418861
Raw Residual Matrix
V4 V5 V6
V1 UDAYS -0.028313216 0.085426900 -0.836524230 V2 SATISF 0.065470142 0.690703094 -0.370137560 V3 ORGSPT -0.034834778 -0.213669993 -0.036244083 V4 TSKTIME -0.019106049 -0.113877108 0.517325936 V5 IMPEFF -0.113877108 0.000000000 -0.008677904 V6 IMPINEFF 0.517325936 -0.008677904 0.000000000 V7 IMPORT -0.255772090 -0.000277174 0.013735151 V9 PCVUTL -0.106589982 0.434989270 -0.909640090 V10 JOBSAT 1.115319050 -0.873597811 0.009439124
Raw Residual Matrix
V7 V9 V10
V1 UDAYS -2.293064430 1.158591825 7.441871862 V2 SATISF -0.672972709 -0.298098885 0.732609748 V3 ORGSPT 0.124833893 -0.158079215 2.012418861 V4 TSKTIME -0.255772090 -0.106589982 1.115319050 V5 IMPEFF -0.000277174 0.434989270 -0.873597811 V6 IMPINEFF 0.013735151 -0.909640090 0.009439124 V7 IMPORT 0.000000000 -0.725756047 -0.274281806 V9 PCVUTL -0.725756047 -0.501328503 -0.587305466 V10 JOBSAT -0.274281806 -0.587305466 0.000000000
Average Absolute Residual 0.536819 Average Off-diagonal Absolute Residual 0.653019
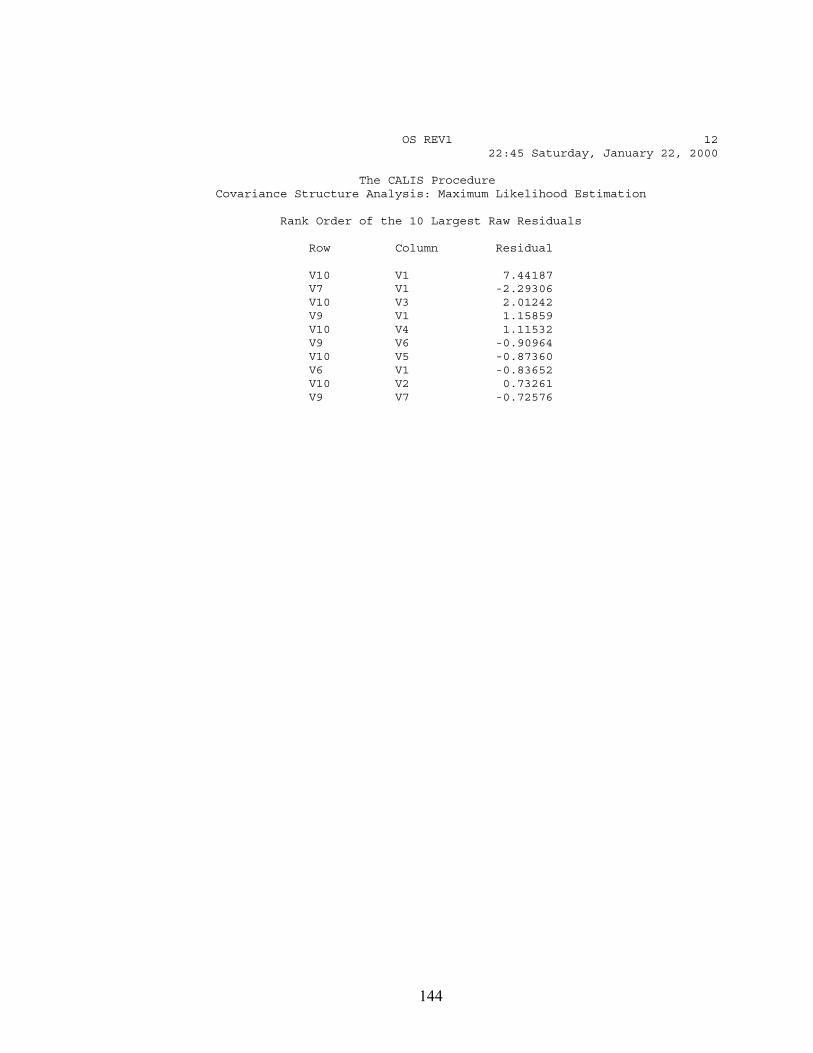
144
OS REV1 12 22:45 Saturday, January 22, 2000
The CALIS Procedure Covariance Structure Analysis: Maximum Likelihood Estimation
Rank Order of the 10 Largest Raw Residuals
Row Column Residual
V10 V1 7.44187 V7 V1 -2.29306 V10 V3 2.01242 V9 V1 1.15859 V10 V4 1.11532 V9 V6 -0.90964 V10 V5 -0.87360 V6 V1 -0.83652 V10 V2 0.73261 V9 V7 -0.72576
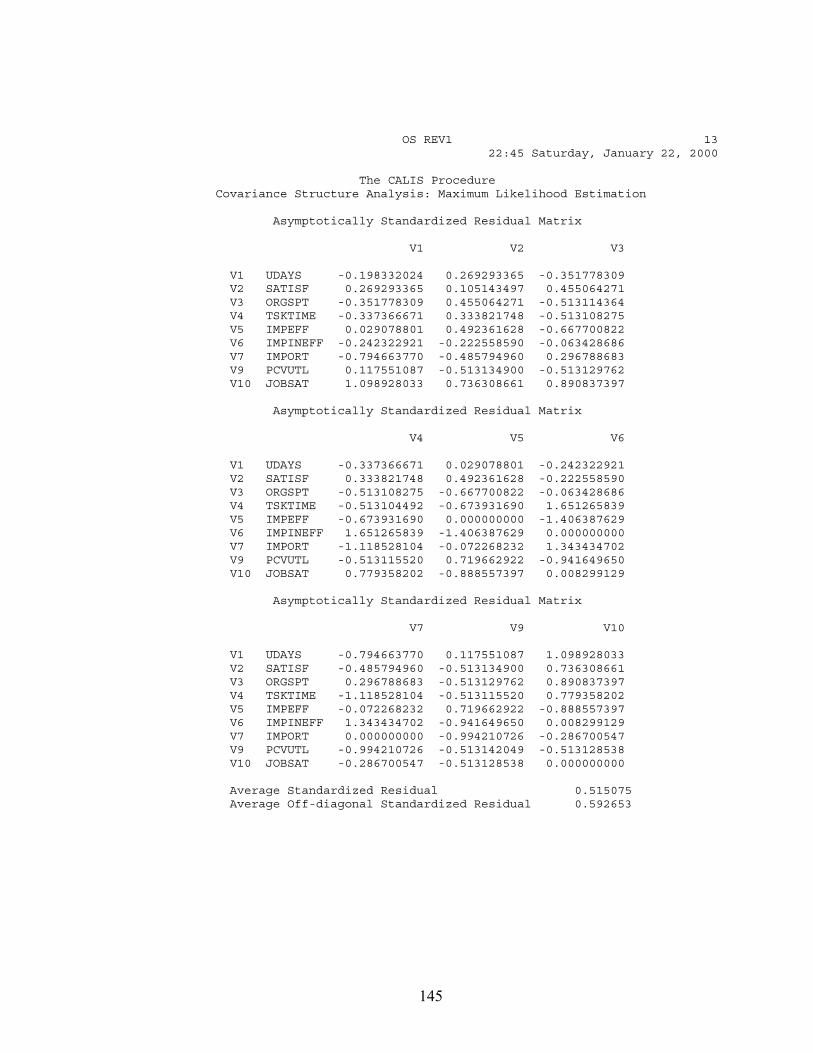
145
OS REV1 13 22:45 Saturday, January 22, 2000
The CALIS Procedure Covariance Structure Analysis: Maximum Likelihood Estimation
Asymptotically Standardized Residual Matrix
V1 V2 V3
V1 UDAYS -0.198332024 0.269293365 -0.351778309 V2 SATISF 0.269293365 0.105143497 0.455064271 V3 ORGSPT -0.351778309 0.455064271 -0.513114364 V4 TSKTIME -0.337366671 0.333821748 -0.513108275 V5 IMPEFF 0.029078801 0.492361628 -0.667700822 V6 IMPINEFF -0.242322921 -0.222558590 -0.063428686 V7 IMPORT -0.794663770 -0.485794960 0.296788683 V9 PCVUTL 0.117551087 -0.513134900 -0.513129762 V10 JOBSAT 1.098928033 0.736308661 0.890837397
Asymptotically Standardized Residual Matrix
V4 V5 V6
V1 UDAYS -0.337366671 0.029078801 -0.242322921 V2 SATISF 0.333821748 0.492361628 -0.222558590 V3 ORGSPT -0.513108275 -0.667700822 -0.063428686 V4 TSKTIME -0.513104492 -0.673931690 1.651265839 V5 IMPEFF -0.673931690 0.000000000 -1.406387629 V6 IMPINEFF 1.651265839 -1.406387629 0.000000000 V7 IMPORT -1.118528104 -0.072268232 1.343434702 V9 PCVUTL -0.513115520 0.719662922 -0.941649650 V10 JOBSAT 0.779358202 -0.888557397 0.008299129
Asymptotically Standardized Residual Matrix
V7 V9 V10
V1 UDAYS -0.794663770 0.117551087 1.098928033 V2 SATISF -0.485794960 -0.513134900 0.736308661 V3 ORGSPT 0.296788683 -0.513129762 0.890837397 V4 TSKTIME -1.118528104 -0.513115520 0.779358202 V5 IMPEFF -0.072268232 0.719662922 -0.888557397 V6 IMPINEFF 1.343434702 -0.941649650 0.008299129 V7 IMPORT 0.000000000 -0.994210726 -0.286700547 V9 PCVUTL -0.994210726 -0.513142049 -0.513128538 V10 JOBSAT -0.286700547 -0.513128538 0.000000000
Average Standardized Residual 0.515075 Average Off-diagonal Standardized Residual 0.592653
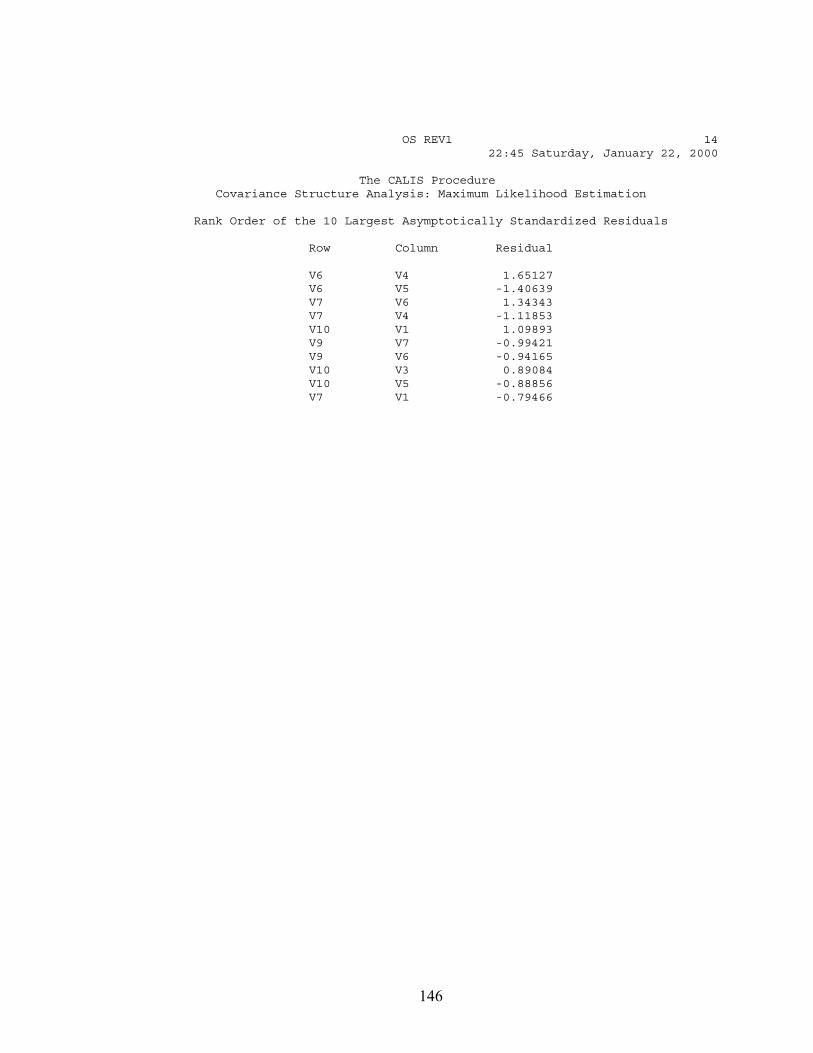
146
OS REV1 14 22:45 Saturday, January 22, 2000
The CALIS Procedure Covariance Structure Analysis: Maximum Likelihood Estimation
Rank Order of the 10 Largest Asymptotically Standardized Residuals
Row Column Residual
V6 V4 1.65127 V6 V5 -1.40639 V7 V6 1.34343 V7 V4 -1.11853 V10 V1 1.09893 V9 V7 -0.99421 V9 V6 -0.94165 V10 V3 0.89084 V10 V5 -0.88856 V7 V1 -0.79466
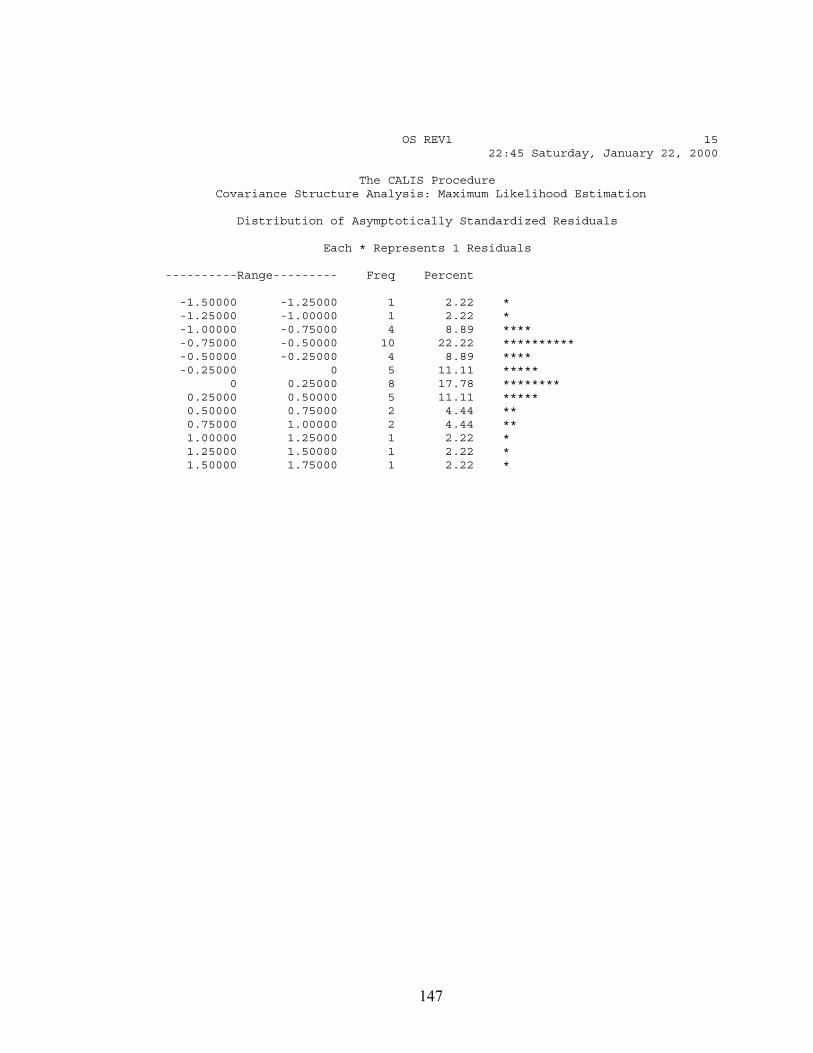
147
OS REV1 15 22:45 Saturday, January 22, 2000
The CALIS Procedure Covariance Structure Analysis: Maximum Likelihood Estimation
Distribution of Asymptotically Standardized Residuals
Each * Represents 1 Residuals
----------Range--------- Freq Percent
-1.50000 -1.25000 1 2.22 * -1.25000 -1.00000 1 2.22 * -1.00000 -0.75000 4 8.89 **** -0.75000 -0.50000 10 22.22 ********** -0.50000 -0.25000 4 8.89 **** -0.25000 0 5 11.11 ***** 0 0.25000 8 17.78 ******** 0.25000 0.50000 5 11.11 ***** 0.50000 0.75000 2 4.44 ** 0.75000 1.00000 2 4.44 ** 1.00000 1.25000 1 2.22 * 1.25000 1.50000 1 2.22 * 1.50000 1.75000 1 2.22 *
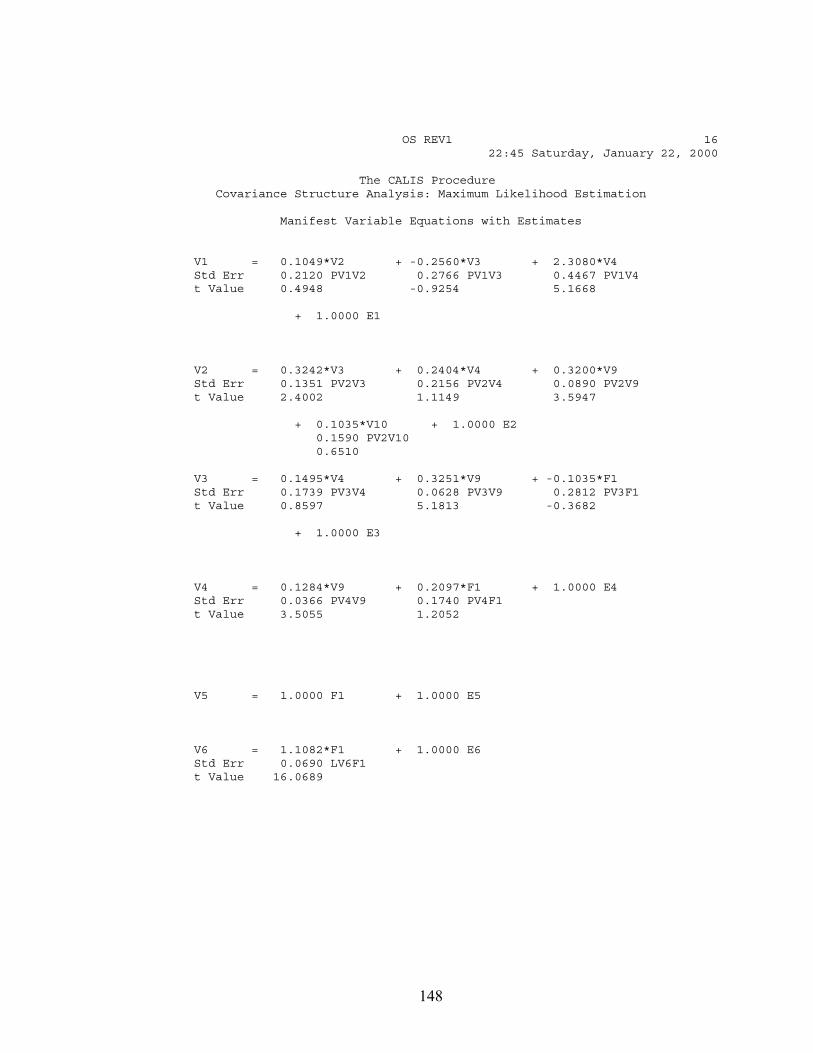
148
OS REV1 16 22:45 Saturday, January 22, 2000
The CALIS Procedure Covariance Structure Analysis: Maximum Likelihood Estimation
Manifest Variable Equations with Estimates
V1 = 0.1049*V2 + -0.2560*V3 + 2.3080*V4 Std Err 0.2120 PV1V2 0.2766 PV1V3 0.4467 PV1V4 t Value 0.4948 -0.9254 5.1668
+ 1.0000 E1
V2 = 0.3242*V3 + 0.2404*V4 + 0.3200*V9 Std Err 0.1351 PV2V3 0.2156 PV2V4 0.0890 PV2V9 t Value 2.4002 1.1149 3.5947
+ 0.1035*V10 + 1.0000 E2 0.1590 PV2V10 0.6510
V3 = 0.1495*V4 + 0.3251*V9 + -0.1035*F1 Std Err 0.1739 PV3V4 0.0628 PV3V9 0.2812 PV3F1 t Value 0.8597 5.1813 -0.3682
+ 1.0000 E3
V4 = 0.1284*V9 + 0.2097*F1 + 1.0000 E4 Std Err 0.0366 PV4V9 0.1740 PV4F1 t Value 3.5055 1.2052
V5 = 1.0000 F1 + 1.0000 E5
V6 = 1.1082*F1 + 1.0000 E6 Std Err 0.0690 LV6F1 t Value 16.0689
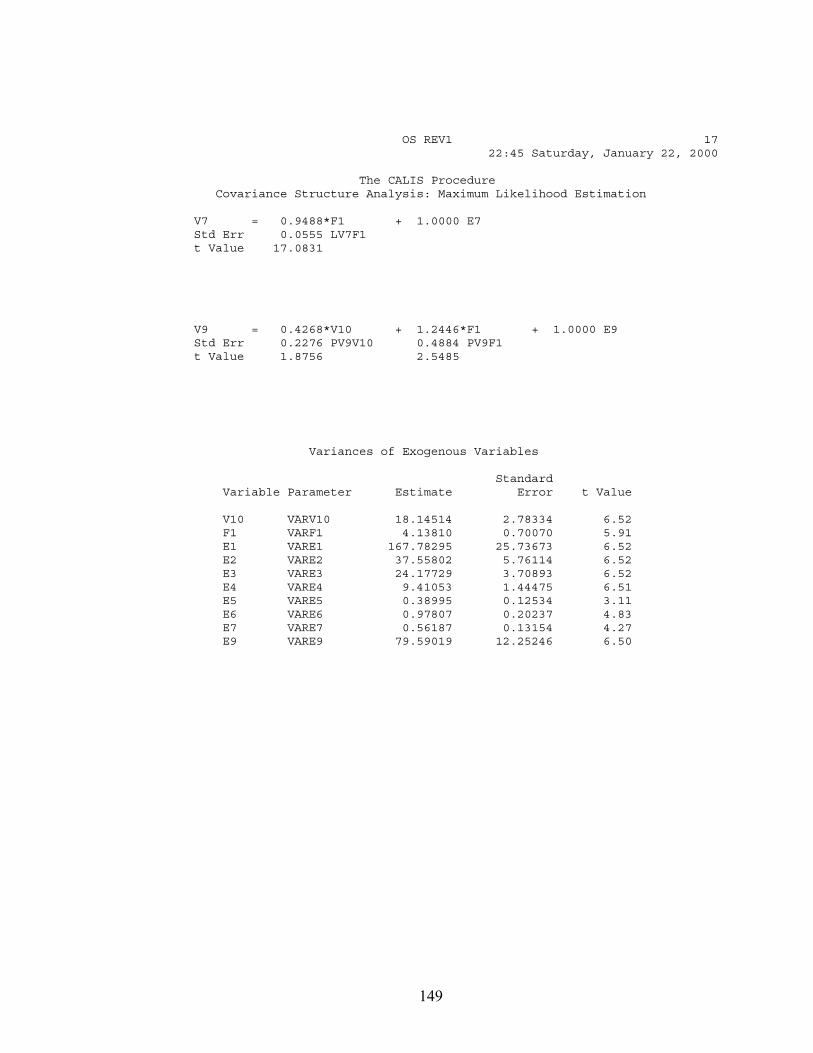
149
OS REV1 17 22:45 Saturday, January 22, 2000
The CALIS Procedure Covariance Structure Analysis: Maximum Likelihood Estimation
V7 = 0.9488*F1 + 1.0000 E7 Std Err 0.0555 LV7F1 t Value 17.0831
V9 = 0.4268*V10 + 1.2446*F1 + 1.0000 E9 Std Err 0.2276 PV9V10 0.4884 PV9F1 t Value 1.8756 2.5485
Variances of Exogenous Variables
Standard Variable Parameter Estimate Error t Value
V10 VARV10 18.14514 2.78334 6.52 F1 VARF1 4.13810 0.70070 5.91 E1 VARE1 167.78295 25.73673 6.52 E2 VARE2 37.55802 5.76114 6.52 E3 VARE3 24.17729 3.70893 6.52 E4 VARE4 9.41053 1.44475 6.51 E5 VARE5 0.38995 0.12534 3.11 E6 VARE6 0.97807 0.20237 4.83 E7 VARE7 0.56187 0.13154 4.27 E9 VARE9 79.59019 12.25246 6.50
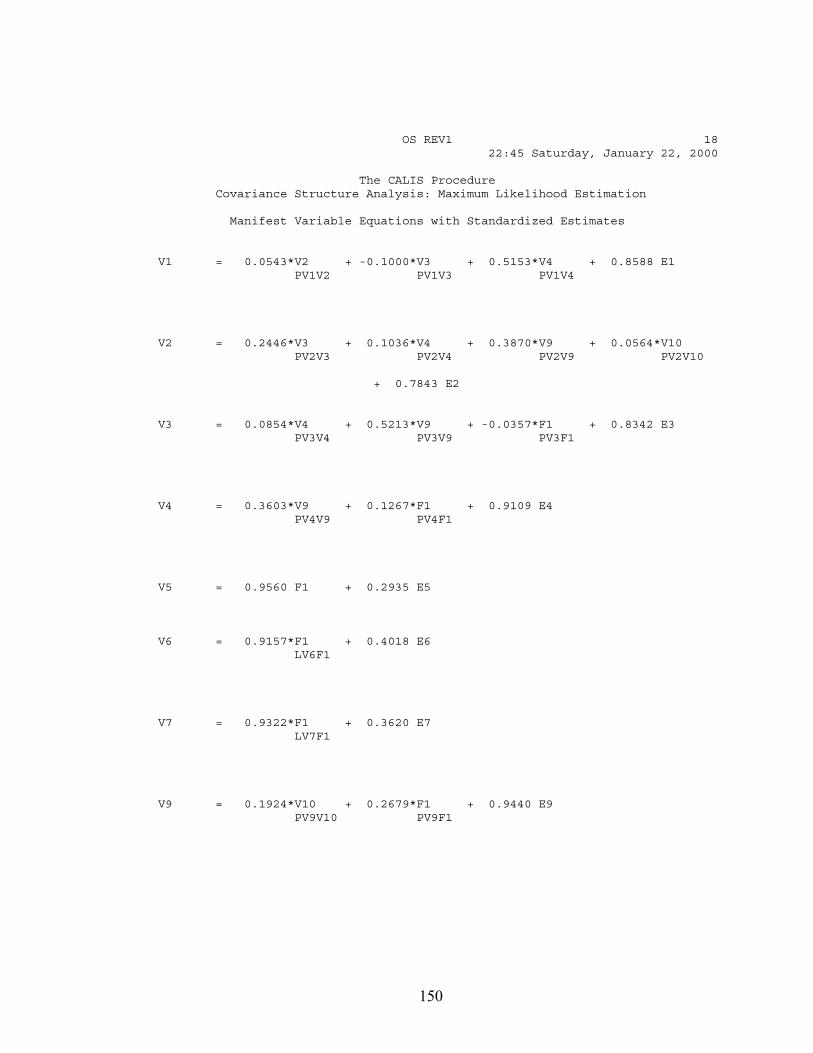
150
OS REV1 18 22:45 Saturday, January 22, 2000
The CALIS Procedure Covariance Structure Analysis: Maximum Likelihood Estimation
Manifest Variable Equations with Standardized Estimates
V1 = 0.0543*V2 + -0.1000*V3 + 0.5153*V4 + 0.8588 E1 PV1V2 PV1V3 PV1V4
V2 = 0.2446*V3 + 0.1036*V4 + 0.3870*V9 + 0.0564*V10 PV2V3 PV2V4 PV2V9 PV2V10
+ 0.7843 E2
V3 = 0.0854*V4 + 0.5213*V9 + -0.0357*F1 + 0.8342 E3 PV3V4 PV3V9 PV3F1
V4 = 0.3603*V9 + 0.1267*F1 + 0.9109 E4 PV4V9 PV4F1
V5 = 0.9560 F1 + 0.2935 E5
V6 = 0.9157*F1 + 0.4018 E6 LV6F1
V7 = 0.9322*F1 + 0.3620 E7 LV7F1
V9 = 0.1924*V10 + 0.2679*F1 + 0.9440 E9 PV9V10 PV9F1
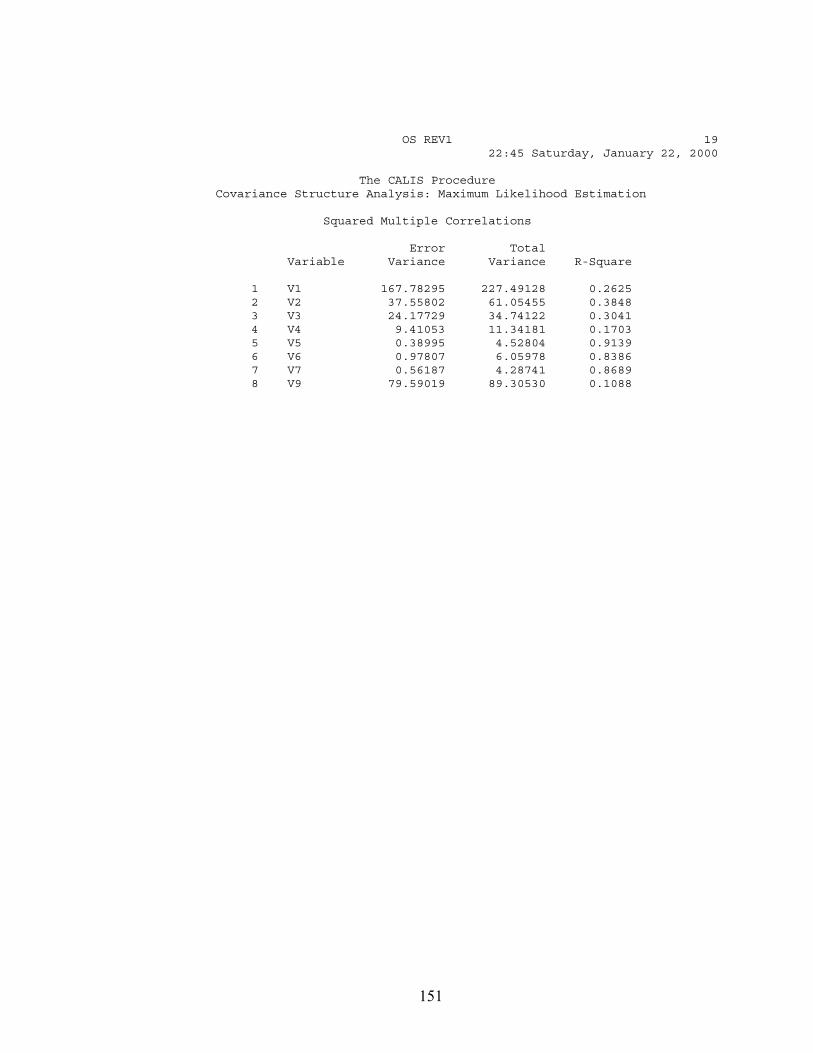
151
OS REV1 19 22:45 Saturday, January 22, 2000
The CALIS Procedure Covariance Structure Analysis: Maximum Likelihood Estimation
Squared Multiple Correlations
Error Total Variable Variance Variance R-Square
1 V1 167.78295 227.49128 0.2625 2 V2 37.55802 61.05455 0.3848 3 V3 24.17729 34.74122 0.3041 4 V4 9.41053 11.34181 0.1703 5 V5 0.38995 4.52804 0.9139 6 V6 0.97807 6.05978 0.8386 7 V7 0.56187 4.28741 0.8689 8 V9 79.59019 89.30530 0.1088
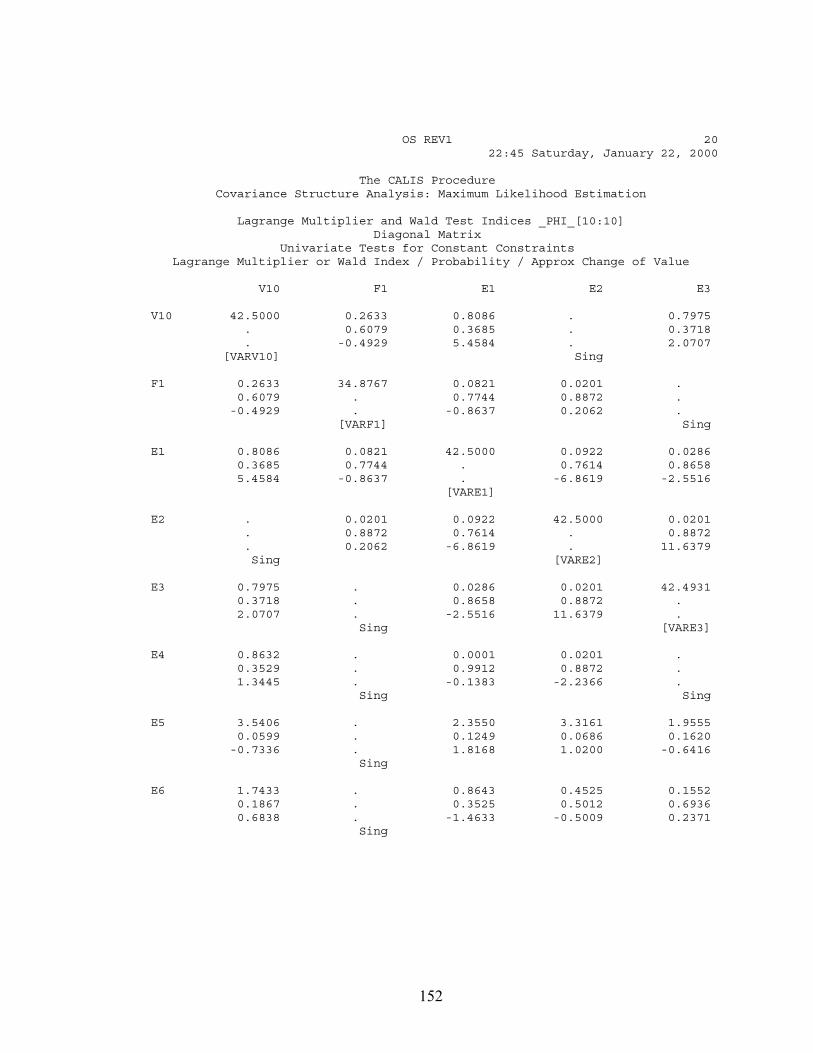
152
OS REV1 20 22:45 Saturday, January 22, 2000
The CALIS Procedure Covariance Structure Analysis: Maximum Likelihood Estimation
Lagrange Multiplier and Wald Test Indices _PHI_[10:10] Diagonal Matrix Univariate Tests for Constant Constraints Lagrange Multiplier or Wald Index / Probability / Approx Change of Value
V10 F1 E1 E2 E3
V10 42.5000 0.2633 0.8086 . 0.7975 . 0.6079 0.3685 . 0.3718 . -0.4929 5.4584 . 2.0707 [VARV10] Sing
F1 0.2633 34.8767 0.0821 0.0201 . 0.6079 . 0.7744 0.8872 . -0.4929 . -0.8637 0.2062 . [VARF1] Sing
E1 0.8086 0.0821 42.5000 0.0922 0.0286 0.3685 0.7744 . 0.7614 0.8658 5.4584 -0.8637 . -6.8619 -2.5516 [VARE1]
E2 . 0.0201 0.0922 42.5000 0.0201 . 0.8872 0.7614 . 0.8872 . 0.2062 -6.8619 . 11.6379 Sing [VARE2]
E3 0.7975 . 0.0286 0.0201 42.4931 0.3718 . 0.8658 0.8872 . 2.0707 . -2.5516 11.6379 . Sing [VARE3]
E4 0.8632 . 0.0001 0.0201 . 0.3529 . 0.9912 0.8872 . 1.3445 . -0.1383 -2.2366 . Sing Sing
E5 3.5406 . 2.3550 3.3161 1.9555 0.0599 . 0.1249 0.0686 0.1620 -0.7336 . 1.8168 1.0200 -0.6416 Sing
E6 1.7433 . 0.8643 0.4525 0.1552 0.1867 . 0.3525 0.5012 0.6936 0.6838 . -1.4633 -0.5009 0.2371 Sing
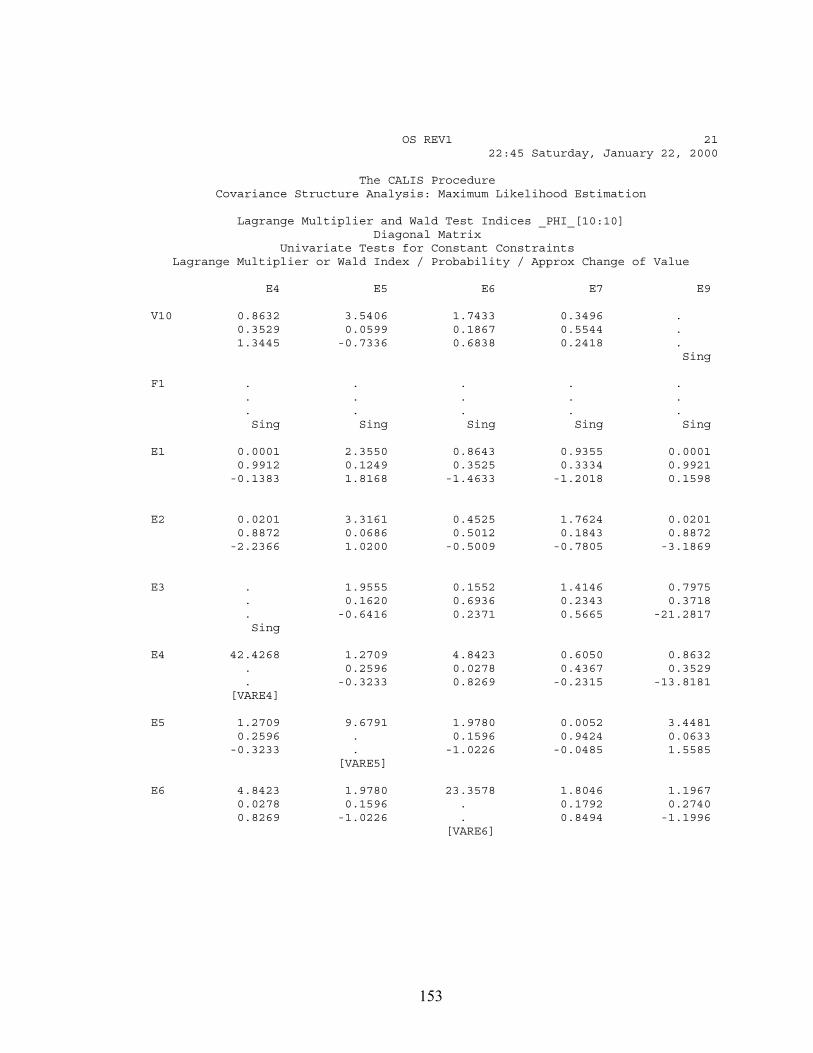
153
OS REV1 21 22:45 Saturday, January 22, 2000
The CALIS Procedure Covariance Structure Analysis: Maximum Likelihood Estimation
Lagrange Multiplier and Wald Test Indices _PHI_[10:10] Diagonal Matrix Univariate Tests for Constant Constraints Lagrange Multiplier or Wald Index / Probability / Approx Change of Value
E4 E5 E6 E7 E9
V10 0.8632 3.5406 1.7433 0.3496 . 0.3529 0.0599 0.1867 0.5544 . 1.3445 -0.7336 0.6838 0.2418 . Sing
F1 . . . . . . . . . . . . . . . Sing Sing Sing Sing Sing
E1 0.0001 2.3550 0.8643 0.9355 0.0001 0.9912 0.1249 0.3525 0.3334 0.9921 -0.1383 1.8168 -1.4633 -1.2018 0.1598
E2 0.0201 3.3161 0.4525 1.7624 0.0201 0.8872 0.0686 0.5012 0.1843 0.8872 -2.2366 1.0200 -0.5009 -0.7805 -3.1869
E3 . 1.9555 0.1552 1.4146 0.7975 . 0.1620 0.6936 0.2343 0.3718 . -0.6416 0.2371 0.5665 -21.2817 Sing
E4 42.4268 1.2709 4.8423 0.6050 0.8632 . 0.2596 0.0278 0.4367 0.3529 . -0.3233 0.8269 -0.2315 -13.8181 [VARE4]
E5 1.2709 9.6791 1.9780 0.0052 3.4481 0.2596 . 0.1596 0.9424 0.0633 -0.3233 . -1.0226 -0.0485 1.5585 [VARE5]
E6 4.8423 1.9780 23.3578 1.8046 1.1967 0.0278 0.1596 . 0.1792 0.2740 0.8269 -1.0226 . 0.8494 -1.1996 [VARE6]
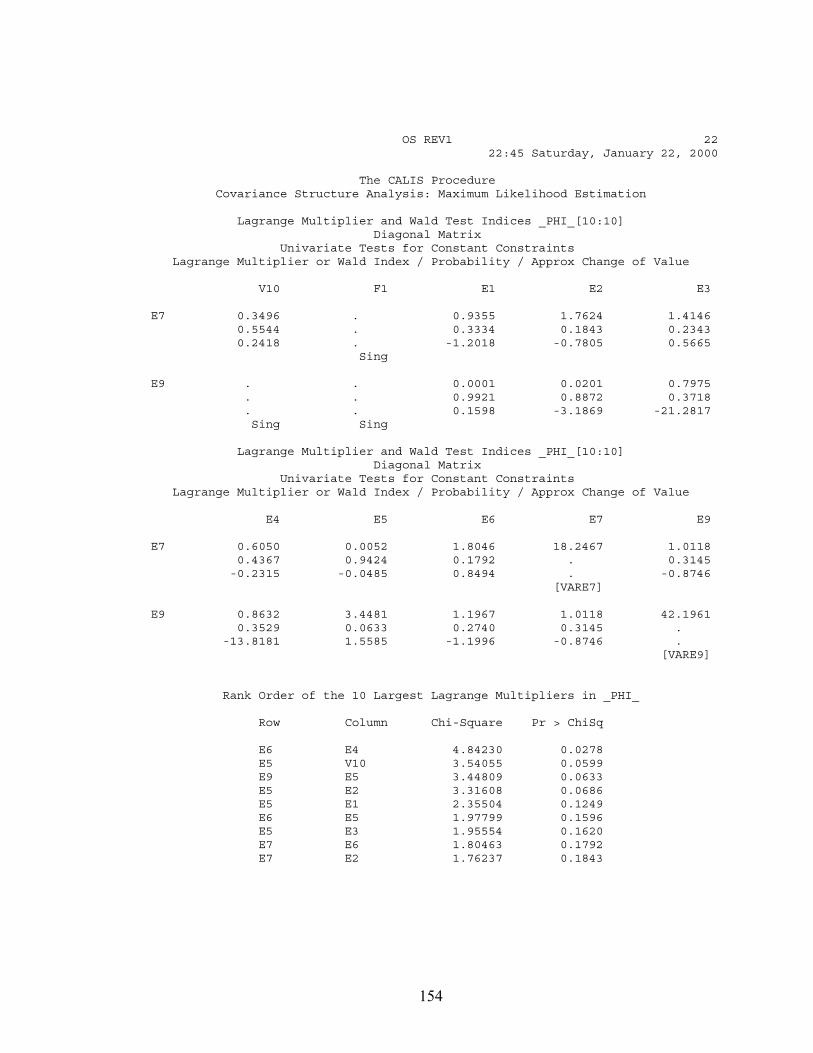
154
OS REV1 22 22:45 Saturday, January 22, 2000
The CALIS Procedure Covariance Structure Analysis: Maximum Likelihood Estimation
Lagrange Multiplier and Wald Test Indices _PHI_[10:10] Diagonal Matrix Univariate Tests for Constant Constraints Lagrange Multiplier or Wald Index / Probability / Approx Change of Value
V10 F1 E1 E2 E3
E7 0.3496 . 0.9355 1.7624 1.4146 0.5544 . 0.3334 0.1843 0.2343 0.2418 . -1.2018 -0.7805 0.5665 Sing
E9 . . 0.0001 0.0201 0.7975 . . 0.9921 0.8872 0.3718 . . 0.1598 -3.1869 -21.2817 Sing Sing
Lagrange Multiplier and Wald Test Indices _PHI_[10:10] Diagonal Matrix Univariate Tests for Constant Constraints Lagrange Multiplier or Wald Index / Probability / Approx Change of Value
E4 E5 E6 E7 E9
E7 0.6050 0.0052 1.8046 18.2467 1.0118 0.4367 0.9424 0.1792 . 0.3145 -0.2315 -0.0485 0.8494 . -0.8746 [VARE7]
E9 0.8632 3.4481 1.1967 1.0118 42.1961 0.3529 0.0633 0.2740 0.3145 . -13.8181 1.5585 -1.1996 -0.8746 . [VARE9]
Rank Order of the 10 Largest Lagrange Multipliers in _PHI_
Row Column Chi-Square Pr > ChiSq
E6 E4 4.84230 0.0278 E5 V10 3.54055 0.0599 E9 E5 3.44809 0.0633 E5 E2 3.31608 0.0686 E5 E1 2.35504 0.1249 E6 E5 1.97799 0.1596 E5 E3 1.95554 0.1620 E7 E6 1.80463 0.1792 E7 E2 1.76237 0.1843
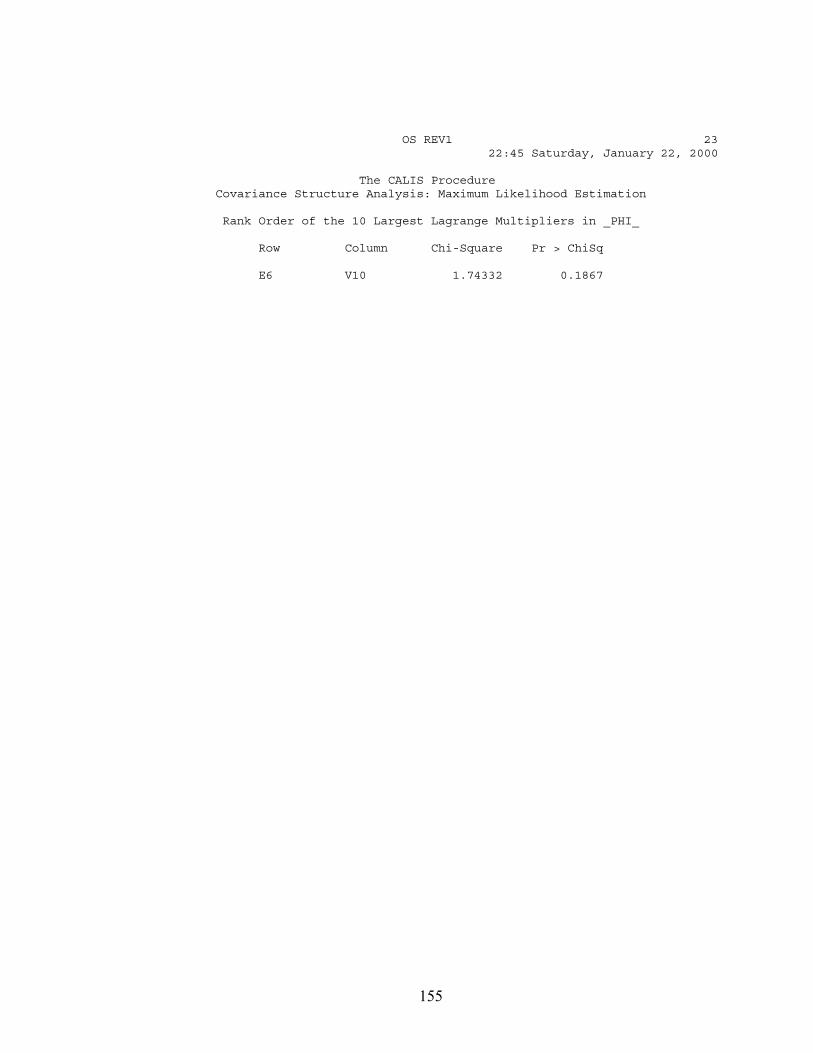
155
OS REV1 23 22:45 Saturday, January 22, 2000
The CALIS Procedure Covariance Structure Analysis: Maximum Likelihood Estimation
Rank Order of the 10 Largest Lagrange Multipliers in _PHI_
Row Column Chi-Square Pr > ChiSq
E6 V10 1.74332 0.1867
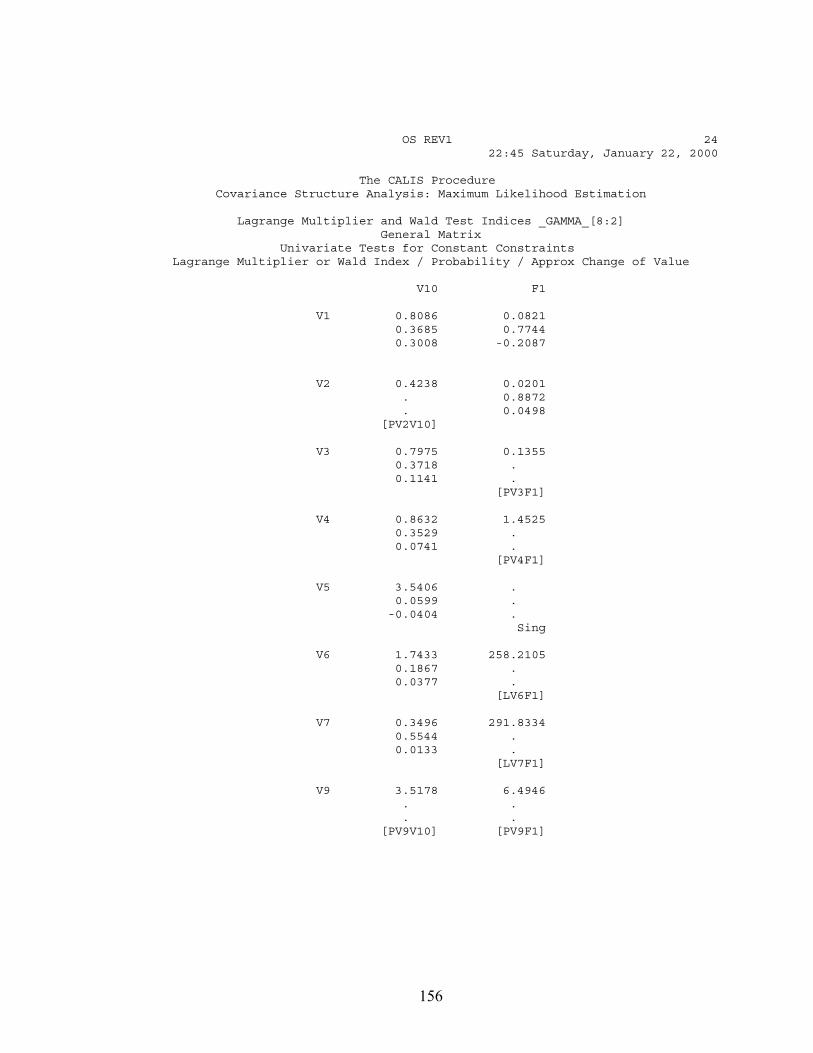
156
OS REV1 24 22:45 Saturday, January 22, 2000
The CALIS Procedure Covariance Structure Analysis: Maximum Likelihood Estimation
Lagrange Multiplier and Wald Test Indices _GAMMA_[8:2] General Matrix Univariate Tests for Constant Constraints Lagrange Multiplier or Wald Index / Probability / Approx Change of Value
V10 F1
V1 0.8086 0.0821 0.3685 0.7744 0.3008 -0.2087
V2 0.4238 0.0201 . 0.8872 . 0.0498 [PV2V10]
V3 0.7975 0.1355 0.3718 . 0.1141 . [PV3F1]
V4 0.8632 1.4525 0.3529 . 0.0741 . [PV4F1]
V5 3.5406 . 0.0599 . -0.0404 . Sing
V6 1.7433 258.2105 0.1867 . 0.0377 . [LV6F1]
V7 0.3496 291.8334 0.5544 . 0.0133 . [LV7F1]
V9 3.5178 6.4946 . . . . [PV9V10] [PV9F1]
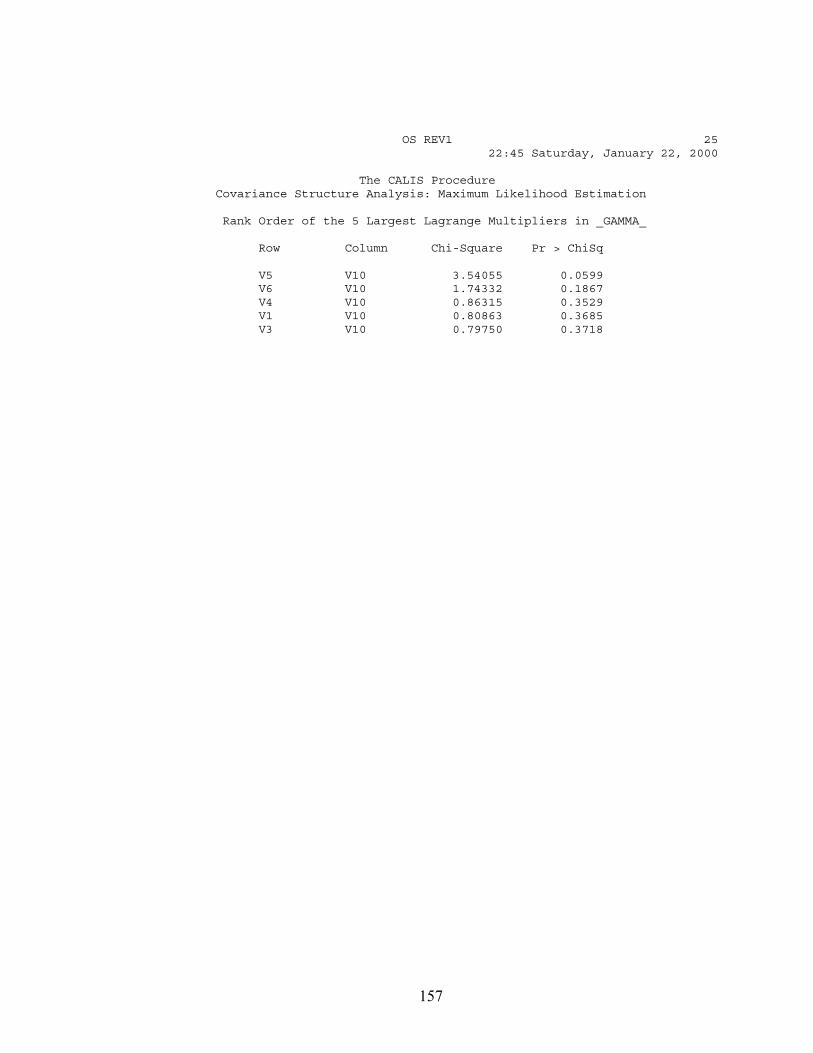
157
OS REV1 25 22:45 Saturday, January 22, 2000
The CALIS Procedure Covariance Structure Analysis: Maximum Likelihood Estimation
Rank Order of the 5 Largest Lagrange Multipliers in _GAMMA_
Row Column Chi-Square Pr > ChiSq
V5 V10 3.54055 0.0599 V6 V10 1.74332 0.1867 V4 V10 0.86315 0.3529 V1 V10 0.80863 0.3685 V3 V10 0.79750 0.3718
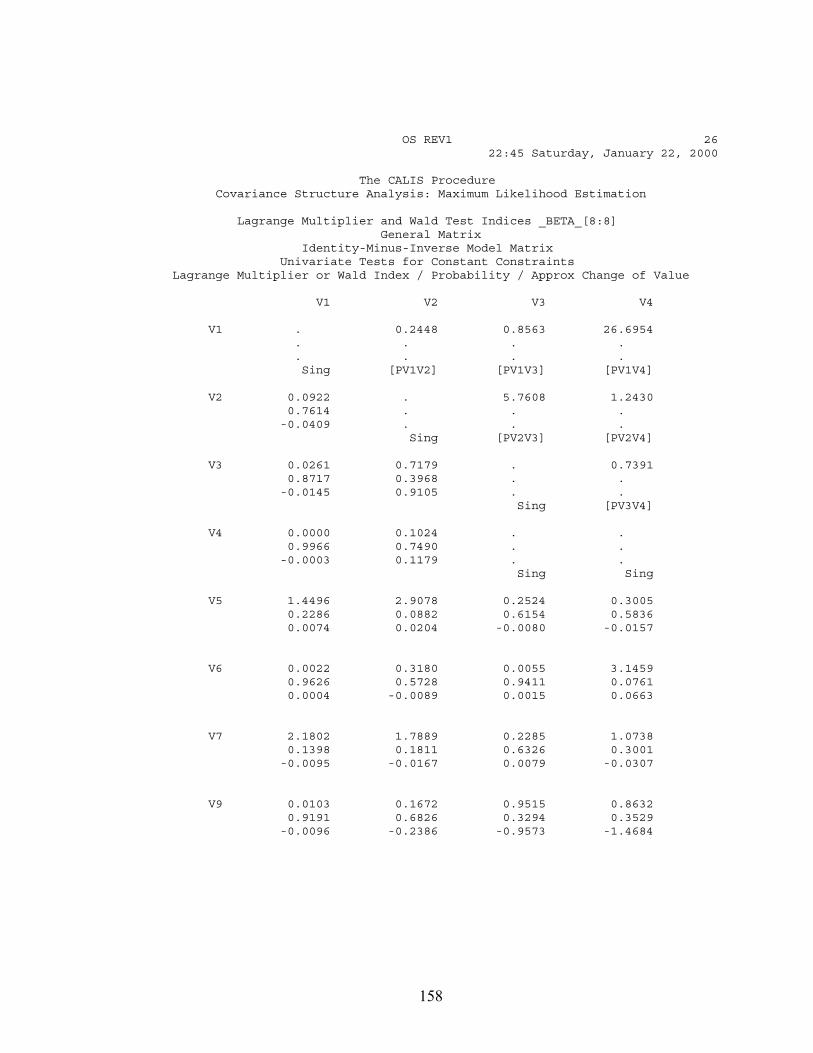
158
OS REV1 26 22:45 Saturday, January 22, 2000
The CALIS Procedure Covariance Structure Analysis: Maximum Likelihood Estimation
Lagrange Multiplier and Wald Test Indices _BETA_[8:8] General Matrix Identity-Minus-Inverse Model Matrix Univariate Tests for Constant Constraints Lagrange Multiplier or Wald Index / Probability / Approx Change of Value
V1 V2 V3 V4
V1 . 0.2448 0.8563 26.6954 . . . . . . . . Sing [PV1V2] [PV1V3] [PV1V4]
V2 0.0922 . 5.7608 1.2430 0.7614 . . . -0.0409 . . . Sing [PV2V3] [PV2V4]
V3 0.0261 0.7179 . 0.7391 0.8717 0.3968 . . -0.0145 0.9105 . . Sing [PV3V4]
V4 0.0000 0.1024 . . 0.9966 0.7490 . . -0.0003 0.1179 . . Sing Sing
V5 1.4496 2.9078 0.2524 0.3005 0.2286 0.0882 0.6154 0.5836 0.0074 0.0204 -0.0080 -0.0157
V6 0.0022 0.3180 0.0055 3.1459 0.9626 0.5728 0.9411 0.0761 0.0004 -0.0089 0.0015 0.0663
V7 2.1802 1.7889 0.2285 1.0738 0.1398 0.1811 0.6326 0.3001 -0.0095 -0.0167 0.0079 -0.0307
V9 0.0103 0.1672 0.9515 0.8632 0.9191 0.6826 0.3294 0.3529 -0.0096 -0.2386 -0.9573 -1.4684
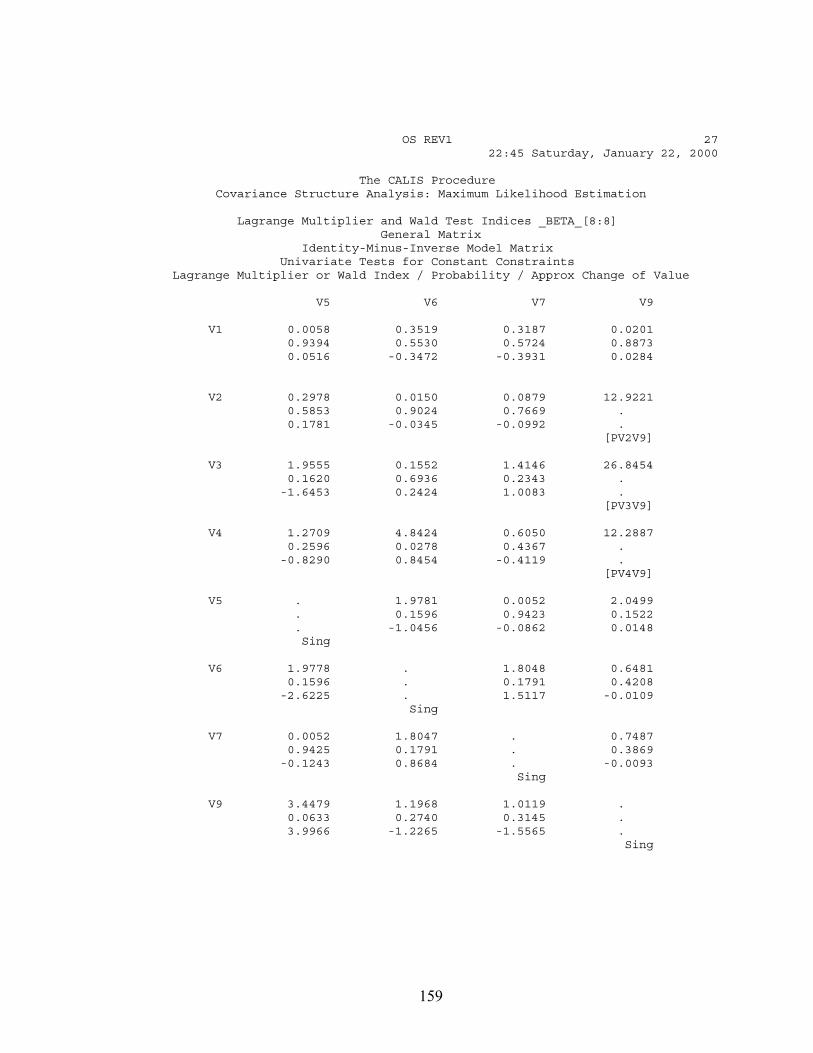
159
OS REV1 27 22:45 Saturday, January 22, 2000
The CALIS Procedure Covariance Structure Analysis: Maximum Likelihood Estimation
Lagrange Multiplier and Wald Test Indices _BETA_[8:8] General Matrix Identity-Minus-Inverse Model Matrix Univariate Tests for Constant Constraints Lagrange Multiplier or Wald Index / Probability / Approx Change of Value
V5 V6 V7 V9
V1 0.0058 0.3519 0.3187 0.0201 0.9394 0.5530 0.5724 0.8873 0.0516 -0.3472 -0.3931 0.0284
V2 0.2978 0.0150 0.0879 12.9221 0.5853 0.9024 0.7669 . 0.1781 -0.0345 -0.0992 . [PV2V9]
V3 1.9555 0.1552 1.4146 26.8454 0.1620 0.6936 0.2343 . -1.6453 0.2424 1.0083 . [PV3V9]
V4 1.2709 4.8424 0.6050 12.2887 0.2596 0.0278 0.4367 . -0.8290 0.8454 -0.4119 . [PV4V9]
V5 . 1.9781 0.0052 2.0499 . 0.1596 0.9423 0.1522 . -1.0456 -0.0862 0.0148 Sing
V6 1.9778 . 1.8048 0.6481 0.1596 . 0.1791 0.4208 -2.6225 . 1.5117 -0.0109 Sing
V7 0.0052 1.8047 . 0.7487 0.9425 0.1791 . 0.3869 -0.1243 0.8684 . -0.0093 Sing
V9 3.4479 1.1968 1.0119 . 0.0633 0.2740 0.3145 . 3.9966 -1.2265 -1.5565 . Sing
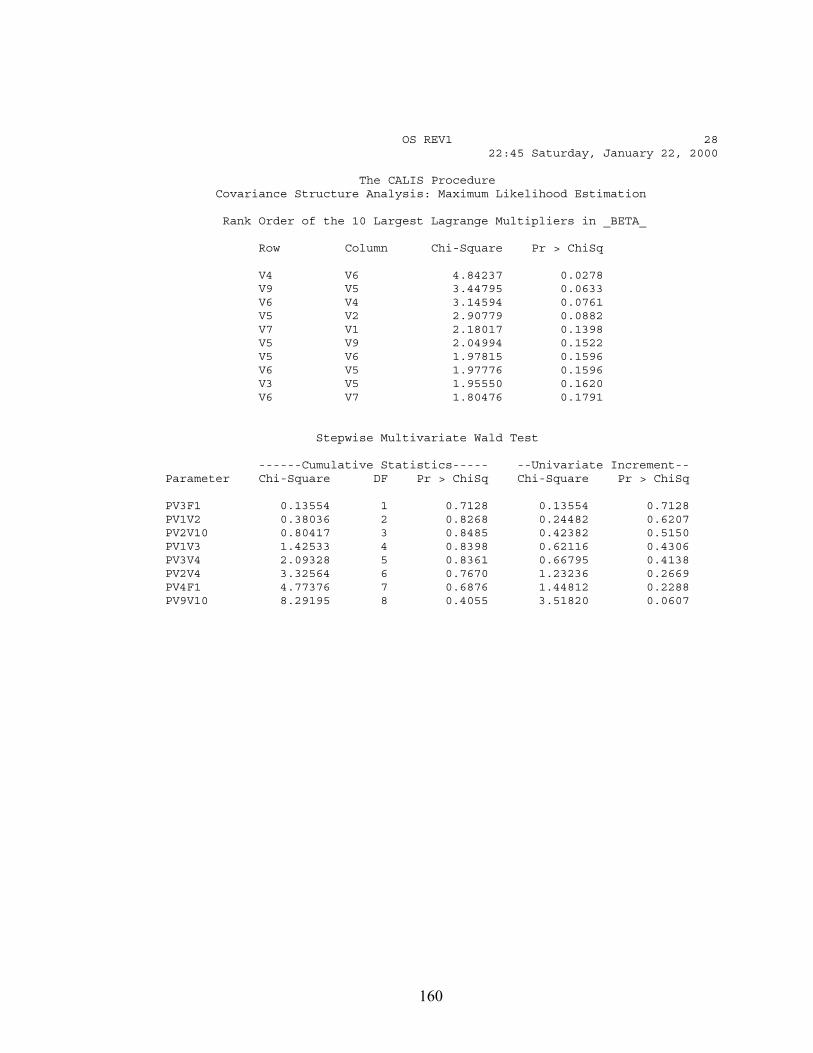
160
OS REV1 28 22:45 Saturday, January 22, 2000
The CALIS Procedure Covariance Structure Analysis: Maximum Likelihood Estimation
Rank Order of the 10 Largest Lagrange Multipliers in _BETA_
Row Column Chi-Square Pr > ChiSq
V4 V6 4.84237 0.0278 V9 V5 3.44795 0.0633 V6 V4 3.14594 0.0761 V5 V2 2.90779 0.0882 V7 V1 2.18017 0.1398 V5 V9 2.04994 0.1522 V5 V6 1.97815 0.1596 V6 V5 1.97776 0.1596 V3 V5 1.95550 0.1620 V6 V7 1.80476 0.1791
Stepwise Multivariate Wald Test
------Cumulative Statistics----- --Univariate Increment-- Parameter Chi-Square DF Pr > ChiSq Chi-Square Pr > ChiSq
PV3F1 0.13554 1 0.7128 0.13554 0.7128 PV1V2 0.38036 2 0.8268 0.24482 0.6207 PV2V10 0.80417 3 0.8485 0.42382 0.5150 PV1V3 1.42533 4 0.8398 0.62116 0.4306 PV3V4 2.09328 5 0.8361 0.66795 0.4138 PV2V4 3.32564 6 0.7670 1.23236 0.2669 PV4F1 4.77376 7 0.6876 1.44812 0.2288 PV9V10 8.29195 8 0.4055 3.51820 0.0607
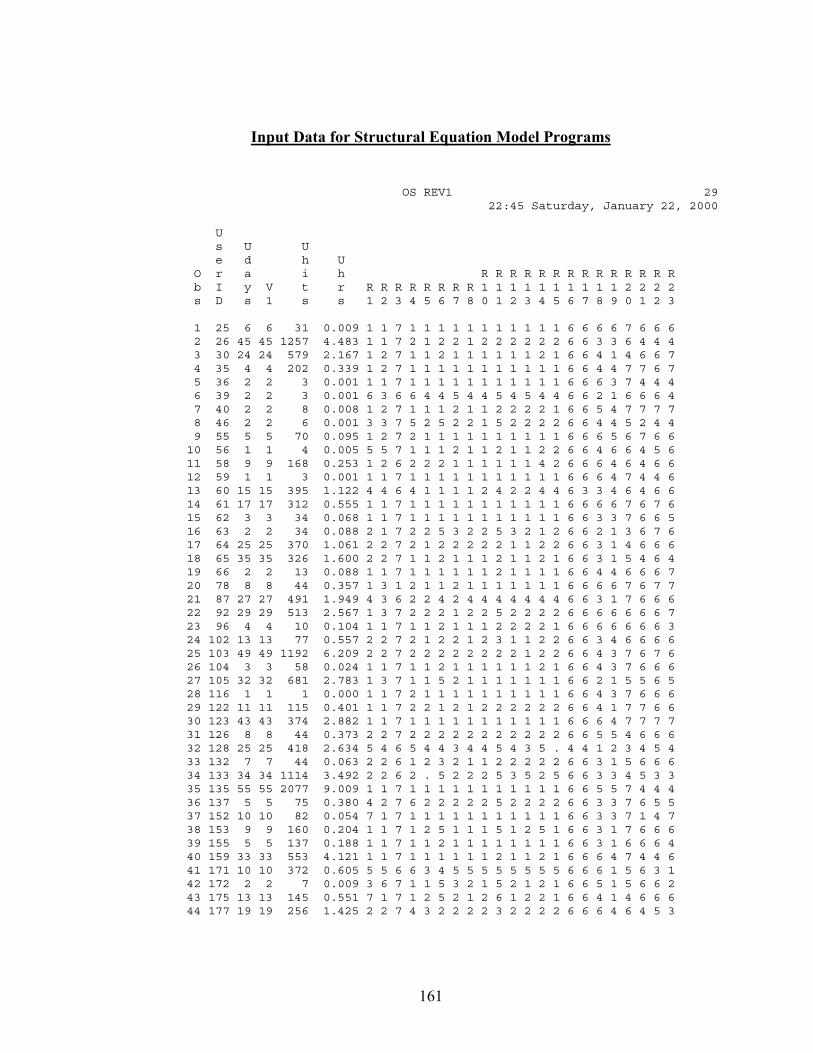
161
Input Data for Structural Equation Model Programs
OS REV1 29 22:45 Saturday, January 22, 2000
U s U U e d h U O r a i h R R R R R R R R R R R R R R b I y V t r R R R R R R R R 1 1 1 1 1 1 1 1 1 1 2 2 2 2 s D s 1 s s 1 2 3 4 5 6 7 8 0 1 2 3 4 5 6 7 8 9 0 1 2 3
1 25 6 6 31 0.009 1 1 7 1 1 1 1 1 1 1 1 1 1 1 6 6 6 6 7 6 6 6 2 26 45 45 1257 4.483 1 1 7 2 1 2 2 1 2 2 2 2 2 2 6 6 3 3 6 4 4 4 3 30 24 24 579 2.167 1 2 7 1 1 2 1 1 1 1 1 1 2 1 6 6 4 1 4 6 6 7 4 35 4 4 202 0.339 1 2 7 1 1 1 1 1 1 1 1 1 1 1 6 6 4 4 7 7 6 7 5 36 2 2 3 0.001 1 1 7 1 1 1 1 1 1 1 1 1 1 1 6 6 6 3 7 4 4 4 6 39 2 2 3 0.001 6 3 6 6 4 4 5 4 4 5 4 5 4 4 6 6 2 1 6 6 6 4 7 40 2 2 8 0.008 1 2 7 1 1 1 2 1 1 2 2 2 2 1 6 6 5 4 7 7 7 7 8 46 2 2 6 0.001 3 3 7 5 2 5 2 2 1 5 2 2 2 2 6 6 4 4 5 2 4 4 9 55 5 5 70 0.095 1 2 7 2 1 1 1 1 1 1 1 1 1 1 6 6 6 5 6 7 6 6 10 56 1 1 4 0.005 5 5 7 1 1 1 2 1 1 2 1 1 2 2 6 6 4 6 6 4 5 6 11 58 9 9 168 0.253 1 2 6 2 2 2 1 1 1 1 1 1 4 2 6 6 6 4 6 4 6 6 12 59 1 1 3 0.001 1 1 7 1 1 1 1 1 1 1 1 1 1 1 6 6 6 4 7 4 4 6 13 60 15 15 395 1.122 4 4 6 4 1 1 1 1 2 4 2 2 4 4 6 3 3 4 6 4 6 6 14 61 17 17 312 0.555 1 1 7 1 1 1 1 1 1 1 1 1 1 1 6 6 6 6 7 6 7 6 15 62 3 3 34 0.068 1 1 7 1 1 1 1 1 1 1 1 1 1 1 6 6 3 3 7 6 6 5 16 63 2 2 34 0.088 2 1 7 2 2 5 3 2 2 5 3 2 1 2 6 6 2 1 3 6 7 6 17 64 25 25 370 1.061 2 2 7 2 1 2 2 2 2 2 1 1 2 2 6 6 3 1 4 6 6 6 18 65 35 35 326 1.600 2 2 7 1 1 2 1 1 1 2 1 1 2 1 6 6 3 1 5 4 6 4 19 66 2 2 13 0.088 1 1 7 1 1 1 1 1 1 2 1 1 1 1 6 6 4 4 6 6 6 7 20 78 8 8 44 0.357 1 3 1 2 1 1 2 1 1 1 1 1 1 1 6 6 6 6 7 6 7 7 21 87 27 27 491 1.949 4 3 6 2 2 4 2 4 4 4 4 4 4 4 6 6 3 1 7 6 6 6 22 92 29 29 513 2.567 1 3 7 2 2 2 1 2 2 5 2 2 2 2 6 6 6 6 6 6 6 7 23 96 4 4 10 0.104 1 1 7 1 1 2 1 1 1 2 2 2 2 1 6 6 6 6 6 6 6 3 24 102 13 13 77 0.557 2 2 7 2 1 2 2 1 2 3 1 1 2 2 6 6 3 4 6 6 6 6 25 103 49 49 1192 6.209 2 2 7 2 2 2 2 2 2 2 2 1 2 2 6 6 4 3 7 6 7 6 26 104 3 3 58 0.024 1 1 7 1 1 2 1 1 1 1 1 1 2 1 6 6 4 3 7 6 6 6 27 105 32 32 681 2.783 1 3 7 1 1 5 2 1 1 1 1 1 1 1 6 6 2 1 5 5 6 5 28 116 1 1 1 0.000 1 1 7 2 1 1 1 1 1 1 1 1 1 1 6 6 4 3 7 6 6 6 29 122 11 11 115 0.401 1 1 7 2 2 1 2 1 2 2 2 2 2 2 6 6 4 1 7 7 6 6 30 123 43 43 374 2.882 1 1 7 1 1 1 1 1 1 1 1 1 1 1 6 6 6 4 7 7 7 7 31 126 8 8 44 0.373 2 2 7 2 2 2 2 2 2 2 2 2 2 2 6 6 5 5 4 6 6 6 32 128 25 25 418 2.634 5 4 6 5 4 4 3 4 4 5 4 3 5 . 4 4 1 2 3 4 5 4 33 132 7 7 44 0.063 2 2 6 1 2 3 2 1 1 2 2 2 2 2 6 6 3 1 5 6 6 6 34 133 34 34 1114 3.492 2 2 6 2 . 5 2 2 2 5 3 5 2 5 6 6 3 3 4 5 3 3 35 135 55 55 2077 9.009 1 1 7 1 1 1 1 1 1 1 1 1 1 1 6 6 5 5 7 4 4 4 36 137 5 5 75 0.380 4 2 7 6 2 2 2 2 2 5 2 2 2 2 6 6 3 3 7 6 5 5 37 152 10 10 82 0.054 7 1 7 1 1 1 1 1 1 1 1 1 1 1 6 6 3 3 7 1 4 7 38 153 9 9 160 0.204 1 1 7 1 2 5 1 1 1 5 1 2 5 1 6 6 3 1 7 6 6 6 39 155 5 5 137 0.188 1 1 7 1 1 2 1 1 1 1 1 1 1 1 6 6 3 1 6 6 6 4 40 159 33 33 553 4.121 1 1 7 1 1 1 1 1 1 2 1 1 2 1 6 6 6 4 7 4 4 6 41 171 10 10 372 0.605 5 5 6 6 3 4 5 5 5 5 5 5 5 5 6 6 6 1 5 6 3 1 42 172 2 2 7 0.009 3 6 7 1 1 5 3 2 1 5 2 1 2 1 6 6 5 1 5 6 6 2 43 175 13 13 145 0.551 7 1 7 1 2 5 2 1 2 6 1 2 2 1 6 6 4 1 4 6 6 6 44 177 19 19 256 1.425 2 2 7 4 3 2 2 2 2 3 2 2 2 2 6 6 6 4 6 4 5 3
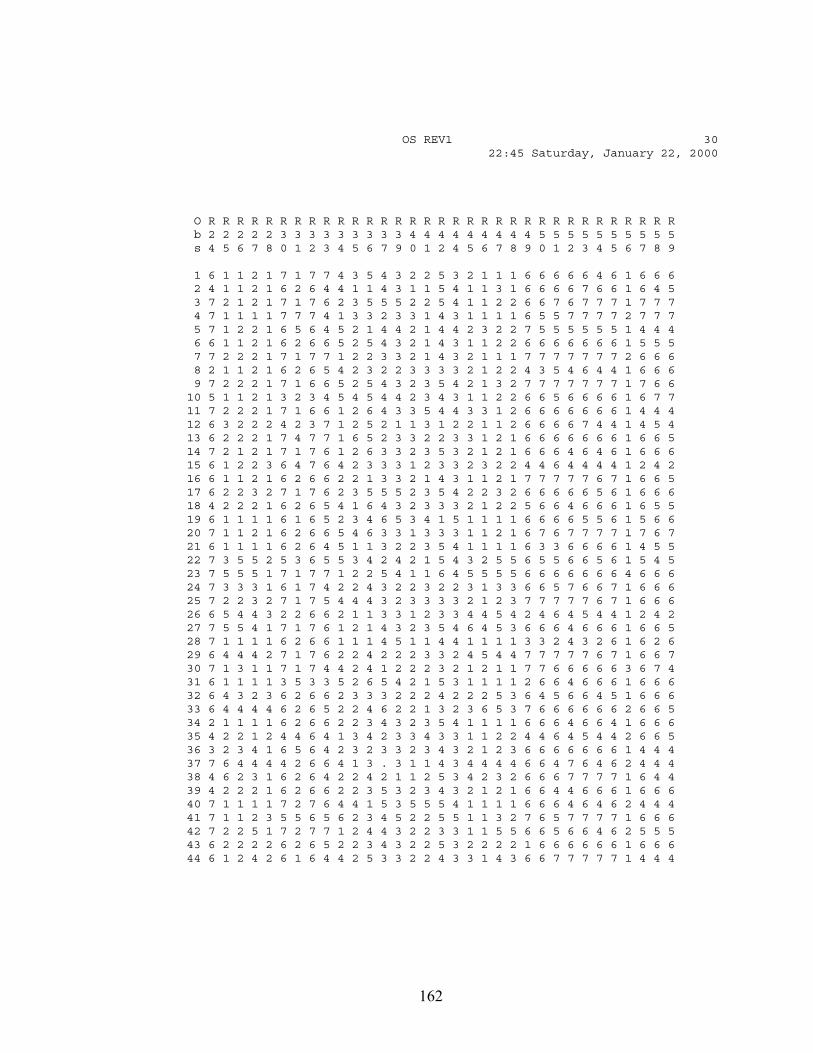
162
OS REV1 30 22:45 Saturday, January 22, 2000
O R R R R R R R R R R R R R R R R R R R R R R R R R R R R R R R R R b 2 2 2 2 2 3 3 3 3 3 3 3 3 3 4 4 4 4 4 4 4 4 4 5 5 5 5 5 5 5 5 5 5 s 4 5 6 7 8 0 1 2 3 4 5 6 7 9 0 1 2 4 5 6 7 8 9 0 1 2 3 4 5 6 7 8 9
1 6 1 1 2 1 7 1 7 7 4 3 5 4 3 2 2 5 3 2 1 1 1 6 6 6 6 6 4 6 1 6 6 6 2 4 1 1 2 1 6 2 6 4 4 1 1 4 3 1 1 5 4 1 1 3 1 6 6 6 6 7 6 6 1 6 4 5 3 7 2 1 2 1 7 1 7 6 2 3 5 5 5 2 2 5 4 1 1 2 2 6 6 7 6 7 7 7 1 7 7 7 4 7 1 1 1 1 7 7 7 4 1 3 3 2 3 3 1 4 3 1 1 1 1 6 5 5 7 7 7 7 2 7 7 7 5 7 1 2 2 1 6 5 6 4 5 2 1 4 4 2 1 4 4 2 3 2 2 7 5 5 5 5 5 5 1 4 4 4 6 6 1 1 2 1 6 2 6 6 5 2 5 4 3 2 1 4 3 1 1 2 2 6 6 6 6 6 6 6 1 5 5 5 7 7 2 2 2 1 7 1 7 7 1 2 2 3 3 2 1 4 3 2 1 1 1 7 7 7 7 7 7 7 2 6 6 6 8 2 1 1 2 1 6 2 6 5 4 2 3 2 2 3 3 3 3 2 1 2 2 4 3 5 4 6 4 4 1 6 6 6 9 7 2 2 2 1 7 1 6 6 5 2 5 4 3 2 3 5 4 2 1 3 2 7 7 7 7 7 7 7 1 7 6 6 10 5 1 1 2 1 3 2 3 4 5 4 5 4 4 2 3 4 3 1 1 2 2 6 6 5 6 6 6 6 1 6 7 7 11 7 2 2 2 1 7 1 6 6 1 2 6 4 3 3 5 4 4 3 3 1 2 6 6 6 6 6 6 6 1 4 4 4 12 6 3 2 2 2 4 2 3 7 1 2 5 2 1 1 3 1 2 2 1 1 2 6 6 6 6 7 4 4 1 4 5 4 13 6 2 2 2 1 7 4 7 7 1 6 5 2 3 3 2 2 3 3 1 2 1 6 6 6 6 6 6 6 1 6 6 5 14 7 2 1 2 1 7 1 7 6 1 2 6 3 3 2 3 5 3 2 1 2 1 6 6 6 4 6 4 6 1 6 6 6 15 6 1 2 2 3 6 4 7 6 4 2 3 3 3 1 2 3 3 2 3 2 2 4 4 6 4 4 4 4 1 2 4 2 16 6 1 1 2 1 6 2 6 6 2 2 1 3 3 2 1 4 3 1 1 2 1 7 7 7 7 7 6 7 1 6 6 5 17 6 2 2 3 2 7 1 7 6 2 3 5 5 5 2 3 5 4 2 2 3 2 6 6 6 6 6 5 6 1 6 6 6 18 4 2 2 2 1 6 2 6 5 4 1 6 4 3 2 3 3 3 2 1 2 2 5 6 6 4 6 6 6 1 6 5 5 19 6 1 1 1 1 6 1 6 5 2 3 4 6 5 3 4 1 5 1 1 1 1 6 6 6 6 5 5 6 1 5 6 6 20 7 1 1 2 1 6 2 6 6 5 4 6 3 3 1 3 3 3 1 1 2 1 6 7 6 7 7 7 7 1 7 6 7 21 6 1 1 1 1 6 2 6 4 5 1 1 3 2 2 3 5 4 1 1 1 1 6 3 3 6 6 6 6 1 4 5 5 22 7 3 5 5 2 5 3 6 5 5 3 4 2 4 2 1 5 4 3 2 5 5 6 5 5 6 6 5 6 1 5 4 5 23 7 5 5 5 1 7 1 7 7 1 2 2 5 4 1 1 6 4 5 5 5 5 6 6 6 6 6 6 6 4 6 6 6 24 7 3 3 3 1 6 1 7 4 2 2 4 3 2 2 3 2 2 3 1 3 3 6 6 5 7 6 6 7 1 6 6 6 25 7 2 2 3 2 7 1 7 5 4 4 4 3 2 3 3 3 3 2 1 2 3 7 7 7 7 7 6 7 1 6 6 6 26 6 5 4 4 3 2 2 6 6 2 1 1 3 3 1 2 3 3 4 4 5 4 2 4 6 4 5 4 4 1 2 4 2 27 7 5 5 4 1 7 1 7 6 1 2 1 4 3 2 3 5 4 6 4 5 3 6 6 6 4 6 6 6 1 6 6 5 28 7 1 1 1 1 6 2 6 6 1 1 1 4 5 1 1 4 4 1 1 1 1 3 3 2 4 3 2 6 1 6 2 6 29 6 4 4 4 2 7 1 7 6 2 2 4 2 2 2 3 3 2 4 5 4 4 7 7 7 7 7 6 7 1 6 6 7 30 7 1 3 1 1 7 1 7 4 4 2 4 1 2 2 2 3 2 1 2 1 1 7 7 6 6 6 6 6 3 6 7 4 31 6 1 1 1 1 3 5 3 3 5 2 6 5 4 2 1 5 3 1 1 1 1 2 6 6 4 6 6 6 1 6 6 6 32 6 4 3 2 3 6 2 6 6 2 3 3 3 2 2 2 4 2 2 2 5 3 6 4 5 6 6 4 5 1 6 6 6 33 6 4 4 4 4 6 2 6 5 2 2 4 6 2 2 1 3 2 3 6 5 3 7 6 6 6 6 6 6 2 6 6 5 34 2 1 1 1 1 6 2 6 6 2 2 3 4 3 2 3 5 4 1 1 1 1 6 6 6 4 6 6 4 1 6 6 6 35 4 2 2 1 2 4 4 6 4 1 3 4 2 3 3 4 3 3 1 1 2 2 4 4 6 4 5 4 4 2 6 6 5 36 3 2 3 4 1 6 5 6 4 2 3 2 3 3 2 3 4 3 2 1 2 3 6 6 6 6 6 6 6 1 4 4 4 37 7 6 4 4 4 4 2 6 6 4 1 3 . 3 1 1 4 3 4 4 4 4 6 6 4 7 6 4 6 2 4 4 4 38 4 6 2 3 1 6 2 6 4 2 2 4 2 1 1 2 5 3 4 2 3 2 6 6 6 7 7 7 7 1 6 4 4 39 4 2 2 2 1 6 2 6 6 2 2 3 5 3 2 3 4 3 2 1 2 1 6 6 4 4 6 6 6 1 6 6 6 40 7 1 1 1 1 7 2 7 6 4 4 1 5 3 5 5 5 4 1 1 1 1 6 6 6 4 6 4 6 2 4 4 4 41 7 1 1 2 3 5 5 6 5 6 2 3 4 5 2 2 5 5 1 1 3 2 7 6 5 7 7 7 7 1 6 6 6 42 7 2 2 5 1 7 2 7 7 1 2 4 4 3 2 2 3 3 1 1 5 5 6 6 5 6 6 4 6 2 5 5 5 43 6 2 2 2 2 6 2 6 5 2 2 3 4 3 2 2 5 3 2 2 2 2 1 6 6 6 6 6 6 1 6 6 6 44 6 1 2 4 2 6 1 6 4 4 2 5 3 3 2 2 4 3 3 1 4 3 6 6 7 7 7 7 7 1 4 4 4
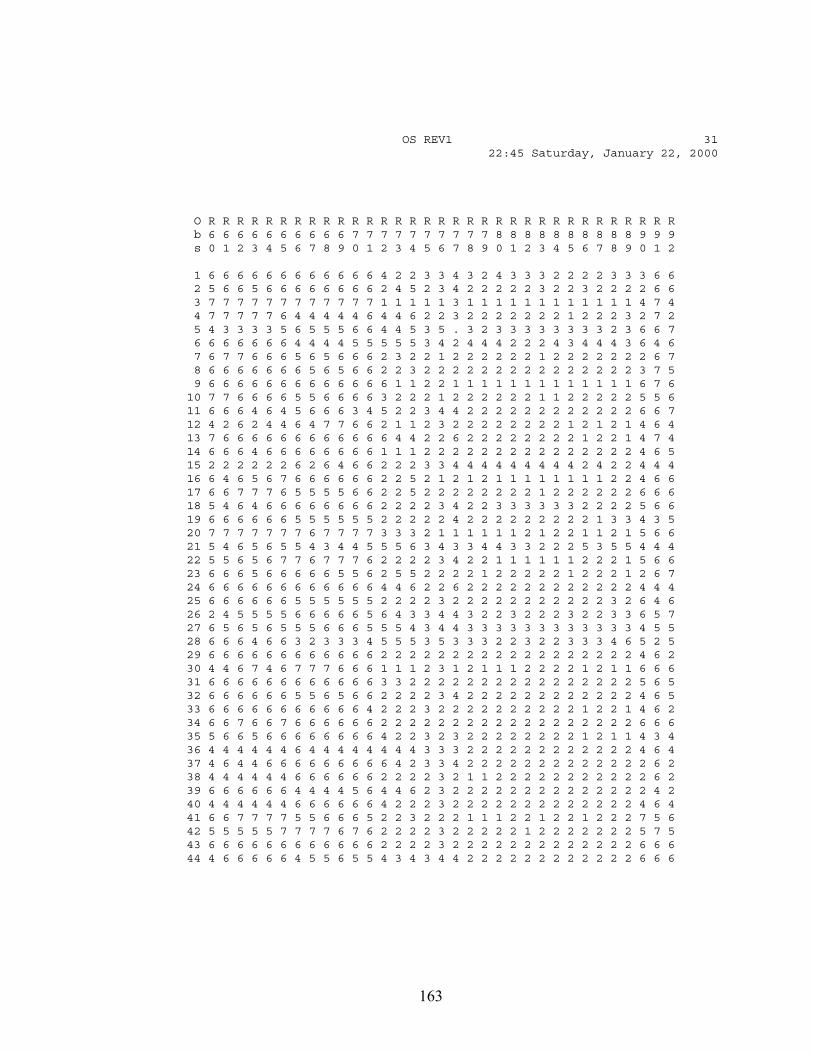
163
OS REV1 31 22:45 Saturday, January 22, 2000
O R R R R R R R R R R R R R R R R R R R R R R R R R R R R R R R R R b 6 6 6 6 6 6 6 6 6 6 7 7 7 7 7 7 7 7 7 7 8 8 8 8 8 8 8 8 8 8 9 9 9 s 0 1 2 3 4 5 6 7 8 9 0 1 2 3 4 5 6 7 8 9 0 1 2 3 4 5 6 7 8 9 0 1 2
1 6 6 6 6 6 6 6 6 6 6 6 6 4 2 2 3 3 4 3 2 4 3 3 3 2 2 2 2 3 3 3 6 6 2 5 6 6 5 6 6 6 6 6 6 6 6 2 4 5 2 3 4 2 2 2 2 2 3 2 2 3 2 2 2 2 6 6 3 7 7 7 7 7 7 7 7 7 7 7 7 1 1 1 1 1 3 1 1 1 1 1 1 1 1 1 1 1 1 4 7 4 4 7 7 7 7 7 6 4 4 4 4 4 6 4 4 6 2 2 3 2 2 2 2 2 2 2 1 2 2 2 3 2 7 2 5 4 3 3 3 3 5 6 5 5 5 6 6 4 4 5 3 5 . 3 2 3 3 3 3 3 3 3 3 2 3 6 6 7 6 6 6 6 6 6 6 4 4 4 4 5 5 5 5 5 3 4 2 4 4 4 2 2 2 4 3 4 4 4 3 6 4 6 7 6 7 7 6 6 6 5 6 5 6 6 6 2 3 2 2 1 2 2 2 2 2 2 1 2 2 2 2 2 2 2 6 7 8 6 6 6 6 6 6 6 5 6 5 6 6 2 2 3 2 2 2 2 2 2 2 2 2 2 2 2 2 2 2 3 7 5 9 6 6 6 6 6 6 6 6 6 6 6 6 6 1 1 2 2 1 1 1 1 1 1 1 1 1 1 1 1 1 6 7 6 10 7 7 6 6 6 6 5 5 6 6 6 6 3 2 2 2 1 2 2 2 2 2 2 1 1 2 2 2 2 2 5 5 6 11 6 6 6 4 6 4 5 6 6 6 3 4 5 2 2 3 4 4 2 2 2 2 2 2 2 2 2 2 2 2 6 6 7 12 4 2 6 2 4 4 6 4 7 7 6 6 2 1 1 2 3 2 2 2 2 2 2 2 2 1 2 1 2 1 4 6 4 13 7 6 6 6 6 6 6 6 6 6 6 6 6 4 4 2 2 6 2 2 2 2 2 2 2 2 1 2 2 1 4 7 4 14 6 6 6 4 6 6 6 6 6 6 6 6 1 1 1 2 2 2 2 2 2 2 2 2 2 2 2 2 2 2 4 6 5 15 2 2 2 2 2 2 6 2 6 4 6 6 2 2 2 3 3 4 4 4 4 4 4 4 4 4 2 4 2 2 4 4 4 16 6 4 6 5 6 7 6 6 6 6 6 6 2 2 5 2 1 2 1 2 1 1 1 1 1 1 1 1 2 2 4 6 6 17 6 6 7 7 7 6 5 5 5 5 6 6 2 2 5 2 2 2 2 2 2 2 2 1 2 2 2 2 2 2 6 6 6 18 5 4 6 4 6 6 6 6 6 6 6 6 2 2 2 2 3 4 2 2 3 3 3 3 3 3 2 2 2 2 5 6 6 19 6 6 6 6 6 6 5 5 5 5 5 5 2 2 2 2 2 4 2 2 2 2 2 2 2 2 2 1 3 3 4 3 5 20 7 7 7 7 7 7 7 6 7 7 7 7 3 3 3 2 1 1 1 1 1 1 2 1 2 2 1 1 2 1 5 6 6 21 5 4 6 5 6 5 5 4 3 4 4 5 5 5 6 3 4 3 3 4 4 3 3 2 2 2 5 3 5 5 4 4 4 22 5 5 6 5 6 7 7 6 7 7 7 6 2 2 2 2 3 4 2 2 1 1 1 1 1 1 2 2 2 1 5 6 6 23 6 6 6 5 6 6 6 6 6 5 5 6 2 5 5 2 2 2 2 1 2 2 2 2 2 1 2 2 2 1 2 6 7 24 6 6 6 6 6 6 6 6 6 6 6 6 4 4 6 2 2 6 2 2 2 2 2 2 2 2 2 2 2 2 4 4 4 25 6 6 6 6 6 6 5 5 5 5 5 5 2 2 2 2 3 2 2 2 2 2 2 2 2 2 2 2 3 2 6 4 6 26 2 4 5 5 5 5 6 6 6 6 6 5 6 4 3 3 4 4 3 2 2 3 2 2 2 3 2 2 3 3 6 5 7 27 6 5 6 5 6 5 5 5 6 6 6 5 5 5 4 3 4 4 3 3 3 3 3 3 3 3 3 3 3 3 4 5 5 28 6 6 6 4 6 6 3 2 3 3 3 4 5 5 5 3 5 3 3 3 2 2 3 2 2 3 3 3 4 6 5 2 5 29 6 6 6 6 6 6 6 6 6 6 6 6 2 2 2 2 2 2 2 2 2 2 2 2 2 2 2 2 2 2 4 6 2 30 4 4 6 7 4 6 7 7 7 6 6 6 1 1 1 2 3 1 2 1 1 1 2 2 2 2 1 2 1 1 6 6 6 31 6 6 6 6 6 6 6 6 6 6 6 6 3 3 2 2 2 2 2 2 2 2 2 2 2 2 2 2 2 2 5 6 5 32 6 6 6 6 6 6 5 5 6 5 6 6 2 2 2 2 3 4 2 2 2 2 2 2 2 2 2 2 2 2 4 6 5 33 6 6 6 6 6 6 6 6 6 6 6 4 2 2 2 3 2 2 2 2 2 2 2 2 2 2 1 2 2 1 4 6 2 34 6 6 7 6 6 7 6 6 6 6 6 6 2 2 2 2 2 2 2 2 2 2 2 2 2 2 2 2 2 2 6 6 6 35 5 6 6 5 6 6 6 6 6 6 6 6 4 2 2 3 2 3 2 2 2 2 2 2 2 2 1 2 1 1 4 3 4 36 4 4 4 4 4 4 6 4 4 4 4 4 4 4 4 3 3 3 2 2 2 2 2 2 2 2 2 2 2 2 4 6 4 37 4 6 4 4 6 6 6 6 6 6 6 6 6 4 2 3 3 4 2 2 2 2 2 2 2 2 2 2 2 2 2 6 2 38 4 4 4 4 4 4 6 6 6 6 6 6 2 2 2 2 3 2 1 1 2 2 2 2 2 2 2 2 2 2 2 6 2 39 6 6 6 6 6 6 4 4 4 4 5 6 4 4 6 2 3 2 2 2 2 2 2 2 2 2 2 2 2 2 2 4 2 40 4 4 4 4 4 4 6 6 6 6 6 6 4 2 2 2 3 2 2 2 2 2 2 2 2 2 2 2 2 2 4 6 4 41 6 6 7 7 7 7 5 5 6 6 6 5 2 2 3 2 2 2 1 1 1 2 2 1 2 2 1 2 2 2 7 5 6 42 5 5 5 5 5 7 7 7 7 6 7 6 2 2 2 2 3 2 2 2 2 2 1 2 2 2 2 2 2 2 5 7 5 43 6 6 6 6 6 6 6 6 6 6 6 6 2 2 2 2 3 2 2 2 2 2 2 2 2 2 2 2 2 2 6 6 6 44 4 6 6 6 6 6 4 5 5 6 5 5 4 3 4 3 4 4 2 2 2 2 2 2 2 2 2 2 2 2 6 6 6
164
OS REV1 32 22:45 Saturday, January 22, 2000
R R R R R R R R R R R R R R R R R R R R R R R R R R R R R R R O R R 1 1 1 1 1 1 1 1 1 1 1 1 1 1 1 1 1 1 1 1 1 1 1 1 1 1 1 1 1 1 1 b 9 9 4 4 4 4 5 5 5 5 5 5 5 5 5 5 6 6 6 6 6 6 6 6 6 6 7 7 7 7 7 7 7 s 3 4 6 7 8 9 0 1 2 3 4 5 6 7 8 9 0 1 2 3 4 5 6 7 8 9 0 1 2 3 4 5 6
1 3 4 . . . . . . . . . . . . . . . . . . . . . . . . . . . . . . . 2 2 3 5 6 4 6 6 6 6 1 3 1 4 4 5 3 2 1 1 7 2 2 2 2 2 6 6 6 1 1 2 2 2 3 2 6 6 6 4 7 7 7 7 1 3 6 5 1 4 2 2 1 4 7 1 1 1 1 1 6 7 7 4 2 1 1 1 4 1 2 4 6 6 6 7 6 7 2 2 4 2 3 5 4 4 1 1 7 1 1 2 1 1 6 7 7 3 2 1 1 2 5 3 5 . . . . . . . . . . . . . . . . . . . . . . . . . . . . . . . 6 4 4 6 5 5 6 6 6 6 1 4 4 3 3 3 1 1 4 4 6 5 4 5 6 2 6 7 7 1 1 3 3 3 7 2 2 7 7 5 7 7 6 7 4 2 3 2 1 5 5 4 1 2 7 1 1 1 1 1 6 7 4 2 2 1 1 2 8 2 3 6 6 5 4 7 4 4 1 4 2 4 3 5 5 5 1 2 6 2 1 1 1 1 6 6 4 2 2 1 1 1 9 1 2 6 5 6 5 6 6 6 1 4 4 4 4 5 5 5 1 1 6 1 1 1 1 1 6 6 6 2 2 1 1 1 10 4 5 3 4 2 2 3 4 3 1 4 5 5 4 5 5 5 1 2 7 1 1 1 1 5 6 5 3 5 4 1 2 2 11 2 4 . . . . . . . . . . . . . . . . . . . . . . . . . . . . . . . 12 2 2 4 4 6 6 4 2 6 3 4 1 3 4 1 1 1 1 1 7 1 1 1 1 1 6 7 7 1 2 1 1 1 13 2 4 6 6 6 6 7 6 6 1 3 4 2 1 3 3 3 1 2 7 4 1 2 2 2 6 6 6 2 2 1 1 1 14 2 2 4 4 4 6 6 4 4 1 6 5 3 2 5 3 3 1 1 7 1 1 1 1 1 6 7 7 2 2 1 1 1 15 3 4 4 4 . . . . . . . . . . . . . . . . . . . . . . . . . . . . . 16 1 6 . . . . . . . . . . . . . . . . . . . . . . . . . . . . . . . 17 2 6 6 6 6 7 6 6 7 1 3 4 2 3 4 4 1 1 2 7 2 1 5 1 1 6 7 7 2 2 1 1 1 18 2 3 6 6 4 5 6 4 6 4 4 3 3 3 4 3 2 1 2 7 2 2 2 2 4 6 5 4 2 3 2 2 2 19 4 4 6 6 6 6 6 6 6 2 2 5 3 3 5 3 1 1 1 7 1 1 1 1 5 6 6 4 4 2 1 1 1 20 4 4 . . . . . . . . . . . . . . . . . . . . . . . . . . . . . . . 21 5 5 3 3 3 6 4 3 6 1 5 1 3 3 5 2 1 4 2 6 2 2 2 2 4 6 6 4 1 2 2 2 2 22 2 6 3 4 6 6 6 6 7 1 3 5 3 3 5 4 2 2 4 6 2 2 2 2 4 6 6 4 2 2 2 2 2 23 2 7 6 6 6 6 6 4 6 2 3 1 3 1 5 5 4 1 1 7 1 2 2 1 2 6 7 7 2 2 1 2 2 24 4 4 4 4 3 6 5 4 6 1 2 4 2 1 5 3 2 1 2 7 2 2 2 1 2 6 7 4 3 3 1 2 2 25 4 4 5 5 2 5 5 5 5 1 1 5 1 3 5 5 4 1 2 7 2 2 2 2 5 6 7 5 3 2 2 2 3 26 3 4 2 2 2 4 3 3 4 1 3 4 4 1 5 4 3 1 1 7 1 1 2 1 2 6 6 6 2 1 1 1 1 27 4 4 6 5 2 2 6 4 4 1 3 4 3 2 5 3 3 2 4 6 2 2 4 2 2 6 5 6 2 2 2 2 5 28 6 4 . . . . . . . . . . . . . . . . . . . . . . . . . . . . . . . 29 2 2 6 6 3 4 4 4 4 1 6 3 5 1 5 2 1 1 2 7 4 2 2 2 2 6 7 7 1 2 2 2 4 30 2 6 6 6 6 6 6 6 6 3 3 4 3 2 5 5 4 1 2 7 1 1 2 1 2 6 6 6 2 2 1 1 1 31 3 3 6 5 5 6 5 5 5 1 5 6 5 2 4 3 2 3 2 7 2 1 7 1 6 6 4 3 4 1 1 1 1 32 2 4 4 4 4 6 6 4 6 1 4 3 4 1 3 3 3 5 4 6 5 3 3 2 2 4 6 6 2 2 2 4 5 33 2 2 6 6 6 6 7 4 6 1 3 3 3 2 4 3 3 2 2 6 1 2 2 2 2 6 6 4 2 2 1 2 2 34 2 6 6 6 5 4 6 4 4 1 2 5 5 4 4 3 2 2 2 6 2 2 2 2 2 6 6 5 3 2 2 2 5 35 2 4 . . . . . . . . . . . . . . . . . . . . . . . . . . . . . . . 36 4 4 . . . . . . . . . . . . . . . . . . . . . . . . . . . . . . . 37 2 2 5 6 4 4 6 6 4 1 2 3 2 1 5 5 4 7 1 7 1 1 1 1 4 6 6 4 2 1 1 1 1 38 2 2 7 6 6 6 6 4 6 1 6 1 2 1 5 5 2 1 2 7 1 1 7 2 2 6 6 6 1 1 1 1 1 39 4 2 6 3 2 4 6 3 4 1 6 1 4 3 5 5 1 1 1 7 2 1 1 1 4 6 6 6 1 2 1 1 1 40 2 4 . . . . . . . . . . . . . . . . . . . . . . . . . . . . . . . 41 5 6 4 4 3 6 3 2 6 1 2 4 3 1 3 3 3 2 2 6 2 2 2 2 2 6 6 6 2 2 2 2 2 42 2 2 6 6 2 6 5 5 5 1 4 2 2 2 4 4 2 1 2 7 2 2 3 2 2 6 7 6 2 1 1 1 2 43 2 5 . . . . . . . . . . . . . . . . . . . . . . . . . . . . . . . 44 2 4 5 6 2 6 6 4 6 1 5 4 3 3 3 3 2 2 2 7 2 2 4 2 2 6 7 6 2 2 2 2 4
165
OS REV1 33 22:45 Saturday, January 22, 2000
R R R R R R R R R R R R R R R R R R O 1 1 1 1 1 1 1 1 1 1 1 1 1 1 1 1 1 1 V b 7 7 7 8 8 8 8 8 8 8 8 8 8 9 9 9 9 9 V V V V V V V V 1 s 7 8 9 0 1 2 3 4 5 6 7 8 9 0 1 2 3 4 2 3 4 5 6 7 8 9 0
1 . . . . . . . . . . . . . . . . . . 64 41 12 10 12 12 12 54 32 2 2 2 2 2 6 3 3 5 5 6 6 2 4 5 4 4 1 1 70 44 4 11 10 12 12 49 26 3 1 1 1 1 5 2 3 6 6 6 7 1 7 4 3 3 2 2 84 47 12 11 10 11 12 63 33 4 1 1 1 1 7 2 3 6 7 6 7 1 7 5 3 5 5 4 72 46 10 12 12 12 12 62 26 5 . . . . . . . . . . . . . . . . . . 62 38 6 10 11 10 10 33 22 6 3 4 3 5 6 3 3 6 3 5 5 2 6 1 1 2 1 1 56 43 10 11 11 11 12 51 27 7 1 1 1 1 7 1 1 7 7 6 7 1 7 4 2 3 2 1 73 51 7 10 11 11 12 56 35 8 1 1 2 2 6 3 3 6 6 7 7 1 7 1 1 2 2 1 72 31 11 10 11 11 12 54 27 9 1 1 1 1 7 3 3 7 7 7 7 1 7 3 2 3 1 1 84 50 12 10 9 10 12 55 29 10 2 2 2 2 6 5 4 5 4 3 3 6 5 1 1 3 2 1 74 42 14 11 11 11 12 58 19 11 . . . . . . . . . . . . . . . . . . 72 43 16 9 11 10 10 44 33 12 1 1 1 1 7 1 2 4 6 3 7 4 7 2 1 1 1 1 75 40 11 10 10 10 11 35 27 13 1 2 2 2 7 2 2 6 6 6 6 2 7 3 3 3 2 1 74 43 16 9 10 11 12 54 32 14 1 1 1 1 7 3 3 4 7 6 7 1 7 5 2 2 1 1 72 39 13 10 10 12 12 52 34 15 . . . . . . . . . . . . . . . . . . 54 31 8 10 11 10 8 20 27 16 . . . . . . . . . . . . . . . . . . 81 49 6 11 11 12 12 51 30 17 1 1 1 1 6 3 2 6 6 6 7 1 7 4 2 3 2 1 73 42 13 9 9 10 10 57 33 18 2 2 2 2 5 3 2 6 6 4 5 3 5 3 2 2 2 2 66 40 12 10 10 10 12 47 27 19 1 1 1 1 7 2 3 6 6 6 6 2 7 3 2 3 1 1 71 41 14 12 12 12 12 53 30 20 . . . . . . . . . . . . . . . . . . 80 48 14 11 11 12 12 62 27 21 2 2 2 2 7 3 2 6 6 6 6 2 6 2 1 2 1 1 55 37 7 12 12 12 12 45 25 22 3 2 2 2 5 3 3 4 4 5 5 2 6 5 3 3 2 2 79 40 10 6 6 4 10 48 24 23 2 2 2 2 7 2 2 6 6 5 7 1 7 1 1 2 1 1 75 46 6 4 4 4 8 53 35 24 1 1 2 1 6 2 2 4 4 6 7 1 6 3 2 3 2 2 72 44 11 8 8 8 12 54 30 25 2 2 2 2 7 1 2 7 7 6 7 1 7 3 1 3 1 1 71 49 14 9 10 9 11 54 30 26 1 1 1 1 7 3 4 6 6 6 6 4 6 2 1 2 1 1 67 30 5 6 4 6 7 34 26 27 2 2 2 2 6 3 2 4 6 6 5 3 6 3 2 4 2 1 60 41 8 4 4 6 9 50 34 28 . . . . . . . . . . . . . . . . . . 60 24 4 12 12 12 12 48 31 29 2 2 2 2 6 4 4 6 6 4 6 2 4 1 1 2 1 1 72 49 11 6 6 6 7 55 33 30 1 1 1 1 7 2 2 6 6 6 6 2 6 5 3 4 3 3 78 47 10 12 12 10 11 48 29 31 1 1 1 1 4 4 3 5 6 3 4 4 6 5 2 2 1 1 72 37 11 12 12 12 12 54 15 32 4 4 4 4 3 3 3 4 4 4 6 2 5 3 3 4 1 3 72 37 10 10 5 8 9 54 30 33 2 2 2 2 5 2 2 6 6 6 6 2 6 2 2 2 1 1 74 45 9 7 5 7 4 53 29 34 2 2 2 2 5 2 3 5 6 6 6 2 4 4 2 4 3 3 72 39 10 12 12 12 12 56 30 35 . . . . . . . . . . . . . . . . . . 75 33 14 12 10 10 11 51 25 36 . . . . . . . . . . . . . . . . . . 72 43 10 8 10 8 12 36 25 37 1 1 1 1 7 2 2 6 6 6 6 2 6 3 1 5 1 1 72 41 6 6 4 6 6 42 26 38 1 1 1 1 7 5 1 7 6 6 6 2 6 1 1 2 1 1 74 47 9 7 5 10 11 38 28 39 1 1 1 1 7 5 3 4 6 2 6 2 6 1 1 2 1 1 72 39 10 10 10 11 12 54 30 40 . . . . . . . . . . . . . . . . . . 72 40 15 12 12 12 12 36 30 41 2 2 2 2 6 3 3 4 4 4 6 2 6 4 2 2 2 2 77 47 9 11 10 11 10 58 21 42 1 1 1 2 6 3 2 6 6 6 7 2 6 2 1 2 1 1 73 41 10 8 7 7 12 47 34 43 . . . . . . . . . . . . . . . . . . 72 38 9 10 10 10 10 54 29 44 2 2 2 2 6 3 3 4 6 4 6 2 6 4 2 3 2 1 72 48 11 7 9 9 11 46 27
166
OS REV1 34 22:45 Saturday, January 22, 2000
U s U U e d h U O r a i h R R R R R R R R R R R R R R b I y V t r R R R R R R R R 1 1 1 1 1 1 1 1 1 1 2 2 2 2 s D s 1 s s 1 2 3 4 5 6 7 8 0 1 2 3 4 5 6 7 8 9 0 1 2 3
45 178 18 18 325 0.638 1 1 7 1 1 1 1 1 1 1 1 1 1 1 6 3 1 1 7 7 7 7 46 179 4 4 14 0.039 4 4 6 4 4 5 4 4 5 5 5 2 4 5 6 6 1 1 6 5 5 6 47 180 64 64 1576 8.625 1 4 7 1 1 1 1 1 2 4 2 1 2 1 6 6 6 6 6 4 6 6 48 181 9 9 138 0.225 5 4 7 2 2 2 2 2 2 4 2 2 2 2 6 6 4 3 6 6 6 6 49 192 54 54 1476 12.213 1 1 7 1 1 1 1 1 1 2 1 1 1 1 6 6 6 4 6 6 6 6 50 193 11 11 64 0.483 2 2 7 1 1 2 2 1 1 1 1 1 1 1 6 6 4 5 6 4 6 6 51 194 1 1 14 0.009 1 2 1 2 1 1 1 1 1 1 1 1 2 1 6 6 5 6 7 6 6 6 52 201 28 28 265 2.260 1 3 7 2 1 3 3 2 2 5 3 2 2 2 6 6 4 4 7 6 6 6 53 202 7 7 102 1.223 1 1 7 1 1 1 1 1 1 1 1 1 1 1 6 6 5 5 6 4 4 6 54 203 33 33 401 2.407 5 5 7 1 1 1 1 1 1 1 1 1 2 1 6 6 3 2 5 6 6 7 55 207 13 13 193 0.620 2 3 7 1 1 2 2 4 2 6 2 1 2 2 6 6 3 1 5 4 6 6 56 208 4 4 7 0.001 1 2 7 2 2 2 1 1 1 1 1 1 1 1 6 6 4 2 5 3 5 5 57 209 3 3 259 0.275 1 4 7 2 2 4 2 2 2 3 2 2 2 2 6 1 1 1 6 6 4 6 58 215 1 1 7 0.016 1 2 7 1 1 1 1 1 1 1 1 1 1 1 6 6 4 3 6 4 6 6 59 216 4 4 23 0.016 5 5 7 6 6 2 2 2 2 2 2 3 2 2 6 6 6 4 3 5 6 6 60 217 12 12 61 0.026 1 1 6 2 1 6 1 1 1 2 2 2 2 2 6 6 3 2 7 4 6 6 61 218 15 15 275 1.076 1 2 7 1 1 2 1 1 1 1 1 1 1 1 6 6 6 4 6 4 3 4 62 219 7 7 58 0.032 5 6 7 6 5 6 3 2 2 2 3 5 5 5 6 6 4 2 7 6 6 5 63 229 19 19 127 0.449 1 1 7 1 1 4 1 1 1 1 1 1 1 1 6 6 6 2 7 6 7 6 64 230 14 14 155 0.637 1 2 7 1 1 1 1 1 1 2 1 1 1 1 6 6 1 1 7 1 6 6 65 245 4 4 32 0.134 1 2 7 2 2 2 2 2 2 2 2 2 2 2 6 6 2 1 7 4 6 5 66 249 3 3 25 0.037 1 2 7 1 1 2 1 1 1 2 1 1 2 1 6 6 6 6 6 6 6 6 67 250 11 11 45 0.064 1 2 7 1 1 1 1 1 1 1 1 1 1 1 6 6 4 2 6 4 6 5 68 251 4 4 34 0.239 1 1 7 1 1 1 1 7 1 1 1 1 1 1 6 6 6 4 7 4 1 6 69 252 5 5 17 0.031 1 2 7 3 2 2 2 2 2 2 2 2 2 2 6 6 6 3 6 6 6 6 70 261 48 48 1309 7.927 1 1 7 1 1 1 1 1 1 1 1 1 1 1 6 6 5 3 7 6 6 5 71 262 12 12 224 0.537 1 1 7 2 2 1 1 1 1 1 1 2 2 2 6 6 4 4 7 4 4 4 72 263 4 4 22 0.016 1 1 7 1 1 2 1 1 1 1 1 1 2 1 6 6 6 6 6 6 4 6 73 265 1 1 15 0.009 1 1 7 1 1 1 1 1 1 1 1 1 1 1 6 6 5 4 3 7 7 6 74 268 1 1 3 0.000 1 4 7 2 1 1 1 1 1 3 1 1 1 1 6 6 6 4 7 4 7 6 75 277 5 5 68 0.363 2 5 7 3 4 6 3 2 2 5 2 2 2 2 6 6 4 2 5 4 2 6 76 278 12 12 79 0.085 1 1 7 2 1 3 1 1 1 2 1 1 2 1 6 6 6 3 6 7 7 7 77 279 52 52 1522 5.867 1 2 7 1 1 1 1 1 1 1 1 1 1 1 6 6 6 5 7 1 7 7 78 281 8 8 155 0.356 2 2 6 2 2 6 2 2 1 2 2 2 2 2 6 6 6 6 7 2 6 6 79 282 8 8 31 0.122 1 2 7 1 1 2 1 1 1 1 1 1 2 1 6 6 2 4 7 6 6 7 80 295 35 35 2092 3.932 2 2 6 2 2 2 2 2 2 2 2 2 2 2 6 6 3 1 7 6 6 6 81 296 13 13 300 0.363 1 1 7 1 1 2 1 1 1 5 1 1 5 1 6 6 3 1 7 4 4 7 82 303 5 5 44 0.146 2 2 7 2 2 3 1 1 1 2 1 2 2 1 6 6 6 3 7 6 6 6 83 305 9 9 58 0.856 1 2 4 2 2 2 2 2 2 2 2 2 2 2 6 6 6 6 6 6 6 6 84 312 8 8 31 0.161 7 1 7 1 1 1 1 1 1 1 1 1 1 1 6 6 6 6 7 7 7 7 85 317 5 5 27 0.288 1 1 7 1 1 1 1 1 1 2 1 1 1 1 6 6 6 4 6 6 7 6 86 318 14 14 157 0.908 1 1 7 1 1 5 1 1 1 1 1 1 1 1 6 6 5 1 7 7 6 6
167
OS REV1 35 22:45 Saturday, January 22, 2000
O R R R R R R R R R R R R R R R R R R R R R R R R R R R R R R R R R b 2 2 2 2 2 3 3 3 3 3 3 3 3 3 4 4 4 4 4 4 4 4 4 5 5 5 5 5 5 5 5 5 5 s 4 5 6 7 8 0 1 2 3 4 5 6 7 9 0 1 2 4 5 6 7 8 9 0 1 2 3 4 5 6 7 8 9
45 7 2 1 1 1 6 1 7 7 1 3 4 5 4 3 3 4 4 1 1 1 1 7 7 7 7 7 7 7 1 7 7 7 46 5 4 3 3 3 6 4 6 6 5 3 3 2 2 2 1 2 2 3 3 4 3 5 6 6 6 6 4 6 1 5 6 5 47 7 2 3 3 1 7 1 7 6 1 6 6 2 2 5 4 1 2 3 2 2 2 6 6 6 7 6 5 7 1 7 6 6 48 6 4 3 3 3 4 4 2 4 4 3 5 5 4 1 4 4 4 3 2 4 3 7 7 7 7 7 7 7 1 7 7 7 49 5 1 1 2 2 7 1 7 6 1 5 6 5 4 4 3 4 3 1 1 2 2 5 6 6 7 7 6 7 1 6 6 5 50 7 1 1 3 1 7 1 7 7 1 3 4 2 3 2 4 4 3 1 1 4 3 6 6 7 6 7 7 7 2 6 5 4 51 6 1 2 2 1 6 2 7 6 2 2 4 2 2 2 1 2 2 2 1 1 2 6 6 6 6 6 6 6 1 6 6 6 52 6 3 3 1 1 4 4 4 4 4 4 3 5 3 4 2 5 3 3 1 1 3 6 6 6 6 6 6 6 1 5 6 6 53 6 3 1 3 4 6 2 6 4 4 2 4 1 1 1 1 4 2 1 1 4 3 6 6 6 6 6 6 6 1 6 6 6 54 7 5 4 4 2 6 1 7 6 5 2 4 3 3 2 2 4 3 4 4 5 3 7 6 6 6 6 6 6 1 6 6 6 55 6 1 1 1 1 2 1 7 4 4 2 4 5 5 2 1 6 5 1 1 1 1 6 6 3 4 6 6 4 1 6 6 6 56 5 2 2 3 3 6 5 6 5 5 3 5 3 2 2 1 2 2 2 2 3 3 6 6 5 5 6 5 5 1 5 5 6 57 7 2 2 2 2 6 1 7 6 2 2 1 1 2 2 1 2 2 2 5 3 2 1 7 6 6 6 6 6 1 6 6 6 58 4 2 2 4 1 6 2 6 4 2 1 1 1 1 1 1 1 1 3 4 4 3 6 4 4 4 6 4 4 1 1 1 1 59 5 1 1 1 1 6 2 6 6 2 1 2 5 4 1 1 5 4 1 1 2 1 6 6 6 6 6 6 6 4 6 6 4 60 6 3 3 3 2 6 2 6 4 2 1 1 4 2 1 1 3 2 3 3 4 3 4 4 5 4 6 4 4 1 4 4 4 61 4 5 5 3 3 6 2 6 4 4 2 3 5 4 2 3 6 5 5 4 3 3 4 4 4 4 6 4 4 1 4 4 4 62 5 3 4 4 3 6 2 7 6 2 2 5 4 3 2 1 5 3 4 3 5 4 5 3 3 3 4 4 4 1 5 5 5 63 6 1 1 1 1 6 2 6 4 4 4 5 3 2 2 1 3 3 1 1 2 1 7 6 6 7 7 6 7 1 6 4 6 64 7 1 1 2 2 7 1 7 6 1 3 4 3 3 2 1 4 3 1 1 2 2 7 6 6 7 7 5 7 1 6 4 6 65 7 1 1 1 1 6 4 6 4 4 3 3 4 3 3 2 4 3 1 1 1 1 4 6 6 6 6 4 6 4 6 6 6 66 6 1 1 1 1 7 1 6 6 6 1 1 5 4 2 4 5 4 1 1 1 1 6 6 6 6 6 6 6 2 6 6 6 67 4 3 3 2 1 7 1 7 6 2 2 3 5 3 2 4 5 3 2 2 2 2 4 4 5 4 5 4 4 1 5 5 4 68 4 1 3 3 2 6 4 7 6 4 2 3 4 2 2 1 6 5 1 3 4 3 6 6 6 6 6 6 6 1 6 6 6 69 6 1 1 1 1 6 4 6 4 4 2 3 4 2 2 3 4 3 1 2 1 1 5 6 6 6 6 6 6 1 4 6 4 70 7 2 1 1 1 6 4 6 6 3 4 5 1 1 4 5 1 1 1 1 1 1 6 6 5 4 5 3 7 1 6 6 6 71 4 1 1 2 1 6 4 6 4 4 3 4 2 2 2 2 4 3 2 1 2 2 4 4 6 4 4 6 4 1 4 4 4 72 4 3 2 3 1 4 4 4 4 5 1 1 4 3 1 3 5 5 3 2 4 2 4 6 6 4 6 3 4 1 2 4 2 73 7 1 1 2 1 7 1 7 4 4 2 4 4 3 2 2 5 4 1 1 2 1 7 6 6 7 6 7 7 4 7 6 6 74 4 1 2 3 2 7 1 7 6 4 2 3 5 3 2 1 5 3 3 2 3 2 6 7 6 6 7 7 6 1 7 7 7 75 6 4 2 3 2 6 2 6 4 5 2 4 4 4 1 3 5 3 3 2 4 3 6 6 6 6 7 6 6 1 6 6 6 76 4 1 1 1 1 6 2 7 4 4 2 2 3 3 2 1 5 4 1 3 1 1 6 4 6 4 6 6 4 3 4 4 4 77 7 1 1 1 1 5 1 7 6 1 1 1 2 2 5 5 5 3 1 1 1 1 1 7 7 7 7 4 7 1 6 7 7 78 6 5 2 2 2 6 5 6 6 5 1 1 1 1 1 1 2 1 3 5 2 2 5 5 5 3 5 3 3 1 3 3 3 79 7 2 1 2 1 6 1 7 6 2 2 3 3 3 2 2 4 3 1 1 2 2 6 6 5 4 7 6 6 1 6 6 6 80 7 1 1 1 1 7 2 7 6 2 3 5 1 3 3 5 1 3 1 1 1 1 6 6 6 6 6 6 6 1 6 6 6 81 7 4 3 4 2 6 1 7 6 2 2 4 2 2 2 1 5 3 4 2 3 3 6 4 4 4 6 6 6 1 4 4 4 82 6 1 2 1 2 7 1 6 7 1 3 3 3 3 2 2 2 2 1 3 1 1 6 6 6 6 6 6 6 1 6 6 6 83 6 2 1 2 1 6 2 6 6 2 2 1 2 2 2 1 4 3 2 1 2 2 1 2 6 6 6 4 6 1 6 5 5 84 7 1 1 1 1 6 1 6 6 2 1 1 6 5 1 6 1 1 1 1 1 1 7 7 7 7 7 4 7 1 6 4 4 85 7 4 4 3 4 6 2 6 6 2 4 1 4 4 1 1 4 4 4 4 3 3 6 6 6 6 6 4 6 2 4 4 4 86 7 1 1 1 1 6 5 6 5 2 3 3 4 3 2 1 4 3 1 1 1 1 6 6 7 7 7 6 7 1 7 7 7
168
OS REV1 36 22:45 Saturday, January 22, 2000
O R R R R R R R R R R R R R R R R R R R R R R R R R R R R R R R R R b 6 6 6 6 6 6 6 6 6 6 7 7 7 7 7 7 7 7 7 7 8 8 8 8 8 8 8 8 8 8 9 9 9 s 0 1 2 3 4 5 6 7 8 9 0 1 2 3 4 5 6 7 8 9 0 1 2 3 4 5 6 7 8 9 0 1 2
45 7 7 7 7 7 7 6 6 6 6 6 6 1 1 1 1 1 1 1 1 1 1 1 1 1 1 1 1 1 1 6 7 7 46 6 6 6 5 6 5 6 5 5 5 5 5 5 6 5 3 4 4 5 2 2 2 2 2 3 2 3 3 3 3 5 6 4 47 7 7 7 6 7 7 6 6 6 6 6 6 1 1 2 1 1 3 2 2 2 1 2 2 2 2 2 2 2 2 4 6 7 48 7 7 7 7 7 7 7 7 7 7 7 7 1 1 1 2 2 4 2 2 2 2 2 2 2 2 2 2 2 2 5 6 7 49 6 6 7 6 6 6 6 5 6 6 5 6 2 2 3 2 1 2 2 2 2 2 2 2 2 2 2 2 2 2 2 6 7 50 4 6 7 4 7 6 6 6 6 6 6 6 2 2 2 2 2 3 2 1 2 1 2 2 2 2 2 2 2 2 4 7 7 51 6 6 6 6 6 6 6 6 6 5 6 6 2 2 3 2 3 2 2 2 2 2 2 2 2 2 2 2 2 2 2 6 2 52 6 6 6 6 6 6 6 6 6 6 6 6 3 2 2 3 3 6 2 2 2 2 2 3 2 2 2 2 2 2 4 6 4 53 6 6 6 6 6 6 6 6 6 6 6 6 2 2 2 1 2 2 2 2 2 2 2 2 2 2 1 2 2 2 4 7 7 54 6 6 6 6 6 6 5 5 5 5 4 5 4 4 4 3 3 3 2 2 3 3 2 2 2 2 2 2 3 3 4 7 4 55 6 6 6 6 6 6 2 3 3 3 5 5 5 5 5 3 3 3 2 2 2 3 2 2 1 2 3 2 4 4 4 4 4 56 6 5 6 6 6 6 6 5 5 6 6 4 3 2 2 3 3 2 2 2 2 2 2 2 2 2 2 2 2 2 5 5 5 57 6 6 6 6 6 6 6 5 6 5 6 6 2 3 6 2 2 2 2 2 2 2 2 2 2 2 3 2 2 2 7 6 1 58 1 1 2 2 2 2 6 4 4 4 6 4 4 4 4 3 5 6 4 4 4 4 4 4 4 4 4 4 4 4 6 2 6 59 6 5 6 6 7 7 5 5 5 5 6 6 2 3 5 2 2 3 2 2 2 2 2 2 2 2 2 2 2 2 3 5 6 60 5 4 5 5 5 5 5 4 5 5 5 4 3 4 4 3 3 4 2 2 2 3 2 2 2 2 3 2 3 3 4 6 5 61 4 4 5 4 5 5 4 4 4 4 5 5 3 4 4 3 4 3 3 3 3 4 3 3 3 3 4 3 4 4 4 4 6 62 5 5 5 5 5 4 3 5 3 3 3 3 5 4 5 2 3 3 3 3 3 2 3 2 2 1 2 1 3 3 6 6 7 63 4 4 6 4 4 5 7 6 7 4 7 4 2 1 1 3 3 4 4 4 4 4 4 4 4 1 3 2 2 2 6 2 7 64 6 5 6 6 6 4 6 5 5 5 5 5 2 5 6 2 3 2 2 1 2 1 2 1 1 1 2 1 2 2 4 7 4 65 6 6 6 6 6 6 6 6 6 6 6 6 2 2 2 3 2 2 2 4 2 2 2 2 2 2 2 4 2 2 4 6 6 66 6 6 6 6 6 6 3 4 4 4 4 4 4 4 4 3 4 4 3 2 2 2 2 2 3 2 4 2 4 4 6 5 7 67 4 5 5 4 4 5 6 6 6 5 5 5 3 3 3 1 3 2 2 2 2 2 2 2 2 2 2 2 2 2 2 6 2 68 6 6 7 6 6 6 6 6 6 6 6 6 2 2 2 3 3 4 2 2 2 2 2 2 6 3 2 6 1 2 1 6 6 69 5 6 6 6 6 6 6 5 5 6 5 5 5 4 6 3 4 4 3 2 2 2 2 2 2 2 2 2 3 3 4 4 5 70 6 6 6 6 6 6 6 5 6 5 6 5 6 5 6 3 2 3 2 2 2 2 3 2 2 2 2 4 2 2 5 6 4 71 4 4 4 4 4 4 6 6 6 6 6 6 2 2 2 2 3 2 2 2 2 3 3 3 3 2 2 2 2 2 4 6 4 72 4 3 5 3 4 5 3 4 4 4 4 5 4 5 4 3 3 2 2 2 3 2 3 2 2 2 2 3 5 4 6 3 6 73 6 6 7 6 7 6 6 6 6 6 6 6 2 2 2 2 2 2 2 2 2 2 2 2 2 2 2 2 3 3 7 5 7 74 7 7 6 7 7 7 6 6 6 6 6 6 2 4 5 2 1 2 2 2 2 2 2 2 2 2 2 2 2 2 5 6 6 75 6 6 6 5 6 6 2 3 4 3 3 4 4 5 5 3 2 2 3 3 2 3 3 3 5 3 3 3 5 4 6 5 6 76 4 4 4 4 4 4 4 3 3 3 4 5 5 5 5 3 4 4 4 3 3 4 4 2 4 2 4 4 5 3 6 5 6 77 7 7 7 7 7 6 5 6 6 6 6 6 6 4 7 1 1 7 1 1 1 1 1 1 1 1 1 1 1 1 7 7 1 78 3 3 3 3 3 3 4 3 4 4 4 4 4 5 6 3 5 6 2 3 3 3 3 2 2 2 4 2 6 6 6 5 7 79 6 7 6 6 6 4 6 6 6 6 6 6 1 2 2 2 2 2 2 1 1 1 1 1 1 1 1 1 1 2 2 4 6 80 6 6 6 6 6 6 6 6 6 6 6 6 6 2 3 2 1 2 1 2 2 2 2 2 2 2 2 2 2 1 2 6 2 81 4 4 4 4 4 4 4 4 5 4 4 4 4 4 4 3 4 4 2 2 4 4 4 4 4 4 4 4 4 4 4 4 4 82 6 6 6 6 6 6 6 6 6 6 6 6 2 2 2 3 3 4 3 3 3 3 3 3 3 3 3 3 3 3 4 6 6 83 6 5 6 5 6 6 5 5 5 3 4 5 6 5 6 3 4 4 3 3 3 3 2 2 3 3 3 3 3 3 5 5 6 84 6 6 7 5 7 6 7 7 7 7 7 7 5 1 1 1 1 7 1 1 1 1 1 1 1 1 1 1 1 1 4 7 4 85 6 6 6 4 6 6 6 6 6 6 6 6 5 2 6 2 3 2 2 2 2 2 2 2 2 2 2 3 3 3 5 6 5 86 6 6 7 6 7 6 6 6 6 6 6 6 1 1 6 1 1 2 1 1 1 1 1 1 1 1 1 1 1 1 2 7 2
169
OS REV1 37 22:45 Saturday, January 22, 2000
R R R R R R R R R R R R R R R R R R R R R R R R R R R R R R R O R R 1 1 1 1 1 1 1 1 1 1 1 1 1 1 1 1 1 1 1 1 1 1 1 1 1 1 1 1 1 1 1 b 9 9 4 4 4 4 5 5 5 5 5 5 5 5 5 5 6 6 6 6 6 6 6 6 6 6 7 7 7 7 7 7 7 s 3 4 6 7 8 9 0 1 2 3 4 5 6 7 8 9 0 1 2 3 4 5 6 7 8 9 0 1 2 3 4 5 6
45 6 6 2 2 1 1 1 1 1 1 5 5 5 5 5 2 1 1 1 7 1 1 1 1 1 6 7 6 3 2 1 1 1 46 4 4 6 3 5 4 5 5 5 1 4 3 5 1 3 1 1 4 3 6 2 2 3 4 5 6 7 6 3 3 2 5 5 47 1 2 6 6 6 7 6 6 6 4 3 6 2 5 5 5 3 1 1 7 2 2 2 1 1 6 6 6 5 4 1 1 3 48 2 6 . . . . . . . . . . . . . . . . . . . . . . . . . . . . . . . 49 2 6 6 6 6 6 6 5 6 3 3 6 2 3 4 3 3 1 2 7 1 2 2 1 2 6 6 6 6 4 1 1 2 50 1 6 . . . . . . . . . . . . . . . . . . . . . . . . . . . . . . . 51 2 2 6 6 6 6 6 6 4 1 3 3 3 1 5 4 3 1 1 7 2 2 2 1 2 6 7 6 2 2 1 1 2 52 4 6 4 3 4 6 4 4 6 3 4 4 3 3 5 5 2 2 2 7 2 2 2 2 2 6 4 4 4 4 2 2 2 53 7 6 4 3 6 6 6 6 6 4 3 3 3 3 5 3 3 1 7 7 1 1 1 1 5 6 6 3 4 2 1 1 1 54 4 4 5 5 5 7 6 4 7 1 3 4 2 4 5 4 3 2 2 7 1 1 1 1 2 6 7 4 3 2 1 1 1 55 5 6 5 6 5 6 6 6 6 1 4 3 4 1 5 3 1 3 5 7 5 6 1 5 7 6 7 4 2 2 2 2 2 56 3 3 4 5 3 2 5 6 5 1 3 5 4 1 4 4 2 1 1 7 1 1 3 1 5 6 6 5 3 1 1 1 1 57 2 2 4 4 4 4 4 4 4 1 4 1 4 1 3 3 3 4 4 4 4 4 4 4 4 1 4 4 1 1 4 4 4 58 4 5 . . . . . . . . . . . . . . . . . . . . . . . . . . . . . . . 59 2 3 3 5 3 6 6 5 6 1 4 2 4 2 4 3 2 2 2 6 5 3 3 5 2 6 6 6 1 1 2 2 3 60 4 4 4 4 6 4 4 4 4 1 3 1 3 1 4 2 1 1 4 7 2 2 4 2 4 6 6 4 1 1 1 1 3 61 4 4 4 3 3 4 5 4 4 1 5 3 4 3 5 5 3 1 2 6 1 1 1 1 3 6 6 3 2 2 1 1 1 62 2 6 . . . . . . . . . . . . . . . . . . . . . . . . . . . . . . . 63 3 6 6 6 6 6 5 6 6 1 4 4 3 1 5 5 3 1 1 4 1 1 1 1 4 6 7 4 2 2 1 1 1 64 2 6 . . . . . . . . . . . . . . . . . . . . . . . . . . . . . . . 65 2 4 . . . . . . . . . . . . . . . . . . . . . . . . . . . . . . . 66 4 6 . . . . . . . . . . . . . . . . . . . . . . . . . . . . . . . 67 2 2 4 3 4 5 5 5 5 1 2 1 3 1 5 4 2 1 1 7 1 1 1 1 2 6 6 6 1 1 1 1 2 68 2 4 . . . . . . . . . . . . . . . . . . . . . . . . . . . . . . . 69 4 4 6 5 6 6 6 6 6 1 4 4 4 1 5 2 1 1 1 7 4 2 2 2 4 6 6 4 2 2 1 2 2 70 3 3 1 6 6 6 6 6 6 1 1 5 2 4 5 3 3 1 2 7 1 1 2 1 4 6 5 4 3 3 1 1 1 71 2 4 2 4 2 4 2 2 4 1 2 4 4 3 5 4 3 1 1 7 1 1 1 1 4 6 6 4 3 2 1 1 1 72 2 5 4 4 3 2 5 3 4 1 3 3 4 3 5 4 3 1 1 7 2 1 2 1 5 6 4 3 1 1 1 1 2 73 2 6 . . . . . . . . . . . . . . . . . . . . . . . . . . . . . . . 74 4 5 . . . . . . . . . . . . . . . . . . . . . . . . . . . . . . . 75 3 4 . . . . . . . . . . . . . . . . . . . . . . . . . . . . . . . 76 3 5 4 6 3 2 5 2 2 1 2 2 5 1 5 5 3 1 1 7 1 1 4 1 4 6 6 4 2 2 1 1 2 77 1 1 4 3 6 4 6 1 4 1 3 1 1 4 5 5 1 1 1 7 1 1 1 1 1 6 7 4 1 3 1 1 1 78 5 7 . . . . . . . . . . . 3 . 5 . . . . . . . . . . . . . . . . . 79 2 2 . . . . . . . . . . . . . . . . . . . . . . . . . . . . . . . 80 2 2 . . . . . . . . . . . . . . . . . . . . . . . . . . . . . . . 81 4 4 3 4 2 4 2 2 4 1 3 4 3 3 5 3 5 1 1 7 4 1 4 1 4 6 6 4 3 2 1 4 4 82 4 4 . . . . . . . . . . . . . . . . . . . . . . . . . . . . . . . 83 5 5 . . . . . . . . . . . . . . . . . . . . . . . . . . . . . . . 84 1 4 7 6 6 4 6 4 6 1 4 1 2 3 5 5 5 4 1 7 1 1 1 1 4 6 7 4 1 2 1 1 1 85 2 5 4 6 5 6 7 6 7 1 2 1 4 1 5 5 4 1 1 7 1 2 1 2 2 6 6 6 2 1 1 1 3 86 2 2 . . . . . . . . . . . . . . . . . . . . . . . . . . . . . . .
170
OS REV1 38 22:45 Saturday, January 22, 2000
R R R R R R R R R R R R R R R R R R O 1 1 1 1 1 1 1 1 1 1 1 1 1 1 1 1 1 1 V b 7 7 7 8 8 8 8 8 8 8 8 8 8 9 9 9 9 9 V V V V V V V V 1 s 7 8 9 0 1 2 3 4 5 6 7 8 9 0 1 2 3 4 2 3 4 5 6 7 8 9 0
45 1 1 1 1 7 5 5 6 6 3 6 1 7 5 4 4 1 1 84 50 13 12 11 12 12 63 34 46 4 2 2 5 7 4 4 5 5 5 6 4 5 1 1 2 1 1 64 40 9 8 6 8 8 50 25 47 1 1 2 1 6 2 2 6 6 6 6 2 6 6 6 5 4 3 73 44 21 8 10 9 11 60 34 48 . . . . . . . . . . . . . . . . . . 72 50 13 8 6 8 9 63 18 49 1 1 1 1 6 2 2 6 7 6 6 2 7 6 6 4 3 2 72 45 18 11 11 11 11 54 34 50 . . . . . . . . . . . . . . . . . . 74 48 13 10 9 10 12 49 35 51 1 2 2 1 7 2 2 6 6 6 6 2 6 3 2 2 2 1 72 43 9 10 12 10 12 54 31 52 2 2 2 2 7 4 3 4 4 4 4 4 4 4 4 3 2 3 71 43 13 10 10 8 12 53 20 53 1 1 1 1 6 2 3 6 6 6 5 2 6 3 5 3 2 2 73 43 8 10 7 10 9 54 26 54 1 1 1 1 5 3 3 6 6 6 6 2 7 4 2 4 3 2 68 44 10 6 4 7 8 54 29 55 1 4 2 2 6 3 3 6 6 6 7 3 6 4 2 3 3 1 67 36 9 12 12 12 12 54 24 56 1 2 2 1 5 3 2 5 5 5 3 5 6 3 2 2 1 1 72 39 11 9 9 9 9 51 23 57 4 4 4 4 6 3 3 4 4 4 4 4 4 1 1 1 1 1 71 39 6 10 9 10 7 54 32 58 . . . . . . . . . . . . . . . . . . 48 33 4 7 8 9 9 13 28 59 1 3 2 2 4 4 4 4 6 3 6 2 5 2 1 2 2 2 72 46 5 12 11 12 12 53 30 60 2 2 2 2 7 3 3 4 4 6 6 2 6 1 1 2 1 1 68 32 4 8 7 8 9 41 28 61 1 1 1 1 7 4 3 4 3 3 6 2 6 4 2 3 3 2 56 31 10 6 6 6 7 39 26 62 . . . . . . . . . . . . . . . . . . 68 27 10 6 6 6 8 44 31 63 1 1 1 1 6 3 3 7 7 6 6 2 7 1 1 2 2 2 58 47 12 12 11 12 12 43 26 64 . . . . . . . . . . . . . . . . . . 78 46 10 11 11 11 11 49 34 65 . . . . . . . . . . . . . . . . . . 68 42 11 12 12 12 12 54 24 66 . . . . . . . . . . . . . . . . . . 64 44 8 12 12 12 12 54 28 67 1 1 1 1 5 1 1 6 6 6 6 2 6 3 1 2 1 1 72 31 11 10 9 9 11 41 33 68 . . . . . . . . . . . . . . . . . . 64 43 8 10 9 8 9 55 27 69 1 2 2 2 7 3 3 4 6 6 6 2 6 2 1 2 1 1 69 42 10 12 12 12 11 49 24 70 1 1 1 1 7 3 3 6 6 5 5 4 6 5 3 5 5 5 69 37 18 12 11 12 12 54 27 71 1 1 1 1 7 3 3 4 4 4 6 4 4 4 3 3 3 2 68 33 11 10 11 11 12 36 24 72 1 1 1 1 5 3 3 4 5 6 4 4 6 1 1 1 1 1 64 34 6 8 7 10 11 32 19 73 . . . . . . . . . . . . . . . . . . 70 50 10 11 11 12 12 57 29 74 . . . . . . . . . . . . . . . . . . 72 46 8 8 10 10 10 62 31 75 . . . . . . . . . . . . . . . . . . 56 44 10 8 6 9 10 53 25 76 1 1 2 1 6 2 4 3 4 4 6 4 3 1 1 2 1 1 54 39 7 12 12 12 10 36 27 77 1 1 1 1 7 5 1 4 4 4 4 4 7 5 3 4 4 1 84 41 12 12 12 12 12 61 32 78 . . . . . . . . . . . . . . . . . 1 58 30 4 9 7 10 7 27 24 79 . . . . . . . . . . . . . . . . . . 82 41 9 11 10 11 12 53 32 80 . . . . . . . . . . . . . . . . . . 74 43 16 12 12 12 12 54 32 81 4 4 4 4 7 3 3 4 4 4 6 4 4 3 2 5 3 3 52 37 9 6 7 8 10 36 32 82 . . . . . . . . . . . . . . . . . . 60 43 10 12 12 11 9 54 34 83 . . . . . . . . . . . . . . . . . . 62 32 6 10 10 11 12 50 30 84 1 1 1 1 7 3 1 7 4 6 7 1 4 3 3 3 3 1 84 47 9 12 12 12 12 51 31 85 2 2 2 2 6 3 3 6 7 7 6 2 6 4 2 2 1 1 69 42 7 7 7 7 6 46 30 86 . . . . . . . . . . . . . . . . . . 84 47 9 12 12 12 12 59 26
.
171
BIBLIOGRAPHY
Adams, D. A., Nelson, R. R., & Todd, P. A. (1992). Perceived usefulness, ease of use,and usage of information technology: A replication. MIS Quarterly, 16, 227-247.
Anderson, J. C., & Gerbing, D. W. (1988). Structural equation modeling in practice: Areview and a recommended two-step approach. Psychological Bulletin, 103, 411-423.
Bagozzi, R. P., & Warshaw, P. R. (1990). Trying to consume. Journal of ConsumerResearch, 17, 127-140.
Bailey, J. E., & Pearson, S. W. (1983). Development of a tool for measuring andanalyzing computer user satisfaction. Management Science, 29, 530-545.
Barki, H., & Hartwick, J. (1994). Measuring user participation, user involvement, anduser attitude. MIS Quarterly, 18, 59-79.
Barkin, S. R., & Dickson, G. W. (1977). An investigation of information systemutilization. Information and Management, 1, 35-45.
Baroudi, J. J., Olson, M. H., & Ives, B. (1986). An empirical study of the impact of userinvolvement on system usage and information satisfaction. Communications of theACM, 29, 232-238.
Baroudi, J. J., & Orlikowski, W. J. (1988). A short-form measure of user informationsatisfaction: A psychometric evaluation and notes on use. Journal of ManagementInformation Systems, 4(4), 44-59.
Besley, T., & Case, A. (1993). Modeling technology adoption in developing countries.American Economic Review, 83, 396-402.
Borovits, I., & Giladi, R. (1993). Evaluating cost/utilization of organizations'information systems and users. Information and Management, 25(5), 273-280.
Chau, P. Y. K. (1996). An empirical assessment of a modified technology acceptancemodel. Journal of Management Information Systems, 13, 185-204.
Cheney, P. H., & Dickson, G.W. (1982). Organizational characteristics and informationsystems: An exploratory investigation. Academy of Management Journal, 25, 170-184.
172
Chin, W. W., & Gopal, A. (1995). Adoption intention in GSS: Relative importance ofbeliefs. Data Base for Advances in Information Systems, 26(2), 42-63.
Chin, W. W., & Todd, P. A. (1995). On the use, usefulness, and ease of use of structuralequation modeling in MIS research: A note of caution. MIS Quarterly, 19, 237-246.
Compeau, D. R., & Higgins, C. A. (1995). Computer self-efficacy: development of ameasure and initial test. MIS Quarterly, 19, 189-211.
Compeau, D., Higgins, C. A., & Huff, S. (1999). Social cognitive theory and individualreactions to computing technology: A longitudinal study. MIS Quarterly, 23, 145-158.
Conrath, D. W., & Sharma, R. S. (1993). Evaluation measures for computer-basedinformation systems. Computers in Industry, 21, 267-271
Davis, F., Bagozzi, R. & Warshaw, P. (1989). User acceptance of computer technology:A comparison of two theoretical models. Management Science, 35, 982-1003.
DeLone, W. H., & McLean, E. R. (1992). Information systems success: The quest for thedependent variable. Information Systems Research, 3, 60-95.
Dishaw, M. T., & Strong, D. M. (1997). Extending the technology acceptance model.Paper presented at the Association for Information Systems 1997 AmericasConference, Indianapolis, Indiana. (available athttp://hsb.baylor.edu/ramsower/ais.ac97).
Doll, W. J. (1991). The measurement of end-user computing satisfaction: Theoreticaland methodological issues. MIS Quarterly, 15, 5-10.
Doll, W. J. & Torkzadeh, G. (1988). The measurement of end-user computingsatisfaction. MIS Quarterly, 12, 259-274.
Doll, W. J., Xia, W. & Torkzadeh, G. (1994). A confirmatory factor analysis of the end-user computing satisfaction instrument. MIS Quarterly, 18, 453-461.
Dominick, W. D. (1987). A performance measurement and evaluation environment forinformation systems. Information Processing and Management, 23, 7-15.
Downing, C. E. (1997). An empirical examination of user satisfaction with aninformation system implementation. Paper presented at the Association forInformation Systems 1997 Americas Conference, Indianapolis, Indiana. (available athttp://hsb.baylor.edu/ramsower/ais.ac97).
Drury, D. H., & Farhoomand, A. F. (1998). A hierarchical structural model ofinformation systems success. INFOR, 36, 25-40.
173
Essex, P. A., Magal, S. R., & Masteller, D. E. (1998). Determinants of informationcenter success. Journal of Management Information Systems, 15, 95-117.
Fann, G. L., Lynch, D. H., & Murranka, P. (1989). Integrating technology: Attitudes asa determinant of the use of microcomputers. Journal of Educational TechnologySystems, 17, 307-317.
Fornell, C., & Larcker, D.F. (1981, February). Evaluating structural equation modelswith unobservable variables and measurement error. Journal of MarketingResearch, 18, 39-50.
Galletta, D. F., & Lederer, A. L. (1989). Some cautions on the measurement of userinformation satisfaction. Decision Sciences, 20, 419-438.
Ghani, J. A. (1992). Task uncertainty and the use of computer technology. Informationand Management, 22, 69-76.
Goodhue, D., & Thompson, R. (1995). Task-technology fit and individual performance.MIS Quarterly, 19, 213-236.
Hatcher, L. (1994). A step by step approach to using the SAS system for factor analysisand structural equation modeling. SAS Institute Inc.
Hawk, S.R., & Aldag, R. J. (1990). Measurement biases in user involvement research.Omega, 18, 605-613.
Helman, P., & Liepins, G. (1993). Statistical foundations of audit trail analysis for thedetection of computer misuse. IEEE Transactions on Software Engineering, 19,886-901.
Hendricks, K. (1992). Reputations in the adoption of a new technology. InternationalJournal of Industrial Organization, 10, 663-667.
Hendrickson, A. R., & Collins, M. R. (1996). An assessment of structure and causationof IS usage. The Data Base for Advances in Information Systems, 27(2), 61-67.
Hendrickson, A. R., & Latta, P. D. (1996, Spring). An evaluation of the reliability andvalidity of Davis' perceived usefulness and perceived ease of use instrument.Journal of Computer Information Systems, 77-82.
Hendrickson, A. R., Glorfeld, K. & Cronan, T. P. (1994). On the repeated test-retestreliability of the end-user computing satisfaction instrument: A comment. DecisionSciences, 25, 655-667.
174
Hightower, R., & Brightman, H. J. (1994). A test of Rogers� optional adoption decisionmodel in an organizational setting. Journal of Information Technology Management,5, 11-17.
Hunton, J. E., & Beeler, J. D. (1997). Effects of user participation in systemsdevelopment: A longitudinal field experiment. MIS Quarterly, 21, 359-388.
Iacovou, C. L., Benbasat, I. & Dexter, A. S. (1995). Electronic data interchange andsmall organizations: Adoption and impact of technology. MIS Quarterly, 19, 465-485.
Igbaria, M., & Iivari, J. (1995). The effects of self-efficacy on computer usage. Omega,23, 587-605.
Igbaria, M., & Nachman, S. A. (1990). Correlates of user satisfaction with end-usercomputing. Information and Management, 19, 73-82.
Igbaria, M., & Parasuraman, S. (1991). Attitudes towards microcomputers: Developmentand construction validity of a measure. International Journal of Man-MachineStudies, 35, 553-374.
Igbaria, M., Parasuraman, S. & Baroudi, J. J. (1996). A motivational model ofmicrocomputer usage. Journal of Management Information Systems, 13, 127-143.
Igbaria, M., Pavri, F. N. & Huff, S. L. (1989). Microcomputer applications: Anempirical look at usage. Information and Management, 16, 187-196.
Igbaria, M., Zinatelli, N., Cragg, P., & Cavaye, A. L. M. (1997). Personal computingacceptance factors in small firms: A structural equation model. MIS Quarterly, 21279-306.
Ives, B., Olson, M. H. & Baroudi, J. J. (1983). The measurement of user informationsatisfaction. Communications of the ACM, 26, 785-793.
Jagodzinski, A. P., & Clarke, D. D. (1988). A multidimensional approach to themeasurement of human-computer performance. Computer Journal, 31, 409-419.
Jain, H., Ramamurthy, K., Uasai-Ardekani, J., & Ryu, H. (1998). Success of dataresource management in distributed environments: An empirical investigation. MISQuarterly, 22, 1-29.
Kappelman, L. A. (1996, Spring). User training, user involvement, and ISimplementation success. Journal of Computer Information Systems, 1-9.
175
Karahanna, E., Straub, D. W., & Chervany, N. L. (1999). Information technologyadoption across time: A cross-sectional comparison of pre-adoption and post-adoption beliefs. MIS Quarterly, 23, 183-213.
Keil, M., Beranek P. M., & Konsynski, B. R. (1995). Usefulness and ease of use: Fieldstudy evidence regarding task considerations. Decision Support Systems, 13, 75-91.
Kettinger, W. J., & Lee, C. C. (1994). Perceived service quality and user satisfactionwith the information services function. Decision Sciences, 25, 737-766.
Kettinger, W. J., & Lee, C. C. (1997). Pragmatic perspectives on the measurement ofinformation systems service quality. MIS Quarterly, 21, 223-240.
Kim, C., Suh, K.. & Lee, J. (1998). Utilization and user satisfaction in end-usercomputing: A task contingent model. Information Resources Management Journal,11(4), 11-24.
Larker, D., & Lessig, V. (1980). Perceived usefulness of information: a psychometricexamination. Decision Sciences, 11, 121-134.
Lee, A. M., Kim, Y. R., & Lee, J. (1995). An empirical study of the relationship amongend-user information systems acceptance, training, and effectiveness. Journal ofManagement Information Systems, 12, 189-202.
Malhotra, Y. (1997). Reassessing and clarifying information systems acceptance andusage. Paper presented at the Association for Information Systems 1997 AmericasConference, Indianapolis, Indiana. (available athttp://hsb.baylor.edu/ramsower/ais.ac97).
Marsh, H.W., Balla, J.R., & Hau, K. (1996). An evaluation of incremental fit indices: Aclarification of mathematical and empirical properties. In Advanced structuralequation modeling: Issues and techniques, Marcoulides, G.A. & Schumacker, R.E. ,ed. Lawrence Erlbaum Associates, Inc., Publishers.
Martinsons, M. G., & Chong, P. K. C. (1999). The influence of human factors andspecialist involvement on information systems success. Human Relations, 52, 123-152.
Mathieson, K. (1991). Predicting user intentions: Comparing the technology acceptancemodel with the theory of planned behavior. Information Systems Research, 2(3),173-191.
McKeen, J. D., Guimaraes, T., & Wetherbe, J. C. (1994). The relationship between userparticipation and user satisfaction: An investigation of four contingency factors.MIS Quarterly, 18, 427-451.
176
Montazemi, A. R., Cameron, D. A., & Gupta, K. M. (1996). An empirical study offactors affecting software package selection. Journal of Management InformationSystems, 13, 89-105.
Moore, G.C., & Benbasat, I. (1996). Integrating diffusion of innovations and theory ofreasoned action models to predict utilization of information technology by end-users.Proceedings of the First IFIP WG 8.6 Working Conference on the Diffusion andAdoption of Information Technology, 132-46.
Myers, B. L., Kappelman, L. A., & Prybutok, V. R. (1997). A comprehensive model forassessing the quality and productivity of the information systems function: Toward atheory for information systems assessment. Information Resources ManagementJournal, 10(1), 6-25.
Pitt, L. F., Watson, R. T., & Kavan, C. B. (1997). Measuring information systemsservice quality: Concerns for a complete canvas. MIS Quarterly, 21, 209-221.
Pitt, L. F., Watson, R. T. & Kavan, C. B. (1995). Service quality: A measure ofinformation systems effectiveness. MIS Quarterly, 19, 173-185.
Premkumar, G., & Ramamurthy, K. (1995). The role of interorganizational andorganizational factors on the decision mode for adoption of interorganizationalsystems. Decision Sciences, 26, 303-336.
Prescott, M. B., & Conger, S. A. (1995). Information technology innovations - aclassification by IT locus of impact and research approach. Data Base for Advancesin Information Systems, 26(2-3), 20-41.
Robey, D. (1979). User attitudes and management information system use. Academy ofManagement Journal, 22, 527-538.
Sahay, S. (1997). Implementation of information technology: A time-space perspective.Organization Studies,18, 229-260.
Saris, W., & Stronkhorst, H. (1984). Causal modeling in nonexperimental research.Sociometric Research Foundation, Amsterdam.
Schiffman, S. J., Meile, L. C., & Igbaria, M. (1992). An examination of end-user types.Information and Management, 22(4), 207-215.
Segars, A. H., & Grover, V. (1998). Strategic information systems planning success: Aninvestigation of the construct and its measurement. MIS Quarterly, 22, 139-163.
Shaft, T. M., & Sharfman, M. P. (1997). A confirmatory factor analysis of the attitudetowards computers instrument (ATCI). Paper presented at the Association for
177
Information Systems 1997 Americas Conference, Indianapolis, Indiana. (available athttp://hsb.baylor.edu/ramsower/ais.ac97).
Szajna, B. (1993). Determining information system usage: Some issues and examples.Information and Management, 25, 147-154.
Szajna, B. (1994). Software evaluation and choice: Predictive validation of thetechnology acceptance instrument. MIS Quarterly, 18, 319-324.
Taylor, S., & Todd, P. (1995). Assessing IT usage: The role of prior experience. MISQuarterly, 19, 561-570.
Thompson, R. L., Higgins, C. A., & Howell, J. M. (1994). Influence of experience onpersonal computer utilization: Testing a conceptual model. Journal of ManagementInformation Systems, 11, 167-187.
Torkzadeh, G., & Doll, W. J. (1991). Test-retest reliability of the end-user computingsatisfaction instrument. Decision Sciences, 22, 26-37.
Torkzadeh, G., & Dwyer, D. J. (1994). A path analytic study of determinants ofinformation system usage. Omega, 22, 339-348.
Van Dyke, T., Kappelman, L., Prybutok, V. (1999). Cautions on the use of theSERVQUAL measure to assess the quality of information systems services. DecisionSciences, 30(3), 877-892.
Watson, R. T., Pitt, L. F. & Kavan, C. B. (1998). Measuring information systems servicequality: lessons from two longitudinal case studies. MIS Quarterly, 22(1), 61-79.
Williams, B. L., Ruzicka, M. E., Hershauer, J. C., & Carter, P. L. (1997). The role oforganizational and interorganizational factors on planned adoption of electroniccommerce. Paper presented at the Association for Information Systems 1997Americas Conference, Indianapolis, Indiana. (available athttp://hsb.baylor.edu/ramsower/ais.ac.97/).
Zmud, R. W. (1979). Individual differences and MIS success: a review of the empiricalliterature. Management Science, 25(10), 966-979.