Embed Size (px)
Citation preview

HAL Id: hal-00305062https://hal.archives-ouvertes.fr/hal-00305062
Submitted on 2 Mar 2007
HAL is a multi-disciplinary open accessarchive for the deposit and dissemination of sci-entific research documents, whether they are pub-lished or not. The documents may come fromteaching and research institutions in France orabroad, or from public or private research centers.
L’archive ouverte pluridisciplinaire HAL, estdestinée au dépôt et à la diffusion de documentsscientifiques de niveau recherche, publiés ou non,émanant des établissements d’enseignement et derecherche français ou étrangers, des laboratoirespublics ou privés.
Modelling acidification, recovery and target loads forheadwater catchments in Nova Scotia, Canada
C. J. Whitfield, J. Aherne, P. J. Dillon, S. A. Watmough
To cite this version:C. J. Whitfield, J. Aherne, P. J. Dillon, S. A. Watmough. Modelling acidification, recovery andtarget loads for headwater catchments in Nova Scotia, Canada. Hydrology and Earth System SciencesDiscussions, European Geosciences Union, 2007, 11 (2), pp.951-963. �hal-00305062�

Hydrol. Earth Syst. Sci., 11, 951–963, 2007www.hydrol-earth-syst-sci.net/11/951/2007/© Author(s) 2007. This work is licensedunder a Creative Commons License.
Hydrology andEarth System
Sciences
Modelling acidification, recovery and target loads for headwatercatchments in Nova Scotia, Canada
C. J. Whitfield1, J. Aherne2, P. J. Dillon2, and S. A. Watmough2
1Watershed Ecosystems, Trent University, Peterborough, Ontario, Canada2Environment and Resource Studies, Trent University, Peterborough, Ontario, Canada
Received: 18 September 2006 – Published in Hydrol. Earth Syst. Sci. Discuss.: 29 November 2006Revised: 30 January 2007 – Accepted: 22 February 2007 – Published: 2 March 2007
Abstract. The response of twenty acid-sensitive headwatercatchments in Nova Scotia to acidic deposition was investi-gated for the period 1850–2100 using a dynamic hydrochem-ical model (MAGIC: Model of Acidification of Groundwaterin Catchments). To ensure robust model simulation, MAGICwas calibrated to the long-term chemical trend in annual lakeobservations (13–20 years). Model simulations indicatedthat the surface waters of all twenty catchments acidified tothe 1970s but showed subsequent recovery (increases in acidneutralising capacity (ANC) and pH) as sulphate depositiondecreased. However, under proposed future emissions reduc-tions (approximately 50% of current deposition) simulatedANC and pH will not return to estimated pre-industrial lev-els by 2100. An ANC of 20µmolc L−1 and pH of 5.4 weredefined as acceptable chemical thresholds (or critical chemi-cal limits) for aquatic organisms in the current study. Underthe proposed emissions reductions only one catchment is pre-dicted to remain below the critical limit for ANC by 2100;three additional catchments are predicted to remain belowthe critical limit for pH. Dynamic models may be used to es-timate target loads, i.e., the required deposition reductions toachieve recovery within a given time. Setting target loads atapproximately 30% of current depositions would allow threeof the four lakes to reach the chemical criteria by 2030. Incontrast to the generally good prognosis for surface waters,soils lost an average of 32% of estimated initial base satu-ration and recovery is estimated to be very slow, averaging23% lower than pre-acidification levels in 2100.
Correspondence to: C. J. Whitfield([email protected])
1 Introduction
In eastern Canada the acidification of surface waters was rec-ognized as early as the 1950s (Gorham 1957); however, at-mospheric deposition of anthropogenically derived sulphur(S) only began to cause concern during the 1970s and 1980swhen the loss of fish populations from acidified waters wasrecorded in Ontario (Beamish and Harvey, 1972) and acidifi-cation was recognized as widespread (Dillon et al., 1978). InNova Scotia, which is downwind of major North Americanemission sources, an estimated 90% of atmospheric acidicdeposition results from long range transboundary air pollu-tion (Shaw, 1979). Environment Canada began monitoringlake chemistry in Nova Scotia in the early 1980s. These lakes(n=72) have been particularly important for documenting theimpacts of changing acid deposition levels on surface wa-ters in Nova Scotia, which owing largely to the presence ofshallow base-poor soils, has been identified as the most acid-sensitive province in Atlantic Canada (Clair et al., 2003).
In the mid-1980s, efforts to combat the acidification of ter-restrial and aquatic ecosystems through pollution abatementmeasures were introduced in North America, e.g., the Cana-dian Acid Rain Control Program (1985) and the Canada-U.S. Air Quality Agreement (AQA, 1991). These programswere designed to reduce emissions of sulphuric acid precur-sors to the atmosphere; as a consequence, sulphate (SO4
2−)
deposition in Canada has decreased over the last two decades(Dillon et al., 1988; Dillon et al., 2003; Jeffries et al., 2003).Surface waters in eastern Canada have responded to de-creased SO42− deposition through improvements in waterquality, including substantial decreases in SO4
2− concentra-tions and small improvements in acid neutralizing capacity(ANC) and pH (Dillon et al., 2003; Jeffries et al., 2003). InNova Scotia, limited improvements in water chemistry havebeen observed (Clair et al., 2002). Despite decreasing con-centrations of SO42− and H+ in deposition and correspond-ing decreases in lake concentrations of SO4
2−, Whitfield et
Published by Copernicus GmbH on behalf of the European Geosciences Union.

952 C. J. Whitfield et al.: Modelling acidification, recovery and target loads
#S
#S
#S #S#S#S#S
#S
#S#S#S#S
#S
#S
#S#S#S#S#S#S
$T
$
$
CANADA
USA65ºW
60ºW
45ºN
Cape Breton (CB)
Eastern Shore (ES)
Bridgewater (BW)
Yarmouth (YM)
Kejimkujik (KJ)
Figure 1
Fig. 1. Location of the 20 acid-sensitive study lakes (open circles)in five regions and the Canadian Air and Precipitation MonitoringNetwork deposition station at Kejimkujik (open triangle) in NovaScotia.
al. (2006a) did not detect responses for H+ and alkalinity inlakes.
In Canada, few long-term water quality data sets exist, andnone are long enough to capture the entire acidification pro-cess (Dillon et al., 1987). Steady-state models can be usedto estimate equilibrium conditions for an ecosystem and pro-vide useful insights as to what changes can be expected inthe future. However, many ecosystems are not in equilib-rium with present or projected depositions, since there arebuffer mechanisms that delay the reaching of a steady-statefor years, decades or even centuries. Dynamic models at-tempt to estimate the time required for a new equilibrium tobe achieved, or more applicably, they provide an estimateof the future soil or surface water chemistry in response todeposition changes resulting from planned emission reduc-tions. Dynamic models can also be used to predict the likelybenefits from costly reductions in acid emissions, which isan extremely important consideration for policy makers.
There is increasing recognition of the importance of dy-namic models in developing emission reduction policies.The Model of Acidification of Groundwater in Catchments(MAGIC: Cosby et al., 1985a; Cosby et al., 2001) has re-cently been applied in eastern Canada to assess the impactof proposed sulphur emission reductions (e.g., Aherne et al.,2003; Clair et al., 2003; Larssen et al., 2003; Aherne et al.,2004; Clair et al., 2004). The use of dynamic models willlikely increase in the near future as the efficacy of currentemission regulations are evaluated in Canada. MAGIC hasbeen in use for 20 years and is one of the most widely usedsoil-chemical acidification models. MAGIC has proven to bea useful tool for simulating water acidification responses atthe catchment (Cosby et al., 1985b; Cosby et al., 1996) andregional (Aherne et al., 2003; Wright et al., 2005) scale.
In the current study, MAGIC was applied to twenty acid-sensitive headwater catchments in Nova Scotia to character-ize changes in surface water and soil chemistry since indus-trialization activities began in eastern North America. Fu-ture sulphur (S) and nitrogen (N) emissions are based onCanada’s post-2000 Acid Rain Strategy and the proposedClear Skies Legislation in the United States (EnvironmentCanada, 2004; WxPrime, 2004). The twenty study lakes andtheir catchments, which are a subset of the 72 lakes moni-tored by Environment Canada, have been studied for trendsin lake chemistry and steady-state critical loads for lakes(Whitfield et al., 2006a) while five of the catchments un-derwent critical evaluation of mineral weathering rates andcritical loads for forest soils (Whitfield et al., 2006b). Recentmodel simulations of Nova Scotian surface waters suggestthat limited recovery will take place given the current depo-sition forecasts (Clair et al., 2003), with base cation concen-trations being particularly slow to recover (Clair et al., 2004).
Unlike previous modelling studies, detailed site-measuredsoil data are used as model inputs for each catchment. Inaddition, MAGIC was calibrated to the long-term trend inobserved data rather than a multi-year average to more accu-rately characterize the trend through the calibration period.
2 Methods
2.1 Study area
The province of Nova Scotia is located on Canada’s AtlanticCoast and experiences a humid continental climate, while themarine waters that surround the province moderate againstextreme air temperatures in summer and winter. Annual rain-fall in Nova Scotia averages approximately 1.40 m, rangingfrom 1.36 m in the south to 1.51 m at the Eastern Shore. Non-marine S and N deposition in Nova Scotia currently aver-ages 66 mmolc m−2 yr−1, and is composed of approximatelyequal portions of sulphur (as SO4
2−) and nitrogen (as nitrate(NO3
−) and ammonium (NH4+)). Soils are poorly devel-oped podzols deposited during glacial retreat (16 000 yearsbefore present; Clair et al., 2003) and are sandy and shallow.Precambrian geology is typical across the province; quartz,K-feldspar, and plagioclase dominate soil mineralogy (Whit-field et al., 2006b) with the major underlying bedrock beingOrdovician slates and Devonian-Carboniferous granites.
Twenty headwater lakes in Nova Scotia, located in fivegeographic regions (Cape Breton, Bridgewater, EasternShore, Kejimkujik, Yarmouth) were selected for study fromthe 72 acid-sensitive lakes monitored under the Environ-ment Canada Atlantic Region temporal monitoring network(Fig. 1). Catchments were selected to include lakes with arange of alkalinity, dissolved organic carbon (DOC), and pHvalues, so as to capture varying levels of acid-sensitivity (Ta-ble 1). All of the catchments are small, primarily forestedand were selected to maintain consistency in hydrologic or-
Hydrol. Earth Syst. Sci., 11, 951–963, 2007 www.hydrol-earth-syst-sci.net/11/951/2007/

C. J. Whitfield et al.: Modelling acidification, recovery and target loads 953
Table 1. Lake area and five year (1998–2002) annual averages lake concentrations for pH, major ions, Gran alkalinity (ALK), and dissolvedorganic carbon (DOC). See Fig. 1 for catchment location.
Catchment Lake area pH Ca2+ Mg2+ Na+ K+ SO42− Cl− ALK DOC
(Region) ha µmolc L−1 µmolc L−1 µmolc L−1 µmolc L−1 µmolc L−1 µmolc L−1 µmolc L−1 mg L−1
Allens (YM)a 93.0 5.93 48 109 531 22 44 611 99.1 5.2Bird (YM) 30.0 6.62 28 34 211 11 36 231 84.5 2.7Brenton (YM) 58.4 4.90 77 78 323 13 83 340 20.2 17.5Jesse (YM) 26.8 6.19 67 86 236 15 64 277 41.6 4.8Tedford (YM) 81.6 6.32 75 79 329 12 74 365 50.0 2.8Trefry (YM) 29.6 6.42 94 104 302 14 84 325 86.7 5.9Beaverskin (KJ) 39.5 5.44 18 30 113 6 43 107 –6.9 2.4Big Dam East (KJ) 45.5 6.02 35 37 132 5 43 121 13.1 4.2Pebbleloggitch (KJ) 33.4 4.50 16 27 113 5 41 105 –31.8 10.8Annis (BW) 87.0 6.65 81 55 117 6 53 125 66.6 1.6Huey (BW) 13.3 5.76 42 35 126 2 50 120 10.9 3.6Little Wiles (BW) 36.3 5.24 51 52 120 6 100 119 22.3 2.1Matthew (BW) 16.9 5.70 60 61 245 11 67 249 –2.5 7.0Halfway (ES) 106.6 5.46 46 34 127 5 48 126 8.2 5.0Branch (CB) 14.9 4.75 28 34 154 8 36 156 –40.5 9.8Glasgow (CB) 23.9 4.93 24 32 145 8 31 149 –3.3 7.0John Dee (CB) 24.4 5.35 44 43 157 7 32 148 29.6 9.2Long (CB) 6.6 6.00 81 57 174 13 46 171 88.9 3.3Mica Hill (CB) 5.0 5.27 59 36 159 8 37 146 61.3 9.8Round (CB) 14.4 5.13 29 34 144 7 32 133 0.9 8.1
a Data reported is for 2004. Nitrate and ammonium were below detection limits and are not reported here. Region: YM = Yarmouth,KJ = Kejimkujik, BW = Bridgewater, ES = Eastern Shore and CB = Cape Breton.
der and size (maximum area of 6 km2). Due to the closeproximity of the catchments to the ocean (<50 km), deposi-tion and lake chemistry demonstrate a strong marine influ-ence.
2.2 Model description
MAGIC (Cosby et al., 1985a) is a process-oriented lumpedparameter model of intermediate complexity. MAGIC wasdeveloped for the purpose of quantifying the long-termecosystem response to acidic deposition at the catchmentscale. The model is used to simulate average annual ormonthly soil solution and surface water concentrations forSO4
2−, calcium (Ca2+), magnesium (Mg2+), sodium (Na+),potassium (K+) and pH, as well as exchangeable soil frac-tions of Ca2+, Mg2+, Na+ and K+. The model can be usedto represent aggregated uniform soil compartments and a sur-face water compartment (lake or stream). The latest versionof the model (7.77: Cosby et al., 2001) was used in the cur-rent study.
MAGIC includes short-term processes described by equi-librium reactions that regulate ionic balance, and long-terminput-output processes that control the catchment mass bal-ance. These processes include weathering of minerals, ad-sorption and exchange of base cations and aluminium bysoils, anion retention by soils, buffering of soil solution pHby weak organic and inorganic acids and biologically medi-ated uptake of cations and anions. The equilibrium equations
are represented by inorganic aluminium reactions for surfaceand soil water, cation exchange reactions, and inorganic car-bon equations that describe the chemical change that occursas soil water enters the stream channel. Ionic balance is gov-erned by a single equation, and rates of change for each ion insoil water and surface water are calculated through the massbalance equations. Collectively, the mass balance equationsdescribe the input-output relationships for base cations andstrong acid anions. A triprotic pH model is included for mod-elling soil and surface water organic acidity. Additional de-tails describing the model structure are available in Cosby etal. (1985a) and Cosby et al. (2001).
2.3 Lake data
Surface water chemistry data collection started in 1983 fornine of the lakes and in 1990 for the remaining eleven. All ofthe study lakes were monitored through to 2002, with the ex-ception of Allens Lake, where monitoring ceased in 1989.Samples were collected at mid-lake with a maximum fre-quency of twice per year (spring turnover or spring and fallturnover). Samples were analyzed for specific conductance,DOC, alkalinity, pH, NO3
−, total N, SO42−, chloride (Cl−),
Na+, Mg2+, K+, Ca2+, and total aluminium at EnvironmentCanada’s Analytical Laboratory in Moncton (see Table 1). Adescription of the analytical methods is available in Clair etal. (2001). Data quality was evaluated by using ion balance,with +/−10% set as the criterion for acceptance.
www.hydrol-earth-syst-sci.net/11/951/2007/ Hydrol. Earth Syst. Sci., 11, 951–963, 2007

954 C. J. Whitfield et al.: Modelling acidification, recovery and target loads
0.0
0.2
0.4
0.6
0.8
1.0
1.2
1.4
1.6
1.8
1850 1900 1950 2000 2050 2100
SO
42- d
ep
os
itio
n s
ca
le f
ac
tor
Historic Reconstruction Observed PST2010F
Fig. 2. Estimated sulphate deposition scale factors (relative to 2002)for the period 1850–2100. Broken lines separate the deposition sce-nario into three time periods originating from different data sources:historical (based on emissions inventories), observed (KejimkujikCAPMoN station data) and forecast (from PST2010F depositionscenario).
2.4 Soil data
Soils were collected from each soil horizon at multiple pits(6–12) in each catchment during 2003 or 2004. Depths ofeach horizon were recorded in the field. Soils were ana-lyzed in the laboratory for pH, bulk density, loss on igni-tion, cation exchange capacity (CEC) and exchangeable basecation saturation (BS). CEC and BS were depth and densityweighted. Detailed methods concerning soil collection andanalysis are presented in Whitfield et al. (2006b). Soil hori-zon data were amalgamated (or lumped) into a single layer,which was deemed reasonable given the shallow soil depthacross the study area (Table 2).
2.5 Deposition data
Daily precipitation chemistry (1984–2002) including pH,Cl−, SO4
2−, NO3−, NH4
+, Ca2+, Mg2+, Na+, and K+
was monitored through 24-hour integrated samples collectedwith a wet only precipitation collector at the Canadian Airand Precipitation Monitoring Network (CAPMoN) stationin Kejimkujik National Park (see Fig. 1). Daily precipita-tion was measured using a type B rain gauge and a Niphershielded snow gauge. Regional wet deposition maps for theperiod 1994–1998 for all major ions in precipitation wereprovided by Environment Canada at a resolution of approx-imately 45×45 km (Ro and Vet, 2003). Dry deposition in-puts to mixed land cover for all major ions at a resolutionof approximately 35×35 km (Vet and Shaw, 2004) were in-terpolated with the wet deposition field to a common gridresolution (25×25 km) and combined to produce consistentregional coverages for deposition. Using these data to definethe spatial pattern of deposition across the study region, scalefactors were established between all grids and the Kejimku-jik grid (grid containing the Kejimkujik CAPMoN station).Time-series of deposition (1984–2002) were generated foreach catchment using the observed temporal trend at the Ke-
jimkujik station and the grid-specific scale factors, assumingthat the factors remained constant over time.
Deposition hindcast sequences (1850–2002) were gener-ated for SO42−, NO3
−, NH4+, and base cations (Ca2+,
Mg2+, Na+ and K+) and scaled to present day deposition.Sulphate deposition history was generated from historic Semissions inventories using data from two sources (1850–1940: Office of Technology Assessment, 1984; 1940–2000:U.S. EPA, 2000). These data were used to create depo-sition scale factors relative to the present deposition level(1984–2002) for the period of model simulation (Fig. 2). TheNO3
− hindcast was similarly generated (1900–1980: Husar,1994; 1980–2000: Galloway et al., 1996). The hindcast forNH4
+ was constructed using global ammonia (NH3) emis-sions for the period 1900–1950 (Galloway, 1995) and usingNH3 emissions in the U.S. for the period 1950–2000 (Gal-loway et al., 1996). As the 1900 estimates of NO3
− andNH3 emissions were very low, and prior emissions estimatesare not available, the levels for 1900 were assumed to re-flect background levels. Increases in base cation depositionwere set to proportionally reflect the documented increasesfor SO4
2− deposition. This assumption seems reasonable asincreased industrial activity has led to increased atmosphericdeposition of base cations, largely through fossil fuel com-bustion (e.g., Hedin, 1994). The background levels of basecation deposition were estimated from potential acidity (Ah-erne and Farrell, 2002) assuming precipitation of pH prior toindustrialization approaches the pH of pure rainwater (5.6):
Potential acidity =
non−marine(SO2−
4 ) + NO−
3 + NH+
4 −
non−marine(Ca2++ Mg2+
+ K+) (1)
Future SO42− deposition was derived from recent emis-sion scenarios for eastern Canada (PST2010F: WxPrime,2004; Environment Canada, 2004) based on proposed reduc-tions under the United States’ Clear Skies Legislation, andCanada’s Post-2000 Acid Rain Strategy. Under this scenario,the change in emissions is expected to yield 2030 non-marineSO4
2− deposition slightly higher than 50% of 2000 levels.Deposition was assumed to decrease linearly from currentday until 2030 and remain constant thereafter (Fig. 2). Fu-ture NO3
− emission scenarios also exist for eastern Canada(see NOX3P: WxPrime, 2004); however, NO3
− and NH4+
deposition were set at current levels for the duration of theforecast period. In the current study, % N retention in thestudy catchment was assumed to remain constant as inor-ganic N is almost quantitatively retained in the catchments(NH4
+ and NO3− lake concentrations are below detection
limits). As such, future changes in N deposition will havelittle influence on the simulation results. Base cation depo-sition forecast scenarios were scaled to the SO4
2− trend ac-cording to the same relationship used for the hindcast. Allother ion deposition sequences were set constant at currentdeposition levels throughout the forecast period.
Hydrol. Earth Syst. Sci., 11, 951–963, 2007 www.hydrol-earth-syst-sci.net/11/951/2007/

C. J. Whitfield et al.: Modelling acidification, recovery and target loads 955
Table 2. Fixed catchment-specific lake and soil input parameters for MAGIC for each study site.
Catchment Lake Parameters Soil Parameters
Precip Runoff Catchment Area Relative Area Retention Time Depth Porosity Bulk Density BS CEC pHm m ha % years m % kg m−3 % mmolc kg−1
Allens 1.36 0.96 344 27 0.01 0.36 0.71 577 12.4 105 4.48Bird 1.38 0.98 120 25 0.51 0.46 0.59 843 9.1 80 4.88Brenton 1.38 0.98 495 11.8 0.14 0.32 0.66 570 11.0 111 4.44Jesse 1.38 0.98 185 14.5 0.35 0.37 0.69 605 12.5 83 4.45Tedford 1.36 0.97 245 33.3 0.43 0.33 0.70 537 6.8 136 4.52Trefry 1.38 0.99 100 29.6 0.94 0.33 0.65 524 8.7 123 4.41Beaverskin 1.39 1.00 100 39.5 0.87 0.43 0.70 487 12.4 85 4.96Big Dam East 1.39 1.00 200 22.8 0.00 0.42 0.73 256 14.4 89 5.17Pebbleloggitch 1.39 1.00 160 20.9 0.30 0.49 0.67 512 18.1 53 5.03Annis 1.43 1.05 215 40.5 2.50 0.34 0.66 695 12.2 67 5.23Huey 1.43 1.05 262 5.1 0.03 0.53 0.66 634 9.0 78 5.08Little Wiles 1.44 1.05 313 11.6 0.10 0.34 0.63 667 7.3 126 4.70Matthew 1.43 1.05 259 6.5 0.22 0.47 0.59 811 10.8 77 4.73Halfway 1.51 1.13 477 22.4 0.50 0.43 0.68 520 8.9 108 4.68Branch 1.44 1.06 543 2.7 0.06 0.37 0.48 630 16.0 63 4.59Glasgow 1.44 1.06 143 16.7 2.31 0.33 0.50 812 15.2 57 4.42John Dee 1.44 1.06 138 17.6 0.34 0.31 0.69 592 15.5 93 4.28Long 1.44 1.06 505 1.3 0.01 0.41 0.76 422 17.3 106 4.54Mica Hill 1.44 1.06 268 1.9 0.04 0.32 0.61 490 17.2 75 4.25Round 1.44 1.06 370 3.9 0.04 0.28 0.51 846 20.6 58 4.29
Precip = precipitation, BS = Base Saturation, CEC = cation exchange capacity.
2.6 Model parameters and calibration
Most of the required model input parameters were derivedfrom site measurements of the physical and chemical prop-erties for the study catchments (Table 2). For a number ofparameters including temperature, partial pressure of carbondioxide and dissociation constants for DOC, site data werenot available and regional default values were used acrossthe study catchments (Table 3). Time-series of annual at-mospheric deposition (wet plus dry) at each study catchmentwere used to calibrate to a multiple year period (1984–2002).Deposition included all major ions: Ca2+, Mg2+, Na+, K+,NH4
+, NO3−, SO4
2− and Cl−. Calibration to a single point(e.g., typically a five-year average) is less constrained andcould potentially result in discrepancies in hindcast and fore-cast simulations. The use of multiple calibration points en-sures a better fit to the long-term behaviour of the calibratedparameter, allowing for a more robust calibration. Water bal-ance was described by precipitation and runoff, with 100% offlow to the lake routed through one (aggregated) soil layer;flow routing was constant over time. Long-term means forrunoff were taken from regional maps (Table 2; EnvironmentCanada, 1978).
MAGIC includes a triprotic pH model used to model soiland surface water organic acidity. Three sets of parame-ters (Adirondack lakes, Driscoll et al., 1994; Swedish bo-real lakes and Czech temperate lakes, Hruska et al., 2003)for the triprotic pH model were assessed for their suitabil-ity to the study region. Using pH and DOC concentrations,
Table 3. Regional default input parameters for MAGIC applied toall study catchments.
Parameter Units Soil Lake
Sulphate adsorption half saturation mmolc m−3 100 –Sulphate adsorption maximum capacity mmolc kg−1 0.1 –Aluminum solubility constant log10 9 7.5Temperature ◦C 7.5 7.5Partial Pressure of CO2 % atm 0.55 0.15pK1 DOC –log10 2.5 2.5pK2 DOC –log10 4.42 4.42pK3 DOC –log10 6.7 6.7
the organic charge predicted by the triprotic model for eachlake was plotted against the observed anion charge deficit(calculated through charge balance and assumed to reflectorganic charge). The parameters for the triprotic model pre-sented by Hruska et al. (2003) for lakes in the Czech Repub-lic produced the best agreement between observed and sim-ulated values (R2=0.96) and were used in the current study(Table 3). Charge density calibrated with this model werelower than those reported by Hruska et al. (2003) (mean:2.9µmolc mg−1; range 1.8–5.6), despite higher pH for thestudy lakes.
Dry deposition at the study catchments may constitute asubstantial part of total deposition (Yanni et al., 2000); it was
www.hydrol-earth-syst-sci.net/11/951/2007/ Hydrol. Earth Syst. Sci., 11, 951–963, 2007

956 C. J. Whitfield et al.: Modelling acidification, recovery and target loads
Table 4. Catchment-specific dry deposition factors for chloride andsulphate.
Catchment Cl− SO42−
Allens 14.8 2.7Annis 3.5 1.9Beaverskin 2.8 1.4Big Dam 3.2 1.5Bird 5.3 2.2Branch 3.5 1.2Brenton 7.6 2.4Glasgow 4.5 1.3Halfway 3.2 1.8Huey 2.9 1.9Jesse 6.6 2.1John Dee 5.2 1.4Little Wiles 3.1 3.8Long Pond 5.1 2.0Matthew 5.8 2.4Mica Hill 4.3 1.3Pebbleloggitch 2.7 1.5Round 4.3 1.4Tedford 8.2 2.3Trefry 7.8 2.7
recently reported that dry deposition of SO42− across the re-
gion may compose up to 30% of total deposition (Jeffriesand Ouimet, 2004). Catchment specific dry deposition fac-tors (DDFs; the amount by which wet deposition must bemultiplied to equal total deposition) for each major ion werecalculated for each catchment because there are strong influ-ences of catchment size, vegetation, and topography on theamount of dry deposition and the scale of the dry depositionmap may be too large to capture these influences (Table 4).Lake concentrations of Cl− and SO4
2− were assumed to bein steady-state with respect to atmospheric inputs. Therefore,the dry deposition from the grid map was adjusted so that thesum of wet and dry depositions was equal to the runoff flux.Given the assumption that Cl− and SO4
2− behave conserva-tively, DDFs for the other ions were calculated by adjustingthe marine component (if appropriate) to reflect the dry de-position of Cl−, and the non-marine component to reflect thenon-marine deposition of SO42−. As catchment retention ofSO4
2− in young, poorly weathered upland soils is assumedto be very low, only a limited amount of S adsorption was im-plemented in the model (Table 3), such that SO4
2− behaviouris more-or-less conservative. While it has been shown thatSO4
2− is not always conservative (Dillon and LaZerte, 1992;Yanni et al., 2000) and may be influenced by climate varia-tions (Dillon and LaZerte, 1992), this assumption may besomewhat of a simplification in the current study. The dry de-position factors used here are somewhat higher than previousestimates have suggested for the region. Possible explana-
tions include underestimation of (mapped) wet deposition, aswell as unmeasured ion input from fog, which may accountfor a significant portion of deposition (Yanni et al., 2000).Furthermore, study of dry depositional processes in the areahas been limited, and it is possible that actual dry deposi-tion rates are higher than previous estimates have indicated.For a number of catchments (e.g. Little Wiles), dry deposi-tion factors for SO42− are substantially higher, suggestingnon-conservative behaviour, where retention of SO4
2− fromprevious years exhibits delayed release.
Model simulations were performed using an annual timestep. Nitrogen uptake rates (or catchment retention) were setto equal the difference between input and output fluxes, i.e.,an empirical rather than process-oriented description wasspecified in MAGIC. The catchments are free of any largescale anthropogenic disturbances, with eight of the catch-ments protected in National Parks and the remaining catch-ments located away from areas of development and observedto be free of harvesting. Following from this, forests in thecatchments were assumed to be at steady state; thus data cat-aloguing biological production, removal and transformationwere unnecessary. The full series of data available for wa-ter chemistry was used for model calibration. Adjustment ofthe initial (1850) base saturation, the aluminium solubilityconstant, soil DOC, and weathering rates was required forcalibration. This approach allowed for a match of the ex-changeable base cation fractions while simultaneously find-ing a best fit for water chemistry variables (Table 1). Optimalcalibration for ion concentrations was ensured by evaluatingthe fit of the simulated to observed values using the sum ofsquared errors. Estimates of historic and future deposition(as described above) are required to generate hindcasts andforecasts for water chemistry during the period of interest(1850–2100).
2.7 Critical chemical limits
ANC (defined as the sum of base cations minus the sum ofstrong acid anions) and pH are among the most frequentlyused chemical criteria for characterizing aquatic ecosystemquality for biotic organisms (e.g. Dillon et al., 1987; Mar-morek et al., 1996; Wright and Cosby, 2003). Follow-ing acidification, chemical recovery can be defined in twoways: return to pre-acidification conditions, or reachingsome pre-determined critical chemical limit for ANC or pH.An ANClimit of 20µmolc L−1 is often chosen as the thresh-old for aquatic organisms in acid-sensitive lakes (Henriksenet al., 1992; Posch et al., 1997; Whitfield et al., 2006a). Sim-ilarly, pH levels may be designated to protect fish or otherorganisms. A pH of 5.4 is generally used as the minimumlevel necessary to protect juvenile Atlantic Salmon (Salmosalar) (Farmer et al., 1980; Clair et al., 2004). The followingdiscussion will focus on the priority for remediation; bring-ing lakes to these critical conditions wherever possible.
Hydrol. Earth Syst. Sci., 11, 951–963, 2007 www.hydrol-earth-syst-sci.net/11/951/2007/

C. J. Whitfield et al.: Modelling acidification, recovery and target loads 957
0
20
40
60
80
100
120
140
160
180
0 20 40 60 80 100 120 140 160 180
Observed Ca2+
(µmolc L-1)
Sim
ula
ted
Ca
2+ (
µm
ol c
L-1
)
1985
1993
2001
(a)
0
20
40
60
80
100
120
140
160
0 20 40 60 80 100 120 140 160
Observed SO42-
(µmolc L-1)
Sim
ula
ted
SO
42- (
µm
ol c
L-1
)
1985
1993
2001
(b)
Figure 3 Fig. 3. Simulated vs. observed values for Ca2+ (a) and SO4
2−
(b) lake concentrations (µmolc L−1) at the 20 study lakes for threeyears (1985, 1993, 2001) spanning the calibration period.
3 Results and discussion
3.1 Model calibration
Multiple calibrations were performed on simulations runfrom 1850 to 2002 using the historical deposition sequences.All twenty catchments were successful calibrated. Compar-ison of simulated and observed values for multiple years
0
20
40
60
80
100
120
Ca
2+ (
µm
ol c
L-1
)
0
20
40
60
80
100
120
1980 1985 1990 1995 2000 2005
Year
AN
C (
µm
ol c
L-1
)
0
20
40
60
80
100
120
SO
42- (
µm
ol c
L-1
)
5
5.5
6
6.5
7
7.5
pH
Fig. 4. MAGIC simulation (solid line) calibrated to long-term time-series (1983–2002) of observed data (solid circles) for pH, Ca2+,SO4
2− and ANC (µmolc L−1) at Bird Lake.
of the interactive calibration period showed good agree-ment (Fig. 3) with the trend through the time-series of ob-servational data showing a good fit (Fig. 4). The nor-malised mean absolute error (Janssen and Heuberger, 1995)for Ca2+, SO4
2− and ANC ranged between 0.08–0.28, 0.08–0.29, and 0.15–0.78, respectively, for the time-series cal-ibrations. In the current study, the calibration of organicacid charge density prior to input in MAGIC resulted in rea-sonable predictions of lake pH throughout the time-seriesused for calibration. Calibrated catchment weathering ratesrange from 48 to 219 mmolc m−2 yr−1 with a mean valueof 112 mmolc m−2 yr−1 which is within the range of valuespreviously published for the study region (Whitfield et al.,2006b). Modelled pre-industrial (1850) levels of ANC andpH suggest that 20 and 16 of the study lakes exhibit a capac-ity to reach the specified critical chemical criteria, respec-tively (Table 5).
www.hydrol-earth-syst-sci.net/11/951/2007/ Hydrol. Earth Syst. Sci., 11, 951–963, 2007

958 C. J. Whitfield et al.: Modelling acidification, recovery and target loads
Table 5. Lake acid neutralizing capacity (ANC) and pH values for 1850, 1975, 2002, 2030 and 2100 as simulated by MAGIC.
ANC pH
Catchment 1850 1975 2002 2030 2100 1850 1975 2002 2030 2100Allens 154 97 106 122 130 6.70 6.49 6.53 6.59 6.62Bird 125 60 81 92 98 6.62 6.31 6.44 6.49 6.52Brenton 126 37 83 88 94 5.81 4.47 4.99 5.09 5.20Jesse 103 44 76 79 82 6.39 5.82 6.20 6.23 6.25Tedford 98 35 70 73 76 6.52 6.08 6.37 6.39 6.41Trefry 158 85 119 126 131 6.59 6.20 6.42 6.46 6.48Beaverskin 34 −5 10 15 18 5.96 4.86 5.35 5.54 5.60Big Dam 64 24 41 46 49 6.26 5.74 6.03 6.09 6.12Pebbleloggitch 43 4 19 25 27 4.80 4.41 4.52 4.58 4.60Annis 107 49 70 77 83 6.56 6.22 6.38 6.42 6.45Huey 71 21 34 42 47 6.22 5.37 5.73 5.88 5.96Little Wiles 77 −29 1 21 30 6.39 4.52 5.17 5.79 5.95Matthew 89 51 55 57 59 6.12 5.51 5.62 5.65 5.71Halfway 63 20 33 39 42 6.02 5.01 5.39 5.57 5.66Branch 56 28 44 44 45 4.98 4.58 4.78 4.78 4.79Glasgow 38 12 27 28 29 5.07 4.60 4.84 4.86 4.86John Dee 72 41 59 59 60 5.66 4.91 5.36 5.37 5.39Long 144 102 119 122 126 6.69 6.53 6.60 6.61 6.63Mica Hill 79 46 64 66 67 5.66 4.89 5.30 5.35 5.38Round 67 38 54 55 56 5.21 4.68 4.94 4.95 4.97
3.2 Chemical response
Substantial decreases in ANC and pH since 1850 indicatethat all 20 study lakes have been impacted by acidic deposi-tion (Table 5, Fig. 5). The time trends demonstrate a closeinverse relationship with the deposition trend for SO4
2−
(Fig. 2) where peak SO42− deposition during the 1940s and1970s coincide with minima of ANC and pH. The depressionof ANC and pH below critical limits (20µmolc L−1 and 5.4respectively) for extended periods of time indicates the po-tential for impacts on aquatic communities. Regional mod-elling of sensitive catchments follows similar trends in otherregions in Canada (Ontario: Aherne et al., 2003), althoughANC levels in for the study lakes are generally much lower.For a sub-set of the study lakes, Whitfield et al. (2006b)found that the soil profiles (rooting zone) have lower basecation weathering rates (3–13 mmolc m−2 yr−1) than the pro-files of sensitive soils in Ontario (36–73 mmolc m−2 yr−1:Watmough and Dillon, 2003) where the rooting zone en-compasses nearly the entire soil depth. The low weather-ing rates (evidenced by catchment and soil profile methods)likely contribute to the low ANC levels observed for thestudy lakes. Similarly, the low historic ANC estimated forthe Nova Scotia study lakes is due to shallow, base poor soilsthat exhibit low mineral weathering and have much lowerpre-acidification base cation saturation (Fig. 5) when com-pared to sensitive regions of Ontario.
North American emissions reductions measures imple-mented in the 1980s are predicted to have resulted in an in-crease in ANC in Nova Scotian lakes. In the 1970s, nineof the lakes were predicted to have ANC below the criticallimit (20 µmol L−1). The predicted depression in pH in themid 1970s relative to the modelled historical condition var-ied substantially from lake to lake; ranging from one tenthof a unit to a full unit. Recovery of ANC and pH startedshortly after, SO42− deposition decreased in the 1970s, andis expected to continue slowly but steadily into the future(Fig. 5). At the end of the calibration period (2002), threelakes were below the critical ANC limit, with two of thesepredicted to recover to an acceptable ANC (>20µmolc L−1)
by 2030. Catchments that demonstrated the greatest buffer-ing capacity prior to acidification have undergone the great-est absolute change in ANC, and will continue to be the mostdistant from their estimated natural condition upon comple-tion of emissions reductions (Fig. 5). Ten lakes are below pH5.4 in 2002, with three of these lakes predicted not to recoverby the end of the forecast period (2100: Table 5), and fourhaving a predicted low (<5.4) historical pH.
Clair et al. (2003) reported that ANC in Nova Scotia lakeswill be quick to return to background levels due to the lowinitial ANC concentrations. The results presented here sug-gest otherwise, notwithstanding the relatively quick initialrecovery following lower levels of acid deposition. This dis-crepancy may result from the inclusion of detailed soil datain this study, which may have resulted in lower estimates of
Hydrol. Earth Syst. Sci., 11, 951–963, 2007 www.hydrol-earth-syst-sci.net/11/951/2007/
C. J. Whitfield et al.: Modelling acidification, recovery and target loads 959
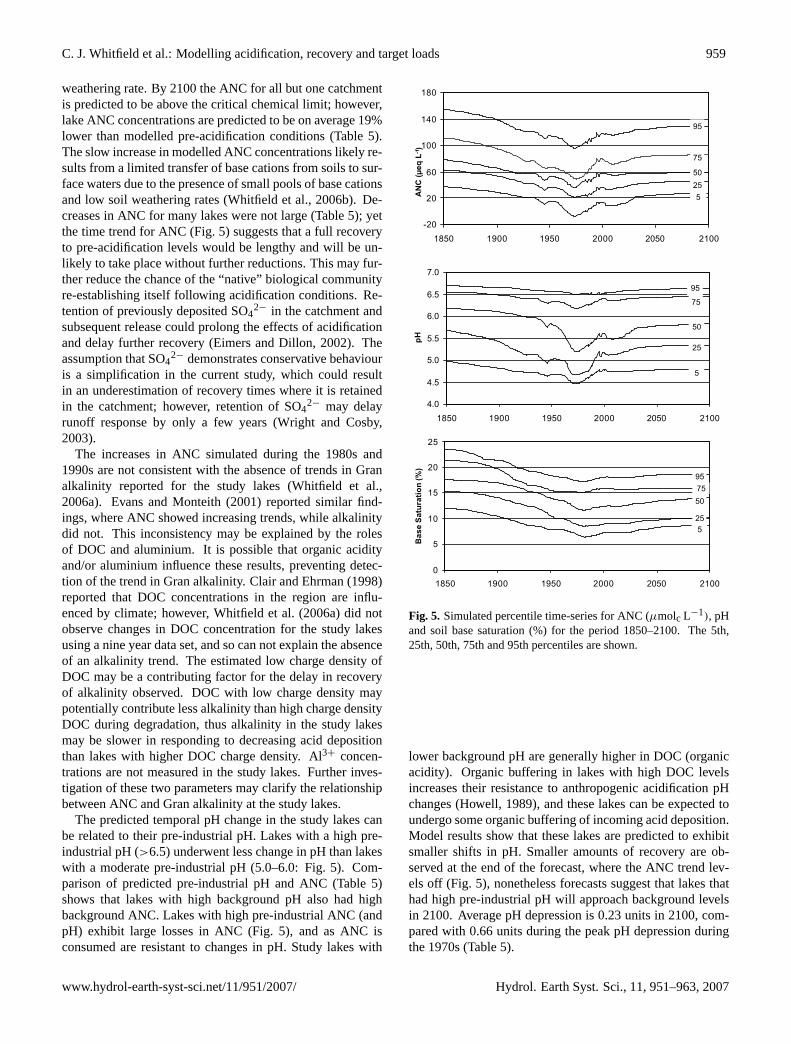
weathering rate. By 2100 the ANC for all but one catchmentis predicted to be above the critical chemical limit; however,lake ANC concentrations are predicted to be on average 19%lower than modelled pre-acidification conditions (Table 5).The slow increase in modelled ANC concentrations likely re-sults from a limited transfer of base cations from soils to sur-face waters due to the presence of small pools of base cationsand low soil weathering rates (Whitfield et al., 2006b). De-creases in ANC for many lakes were not large (Table 5); yetthe time trend for ANC (Fig. 5) suggests that a full recoveryto pre-acidification levels would be lengthy and will be un-likely to take place without further reductions. This may fur-ther reduce the chance of the “native” biological communityre-establishing itself following acidification conditions. Re-tention of previously deposited SO4
2− in the catchment andsubsequent release could prolong the effects of acidificationand delay further recovery (Eimers and Dillon, 2002). Theassumption that SO42− demonstrates conservative behaviouris a simplification in the current study, which could resultin an underestimation of recovery times where it is retainedin the catchment; however, retention of SO4
2− may delayrunoff response by only a few years (Wright and Cosby,2003).
The increases in ANC simulated during the 1980s and1990s are not consistent with the absence of trends in Granalkalinity reported for the study lakes (Whitfield et al.,2006a). Evans and Monteith (2001) reported similar find-ings, where ANC showed increasing trends, while alkalinitydid not. This inconsistency may be explained by the rolesof DOC and aluminium. It is possible that organic acidityand/or aluminium influence these results, preventing detec-tion of the trend in Gran alkalinity. Clair and Ehrman (1998)reported that DOC concentrations in the region are influ-enced by climate; however, Whitfield et al. (2006a) did notobserve changes in DOC concentration for the study lakesusing a nine year data set, and so can not explain the absenceof an alkalinity trend. The estimated low charge density ofDOC may be a contributing factor for the delay in recoveryof alkalinity observed. DOC with low charge density maypotentially contribute less alkalinity than high charge densityDOC during degradation, thus alkalinity in the study lakesmay be slower in responding to decreasing acid depositionthan lakes with higher DOC charge density. Al3+ concen-trations are not measured in the study lakes. Further inves-tigation of these two parameters may clarify the relationshipbetween ANC and Gran alkalinity at the study lakes.
The predicted temporal pH change in the study lakes canbe related to their pre-industrial pH. Lakes with a high pre-industrial pH (>6.5) underwent less change in pH than lakeswith a moderate pre-industrial pH (5.0–6.0: Fig. 5). Com-parison of predicted pre-industrial pH and ANC (Table 5)shows that lakes with high background pH also had highbackground ANC. Lakes with high pre-industrial ANC (andpH) exhibit large losses in ANC (Fig. 5), and as ANC isconsumed are resistant to changes in pH. Study lakes with
-20
20
60
100
140
180
1850 1900 1950 2000 2050 2100
AN
C (
µe
q L
-1)
95
75
50
25
5
4.0
4.5
5.0
5.5
6.0
6.5
7.0
1850 1900 1950 2000 2050 2100p
H
5
25
50
75
95
0
5
10
15
20
25
1850 1900 1950 2000 2050 2100
Ba
se
Sa
tura
tio
n (
%)
95
75
50
25
5
Fig. 5. Simulated percentile time-series for ANC (µmolc L−1), pHand soil base saturation (%) for the period 1850–2100. The 5th,25th, 50th, 75th and 95th percentiles are shown.
lower background pH are generally higher in DOC (organicacidity). Organic buffering in lakes with high DOC levelsincreases their resistance to anthropogenic acidification pHchanges (Howell, 1989), and these lakes can be expected toundergo some organic buffering of incoming acid deposition.Model results show that these lakes are predicted to exhibitsmaller shifts in pH. Smaller amounts of recovery are ob-served at the end of the forecast, where the ANC trend lev-els off (Fig. 5), nonetheless forecasts suggest that lakes thathad high pre-industrial pH will approach background levelsin 2100. Average pH depression is 0.23 units in 2100, com-pared with 0.66 units during the peak pH depression duringthe 1970s (Table 5).
www.hydrol-earth-syst-sci.net/11/951/2007/ Hydrol. Earth Syst. Sci., 11, 951–963, 2007

960 C. J. Whitfield et al.: Modelling acidification, recovery and target loads
Table 6. Target loads calculated for the four lakes predicted not to reach critical chemical limits by 2030. The target loads assume a lineardecrease in SO4
2− deposition during the period 2002–2030.
Lake Criteria 2030 Target Load Non-marine SO42− reduction Percent reductiona
mmolc m−2 yr−1 mmolc m−2 yr−1 % non-marine SO42−
Brenton pH N/A – –John Dee pH 32.95 18.10 67Mica Hill pH 31.62 14.15 52Beaverskin ANC 24.56 29.46 77
a Percent reductions are based on 2030 depositions relative to 2002 depositions for non-marine SO42−.
3.3 Target loads
Target load analysis was performed on the four lakes(Beaverskin, Brenton, John Dee and Mica Hill) predictedto be acidified below the respective critical chemical criteria(ANC×1, pH×3) in 2030. Four lakes with pH<5.4 (Peb-bleloggitch, Branch, Glasgow and Round) could not be ex-amined this way, as modelled pre-industrial values were pre-dicted to be below the critical limit. The target load wasdefined as the required reduction in acid deposition to en-sure lakes reach the critical chemical criteria by 2030. Itis important to note that these target loads include all ex-pected future emissions reductions, but are more stringentin order to meet the specified chemical criteria by the tar-get year (2030). At present, N does not play a significantrole in acidification at the study catchments, as the major-ity of N deposition is retained in the catchments, and NO3
−
and NH4+ lake concentrations are at or below detection lim-
its for all twenty lakes. Given the simplified treatment ofN dynamics in the current study, model outputs will not besignificantly affected by changes in N deposition. As such,the target load analysis was confined to reductions in S de-position. Linear reductions in acid loading were specified tobegin following the end of the calibration period (2002) andto terminate in 2030. No target load calculation was possi-ble for Brenton, indicating that only through a later evalu-ation year (>2030), will it be possible to reach the criticalchemical limit (Table 6). In order to restore a biologicallysuitable chemical condition in the remaining three lakes, tar-get loads calculations show that a reduction of emissions toapproximately 30% of present emissions levels is necessary(Table 6). Recent modelling applications for Europe (Jenk-ins et al., 2003; Wright et al., 2005) and Canada (Aherneet al., 2003; Environment Canada, 2004) also recommendfurther emissions reductions. Given that the impending ef-fects of climate change may include increased frequency orseverity of sea-salt episodes, which can be responsible forfish kills through short-term depression of ANC, it is impor-tant that critical chemical criteria continue to be evaluatedin the future for their efficacy under changed environmen-tal conditions, and if necessary adjusted to provide sufficient
protection for the ecosystem. Larssen (2005) demonstratedthat the severity of these sea-salt episodes will be somewhatmitigated by decreasing acid inputs.
3.4 Base saturation
Weathering is controlled primarily by temperature, mineral-ogy and water flux, and will not change significantly fromyear to year. Model forecasts predict that increases in ANCwill slow, suggesting that the supply of base cations from thesoil exchangeable pool has decreased and that base cationson the soil complex may be bound more tightly as the BSlevel decreases. Model hindcasts consistently predicted thatBS decreased from 1850 (mean=17.7%) through to the mid-1980’s (mean=11.9%), approximately 10 years after peakSO4
2− deposition, and 10 years after minima for ANC andpH were predicted. This suggests that base cation releasefrom the soil may have decreased after recovery in surfacewater chemistry began and is a possible explanation for thelimited recovery observed in surface waters. In soils whereBS has decreased due to acidic deposition (base cation out-puts exceed inputs), S reductions are necessary to increaseBS (Jenkins et al., 2003). Recovery is consistently simulatedacross the study catchments throughout the 100 year fore-cast, but by 2100 only a small fraction of the base cationslost to acidification have been restored (Fig. 5). Simula-tion results for soils at acid-sensitive catchments in centralOntario continue to show long-term decreases in BS underproposed emission reduction scenarios (Aherne et al., 2003),which may be in part attributed to higher current depositionin that region. Nonetheless, soils in Nova Scotia are depletedin base cations and the relatively small soil pools (Whitfieldet al., 2006b) provide little contribution of base cations torunoff, resulting in very sensitive surface waters.
Predicted increases in BS were largest during the periodfrom 2030–2050, relative to 2010–2030, 2050–2070. ThisBS restoration process appears to indicate that a new equi-librium between the soil solution and exchangeable sites isbeing established corresponding to the level of depositionfor 2030. As the BS decreases, base cations may becomeharder to displace from, and easier to return to, the exchange-
Hydrol. Earth Syst. Sci., 11, 951–963, 2007 www.hydrol-earth-syst-sci.net/11/951/2007/
C. J. Whitfield et al.: Modelling acidification, recovery and target loads 961
able sites on the soil. This should allow for a relativelyquick equilibration to new (lower) levels of deposition asbase cations return to soil exchange complexes. Simulationsindicate that the catchment soils lost an average of 32% oftheir estimated pre-industrial exchangeable base cations bythe mid 1980s, when base saturation was at a minimum. Theend of the forecast period shows an average loss of 23% ofpre-industrial base saturation (Fig. 5). In comparison to therecovery in lake ANC and pH described above, restoration ofsoil pools is a much slower process. Larssen (2005) reportedthat soil pools of exchangeable base cations for Norwegiancatchments required several hundred years for recovery. Itappears the soils in Nova Scotia, with their low weatheringrates (48–219 mmolc m−2 yr−1) will too require a long pe-riod for recovery under proposed emissions scenarios. Giventhe relatively low weathering rates in the study catchments,further reductions in acidic deposition are needed to widenthe margin between inputs of base cations from atmosphericdeposition and weathering, and the outputs in runoff stimu-lated by acidic deposition in order to expedite the return ofbase saturation levels towards their pre-acidification levels.Furthermore, it appears that ANC and pH will see only lim-ited improvements without increases in BS and base cationpools to a level closer to their pre-acidification state. Thismay have important consequences for the biological com-munities in the lakes.
4 Conclusions
The application of MAGIC to twenty headwater catchmentsin Nova Scotia was used to determine the extent of acidifica-tion in the region, as well as the potential for recovery. AnANC of 20µmolc L−1 and pH of 5.4 were defined as criticalchemical limits for aquatic organisms in the current study.Four lakes were predicted to have pre-industrial (1850) val-ues less than pH 5.4. Under the proposed emissions reduc-tions (to approximately 50% of current deposition) only fourof the remaining catchment were predicted to remain belowthe critical chemical limits. However, three of the four lakeswere further predicted to reach the chemical criteria by 2030under more stringent emissions reductions (to approximately30% of current deposition). In contrast to the generally goodprognosis for surface waters, soils base saturation recoverywas predicted to be very slow, averaging 23% lower thanpre-acidification levels in 2100. As soils reach a new equi-librium with deposition following completion of emissionsreductions, the rate of improvement of water chemistry isexpected to taper. Additional emissions reductions are nec-essary to allow soils and surface waters to reach acceptablechemical criteria and to reverse some of the damage fromanthropogenic acidification.
Acknowledgements. This work was funded by a NSERC StrategicGrant awarded to P. J. Dillon (Trent University), J. Smol and B.Cumming (Queen’s University). Tom Clair’s support with the
water quality data and knowledge of the study area was greatlyappreciated. We thank all individuals who contributed to samplecollection and lab analysis of the soil and water samples usedin this research. The authors gratefully acknowledge the Cana-dian National Atmospheric Chemistry (NAtChem) PrecipitationDatabase and its data contributing agencies for the provision ofthe wet deposition maps for 1994–1998, used in this publication.The agencies responsible for data contributions in 2002 to theNAtChem/Precipitation Database include Environment Canada,the provinces of New Brunswick, Nova Scotia and Newfoundland.
Edited by: K. Bishop
References
Aherne, J., Dillon, P. J., and Cosby, B. J.: Acidification and recoveryof aquatic ecosystems in south central Ontario, Canada: regionalapplication of the MAGIC model, Hydrol. Earth Syst. Sci., 7,561–573, 2003,http://www.hydrol-earth-syst-sci.net/7/561/2003/.
Aherne, J. and Farrell, E. P.: Deposition of sulphur, nitrogen andacidity in precipitation over Ireland: chemistry, spatial variationand long-term trends, Atmos. Environ., 36, 8, 1379–1389, 2002.
Beamish, R. J. and Harvey, H. H.: Acidification of the La ClocheMountain lakes, Ontario and resulting fish mortalities, Journal ofthe Fisheries Research Board of Canada, 29, 1131–1143, 1972.
Clair, T. A., Dennis, I. F., Amiro, P. G., and Cosby B. J.: Past and fu-ture chemistry changes in acidified Nova Scotian Atlantic salmon(Salmo salar) rivers: a dynamic modeling approach, CanadianJournal of Fisheries and Aquatic Sciences, 61, 1965–1975, 2004.
Clair, T. A., Dennis, I. F., and Cosby, B. J.: Probable changes inlake chemistry in Canada’s Atlantic Provinces under proposedNorth American emission reductions, Hydro. Earth Syst. Sci., 7,574–583, 2003.
Clair, T. A., Ehrman, J. M., Ouellet, A. J., Brun, G., Lockerbie,D., and Ro, C. U.: Changes in freshwater acidification trends inCanada’s Atlantic Provinces: 1983–1997, Water, Air, and SoilPollution, 135, 335–354, 2002.
Clair, T. A., Lockerbie, D., and Ouellet, A. J.: EnvironmentCanada’s Precipitation Monitoring Networks in Atlantic Canada,CD-ROM Atlantic Region Report – Occasional Report No. 16,Environment Canada, Sackville, New Brunswick, 2001.
Clair, T. A. and Ehrman, J. M.: The influence of changing seasonalclimates in modifying discharge, dissolved organic carbon andnitrogen export in wetland influenced rivers: a neural networkapproach, Water Resour. Res., 34, 447–455, 1998.
Cosby, B. J., Ferrier, R. C., Jenkins, A., and Wright, R. F.: Mod-elling the effects of acid deposition: refinements, adjustmentsand inclusion of nitrogen dynamics in the MAGIC model, Hy-drol. Earth Syst. Sci., 5, 499–517, 2001,http://www.hydrol-earth-syst-sci.net/5/499/2001/.
Cosby, B. J., Norton, S. A., and Kahl, J. S.: Using a paired-catchment manipulation experiment to evaluate a catchment-scale biogeochemical model, The Science of the Total Environ-ment, 183, 49–66, 1996.
Cosby, B. J., Hornberger, G. M., Galloway, J. N., and Wright, R.F.: Modeling the Effects of Acid Deposition: Assessment of aLumped Parameter Model of Soil Water and Streamwater Chem-istry, Water Resour. Res., 21, 51–63, 1985a.
www.hydrol-earth-syst-sci.net/11/951/2007/ Hydrol. Earth Syst. Sci., 11, 951–963, 2007

962 C. J. Whitfield et al.: Modelling acidification, recovery and target loads
Cosby, B. J., Hornberger, G. M., Galloway, J. N., and Wright, R. F.:Time scales of catchment acidification, Environ. Sci. Technol.,19, 1144–1149, 1985b.
Dillon, P. J., Somers, K. M., Findeis, J., and Eimers, M. C.: Coher-ent response of lakes in Ontario, Canada to reductions in sulphurdeposition: the effects of climate on sulphate concentrations, Hy-drol. Earth Syst. Sci., 7, 583–595, 2003,http://www.hydrol-earth-syst-sci.net/7/583/2003/.
Dillon, P. J. and LaZerte, B. D.: Response of the Plastic Lake catch-ment, Ontario, to reduced sulphur deposition, Environ. Pollut.,77, 211–217, 1992.
Dillon, P. J., Lusis, M., Reid, R., and Yap, D.: Ten-year trendsin sulphate, nitrate and hydrogen deposition in central Ontario,Atmos. Environ., 22, 901–905, 1988.
Dillon, P. J., Reid, R. A., and de Grosbois, E.: The rate of acidi-fication of aquatic ecosystems in Ontario, Canada, Nature, 329,45–48, 1987.
Dillon, P. J., Jeffries, D. S., Snyder, W., Reid, R., Yan, N. D., Evans,D., Moss, J., and Scheider, W. A.: Acidic Precipitation in South-Central Ontario: Recent Observations, Journal of the FisheriesResearch Board of Canada, 35, 809–815, 1978.
Driscoll, C. T., Lehtinen, M. D., and Sullivan, T. J.: Modeling theacid-base chemistry of organic solutes in Adirondack, New York,lakes, Water Resour. Res., 30, 297–306, 1994.
Eimers, M. C. and Dillon, P. J.: Climate effects on sulphate fluxfrom forested catchments in south-central Ontario, Biogeochem-istry, 61, 337–355, 2002.
Environment Canada: Hydrological Atlas of Canada, Canadian Na-tional Committee for the International Hydrological Decade, Ot-tawa, Ontario, 1978.
Environment Canada: Canadian National Atmospheric ChemistryPrecipitation Database, Meteorological Service of Canada, 4905Dufferin Street, Toronto, Canada, 2003.
Environment Canada: Canadian Acid Deposition Science Assess-ment: Summary of Key Results, Environment Canada, Meteoro-logical Service of Canada, Downsview, Ontario, 2004.
Evans, C. D. and Monteith, D. T.: Chemical trends at lakes andstreams in the UK Acid Waters Monitoring Network, 1988–2000: Evidence for recent recovery at a national scale, Hydrol.Earth Syst. Sci., 5, 351–366, 2001,http://www.hydrol-earth-syst-sci.net/5/351/2001/.
Farmer, G. J., Goff, T. R., Ashfield, D., and Samant, H. F.: Some ef-fects of the acidification of Atlantic salmon rivers in Nova Scotia,Canadian Technical Report of Fisheries and Aquatic Sciences,972, 1–13, 1980.
Galloway, J. N., Dianwu, Z., Thomson, V. E., and Chang, L. H.:Nitrogen mobilisation in the United States of America and thePeople’s Republic of China, Atmos. Environ., 30, 1551–1661,1996.
Galloway, J. N.: Acid deposition: perspectives in time and space,Water, Air, and Soil Pollution, 85, 15–24, 1995.
Gorham, E.: The chemical composition of lake waters in HalifaxCounty, Nova Scotia, Limnol. Oceanogr., 2, 12–21, 1957.
Hedin, L., Granat, L., Likens, G. E., Buishand, T. A., Galloway, J.N., Butler, T. J., and Rodhe, H.: Steep declines in atmosphericbase cations in regions of Europe and North America, Nature,367, 351–354, 1994.
Henriksen, A., Kamari, J., Posch, M., and Wilander, A.: Criticalloads of acidity: Nordic surface waters, Ambio, 21, 356–363,
1992.Howell, G. D.: Seasonal patterns of mineral and organic acidifica-
tion in two streams in southwestern Nova Scotia, Water, Air, andSoil Pollution, 46, 165–175, 1989.
Hruska, J., Kohler, S., Laudon, H., and Bishop, K. Is a Univer-sal Model of Organic Acidity Possible: Comparison of the AcidBase Properties of Dissolved Organic Carbon in the Boreal andTemperate Zones, Environ. Sci. Technol., 37, 1726–1730, 2003.
Husar, R.: Industrial Metabolism: Sulphur and Nitrogen EmissionTrends for the United States: An Application of the MaterialsFlow Approach, United Nations University Press, 1994.
Janssen, P. H. M. and Heuberger, P. S. C.: Calibration of process-oriented models, Ecological Modelling, 83, 55–66, 1995.
Jeffries, D. S., Clair, T. A., Couture, S., Dillon, P. J., Dupont, J.,Keller, W., McNicol, D. K., Turner, M. A., Vet, R., and Weeber,R.: Assessing the Recovery of Lakes in Southeastern Canadafrom the Effects of Acidic Deposition, Ambio, 32, 176–182,2003.
Jeffries, D. S. and Ouimet, R.: Canadian Acid Deposition Sci-ence Assessment Chapter 8: Critical Loads: Are They Be-ing Exceeded?, Meteorological Service of Canada, EnvironmentCanada, Downsview, Ontario, 2004.
Jenkins, A., Camarero, L., Cosby, B. J., Ferrier, R. C., Forsius, M.,Helliwell, R. C., Kopacek, J., Majer, V., Moldan, F., Posch, M.,Rogora, M., Schopp, W., and Wright, R. F.: A modelling assess-ment of acidification and recovery of European surface waters,Hydrol. Earth Syst. Sci., 7, 447–455, 2003,http://www.hydrol-earth-syst-sci.net/7/447/2003/.
Kaminski, J. W.: Emissions-Scenario Simulations of New Provin-cial SO2 Reduction Targets using the Acid Deposition and Oxi-dant Model, Atmospheric Research and Modelling Consultants,Toronto, Canada, 2002.
Larssen, T., Brereton, C., and Gunn, J. M.: Dynamic modelling ofrecovery from acidification of lakes in Killarney Park, Ontario,Canada, Ambio, 32, 244–248, 2003.
Larssen, T.: Model prognoses for future acidification recovery ofsurface waters in Norway using long-term monitoring data, Env-iron. Sci. Technol., 39, 7970–7979, 2005.
Marmorek, D. R., MacQueen, R. M., Wedeles, C. H. R., Korman, J.,Blancher, P. J., and McNicol, D. K.: Improving pH and alkalinityestimates for regional-scale acidification models: incorporationof dissolved organic carbon, Canadian Journal of Fisheries andAquatic Sciences, 53, 1602–1608, 1996.
Office of Technology Assessment: Acid rain and transported airpollutants: Implications for public policy, OT A-0-204, U.S.Congress Office of Technology Assessment, Washington, D.C.,1984.
Posch, M., Kamari, J., Forsius, M., Henriksen, A., and Wilander,A.: Environmental auditing: Exceedance of Critical Loads forLakes in Finland, Norway, and Sweden: Reduction Require-ments for Acidifying Nitrogen and Sulfur Deposition, Environ.Manage., 21, 291–304, 1997.
Ro, C. U. and Vet, R. J.: Analyzed data fields from the NationalAtmospheric Chemistry Database (NAtChem) and Analysis Fa-cility, Air Quality Research Branch, Meteorological Service ofCanada, Environment Canada, Toronto, 2003.
Shaw, R. W.: Acid precipitation in Atlantic Canada, Environ. Sci.Technol., 13, 406–411, 1979.
UNECE: Manual on methodologies and criteria for Modelling and
Hydrol. Earth Syst. Sci., 11, 951–963, 2007 www.hydrol-earth-syst-sci.net/11/951/2007/

C. J. Whitfield et al.: Modelling acidification, recovery and target loads 963
Mapping Critical Loads and Levels and Air Pollution Effects,Risks, Trends, Pages V.-13, in: Convention on Long-rangeTransboundary Air Pollution, 2004.
U.S. EPA: National Air Pollutant Emissions Trends, 1900–1998,EPA-454/R-00-002, United States Environmental ProtectionAgency Office of Air Quality Planning and Standards Research,Triangle Park, 2000.
Vet R. J. and Shaw, M.: 1994–1998 average dry deposition ve-locities calculated using the MSC Air Quality Research Branchdry deposition model (RDM), Meteorological Service of Canada,Environment Canada, Toronto, Ontario, 2004.
Watmough, S. A. and Dillon, P. J.: Base cation and nitrogen budgetsfor seven forested catchments in central Ontario, Forest Ecol.Manage., 177, 155–177, 2003.
Whitfield, C. J., Aherne, J., Watmough, S. A., Dillon, P. D., andClair, T. A.: Recovery from acidification in Nova Scotia: tem-poral trends and critical loads for 20 headwater lakes, Cana-dian Journal of Fisheries and Aquatic Sciences, 63, 1504–1514,2006a.
Whitfield, C. J., Watmough, S. A., Aherne, J., and Dillon, P. D.: Acomparison of weathering rates for acid-sensitive catchments inNova Scotia, Canada and their impact on critical load calcula-tions, Geoderma, 136, 899–911, 2006b.
Wright, R. F., Larssen, T., Camarero, L., Cosby, B. J., Ferrier, R. C.,Helliwell, R. C., Forsius, M., Jenkins, A., Kopacek, J., Majer, V.,Moldan, F., Posch, M., Rogora, M., and Schopp, W.: Recoveryof acidified European surface waters, Environ. Sci. Technol., 39,64A–72A, 2005.
Wright, R. F. and Cosby, B. J.: Future recovery of acidified lakes insouthern Norway predicted by the MAGIC model, Hydrol. EarthSyst. Sci., 7, 467–483, 2003,http://www.hydrol-earth-syst-sci.net/7/467/2003/.
WxPrime Corporation: Emissions-scenario simulations of potentialnitrogen emission reductions using the Acid Deposition and Ox-idant Model (ADOM), Report prepared for Meteorological Ser-vice of Canada, Toronto, Ontario, 51p., 2004.
Yanni, S., Keys, K., Clair, T. A., and Arp, P. A.: Fog and acidifica-tion impacts on ion budgets of basins in Nova Scotia, Canada, J.Amer. Water Resour. Assoc., 36, 619–631, 2000.
www.hydrol-earth-syst-sci.net/11/951/2007/ Hydrol. Earth Syst. Sci., 11, 951–963, 2007