Embed Size (px)
Citation preview
Modelling and Evaluation of MPPT Techniques
based on a Ćuk Converter
Vinay P M.Tech Scholar
Mar Baselios College of Engineering & Technology, Kerala,
India
Manju Ann Mathew Assistant Professor
Mar Baselios College of Engineering & Technology, Kerala,
India
Abstract — Solar PV plays a vital role in meeting the
current power requirements. India has been a forerunner
in the utilization of solar energy and currently SPV is the
second most used renewable energy source, first being
wind energy. For availing most of the power generated by
PV panels, we make use of MPPT techniques. The two
main environmental factors that affect the output of a PV
system are the temperature level and Irradiance level. In
this work, the temperature as well as irradiance level for
varying atmospheric condition are given from historically
available data for Southern India. A PV system for
varying atmospheric conditions are modelled using Matlab
Simulink and Five MPPT techniques are evaluated based
on a Ćuk converter.
Keywords— Solar PV, Ćuk Converter, Photovoltaics,
Maximum Power Point Tracking.
I. INTRODUCTION
India is currently the Fifth largest producer and consumer
of electricity in the world. Also it has been a front runner in
the usage of renewable energy, in fact India was the first
country to include a separate ministry under the government
for renewable energy sources. Solar energy is abundant in
nature and is free to use Solar PV is the simplest and cheapest
mode for transforming incoming solar radiation to electrical
energy. Many papers have been published on the mode of
conversion. In order to utilize the most of the generated
power, we make use of Maximum Power Point Techniques.
There are several MPPT techniques that are simple, complex
and hybrid in nature. Most of the techniques senses the
voltage/current or power, however there are methods which
senses temperature and/or irradiance level to track down the
MPP. The implementation of the technique can be done on
any of the DC-DC converters.
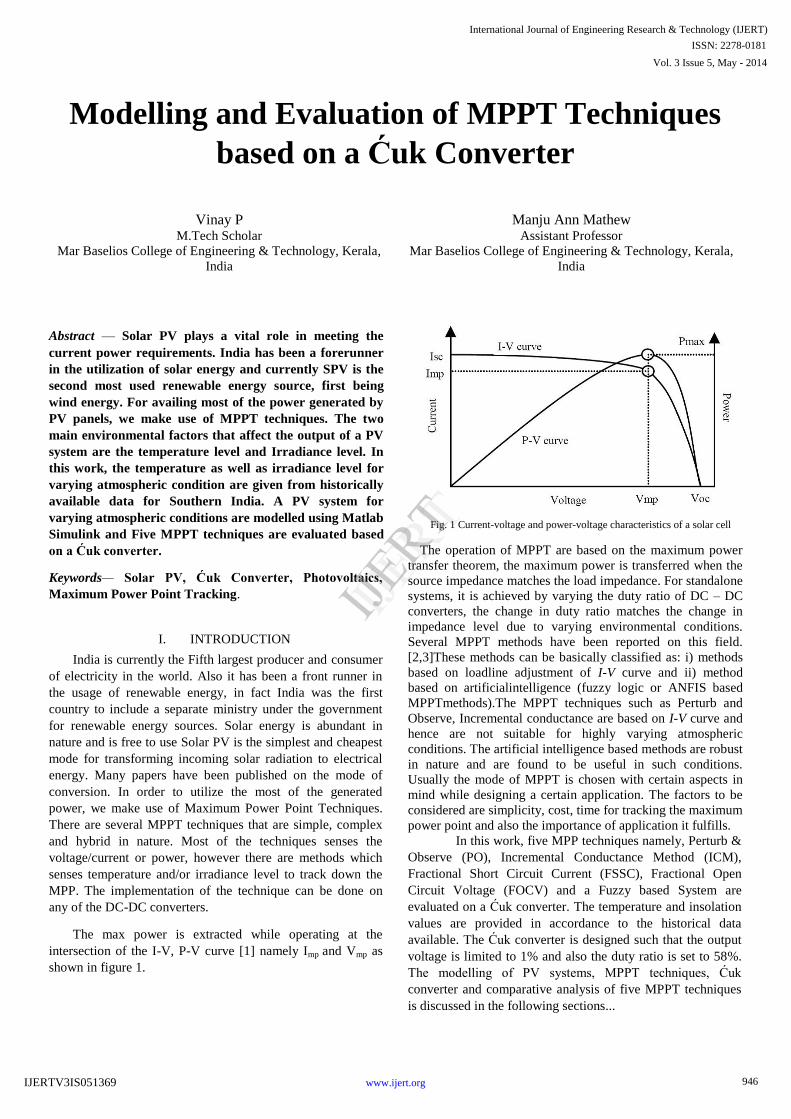
The max power is extracted while operating at the
intersection of the I-V, P-V curve [1] namely Imp and Vmp as
shown in figure 1.
Fig. 1 Current-voltage and power-voltage characteristics of a solar cell
The operation of MPPT are based on the maximum power
transfer theorem, the maximum power is transferred when the
source impedance matches the load impedance. For standalone
systems, it is achieved by varying the duty ratio of DC – DC
converters, the change in duty ratio matches the change in
impedance level due to varying environmental conditions.
Several MPPT methods have been reported on this field.
[2,3]These methods can be basically classified as: i) methods
based on loadline adjustment of I-V curve and ii) method
based on artificialintelligence (fuzzy logic or ANFIS based
MPPTmethods).The MPPT techniques such as Perturb and
Observe, Incremental conductance are based on I-V curve and
hence are not suitable for highly varying atmospheric
conditions. The artificial intelligence based methods are robust
in nature and are found to be useful in such conditions.
Usually the mode of MPPT is chosen with certain aspects in
mind while designing a certain application. The factors to be
considered are simplicity, cost, time for tracking the maximum
power point and also the importance of application it fulfills.
In this work, five MPP techniques namely, Perturb &
Observe (PO), Incremental Conductance Method (ICM),
Fractional Short Circuit Current (FSSC), Fractional Open
Circuit Voltage (FOCV) and a Fuzzy based System are
evaluated on a Ćuk converter. The temperature and insolation
values are provided in accordance to the historical data
available. The Ćuk converter is designed such that the output
voltage is limited to 1% and also the duty ratio is set to 58%.
The modelling of PV systems, MPPT techniques, Ćuk
converter and comparative analysis of five MPPT techniques
is discussed in the following sections...
946
International Journal of Engineering Research & Technology (IJERT)
IJERT
IJERT
ISSN: 2278-0181
www.ijert.orgIJERTV3IS051369
Vol. 3 Issue 5, May - 2014
II. MODELLING OF PV MODULE
The Photovoltaic cell is basically a p-n junction fabricated
in a thin wafer of semiconductor in which solar energy is
directly converted to electricity by means of photoelectric
effect. A PV cell exhibits nonlinear P-V and I-V
characteristics that vary with cell temperature (T) and Solar
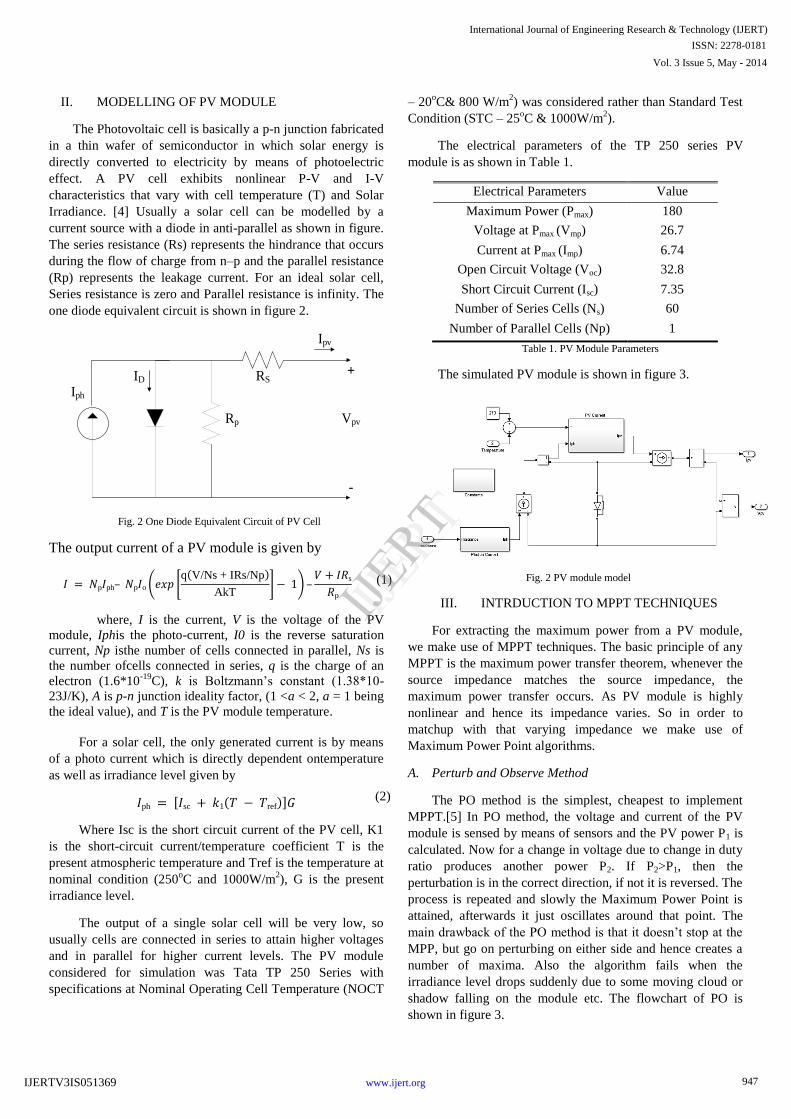
Irradiance. [4] Usually a solar cell can be modelled by a
current source with a diode in anti-parallel as shown in figure.
The series resistance (Rs) represents the hindrance that occurs
during the flow of charge from n–p and the parallel resistance
(Rp) represents the leakage current. For an ideal solar cell,
Series resistance is zero and Parallel resistance is infinity. The
one diode equivalent circuit is shown in figure 2.
Iph
RS
Rp
+
-
Vpv
Ipv
ID
Fig. 2 One Diode Equivalent Circuit of PV Cell
The output current of a PV module is given by
𝐼 = 𝑁p𝐼ph– 𝑁p𝐼o 𝑒𝑥𝑝 q V/Ns + IRs/Np
AkT − 1 –
𝑉 + 𝐼𝑅s
𝑅p
where, I is the current, V is the voltage of the PV
module, Iphis the photo-current, I0 is the reverse saturation
current, Np isthe number of cells connected in parallel, Ns is
the number ofcells connected in series, q is the charge of an
electron (1.6*10-19
C), k is Boltzmann’s constant (1.38*10-
23J/K), A is p-n junction ideality factor, (1 <a < 2, a = 1 being
the ideal value), and T is the PV module temperature.
For a solar cell, the only generated current is by means
of a photo current which is directly dependent ontemperature
as well as irradiance level given by
𝐼ph = 𝐼sc + 𝑘1 𝑇 − 𝑇ref 𝐺
Where Isc is the short circuit current of the PV cell, K1
is the short-circuit current/temperature coefficient T is the
present atmospheric temperature and Tref is the temperature at
nominal condition (250oC and 1000W/m
2), G is the present
irradiance level.
The output of a single solar cell will be very low, so
usually cells are connected in series to attain higher voltages
and in parallel for higher current levels. The PV module
considered for simulation was Tata TP 250 Series with
specifications at Nominal Operating Cell Temperature (NOCT
– 20oC& 800 W/m
2) was considered rather than Standard Test
Condition (STC – 25oC & 1000W/m
2).
The electrical parameters of the TP 250 series PV
module is as shown in Table 1.
Electrical Parameters Value
Maximum Power (Pmax) 180
Voltage at Pmax (Vmp) 26.7
Current at Pmax (Imp) 6.74
Open Circuit Voltage (Voc) 32.8
Short Circuit Current (Isc) 7.35
Number of Series Cells (Ns) 60
Number of Parallel Cells (Np) 1
Table 1. PV Module Parameters
The simulated PV module is shown in figure 3.
Fig. 2 PV module model
III. INTRDUCTION TO MPPT TECHNIQUES
For extracting the maximum power from a PV module,
we make use of MPPT techniques. The basic principle of any
MPPT is the maximum power transfer theorem, whenever the
source impedance matches the source impedance, the
maximum power transfer occurs. As PV module is highly
nonlinear and hence its impedance varies. So in order to
matchup with that varying impedance we make use of
Maximum Power Point algorithms.
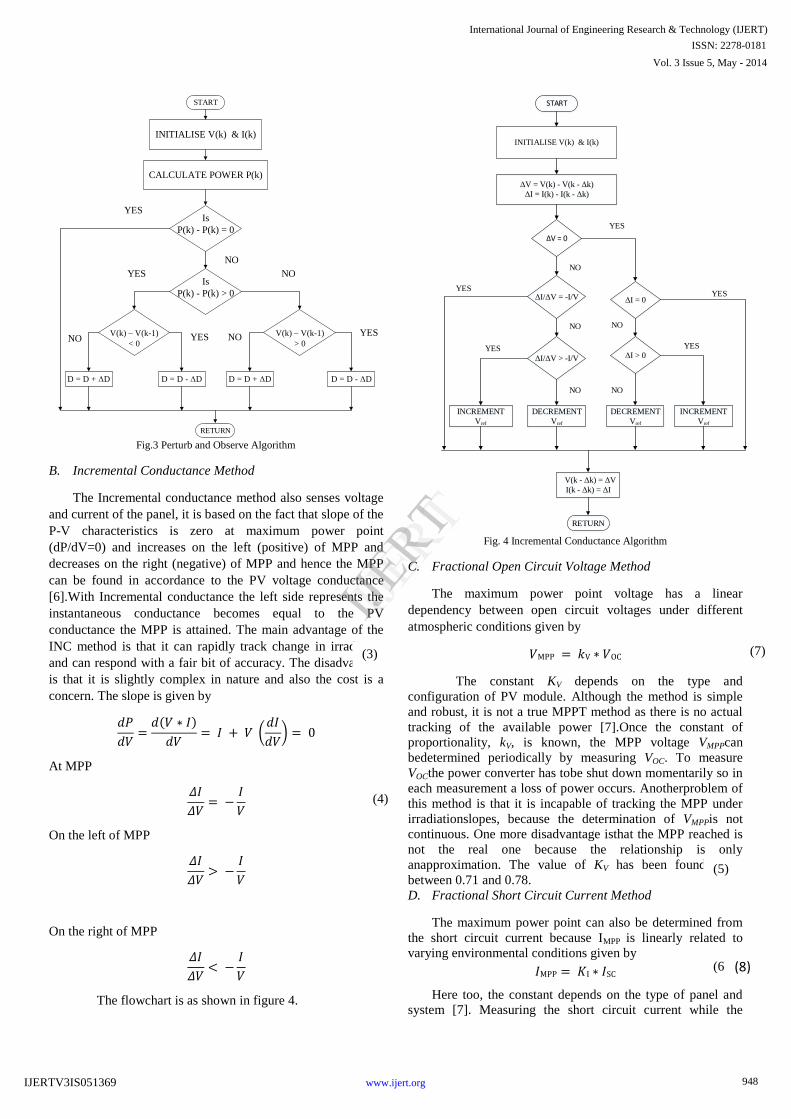
A. Perturb and Observe Method
The PO method is the simplest, cheapest to implement
MPPT.[5] In PO method, the voltage and current of the PV
module is sensed by means of sensors and the PV power P1 is
calculated. Now for a change in voltage due to change in duty
ratio produces another power P2. If P2>P1, then the
perturbation is in the correct direction, if not it is reversed. The
process is repeated and slowly the Maximum Power Point is
attained, afterwards it just oscillates around that point. The
main drawback of the PO method is that it doesn’t stop at the
MPP, but go on perturbing on either side and hence creates a
number of maxima. Also the algorithm fails when the
irradiance level drops suddenly due to some moving cloud or
shadow falling on the module etc. The flowchart of PO is
shown in figure 3.
(1)
(2)
947
International Journal of Engineering Research & Technology (IJERT)
IJERT
IJERT
ISSN: 2278-0181
www.ijert.orgIJERTV3IS051369
Vol. 3 Issue 5, May - 2014
START
INITIALISE V(k) & I(k)
CALCULATE POWER P(k)
D = D + ΔD D = D - ΔD D = D + ΔD D = D - ΔD
RETURN
Is
P(k) - P(k) = 0
YES
NO
Is
P(k) - P(k) > 0
V(k) – V(k-1)
< 0
V(k) – V(k-1)
> 0NO NOYES YES
NOYES
Fig.3 Perturb and Observe Algorithm
B. Incremental Conductance Method
The Incremental conductance method also senses voltage
and current of the panel, it is based on the fact that slope of the
P-V characteristics is zero at maximum power point
(dP/dV=0) and increases on the left (positive) of MPP and
decreases on the right (negative) of MPP and hence the MPP
can be found in accordance to the PV voltage conductance
[6].With Incremental conductance the left side represents the
instantaneous conductance becomes equal to the PV
conductance the MPP is attained. The main advantage of the
INC method is that it can rapidly track change in irradiance
and can respond with a fair bit of accuracy. The disadvantage
is that it is slightly complex in nature and also the cost is a
concern. The slope is given by
𝑑𝑃
𝑑𝑉=
𝑑 𝑉 ∗ 𝐼
𝑑𝑉= 𝐼 + 𝑉
𝑑𝐼
𝑑𝑉 = 0
At MPP
𝛥𝐼
𝛥𝑉= −
𝐼
𝑉
On the left of MPP
𝛥𝐼
𝛥𝑉> −
𝐼
𝑉
On the right of MPP
𝛥𝐼
𝛥𝑉< −
𝐼
𝑉
The flowchart is as shown in figure 4.
START
ΔV = 0
ΔI/ΔV = -I/V ΔI = 0
ΔI > 0
DECREMENT
Vref
DECREMENT
Vref
INCREMENT
Vref
INCREMENT
Vref
V(k - Δk) = ΔV
I(k - Δk) = ΔI
RETURN
ΔV = V(k) - V(k - Δk)
ΔI = I(k) - I(k - Δk)
INITIALISE V(k) & I(k)
ΔI/ΔV > -I/V
NO
NO NO
NO NO
YES
YESYES
YES YES
Fig. 4 Incremental Conductance Algorithm
C. Fractional Open Circuit Voltage Method
The maximum power point voltage has a linear
dependency between open circuit voltages under different
atmospheric conditions given by
𝑉MPP = 𝑘V ∗ 𝑉OC
The constant KV depends on the type and
configuration of PV module. Although the method is simple
and robust, it is not a true MPPT method as there is no actual
tracking of the available power [7].Once the constant of
proportionality, kV, is known, the MPP voltage VMPPcan
bedetermined periodically by measuring VOC. To measure
VOCthe power converter has tobe shut down momentarily so in
each measurement a loss of power occurs. Anotherproblem of
this method is that it is incapable of tracking the MPP under
irradiationslopes, because the determination of VMPPis not
continuous. One more disadvantage isthat the MPP reached is
not the real one because the relationship is only
anapproximation. The value of KV has been found to in
between 0.71 and 0.78.
D. Fractional Short Circuit Current Method
The maximum power point can also be determined from
the short circuit current because IMPP is linearly related to
varying environmental conditions given by
𝐼MPP = 𝐾I ∗ 𝐼SC
Here too, the constant depends on the type of panel and
system [7]. Measuring the short circuit current while the
(3)
(4)
(5)
(6)
(7)
(8)
948
International Journal of Engineering Research & Technology (IJERT)
IJERT
IJERT
ISSN: 2278-0181
www.ijert.orgIJERTV3IS051369
Vol. 3 Issue 5, May - 2014
system is operating is a problem. It usuallyrequires adding an
additional switch to the power converter to periodically short
the PVarray and measure ISC. In ISCis measured by shorting the
PV array with anadditional field-effect transistor added
between the PV array and the DC link capacitor. The KI value
was found to be in between 0.78 and 0.92.
E. Fuzzy Based System
The advent of VLSI has made fuzzy based MPPT the most
popular over the years. It can be stated as accurate when
compared to other techniques because of its good and fast
response to varying temperature and irradiance levels. Also
the Fuzzy based system doesn’t require an exact model of the
PV module for the designing the controller. There are three
stages – Fuzzification, Inference (Rule base Lookup table) and
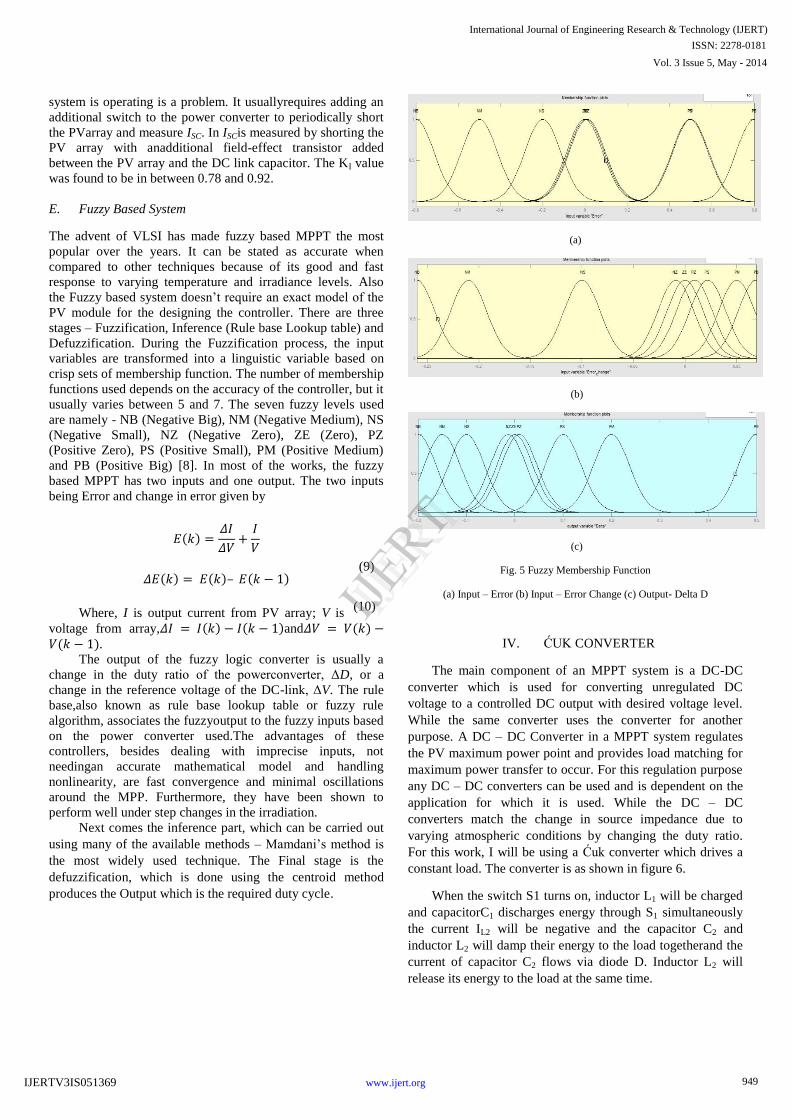
Defuzzification. During the Fuzzification process, the input
variables are transformed into a linguistic variable based on
crisp sets of membership function. The number of membership
functions used depends on the accuracy of the controller, but it
usually varies between 5 and 7. The seven fuzzy levels used
are namely - NB (Negative Big), NM (Negative Medium), NS
(Negative Small), NZ (Negative Zero), ZE (Zero), PZ
(Positive Zero), PS (Positive Small), PM (Positive Medium)
and PB (Positive Big) [8]. In most of the works, the fuzzy
based MPPT has two inputs and one output. The two inputs
being Error and change in error given by
𝐸 𝑘 =𝛥𝐼
𝛥𝑉+
𝐼
𝑉
𝛥𝐸 𝑘 = 𝐸 𝑘 – 𝐸 𝑘 − 1
Where, I is output current from PV array; V is output
voltage from array,𝛥𝐼 = 𝐼 𝑘 − 𝐼 𝑘 − 1 and𝛥𝑉 = 𝑉(𝑘) −𝑉(𝑘 − 1).
The output of the fuzzy logic converter is usually a
change in the duty ratio of the powerconverter, ΔD, or a
change in the reference voltage of the DC-link, ΔV. The rule
base,also known as rule base lookup table or fuzzy rule
algorithm, associates the fuzzyoutput to the fuzzy inputs based
on the power converter used.The advantages of these
controllers, besides dealing with imprecise inputs, not
needingan accurate mathematical model and handling
nonlinearity, are fast convergence and minimal oscillations
around the MPP. Furthermore, they have been shown to
perform well under step changes in the irradiation.
Next comes the inference part, which can be carried out
using many of the available methods – Mamdani’s method is
the most widely used technique. The Final stage is the
defuzzification, which is done using the centroid method
produces the Output which is the required duty cycle.
(a)
(b)
(c)
Fig. 5 Fuzzy Membership Function
(a) Input – Error (b) Input – Error Change (c) Output- Delta D
IV. ĆUK CONVERTER
The main component of an MPPT system is a DC-DC
converter which is used for converting unregulated DC
voltage to a controlled DC output with desired voltage level.
While the same converter uses the converter for another
purpose. A DC – DC Converter in a MPPT system regulates
the PV maximum power point and provides load matching for
maximum power transfer to occur. For this regulation purpose
any DC – DC converters can be used and is dependent on the
application for which it is used. While the DC – DC
converters match the change in source impedance due to
varying atmospheric conditions by changing the duty ratio.
For this work, I will be using a Ćuk converter which drives a
constant load. The converter is as shown in figure 6.
When the switch S1 turns on, inductor L1 will be charged
and capacitorC1 discharges energy through S1 simultaneously
the current IL2 will be negative and the capacitor C2 and
inductor L2 will damp their energy to the load togetherand the
current of capacitor C2 flows via diode D. Inductor L2 will
release its energy to the load at the same time.
(9)
(10)
949
International Journal of Engineering Research & Technology (IJERT)
IJERT
IJERT
ISSN: 2278-0181
www.ijert.orgIJERTV3IS051369
Vol. 3 Issue 5, May - 2014

L1 C1L2
C2DT
+
-
VIN RL
Fig. 6 Ćuk Converter
The output voltage and current are given by
𝑉O
𝑉i
=𝐷
1 − 𝐷
𝐼O
𝐼S
=1 − 𝐷
𝐷
The design equations are given by
𝐿1 =𝑉dc𝐷
𝛥𝐼1𝑓
𝐿2 =𝑉dc𝐷
𝛥𝐼2𝑓
𝐶1 =𝐼S 1 − 𝐷
𝛥𝑉C1𝑓
𝐶2 =𝛥𝐼2
8𝛥𝑉C2𝑓
V. MODELLING AND SIMULATION OF MPPT
TECHNIQUES
A. Simulation
The modelling of the MPPT techniques were carried out in
MATLABTM
/SIMULINKTM
and the simulation is carried out
for varying temperature and insolation levels.The initial duty
value is taken as 0.58 and the model of MPPT techniques are
as shown in figure 7.
(a)
(b)
(c)
(d)
(e)
Fig. 7 Various MPPT Techniques
(a) P&O (b) ICM (c) FOCV (d) FSSC (e) Fuzzy based system
The Irradiance and temperature level are given with
respect to the available data from a study conducted for over
years [9].
The overall Simulation model is shown in Figure 8.
(11)
(12)
(13)
(14)
(15)
(16)
950
International Journal of Engineering Research & Technology (IJERT)
IJERT
IJERT
ISSN: 2278-0181
www.ijert.orgIJERTV3IS051369
Vol. 3 Issue 5, May - 2014
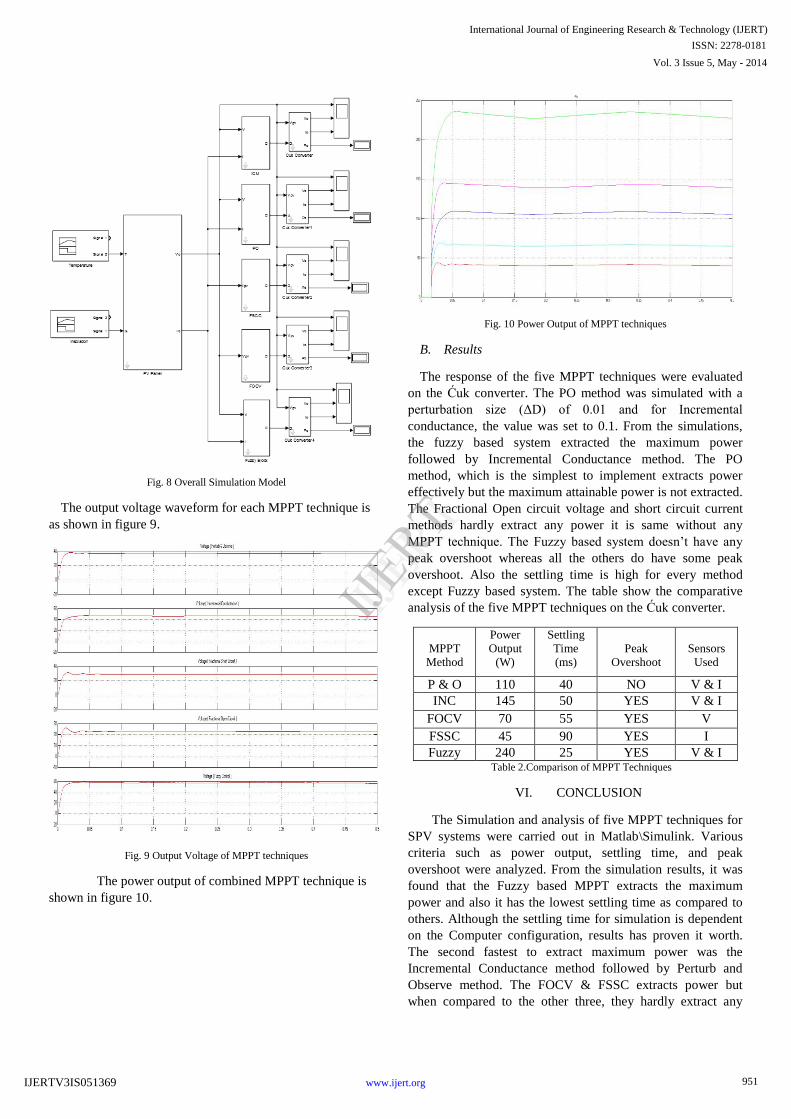
Fig. 8 Overall Simulation Model
The output voltage waveform for each MPPT technique is
as shown in figure 9.
Fig. 9 Output Voltage of MPPT techniques
The power output of combined MPPT technique is
shown in figure 10.
Fig. 10 Power Output of MPPT techniques
B. Results
The response of the five MPPT techniques were evaluated
on the Ćuk converter. The PO method was simulated with a
perturbation size (ΔD) of 0.01 and for Incremental
conductance, the value was set to 0.1. From the simulations,
the fuzzy based system extracted the maximum power
followed by Incremental Conductance method. The PO
method, which is the simplest to implement extracts power
effectively but the maximum attainable power is not extracted.
The Fractional Open circuit voltage and short circuit current
methods hardly extract any power it is same without any
MPPT technique. The Fuzzy based system doesn’t have any
peak overshoot whereas all the others do have some peak
overshoot. Also the settling time is high for every method
except Fuzzy based system. The table show the comparative
analysis of the five MPPT techniques on the Ćuk converter.
MPPT
Method
Power
Output
(W)
Settling
Time
(ms)
Peak
Overshoot
Sensors
Used
P & O 110 40 NO V & I
INC 145 50 YES V & I
FOCV 70 55 YES V
FSSC 45 90 YES I
Fuzzy 240 25 YES V & I Table 2.Comparison of MPPT Techniques
VI. CONCLUSION
The Simulation and analysis of five MPPT techniques for
SPV systems were carried out in Matlab\Simulink. Various
criteria such as power output, settling time, and peak
overshoot were analyzed. From the simulation results, it was
found that the Fuzzy based MPPT extracts the maximum
power and also it has the lowest settling time as compared to
others. Although the settling time for simulation is dependent
on the Computer configuration, results has proven it worth.
The second fastest to extract maximum power was the
Incremental Conductance method followed by Perturb and
Observe method. The FOCV & FSSC extracts power but
when compared to the other three, they hardly extract any
951
International Journal of Engineering Research & Technology (IJERT)
IJERT
IJERT
ISSN: 2278-0181
www.ijert.orgIJERTV3IS051369
Vol. 3 Issue 5, May - 2014

power. From the results, it is clear that fuzzy based system
extracts the maximum power but the implementation of Fuzzy
system is highly complex and not economic for domestic
purposes. So the best technique that can extract the maximum
power at a comparatively lower price will be the Incremental
Conductance method.
REFERENCES
[1]. Marcelo G, Gazoli J. and Filho E., ―Comprehensive Approach
toModeling and Simulation of Photovoltaic Arrays‖, IEEE
Transactionson Power Electronics, Vol. 24, No. 5, May 2009, pp. 1198-1208.
[2]. Esram T. and Chapman P., ―Comparison of Photovoltaic
ArrayMaximum Power Point Tracking Techniques‖, IEEE
Transactions onEnergy Conversion, Vol. 22, No. 2, June 2007, pp.
439-449. [3]. Subudhi B. and Pradhan R., ―A comparative study on maximum
powerpoint tracking t echniques for photovoltaic power systems‖,
IEEETransactions on Sustainable Energy, vol. 4, no. 1, January 2013, pp. 89-98.
[4]. Gow, J.A. and Manning, C.D. ―Development of a photovoltaic array
model for use in power-electronics simulation studies,‖ IEEE Proceedings on Electric Power Applications, Volume:146 , Issue: 2,
pp. 193 – 200, March 1999.
[5]. R. Faranda, , S. Leva, and V. Maugeri, ―MPPT techniques for PV Systems: Energetic and cost comparison‖ Power and Energy Society
General Meeting-Conversion and Delivery of Electrical Energy in
the 21st Century, 2008 IEEE . [6]. Guilherme A. and Carlos A., ―Evaluation of the Main MPPT
Techniquesfor Photovoltaic Applications‖, IEEE Transactions on
IndustrialElectronics, vol. 60, no. 3, March 2013, pp. 1156-1167.
[7]. T. Esram, P.L. Chapman, "Comparison of Photovoltaic Array
Maximum Power Point Tracking Techniques," IEEE Transactions
on Energy Conversion, vol. 22, no. 2, pp. 439-449, June 2007. [8]. Ahmed M. Othman, Mahdi M.M. El-arini, Ahmed Ghitas, Ahmed
Fathy, ―Realworld maximum power point tracking simulation of PV
system based on Fuzzy Logic control,‖ NRIAG Journal of Astronomy and Geophysics, January 2014, 186–194.
[9]. Neena Sugathan, V. Biju, G Renuka, ―Solar Activity and regional
climate over short tome scales at Thiruvananthapuram, South
Kerala, India,‖ Indian Journal of Radio & Space Physics, Vol 42,
April 2013, pp 69-72
952
International Journal of Engineering Research & Technology (IJERT)
IJERT
IJERT
ISSN: 2278-0181
www.ijert.orgIJERTV3IS051369
Vol. 3 Issue 5, May - 2014