Embed Size (px)
Citation preview

Modelling and Integration for SDG-Oriented Planning in the Developing
World
Camaren Peter (PhD)
Extraordinary Senior Lecturer, School of Public Leadership, University of Stellenbosch

Characteristics of Sustainable Development Challenges in the Developing World
• Dual formal and informal systems.
• Rapid urbanisation (without industrialisation).
• High rates of change and uncertainty: ‘glocal’ interactions play a key role.
• Poverty, inequality, precarious households.
• Infrastructure deficits: a limitation and opportunity.
• Spending and finance gaps at local levels.
• Lack of capacity for planning at local levels (especially integrated planning).

Decision Support and Modelling Challenges in Developing World Contexts • Lack or absence of adequate, timely data.
• Often, only expert opinion and judgement available to work with.
• Lack of institutional capacity, skills and expertise to support detailed modelling.
• Lack of internet access and computing power.
• Conflicting agenda’s and interests drive development agendas.
• Fragmentation: Sectors, government departments, local authorities work in silo’s.

Summary:
• Both sustainable development challenges, as well as modelling them – especially in developing world contexts – are complex systems challenges.
• Swimming in an ocean versus swimming in a pool.

Complexity-Based Modelling of Transitions to SD • Applying complexity theory to four broad theories of transitions to
sustainability: • Decoupling theory.
• Resilience theory.
• Multi-level perspective on transitions to SD.
• Behavioural change theory.
*Peter, C. and M. Swilling: Linking Complexity and Sustainability Theories: Implications for Modelling Sustainability Transitions; Sustainability, 6, pp. 1594-1622, 2014.

Complexity-Based Modelling of Transitions to SD • The basis of the modelling (and planning) process should be (Peter and
Swilling, 2014): • Probabilistic and adaptive:
• Accommodate multiple possible futures (e.g. scenarios), and • System configurations (adaptive capacity, degeneracy, redundancy).
• Integrative: • Cross-sector and cross-scale, where relevant. • Can accommodate quantitative and qualitative inputs.
• Inclusive: • Inclusivity informs integration – encourages shared understanding. • Determining actions through shared understanding of system (and priorities, conflicts, etc.). • Dealing with undecidability – shared understanding of what generates undecidability can
inform discussions regarding potential trade-offs, etc. • Adaptive capacity – boosted through inclusivity. • Creative capacity – boosted through inclusivity.

Soft and Hard Systems Modelling
• Two broad levels of integration: • Soft: mix of qualitative and quantitative data and methods used in contexts where
uncertainty about the system is greater and integration criteria are less well understood. • Soft Systems Modelling:
• Causal loop diagrams.
• Graphical causal models (GCMs), topic maps, decision trees, etc. • Bayesian networks (BNs): can mix quantitative and qualitative information.
• Hard: mainly quantitative and numerical methods used in contexts where there is greater certainty about the system and integration criteria are better understood. • Systems dynamics modelling (SD) and agent-based SD.
• Sector models (e.g. economic, agricultural, energy, water, etc.).
• Spatial and system models (e.g. hydrological, land-use, spatio-temporal vegetation change, climate change, etc.).

Soft and Hard Systems Modelling
• Key Challenge: Linking soft and hard systems modelling efforts is critical for adaptive management of sustainable development efforts.
• This is because development is an iterative process of intervening, monitoring and measuring, and adapting plans as they are implemented i.e. we are dealing with a complex, adaptive system.
• Usually conducted within the mind(s) of a modelling expert or team of modelling experts – hampers full participation in adaptive management processes.

MENTAL MODELS
COMPUTER, LAB, EMPIRICAL
MODELS, FIELD EVIDENCE & DATA
Soft System Models
Graphical Causal Models
BAYESIAN MODELS
Dynamic System Models
Agent-Based Models
Sensitivities
Uncertainties
INPUTS
OUTPUTS
1a: Conceptualizing the
System:
Strategy-making &
participatory processes
Symbolic reasoning
Languages: Soft and Open
Systems Methodologies e.g.
Graphical Causal Models
2a: Mixed Models:
Mixing Quantitative and
Qualitative variables in a
heterarchical framework for
integration
3a: Single-case Analysis:
1. Integrated research
teams
2. Multi-method research
3. Embedded units
TOP-DOWN
BOTTOM UP
1b: Mainly Qualitative: Learning,
participation, negotiation and
cooperation:
Cross-scale influences
High uncertainty and non-linearity
Too much data
Gaps in data and understanding
Conflicting conceptual models
3b: Mainly Quantitative Analyses:
Well-bounded dynamic models
Verification and validation
Thresholds
Stability regimes
Emergence from human behaviour
2b: Mixed Models

ADAPTIVE MANAGEMENT DECISION SUPPORT PROCESS
SCOPE OF
STUDY
DATA
COLLECTION
& MODEL
FORMULATION
CONSENSUS
&
AGREEMENT
DESIGN OF
EXPERIMENT
SENSITIVITY
ANALYSISRESULTS REVIEW
IDENTIFY GAPS:
KNOWLEDGE,
INFORMATION, DATA,
AREAS OF EMPHASIS &
INTERVENTIONS
EVALUATE EMPHASIS
OF STRATEGIC
PROGRAMMES
IMPLEMENT MITIGATION &
ADAPTATION
PROGRAMMES
IMPLEMENT MONITORING
PROGRAMMES
REVIEW

Bringing Soft and Hard Systems Modelling Efforts Together: A More Powerful Approach • Why Bayesian Networks as Integrators:
• Probabilistic: non-linearity, forward and backward propagation. • Conditional causality: hypotheses testing i.e. for interventions. • Mix of quantitative and qualitative data/information; even subject matter
expert opinion. • Inclusivity: easy to understand by non-scientists. • Cross-scale: supports modelling at nested scales i.e. vertical integration. • Cross-sector: i.e. horizontal integration. • Adaptable and modular – can support adaptive management programmes.
• Hence can manage integration between soft and hard modelling efforts better (i.e. more trace-ably, iteratively and reliably).

CAUSAL LOOP MODEL

ESTUARY
Shrimp
Profit
Price
Regulations &
Incentives
Harvest & Extraction
Rate
Income
QuantityCapital
Investment
Labor
Cost
Entrepreneurship
Demand
SHRIMP BIOPHYSICAL PRODUCTION
Total Adult Biomass
Growth Rate & Abundance
Fisheries
Offtake
Spawning
Food Supply
MPB Biomass
Salinity
in Mangroves
Juvenile Shrimp
Abundance
Previous
Marine spawning
Stock (adult)
Wood for
ConstructionWood
For Fuel
SHRIMP ECONOMIC PRODUCTION
Ecosystem
Services
Bay Use Value
(Shrimp)
Avicennia
Stocks
Other Mangrove
Stocks
Total Mangrove
Stocks
Carbon
Sequestration
CATCHMENT
Nature Based
Tourism
Power
Station
Biodiversity
Fruit
Farming
Effluent Abstractions
Water Quality
Input
River Flow
Input
Small
Towns
Ecosystem
Services
Land-Use
Values
Total Economic
Value
(Catchment)
ForestryTrout
Water Quality
Output (CH)
Acid Rain
River Flow
Output (CH)
Inter-Basin
Transfer
Rainfall
Temperature Range
Expected Net
MAR this year
Evaporation
Losses
Evaporation
Rate (MAR)
Water Losses
(Dams)
Stored Water (Dams)
Dam Evaporation
Losses
Dams: Planned
Water Storage
Dams: Previous
Yrs Storage
Dam Evaporation Rate
Alien
Vegetation
Urban Effluent Effluent
Urban Waste Works Rural Effluent
Urban
Population
Rural
Population
Annual Rainfall
Planned Water Available
Planned Storage
Abstractions
Climate Change &
Water Storage ModuleWater Availability
In Rivers
MAR: Mean
Annual Runoff
Sugar
Cane
Nutrient/Waste
Filtering
Total Economic
Value (Bay)
Juvenile Growth
Rate
Juvenile Shrimp
Recruitment Biomass
Predator
Protection
Natural Mortality
Rate for Adults
N Fixation
GRAPHICAL CAUSAL MODEL
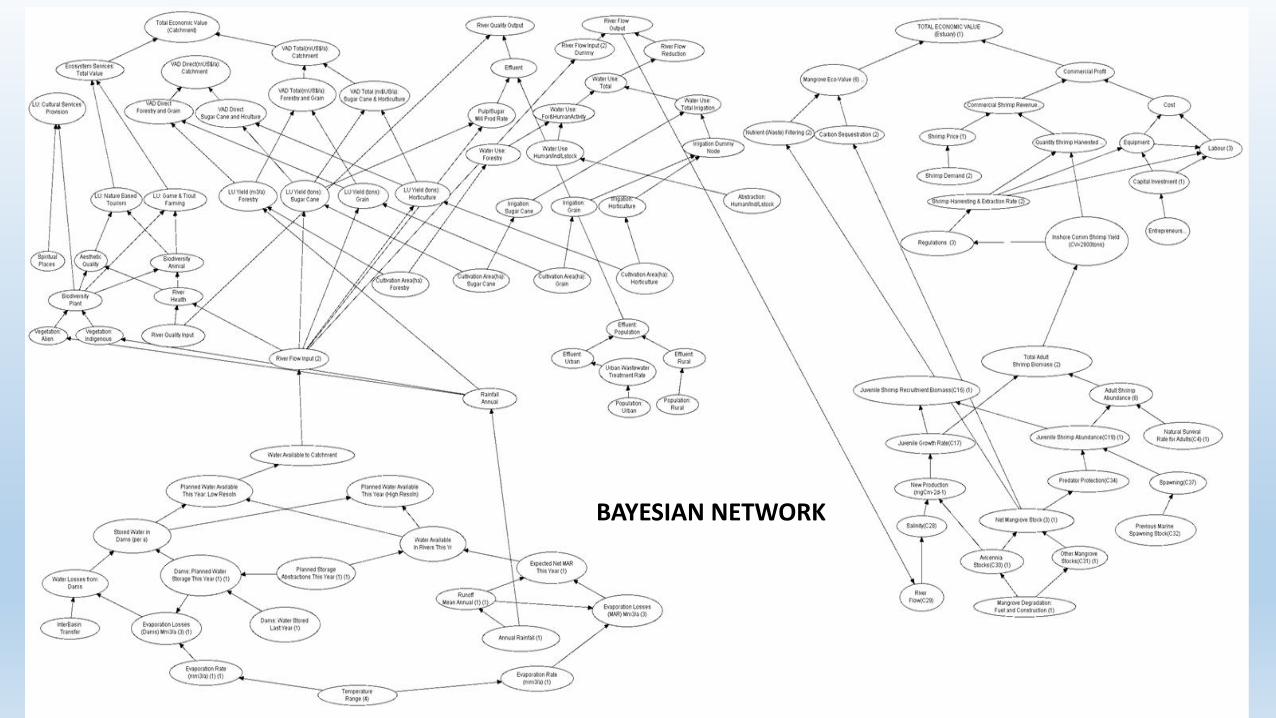
BAYESIAN NETWORK

BAYESIAN NETWORK WITH PROBABILITY DISTRIBUTIONS

Converting SME opinion to probabilities

Examples of Systems-Modelling Projects
• Catchment2Coast (EU Fifth Framework): • http://www.iospress.nl/book/catchment2coast-a-systems-approach-to-
coupled-river-coastal-ecosystem-science-and-management/
• SPEAR (Sustainable options for PEople, catchment and Aquatic Resources, EU 6th Framework): • http://www.longline.co.uk/site/spear.pdf

References:
• Peter, C. and M. Swilling: Linking Complexity and Sustainability Theories: Implications for Modelling Sustainability Transitions; Sustainability, 6, pp. 1594-1622, 2014.
• Peter, C., de Lange, W., Musango, J.K., April, K., Potgieter, A.G.E. (2009). Applying Bayesian modelling to assess climate change impacts on biofuel production, Climate Research, CR Special 20: Integrating analysis of regional climate change and response options, v 20, pp. 249-260.
• Richardson, K.A. (2002). On the limits of bottom-up computer simulation: Towards a nonlinear modelling culture [electronic version]. Proceedings of the 36th Hawaii International Conference on System Sciences, 7-10 January, 2003 Hawaii, California, IEEE Computer Society.
• Peterson, G.D., Cumming, G.S., & Carpenter, S.R. (2003). Scenario planning: a tool for conservation in an uncertain world [electronic version]. Conservation Biology, 17(2), 358-366.
• Borsuk, M. E., Stow, C. A. and Reckhow, K. H. (2004). A Bayesian network of eutrophication models for synthesis, prediction and uncertainty analysis, Ecological Modelling, ISSN 0304-3800, 173, 219-239.
• Checkland, P.B., & Scholes, J. (1990). Soft systems methodology in action. Wiley, Chichester.
• Vitabile, S. et al. (2013) Assessing Coastal Sustainability: A Bayesian Approach for Modelling and Estimating a Global Index for Measuring Risk, Journal of Telecommunications and Information Technology, Available online: http://www.nit.eu/czasopisma/JTIT/2013/4/5.pdf.
• Clark, K. (2005). Why environmental scientists are becoming Bayesians. Ecology Letters, 8, 2–14.