Embed Size (px)
Citation preview

American Journal of Applied Sciences and Engineering (AJASE) | ISSN pending
Published by ACADEMIC INK REVIEW | https://airjournal.org/ajase
12011 WestBrae Pkwy, Houston, TX 77031, United States [email protected]; [email protected]
MODELLING AND SIMULATION OF NSUKKA 33KV DISTRIBUTION NETWORK FOR LOSS REDUCTION USING SSVC, 3
Enemuoh, F. O and Chukwu, Chimezie Francis. Department of Electrical Engineering Nnamdi Azikiwe University, AWKA, NIGERIA
Publication Process Date
Received January 1st, 2021
Accepted January 6th, 2021
Published January 15th, 2021
Keywords: modeling, simulation, NSUKKA 33kv distribution network, loss reduction, SSVC
The unreliable distributed power supply in NSUKKA metropolis has liquated some companies,
industries, private establishments that solely depend on power for their daily activities. The causes of
unreliable power supply in NSUKKA metropolis are power losses in distribution network which has
arisen as a result of eddy current, short circuit, over current, over voltage, low power factor etc. The
unreliable power supply was overcome by modeling and simulation of NSUKKA 33KV distribution
network for loss reduction using SSVC. It was achieved in this manner, Characterizing power loss in
the Nsukka 33KV power Distribution Network, running the load flow of Nsukka 33KV power
distribution without SSSC from the characterized data, Modeling the SSVC using simulink for
minimizing Power losses in the Nsukka 33KV Power Distribution Network and integrating the SSVC
and its control circuit into the Simulink Model of the Nsukka 33KV Power Distribution network and re-
run the Load Flow. Finally, validating and justifying the percentage of distribution loss reduction in
Nssuka 33KV power distribution network with and without SSSC. The results obtained were
percentage of power loss at township in NSSUKA without SSVC was 4.28% while that when SSVC was
incorporated in the system was 3.585%, the percentage of power loss at Wilson in NSSUKA when
SSVC was not imbibed in the system was 7.12% while that when SSVC is incorporated was 5.963%,
the percentage of conventional power loss observed at UNN in NSSUKA was 9.92% while that
experienced when SSVC is incorporated in the system was 8.308% and the conventional percentage
power loss at Onuiyi in NSSUKA was 4.28% while the percentage when of power loss at Onuiyi in
NSSUKA when SSVC is imbibed in the system is 5.226%. With these results obtained, it indicated that
the percentage improvement in power loss reduction in distribution network when SSVC was
incorporated in the four towns in NSUKKA metropolis were 0.695% for township, 1.157% for Wilson,
1.612% for UNN and 1.02% for Onuiyi respectively..
ABSTRACT

American Journal of Applied Sciences and Engineering | AJASE Vol. 1., No. 1| January, 2021 | pp. 11-25
https://airjournal.org/ajase
ACADEMIC INK REVIEW | ENEMUOH & CHUKWU, 2021
12
Introduction
The Nsukka 33KV power distribution network, like all other distribution networks in Nigeria, waves about the entire Nsukka and it is among the largest interconnection of a distribution system in Nigeria to date. No matter how carefully the system is designed, losses are present. Electric power losses are wasteful energy caused by external factors or internal factors, and energy dissipated in the system (Gupta, 2008). They include losses due to resistance, atmospheric conditions, theft, miscalculations, etc, and losses incurred between sources of supply to load centre (or consumers). Loss minimization and quantification is very vital in all human endeavor. In power system, it can lead to more economic operation of the system. If we know how the losses occur, we can take steps to limit and minimize the losses. Consequently, this will lead to effective and efficient operation of the system. Therefore, the existing power generation and transmission can be effectively used without having the need to build new installations and at the same time save cost of losses. Basically, losses in electrical power system can be identified as those losses caused by internal factors known as Technical losses and those cause by external factors are called non-technical losses. The Nigerian electricity grid has a large proportion of transmission and distribution losses - whopping 40%. This is attributed to technical losses and non-technical losses. Due to the size of the area the power system serves, the majority of the power systems are dedicated to power transmission. Generally, system losses increase the operating cost of electric utilities and consequently result in high cost of electricity. Therefore, reduction of system losses is of paramount importance because of its financial, economic and socioeconomic values to the utility company, customers and the host country. However, low losses in transmission system could be achieved by installing generating stations near the load centers. When current flows in a transmission line, the characteristics exhibited are explained in terms of magnetic and electric field interaction. The phenomenon that results from field interactions is represented by circuit elements or parameters. A transmission line consists of four parameters which directly affect its ability to transfer power efficiently (Ong, 1992). These elements are combined to form an equivalent circuit representation of the transmission line which can be used to determine some of the transmission losses. The parameter associated with the dielectric losses that occur is represented as a shunt conductance. Conductance from line to line or a line to ground accounts for losses which occur due to the leakage current at the cable insulation and the insulators between overhead lines (Zaborszky et al, 1969). The conductance of the line is affected by many unpredictable factors, such as atmospheric pressure, and is not uniformly distributed along the line (Stevenson, 2009). The influence of these factors does not allow for accurate measurements of conductance values. Fortunately, the leakage in the overhead lines is negligible, even in detailed transient analysis. This fact allows this parameter to be completely neglected. The primary source of losses incurred in a transmission system is in the resistance of the conductors. For a certain section of a line, the power dissipated in the form of useless heat as the current attempts to overcome the ohmic resistance of the line, and is directly proportional to the square of the rms current traveling through the line. It directly follows that the losses due to the line resistance can be substantially lowered by raising the transmission voltage level, but there is a limit at which the cost of the transformers and insulators will exceed the savings (Westinghose, 1980).
Research Methodology
To Characterize power loss in the Nsukka 33KV power Distribution Network:
Power loss is the outage of power from the power system which occurs unexpectedly. However the loss in power transmission lines could be as a result of the voltage level, distance of transmission, the level of current and so on etc.

American Journal of Applied Sciences and Engineering | AJASE Vol. 1., No. 1| January, 2021 | pp. 11-25
https://airjournal.org/ajase
ACADEMIC INK REVIEW | ENEMUOH & CHUKWU, 2021
13
Fig 1: Single Line Diagram of the Nsukka 33 KV Power Distribution Network
The Nsukka 33KV distribution network consists of five buses, four feeders, four transformers and five transmission lines. it receives its incoming 33KV supply from the New Haven 330/132/33KV transmission network. The 33KV voltage is then stepped down to 11KV using four 5MVA, 33/11KV transformers and feeds Township, Wilson, UNN and Onuiyi on 11KV as shown in fig 1 above
New Haven 33KV Bus
33KV Incomer from New Haven
33/11KV 33/11KV 33/11KV 33/11KV
Bus 1
Bus 2 Bus 4 Bus 3 Bus 5
UNN ONUIYI WILSON

American Journal of Applied Sciences and Engineering | AJASE Vol. 1., No. 1| January, 2021 | pp. 11-25
https://airjournal.org/ajase
ACADEMIC INK REVIEW | ENEMUOH & CHUKWU, 2021
14
Fig 2: Simulink model of the Nsukka 33KV Power distribution network without SSVC
The formular for the percentage loss in a power system can be calculated using the formular:
%𝑃𝑜𝑤𝑒𝑟 𝐿𝑜𝑠𝑠 = (𝐴𝑐𝑡𝑢𝑎𝑙 𝑃𝑜𝑤𝑒𝑟−𝐿𝑜𝑎𝑑 𝑃𝑜𝑤𝑒𝑟
𝐴𝑐𝑡𝑢𝑎𝑙 𝑃𝑜𝑤𝑒𝑟) × 100 …(1)
Ie %𝑃𝐿𝑜𝑠𝑠 = (𝑃𝐴𝑐𝑡𝑢𝑎𝑙−𝑃𝐿𝑜𝑎𝑑
𝑃𝐴𝑐𝑡𝑢𝑎𝑙) × 100
Now in power in a Three phase AC system is given by:
𝑃3∅ = 𝑉3∅𝐼3∅𝑐𝑜𝑠𝜃 …(2)
Where 𝑃3∅ = 𝑇ℎ𝑟𝑒𝑒 𝑃ℎ𝑎𝑠𝑒 𝐴𝑝𝑝𝑎𝑟𝑒𝑛𝑡 𝑃𝑜𝑤𝑒𝑟 𝐼𝑛 𝑡ℎ𝑒 𝑆𝑦𝑠𝑡𝑒𝑚
𝑉3∅ = 𝑇ℎ𝑟𝑒𝑒 𝑃ℎ𝑎𝑠𝑒 𝑉𝑜𝑙𝑡𝑎𝑔𝑒 𝑖𝑛 𝑡ℎ𝑒 𝑆𝑦𝑠𝑡𝑒𝑚
𝐼3∅ = 𝑇ℎ𝑟𝑒𝑒 𝑃ℎ𝑎𝑠𝑒 𝐶𝑢𝑟𝑟𝑒𝑛𝑡 𝑖𝑛 𝑡ℎ𝑒 𝑆𝑦𝑠𝑡𝑒𝑚
And 𝑐𝑜𝑠 𝜃 = 𝑡ℎ𝑒 𝑝𝑜𝑤𝑒𝑟 𝑓𝑎𝑐𝑡𝑜𝑟 𝑤ℎ𝑖𝑐ℎ 𝑖𝑠 0.8 𝑓𝑜𝑟 𝑡ℎ𝑒 𝑁𝑖𝑔𝑒𝑟𝑖𝑎𝑛 𝑝𝑜𝑤𝑒𝑟 𝑠𝑦𝑠𝑡𝑒𝑚
Assuming the systems are connected in delta, then
𝑉∅ = 𝑉𝐿 and
𝐼∅ =𝐼𝐿
√3
Using the above in equation two yields
𝑃3∅ = 𝑉𝐿 (𝐼𝐿
√3) 𝑐𝑜𝑠𝜃 …(3)
Now for the ogui-Enugu power Distribution network, the percentage Power Loss Will be given by:

American Journal of Applied Sciences and Engineering | AJASE Vol. 1., No. 1| January, 2021 | pp. 11-25
https://airjournal.org/ajase
ACADEMIC INK REVIEW | ENEMUOH & CHUKWU, 2021
15
%𝑃𝑜𝑤𝑒𝑟 𝐿𝑜𝑠𝑠 = (𝑃𝐿𝑜𝑎𝑑
𝑃3∅) × 100 …(4)
Where 𝑃𝐿𝑜𝑎𝑑 = 𝑃𝑜𝑤𝑒𝑟 𝑖𝑛 𝑡ℎ𝑒 𝑆𝑒𝑐𝑡𝑖𝑜𝑛 𝑜𝑓 𝑡ℎ𝑒 𝑂𝑔𝑢𝑖 − 𝐸𝑛𝑢𝑔𝑢 𝑃𝑜𝑖𝑤𝑒𝑟 𝐷𝑖𝑠𝑡𝑟𝑖𝑏𝑢𝑡𝑖𝑜𝑛
𝑛𝑒𝑡𝑤𝑜𝑟𝑘 𝑏𝑒𝑖𝑛𝑔 𝑐𝑜𝑛𝑠𝑖𝑑𝑒𝑟𝑒𝑑.
Table 1: The load distribution in the network can be shown as follows:
S/n Feeders Voltage(KV) Current(A) 𝑷𝑨𝒄𝒕𝒖𝒂𝒍(MW) 𝑷𝑳𝒐𝒂𝒅(MW) %Loss
1 Township 10.497 261.92 3.98 3.81 4.28
2 Wilson 10.217 68.232 1.04 0.965 7.12
3 UNN 9.909 175.173 2.67 2.405 9.92
4 Onuiyi 10.314 63.64 0.97 0.91 6.24
Av 6.89
The Actual Power Being supplied by the Enugu Electricity distribution Company (EEDC) to these feeders at a certain day and time is shown in table 1. Fig 3.2 shows the Simulink model of the Ogui-Enugu 33 distribution network from which load flow was performed and the results shown and analysed in chapter four.
The nominal Voltage and Actual power supplied by EEDC is shown in table below
s/n Feeders Nominal Voltage (KV) Nominal Current (A) Supplied Power
1 Township 11 261.92 3.98
2 Wilson 11 68.232 1.04
3 UNN 11 175.173 2.67
4 Onuiyi 11 63.64 0.97

American Journal of Applied Sciences and Engineering | AJASE Vol. 1., No. 1| January, 2021 | pp. 11-25
https://airjournal.org/ajase
ACADEMIC INK REVIEW | ENEMUOH & CHUKWU, 2021
16
To run the load flow of Nsukka 33KV power distribution without SSSC from the characterized data
SimPowerSystems Report. generated by powergui, 09-Dec-2019 16:39:36 Model : C:\Users\Able\Documents\MATLAB\NSUKKA_DISTRIBUTION.mdl.
[1] Load-Flow voltages and currents:
States at 50 Hz :
10.314e+001 V -54.25А ---> Uc_phase_A: ONUIYI FEEDER 10.311e+001 V -174.25А ---> Uc_phase_B: ONUIYI FEEDER 10.311e+001 V 65.75А ---> Uc_phase_C: ONUIYI FEEDER 10.497e+001 V -54.25А ---> Uc_phase_A: TOWNSHIP FEEDER 10.497e+001 V -174.25А ---> Uc_phase_B: TOWNSHIP FEEDER 10.497e+001 V 65.75А ---> Uc_phase_C: TOWNSHIP FEEDER 9.9090e+001 V 65.75А ---> Uc_phase_A: UNN FEEDER 9.9090e+001 V -174.25А ---> Uc_phase_B: UNN FEEDER 9.9090e+001 V -54.25А ---> Uc_phase_C: UNN FEEDER 10.217e+001 V -54.25А ---> Uc_phase_A: WILSON FEEDER 10.217e+001 V -174.25А ---> Uc_phase_B: WILSON FEEDER 10.217e+001 V 65.75А ---> Uc_phase_C: WILSON FEEDER 5.8226e+000 A 22.15А ---> Il_transfo_1_winding_1: 5 MVA, 33//11KV3 6.0234e-001 A -114.25А ---> Il_transfo_1_winding_2: 5 MVA, 33//11KV3 4.0156e+000 A -24.25А ---> Il_transfo_1_Lm: 5 MVA, 33//11KV3 5.8226e+000 A -97.85А ---> Il_transfo_2_winding_1: 5 MVA, 33//11KV3 6.0234e-001 A 125.75А ---> Il_transfo_2_winding_2: 5 MVA, 33//11KV3 4.0156e+000 A -144.25А ---> Il_transfo_2_Lm: 5 MVA, 33//11KV3 5.8226e+000 A 142.15А ---> Il_transfo_3_winding_1: 5 MVA, 33//11KV3 6.0234e-001 A 5.75А ---> Il_transfo_3_winding_2: 5 MVA, 33//11KV3 4.0156e+000 A 95.75А ---> Il_transfo_3_Lm: 5 MVA, 33//11KV3 5.8226e+000 A 22.15А ---> Il_transfo_1_winding_1: 5 MVA, 33//11KV2 6.0234e-001 A -114.25А ---> Il_transfo_1_winding_2: 5 MVA, 33//11KV2 4.0156e+000 A -24.25А ---> Il_transfo_1_Lm: 5 MVA, 33//11KV2 5.8226e+000 A -97.85А ---> Il_transfo_2_winding_1: 5 MVA, 33//11KV2 6.0234e-001 A 125.75А ---> Il_transfo_2_winding_2: 5 MVA, 33//11KV2 4.0156e+000 A -144.25А ---> Il_transfo_2_Lm: 5 MVA, 33//11KV2 5.8226e+000 A 142.15А ---> Il_transfo_3_winding_1: 5 MVA, 33//11KV2 6.0234e-001 A 5.75А ---> Il_transfo_3_winding_2: 5 MVA, 33//11KV2 4.0156e+000 A 95.75А ---> Il_transfo_3_Lm: 5 MVA, 33//11KV2 5.8226e+000 A 22.15А ---> Il_transfo_1_winding_1: 5 MVA, 33//11KV1 6.0234e-001 A -114.25А ---> Il_transfo_1_winding_2: 5 MVA, 33//11KV1 4.0156e+000 A -24.25А ---> Il_transfo_1_Lm: 5 MVA, 33//11KV1 5.8226e+000 A -97.85А ---> Il_transfo_2_winding_1: 5 MVA, 33//11KV1 6.0234e-001 A 125.75А ---> Il_transfo_2_winding_2: 5 MVA, 33//11KV1 4.0156e+000 A -144.25А ---> Il_transfo_2_Lm: 5 MVA, 33//11KV1 5.8226e+000 A 142.15А ---> Il_transfo_3_winding_1: 5 MVA, 33//11KV1 6.0234e-001 A 5.75А ---> Il_transfo_3_winding_2: 5 MVA, 33//11KV1 4.0156e+000 A 95.75А ---> Il_transfo_3_Lm: 5 MVA, 33//11KV1 5.8226e+000 A 22.15А ---> Il_transfo_1_winding_1: 5 MVA, 33//11KV 6.0234e-001 A -114.25А ---> Il_transfo_1_winding_2: 5 MVA, 33//11KV 4.0156e+000 A -24.25А ---> Il_transfo_1_Lm: 5 MVA, 33//11KV 5.8226e+000 A -97.85А ---> Il_transfo_2_winding_1: 5 MVA, 33//11KV 6.0234e-001 A 125.75А ---> Il_transfo_2_winding_2: 5 MVA, 33//11KV 4.0156e+000 A -144.25А ---> Il_transfo_2_Lm: 5 MVA, 33//11KV
American Journal of Applied Sciences and Engineering | AJASE Vol. 1., No. 1| January, 2021 | pp. 11-25
https://airjournal.org/ajase
ACADEMIC INK REVIEW | ENEMUOH & CHUKWU, 2021
17
5.8226e+000 A 142.15А ---> Il_transfo_3_winding_1: 5 MVA, 33//11KV 6.0234e-001 A 5.75А ---> Il_transfo_3_winding_2: 5 MVA, 33//11KV 4.0156e+000 A 95.75А ---> Il_transfo_3_Lm: 5 MVA, 33//11KV 2.9158e+001 A 40.88А ---> Il_phase_A: NEW HAVEN 33KV SOURCE 2.9158e+001 A -79.12А ---> Il_phase_B: NEW HAVEN 33KV SOURCE 2.9158e+001 A 160.88А ---> Il_phase_C: NEW HAVEN 33KV SOURCE
Load Flow results of the Ogui-Enugu Distribution without SSVC As can be seen from the results from Fig 4 and table 1, the Power loss at Township was below 5 percent which indicates that the feeder is healthy and needs minimal improvement. On the other hand, the losses at Agbani Wilson, UNN and Onuiyi were all above 5 percent which indicates that the feeders are unhealthy and needs critical improvement.
3.3 To Model the SSVC using Simulink for minimizing Power losses in the Ogui-Enugu 33KV Power Distribution Network
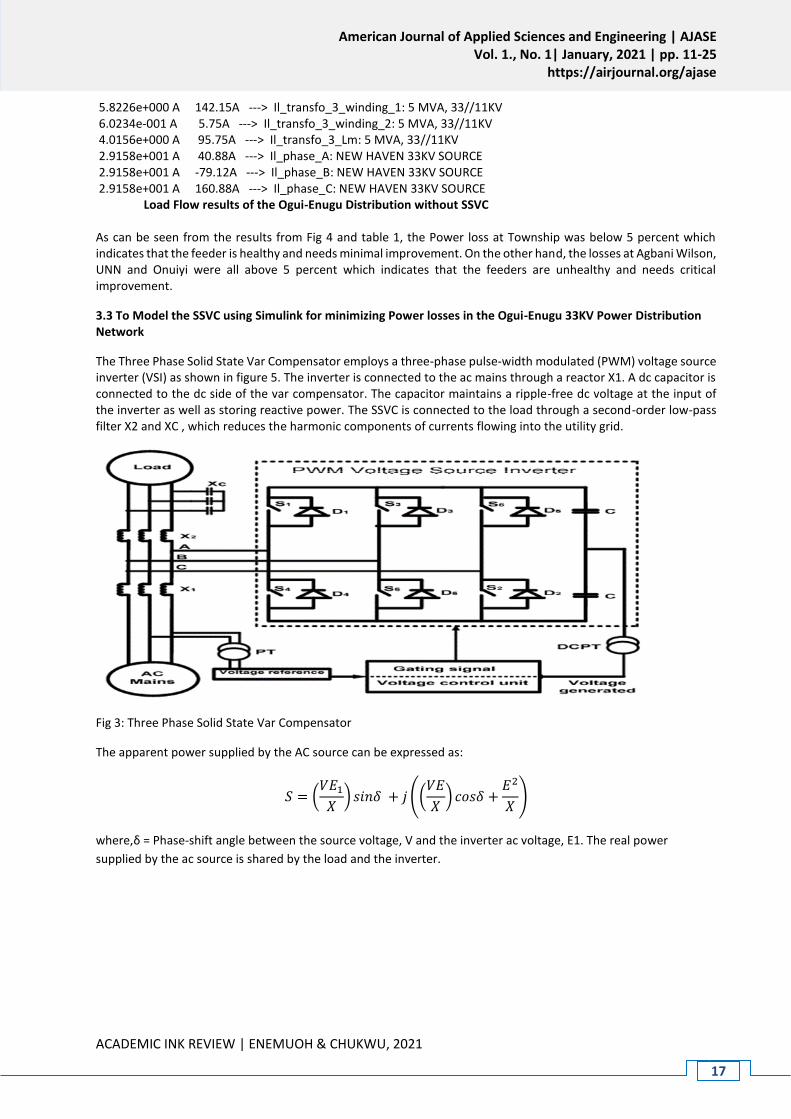
The Three Phase Solid State Var Compensator employs a three-phase pulse-width modulated (PWM) voltage source inverter (VSI) as shown in figure 5. The inverter is connected to the ac mains through a reactor X1. A dc capacitor is connected to the dc side of the var compensator. The capacitor maintains a ripple-free dc voltage at the input of the inverter as well as storing reactive power. The SSVC is connected to the load through a second-order low-pass filter X2 and XC , which reduces the harmonic components of currents flowing into the utility grid.
Fig 3: Three Phase Solid State Var Compensator
The apparent power supplied by the AC source can be expressed as:
𝑆 = (𝑉𝐸1
𝑋) 𝑠𝑖𝑛𝛿 + 𝑗 ((
𝑉𝐸
𝑋) 𝑐𝑜𝑠𝛿 +
𝐸2
𝑋)
where,δ = Phase-shift angle between the source voltage, V and the inverter ac voltage, E1. The real power
supplied by the ac source is shared by the load and the inverter.

American Journal of Applied Sciences and Engineering | AJASE Vol. 1., No. 1| January, 2021 | pp. 11-25
https://airjournal.org/ajase
ACADEMIC INK REVIEW | ENEMUOH & CHUKWU, 2021
18
Fig 4: Simulink Model of the SSVC
The amplitude of the fundamental component of the inverter output ac voltage, E1 depends on the value of the dc bus voltage, Vdc. So, E increases or decreases if the capacitor is charged or discharged. The voltage drop across the inductor X1 determines the source power factor. The voltage drop across X1 can be minimized by equalizing V and E, thus maintaining near unity power factor. The var compensator responds to fluctuations in load power factor by providing extra power required by the load or absorbing excess power from the load. If the power factor of the load increases, the load draws more real power which is transiently supplied by the inverter. The capacitor is thus discharged, leading to decrease in E. The control system takes corrective measure to make E equal to the corresponding value of V and hence maintain the source power factor at near unity. This is done by increasing the phase-shift angle, and more active power will flow to the inverter.
The Solid State Var compensator (SSVC) and its control circuit will be modeled using Simulink for minimizing power losses in the Ogui-Enugu 33KV power Distribution network. Fig 3. shows the simulink model of the Solid State var Compensator. It was modeled with six diodes which were connected to the phases of the network through six circuit breakers. Two capacitors were also installed to act as filter elements in the SSVC model. Fig 4 shows the simulink model of the SSVC control circuit. VA, VB and VC are the power system voltages from the Nsukka 33KV Distribution network while which were connected to the comparator through three voltage measurement blocks, V1, V2 and V3. Rv1, Rv2 and Rv3 are the reference voltages which were also connected to the comparator through three voltage measurement blocks V4, V5 and V6. The comparator is set in less than mode so that it compares signal from the voltage measurement blocks and sends its output to the first data conversion block. The data conversion block converts its output to double data type so that the pulse generator can understand it. The pulse generator was modeled with amplitude of 33000 and 10 secs, 5% pulse with. The output of the pulse generator is sent to the second data conversion block which uses its output to trigger ON/OFF the gate signals of the model.
Fig 5: Simulink Model of the SSVC Controller

American Journal of Applied Sciences and Engineering | AJASE Vol. 1., No. 1| January, 2021 | pp. 11-25
https://airjournal.org/ajase
ACADEMIC INK REVIEW | ENEMUOH & CHUKWU, 2021
19
To integrate the SSVC and its control circuit into the Simulink Model of the Nsukka 33KV Power Distribution network and re-run the Load Flow
Fig 6 integrate SSVC and its control circuit into the Simulink Model of the Nsukka 33KV Power Distribution network and re-run the Load Flow
Fig 6 shows integrate SSVC and its control circuit into the Simulink Model of the Nsukka 33KV Power Distribution network and re-run the Load Flow. The results obtained after simulation are shown in figures 4.1, 4.2, 4.3 and 4.4 respectively.
To validate and justify the percentage of distribution loss reduction in Nsukka 33KV power distribution network with and without SSSC
To find percentage improvement when SSVC is incorporated in the system in township Conventional Township power loss = 4.28% SSVC Township power loss = 3.585% % improvement in power loss reduction in township using SSVC 4.28 – 3.585 = 0.695% To find percentage improvement when SSVC is incorporated in the system in Wilson Conventional Wilson power loss = 7.12% SSVC Wilson power loss = 5.963% % improvement when SSVC is incorporated in the system in Wilson 7.12 - 5.963 = 1.157% To find percentage improvement when SSVC is incorporated in the system in UNN Conventional UNN power loss = 9.92% SSVC UNN power loss = 8.308% % improvement when SSVC is incorporated in the system in UNN 9.92 – 8.308 = 1.612% To find percentage improvement when SSVC is incorporated in the system in Onuiyi Conventional Onuiyi power loss = 6.24%

American Journal of Applied Sciences and Engineering | AJASE Vol. 1., No. 1| January, 2021 | pp. 11-25
https://airjournal.org/ajase
ACADEMIC INK REVIEW | ENEMUOH & CHUKWU, 2021
20
SSVC Onuiyi power loss = 5.226% % improvement when SSVC is incorporated in the system in Onuiyi 6.24% - 5.22% = 1.02% Results Table 2 comparing the percentage improvement in power loss reduction at Township in NSUKKA 33kv distribution network without and with SSVC
Time (s) Power loss at Township in NSUKKA without SSVC %
Power loss at Township in NSUKKA SSVC%
0.5 4.28 3.585
1 4.28 3.585
1.5 4.28 3.585
2 4.28 3.585
2.5 4.28 3.585
3 4.28 3.585
3.5 4.28 3.585
4 4.28 3.585
4.5 4.28 3.585
5.0 4.28 3.585
Fig 7 comparing the percentage improvement in power loss reduction at Township in NSUKKA 33kv distribution network without and with SSVC
Fig 7 shows comparing the percentage improvement in power loss reduction at Township in NSUKKA 33kv distribution network without and with SSVC. Fig 7 shows that the percentage of power loss at township in NSSUKA without SSVC is 4.28% while that when SSVC is incorporated in the system is 3.585%. With these results it shows that less power is loss at township in NSSUKA when SSVC is incorporated in the system.
Table 3 comparing the percentage improvement in power loss reduction at Wilson in NSUKKA 33kv distribution network without and with SSVC
Time (s) Power loss at Wilson in NSUKKA without SSVC %
Power loss at Wilson in NSUKKA with SSVC%
0.5 7.12 5.963
1 7.12 5.963
1.5 7.12 5.963
2 7.12 5.963
2.5 7.12 5.963
3 7.12 5.963
3.5 7.12 5.963
4 7.12 5.963
4.5 7.12 5.963
5.0 7.12 5.963

American Journal of Applied Sciences and Engineering | AJASE Vol. 1., No. 1| January, 2021 | pp. 11-25
https://airjournal.org/ajase
ACADEMIC INK REVIEW | ENEMUOH & CHUKWU, 2021
21
Fig 8 comparing the percentage improvement in power loss reduction at Wilson in NSUKKA 33kv distribution network without and with SSVC
Fig 8 shows comparing the percentage improvement in power loss reduction at Wilson in NSUKKA 33kv distribution network without and with SSVC. Fig 8 shows that the percentage of power loss at Wilson in NSSUKA when SSVC is not imbibed in the system is 7.12% while that when SSVC is incorporated is 5.963%. With these results the percentage improvement in the power loss reduction at Wilson in NSSUKA when SSVC is incorporated in the system is 1.157%.
Table 4 comparing the percentage improvement in power loss reduction at UNN in NSUKKA 33kv distribution network without and with SSVC
Time (s) Power loss at UNN in NSUKKA without SSVC%
Power loss at UNN in NSUKKA with SSVC%
0.5 9.92 8.308
1 9.92 8.308
1.5 9.92 8.308
2 9.92 8.308
2.5 9.92 8.308
3 9.92 8.308
3.5 9.92 8.308
4 9.92 8.308
4.5 9.92 8.308
5.0 9.92 8.308
Fig 9 comparing the percentage improvement in power loss reduction at UNN in NSUKKA 33kv distribution network without and with SSVC

American Journal of Applied Sciences and Engineering | AJASE Vol. 1., No. 1| January, 2021 | pp. 11-25
https://airjournal.org/ajase
ACADEMIC INK REVIEW | ENEMUOH & CHUKWU, 2021
22
Fig 9 shows comparing the percentage improvement in power loss reduction at UNN in NSUKKA 33kv distribution network without and with SSVC. Fig 9 shows that the percentage of conventional power loss observed at UNN in NSSUKA is 9.92% while that experienced when SSVC is incorporated in the system is 8.308$. With these results obtained, it shows that the improvement in the loss reduction in power at UNN in NSSUKA observed when SSVC is system is 1.612%.
Table 5 comparing incorporated in the the percentage improvement in power loss reduction at Onuiyi in NSUKKA 33kv distribution network without and with SSVC
Time (s) Power loss at Onuiy in NSUKKA without SSVC%
Power loss at Onuiy in NSUKKA with SSVC%
0.5 6.24 5.226
1 6.24 5.226
1.5 6.24 5.226
2 6.24 5.226
2.5 6.24 5.226
3 6.24 5.226
3.5 6.24 5.226
4 6.24 5.226
4.5 6..24 5.226
5.0 6.24 5.226
Fig 10 comparing the percentage improvement in power loss reduction at Onuiyi in NSUKKA 33kv distribution network without and with SSVC.
Fig 10 shows comparing the percentage improvement in power loss reduction at Onuiyi in NSUKKA 33kv distribution network without and with SSVC. In fig 10 the conventional percentage power loss at Onuiyi in NSSUKA is 4.28% while the percentage when of power loss at Onuiyi in NSSUKA when SSVC is imbibed in the system is 5.226%. With these results, it shows that the percentage improvement in power loss reduction when SSVC is incorporated in the system is 1.02%.

American Journal of Applied Sciences and Engineering | AJASE Vol. 1., No. 1| January, 2021 | pp. 11-25
https://airjournal.org/ajase
ACADEMIC INK REVIEW | ENEMUOH & CHUKWU, 2021
23
Conclusion
The unreliable power supply observed in NSSUKA metropolis can hardly be underestimated. This unreliable power supply experienced in NSSUKA has paralyzed the business activities in that area. This epileptic power supply in NSSUKA is overcome in this manner, Characterizing power loss in the Nsukka 33KV power Distribution Network, running the load flow of Nsukka 33KV power distribution without SSSC from the characterized data, Modeling the SSVC using simulink for minimizing Power losses in the Nsukka 33KV Power Distribution Network and integrating the SSVC and its control circuit into the Simulink Model of the Nsukka 33KV Power Distribution network and re-run the Load Flow. Finally, validating and justifying the percentage of distribution loss reduction in Nssuka 33KV power distribution network with and without SSSC.

American Journal of Applied Sciences and Engineering | AJASE Vol. 1., No. 1| January, 2021 | pp. 11-25
https://airjournal.org/ajase
ACADEMIC INK REVIEW | ENEMUOH & CHUKWU, 2021
24
References B. Gupta, “A course in power systems. S. K. Kataria & Sons, New Delhi, 2008.
D. Lukman, K. Walsh and T. R. Blackburn, “Loss minimization in industrial power-system-operation.
www.iteeUq.edu.au/aupec/00/lukmanoo.pdf.2002
B. J. Cory (2014) “Electric Power Systems, John Wiley & Sons Sussex, England.
O. S. Onohaebi and P. A. Kuale (2015). “Estimation of Technical Losses in the Nigerian 330kv Transmission
W. D. Sterenson Jr. “Elements of Power System Analysis”. Fourth Edition. New York. 2012
Depazo et al “An optionization technique for real and reactive power allocation, Proc. IEEE. Nov, 1967.
Zaborszky & Rittenhouse “Electric Power Transmission”. New York, 1969.
J. D. Glover, M. S. Sarma, T. J. Overbye and N. P. Pasly, “Power System Analysis and Design” Cangage Learning,
United State, 2007
C.M.Ong, "EE 432 Class Notes", Purdue University, Fall 1992.
W.D. Stevenson Jr., "Elements of Power System Analysis, Fourth Edition", New York, 2009
Westinghose Electric Corp., "Transmission and Distribution Reference Fourth Edition", Penn., 1980.
Alfred Still, "Electric Power Transmission, Third Edition", New York, 2008.
F. E. Gardiol, "Lossy Transmission Lines", Mass., 2013.Fitzgerald & Kingsley, "Electric Machinery, Fourth Edition",
New York, 2005.
Kassaluan & Schlect, "Principles of Power Electronics", M:ass., 2015.
D. I. H. Sun, S. Abe, R. R. Shoults, M. S. Chen, P. Eichenberger, D. Farris, "Calculation of Energy Losses in a Distribution
System," IEEE Transactions on Power Apparatus and Systems, v. PAS-99, No. 4, Jul. 2011
C. A. Gross, Power System Analysis, 2nd ed., 2012..T. H. Chen, M. S. Chen, T. Inoue, P-Kotas, E. A. Chebli, "Three-
Phase Cogenerator and Transformer Models for Distribution System Analysis," IEEE Transactions on Power Delivery,
v. 6, No. 4, Oct. 1999.
S. A. Nasar, Electric Energy Conversion and Transmission, 2004.A. Makino, K. Suzuki, A. Inoue, T. Masumoto, "Low
Core Loss of a bcc Fe86Zr7BgCu 1 Alloy with Nanoscale Grain Size," Materials Transactions, JIM (Japan Institute of
Metals), v. 32, No. 6, Jun. 1991.

American Journal of Applied Sciences and Engineering | AJASE Vol. 1., No. 1| January, 2021 | pp. 11-25
https://airjournal.org/ajase
ACADEMIC INK REVIEW | ENEMUOH & CHUKWU, 2021
25
I. Kerszenbaurn, A. Mazur, M. Mistry, J. Frank, "Specifying Dry-Type Distribution Transformers for Solid-State
Applications," IEEE Transactions on Industry Applications, v. 27, No. 1, Jan. 2010.
H. W. Ng, R. Hasegawa, A. C. Lee, L. A. Lowdermilk, "Amorphous Alloy Core Distribution Transformers," IEEE
Proceedings, v. 79, No. 1 1, Nov. 2006.
T. Gonen, Electric Power Distribution System Engineering, 2015.
Luis T. Moran, Phoivos D. Ziogas and Geza Joos. Analysis and Design of a Three-Phase Synchronous Solid-State Var
Compensator. IEEE Transactions on Industry Applications, Vol. 25, No. 4, pp. 598–607. July/August 2013.
A. Symonds “Electrical Power Equipment and Measurement”, McGraw-Hill, St. Louis, 1981