Embed Size (px)
Citation preview

HAL Id: hal-00889935https://hal.archives-ouvertes.fr/hal-00889935
Submitted on 1 Jan 2004
HAL is a multi-disciplinary open accessarchive for the deposit and dissemination of sci-entific research documents, whether they are pub-lished or not. The documents may come fromteaching and research institutions in France orabroad, or from public or private research centers.
L’archive ouverte pluridisciplinaire HAL, estdestinée au dépôt et à la diffusion de documentsscientifiques de niveau recherche, publiés ou non,émanant des établissements d’enseignement et derecherche français ou étrangers, des laboratoirespublics ou privés.
Modelling as a tool for the teaching of livestockdynamics
Charles-Henri Moulin, Fabienne Blanc, Pauline Ezanno, François Bocquier
To cite this version:Charles-Henri Moulin, Fabienne Blanc, Pauline Ezanno, François Bocquier. Modelling as a toolfor the teaching of livestock dynamics. Animal Research, EDP Sciences, 2004, 53 (5), pp.439-450.<10.1051/animres:2004027>. <hal-00889935>

439Anim. Res. 53 (2004) 439–450© INRA, EDP Sciences, 2004DOI: 10.1051/animres:2004027
Original article
Modelling as a tool for the teaching of livestock dynamics
Charles-Henri MOULINa*, Fabienne BLANCa, Pauline EZANNOb, François BOCQUIERa
a Agro.M, Productions Animales, UMR Élevage des Ruminants en Régions Chaudes, 2 place Viala, 34060 Montpellier Cedex 2, France
b Present address: ENV- INRA Nantes, BP 40706, 44307 Nantes Cedex 03, France
(Received 24 March 2003; accepted 26 January 2004)
Abstract – Modelling is a way of integrating and formalising the knowledge about how a systemworks. Thus, it is a relevant approach for teaching agricultural systems analysis to undergraduatestudents. In most cases, research models or decision support tools cannot be easily used for teachingpurposes because conceptual models are too complex to be handled by students during a short trainingcourse or do not fit pedagogic goals. However, from our own modelling research, we developed twotechniques to support our teaching program in herd dynamics. The first one was based on a deter-ministic approach and used simple flow diagrams. Students had to fill in a paper chart that depictsthe breeding scheme of a flock for several years. Thus, they test if a combination of decision rules(e.g., breeding, replacement, culling) allows to reach a given production objective. Then, studentshad to suggest technical means or management decisions that could improve flock productivity. Thesecond technique relied on a stochastic matrix model that was used to illustrate the sensitivity ofherd productivity in a tropical environment. The model was computerised using spreadsheets. Onthe basis of the simulation results, students had to comment on the behaviour of the system and toappraise the model, with respect to the choice of assumptions and formalisation. Because our teachingapproach is progressive and interactive, we are confident that students will become well-informedusers of more elaborated models such as decision support tools.
teaching / livestock management / flock / herd / sensitivity analysis / modelling / stochastic /spreadsheet / flow diagram
Résumé – L’utilisation de modèles pour l’enseignement sur le fonctionnement des troupeaux.La modélisation permet de résumer un ensemble de connaissances sur le fonctionnement d’unsystème. C’est ainsi un outil pertinent pour la formation des futurs ingénieurs à la complexité dessystèmes agricoles. Les modèles de recherche ou les outils d’aide à la décision ne peuvent pas toujoursêtre facilement utilisés pour la formation parce qu’ils ne correspondent pas toujours à nos objectifspédagogiques ou parce qu’ils sont trop complexes pour être manipulés par les étudiants dans desséances d’enseignement de courte durée. En utilisant nos travaux de recherche sur la dynamique destroupeaux ovins ou bovins, nous avons développé deux techniques pour l’enseignement. La premièreest fondée sur l’utilisation de diagrammes de flux d’animaux. Les étudiants doivent remplir desgraphes qui décrivent, de façon déterministe, l’organisation de la reproduction d’un troupeau ovin
* Corresponding author: [email protected]

440 C.-H. Moulin et al.
sur plusieurs années. Ils vérifient ainsi si une combinaison de règles de décision concernant la miseà la lutte, le renouvellement et la réforme permet de satisfaire un objectif de production donné. Lesétudiants doivent alors réfléchir aux moyens techniques et organisationnels pour améliorer laproductivité du troupeau. La seconde technique est fondée sur l’utilisation d’une feuille de calcul.Les étudiants doivent évaluer la sensibilité des performances de troupeaux bovins élevés dans unenvironnement difficile en milieu tropical. Nous avons développé un formulaire avec un modèlematriciel stochastique afin de simuler la dynamique démographique d’un troupeau. Les étudiantssont capables de faire une analyse critique du simulateur parce qu’ils ont au préalable élaboré lemodèle conceptuel du système. Notre approche pédagogique étant progressive et interactive, nouspensons qu’à long terme, les étudiants seront des utilisateurs avertis de modèles plus élaborés commeceux qui sont le support d’outils d’aide à la décision.
enseignement / gestion du troupeau / bovin / ovin / analyse de sensibilité / modélisation /stochastique / feuille de calcul / diagramme de flux
1. INTRODUCTION
Future animal science specialists will haveto face the complexity of livestock produc-tion systems. The teaching of animal sci-ences to undergraduate students is fairlydifficult because they have to learn basicskills in numerous fields of the biology offarm animals (i.e. reproduction, nutrition,genetics, forage production…) in a shortperiod of time. They also have to be able toanalyse hierarchy and interactions amongfactors that influence animal productivity inon-farm situations. Thus, we use trainingcourses based on a systemic approach oflivestock production in order to help stu-dents to integrate knowledge and then tofocus on how the system is regulated andcontrolled. For several training courses, weused a representation of the demographicdynamics of a group of farm animals, bred,culled, and replaced according to the strat-egy of the livestock farmer, which is calledherd functioning [15, 21].
In teaching agricultural systems, newtechniques [23] can be used that may helpstudents to handle complexity emerging notonly from the dynamics of the biologicalsystem but also from its interrelationshipswith a decisional system and the environ-ment. Modelling is often cited as a way ofsummarising knowledge about how a sys-tem works [4, 18, 19]. We present here twotechniques, based on herd modelling, thathave been successfully used in trainingcourses. The first uses paper charts depict-
ing ewe flows within a flock, the seconduses computer-assisted analyses of cattleherd productivity. The interest and limita-tions of these techniques are further dis-cussed.
2. THE FLOW DIAGRAM TECHNIQUE APPLIED TO SHEEP FLOCK FUNCTIONING
French students attend their first appliedanimal science unit during the third year ofthe curriculum. We used the case of sheepfarming in order to illustrate how reproduc-tion management influences flock dynam-ics. For this approach, we developed a deter-ministic model based on a flow diagramrepresenting, in a simple way, different cat-egories of animals.
2.1. Materials and methods
2.1.1. The choice of sheep production
Several lectures dealt with the reproduc-tive physiology of farm animals at the ani-mal level, i.e. dam and sire. At this stage,we focused on the underlying physiologicalmechanisms, factors affecting their varia-tions, and the technical means used to con-trol the successive events from ovulation toconception and parturition. During the train-ing course, and as a complement to the pre-vious lectures, breeding was considered atthe herd or flock level. In sheep production,because of the short duration of pregnancy(148 d) and the wide variation in litter size

Teaching and modelling 441
(1 to 3 or even 4 lambs), together with largeseasonal variations of reproductive param-eters [17], the annual lamb output may varywidely. Hence, in France, according to thefarming systems in mountains or in low-lands the annual number of lambs reared perewes ranges from 0.7 to 2.5 [2]. The breed-ing management of ewes, from the tradi-tional once a year lambing to an acceleratedbreeding system, such as 3 lambings in2 years [20], and the culling and replace-ment practices [16] are major factors deter-mining whole flock productivity. This iswhy we chose this species as a good casestudy for the training courses, to make stu-dents understand the complex interactionsbetween physiological constraints and farm-ers’ practices.
2.1.2. Principles of flow diagram conception
The flow diagram was made of icons andarrows that display the important steps ofthe productive life of ewes. It allowed stu-dents to analyse the number of ewes in dif-ferent groups (i.e. compartments), accord-ing to their physiological status, and theflows of ewes between compartments through
time [1, 12]. We depicted (Fig. 1) five com-partments: ewes at mating, lambing ewes,open ewes, culled ewes and weaned lambs.The compartment of ewes at mating is sup-plied by three flows: adult ewes just afterlambs’ weaning, open ewes that did not con-ceive at the previous mating period andewe-lambs. Fertility (pregnant ewes rela-tive to mated ewes) does not only determinethe flow between ewes at mating and lamb-ing ewes but also, as a complement, the flowof open ewes that can be mated at the nextmating period. Litter size and lamb survivaluntil weaning determine the flow of weanedlambs. The culling practices (number ofculled ewes after weaning of the lambs) andthe replacement practices (number of ewe-lambs introduced) determine the state of thegroup that will be mated at the next period.We assumed that there was no death of adultewes.
2.1.3. Tool utilisation and progress during the training courses
The students were assigned exercisesconsisting of flow charts of increasing dif-ficulty. The basic flow diagram (Fig. 1) wasarranged according to the breeding scheme
Figure 1. Flow diagram depict-ing a ewe flock functioning fortwo mating periods.

442 C.-H. Moulin et al.
and was presented as a chain representingseveral years. The initial state of the systemwas given as the following: number of ewesin each compartment for year 1 and the val-ues of variables. The students therefore hadto fill in the compartments for the next yearsand to analyse the final state and the annualreports. The calculations were fairly simpleand could be rapidly executed so that therewas time left for analysing and understand-ing the situation and for discussing the tech-nical proposals that were exposed duringthe lectures.
2.2. The breeding management of a flock with two mating periods
This exercise dealt with the breedingmanagement of a flock divided into twosub-flocks. One sub-flock was mated in theautumn while the other was mated in thespring. During a 2-hour course, studentshad to fill in a chart made up of 2 connectedflow diagrams, each representing a sub-flock. The total number of ewes in this flockwas 325, with 50 ewe-lambs (replacementrate: 0.154, age at first mating: 7 months) thatwere kept annually to replace the 50 culledewes. The fertility rate was higher in theautumn (0.90) than in the spring (0.75),while the litter size (1.1) was considered tobe constant whatever the season. One rulewas that the open ewes of a given sub-flockare transferred into the other sub-flock inorder to be mated as soon as possible (thusthe annual fertility rate for the whole flockmay be higher than the fertility rate of0.90 for the sub-flock mated in the autumn).The other rule was that 25 ewes were culledafter weaning and replaced by the samenumber of ewe-lambs at the next matingperiod (in some periods of the year, afterintroducing ewe-lambs and before culling,the flock size reached 350 ewes). In the ini-tial state, 167 ewes were mated in the autumnand 200 in the following spring (17 openewes after autumn mating + 25 ewe-lambs+ 158 adults): in that way, the system wasmade of an equal number of ewes lambingin each sub-flock (150). As a result for the
flock, 300 ewes were lambing and the meanannual output was 0.78 lambs per ewe.
The students had to fill in a 4-year flowdiagram. They were supposed to observethat the lambing distribution was not bal-anced between sub-flocks. The autumn-mated sub-flock increased (223 lambings inyear 5) while the spring-mated one gave lesslambings (95). They should also have seenthat the annual lambing number was slightlyincreased (318 lambings versus 300). Thesystem reached a long-term equilibrium sit-uation (at year 12), with 241 lambings forthe autumn-mated sub-flock and 82 for thespring-mated one.
The objective of this exercise was to leadstudents to appraise the effects of seasonalvariations of the reproductive rate in sheepwhose direct effect was a numeric reductionin one sub-flock at the expense of the other.Another objective was to discuss how toreplace culled ewes to balance the size of thetwo sub-flocks. The last objective was tomake them propose some ways to increasethe reproduction rate of the spring-matedewes (hormonal treatments, photoperiodictreatments, ram effect…). The relationshipbetween the nutritional status of the ewes inthe spring (i.e. body condition) and theirreproductive performances was also dis-cussed.
As applied to livestock, the flow diagramwas sufficient for a first appraisal of flockdynamics. The students just had to appre-hend the flow diagram representation of theflock and to understand the biological sig-nificance of the variables. In these condi-tions, little time was necessary to allow stu-dents to understand the meaning of thesimulated results and to think about techni-cal or management options that couldimprove productivity. Several other exer-cises were built in order to illustrate the con-sequences of breeding management deci-sions, or to point out the main problemssheep farmers have to face when managingsub-flocks. Hence, the students could easilyunderstand that, with multiple sub-flocks,open ewes may have been transferred from

Teaching and modelling 443
one sub-flock to another in order to reducethe elapsed time between weaning and thenext effective conception. Thus, they fre-quently suggested the use of early preg-nancy diagnosis (e.g. ram detection, pro-gesterone test or ultrasonic diagnosis) inorder to detect open ewes soon after the endof the mating period.
2.3. The global appraisal of the breeding management of a flock
During 5 training sessions of 2 h each, thestudents had to analyse the sensitivity of alivestock farming system to hazards of var-ious origins (e.g., climate, market prices).These hazards may be introduced in theflow diagram by changing the levels of var-iables such as fertility or survival rate,which control the flows of ewes and lambs.Thereafter, the students had to conceive aprofound change of the breeding manage-ment in order to better fit new goals of pro-duction. The proposed breeding system wasbased on 3 mating periods per year: autumn,spring and summer. The combination ofbreeding rules and sub-flock sizes alloweda steady functioning, with a constant numberof lambing ewes at each period. The annualreproduction rate was of 1.15 lambings perewe of over 6 months of age and the annualoutput was of 1.32 weaned lambs.
The students had to analyse the impact ofa lower reproduction rate during one sum-mer mating period: the fertility rate decreasedfrom 0.88 to 0.58 and litter size from 1.35to 1.15. They had to fill in a 4-year flow dia-gram and to calculate, for each year, theturnover of sold lambs (Tab. I). If a problemof reproduction occurred during year 2, thesystem was only disturbed during year 3 andcame back to a steady state by the end ofyear 4. Hence, the students were expectedto conclude that such a system is very robustbecause a low fertility rate at a given matingperiod has a weak impact on the lamb out-put. They could also see that the majorimpact is a change in the distribution of theannual lamb production that leads to an
immediate, severe decrease of the turnover(–22%), due to the seasonal variation oflamb prices.
2.4. Discussion about the flow diagram technique
In the first exercise, the flow diagramtechnique was used as a simple tool to ana-lyse whether or not a combination of deci-sion rules satisfies a given production objec-tive. It is also an interesting tool for problemfinding: what parts of the system explain thegap between the flock response and the pro-duction objectives? Thus, students are pre-pared to conceive appropriate rules of man-agement (among those which are designedin the flow diagram) or to identify otherpossible control variables (which are notdesigned in the given flow diagram).
In the second exercise, the flow diagramwas far more complicated. The objectivewas to perform both a technical and an eco-nomic appraisal of the system with the cal-culation of ewe flows between the sub-flocksand the financial output. The simulationallowed assessing the sensitivity to hazardsof the described management system. Thisis an essential property of agricultural sys-tems, which have to deal with several sourcesof variability in an uncertain context of mar-ket prices and agricultural policies. It is alsoa way to point out the hierarchy of factorsmodifying the economic results of a sheepfarm, such as the annual productivity of theewes or the sale periods of lambs. The lastaspect studied was the relevance of such abreeding system in the annual labour organ-isation.
Ready-made flow diagrams are fairlysimple to use in a classroom of undergrad-uate students. Even if we discuss a lot withstudents, we have to maintain equilibriumbetween the numerous simplifications thatare proposed and the fact that it remainsover-simplified for a practical on-farm use.In particular, teachers insist on the fact that,under farm conditions, mating periods arespread over several oestrus cycles of 17 days.

444 C.-H. Moulin et al.
Hence the transfer of ewes between sub-flocks can be even more complicated becausesome early-lambing ewes can be includedinto the next mating flock after their dryingoff. Our aim was to show that such anapproach can be included in a spreadsheetassuming that main factors are clearly iden-tified before building the flow diagram. Infact, teachers use spreadsheets as a tool tointroduce the initial condition of realistic sit-uations that are subsequently proposed dur-ing the training courses.
3. COMPUTER-ASSISTED ANALYSIS OF THE SENSITIVITY OF HERD PRODUCTIVITY TO ENVIRONMENTAL AND MANAGEMENT FACTORS
Here, our goal was to make students ana-lyse cattle breeding systems other than thosetypical of temperate regions. The chosen
context concerned harsh situations whereenvironmental factors are largely unpredict-able. Consequently, a stochastic approachwas favoured to account for the influence oflarge climatic variations on herd productiv-ity. Such a modelling approach required com-puter simulations that can be easily achievedwith a spreadsheet.
3.1. Materials and methods
3.1.1. The choice of a tropical cattle production system
During the fourth year of the curriculum,students may choose a course on tropicalanimal production. For this course, we ana-lyse an agro-pastoral cattle system in WestAfrica. To parameterise the model, we usedperformance data and demographic param-eters of 10 N’Dama herds studied during5 years [10] from an on-farm monitoringmethod developed in Senegal [22].
Table I. Simulation of technical and economic impact of a poor summer mating performance in year2 (i.e. a reduced fertility rate and litter size) for a flock managed in three mating periods per year duringa 4-year period. (Column “Variation”: ratio of the year n to year 1).
Mating periods Autumn Spring Summer Total Variation
Year 1
Lambing ewes (N) 110 80 213 403 100
Sold lambs (N) 127 67 215 409 100
Turnover (€) 7.240 3.670 14.260 25.170 100
Year 2
Lambing ewes (N) 110 80 140 330 82
Sold lambs (N) 127 67 215 409 100
Turnover (€) 7.240 3.670 14.260 25.170 100
Year 3
Lambing ewes (N) 176 86 208 470 117
Sold lambs (N) 201 67 107 375 92
Turnover (€) 11.455 3.670 7.130 22.255 88
Year 4
Lambing ewes (N) 109 85 210 404 100
Sold lambs (N) 125 74 209 408 100
Turnover (€) 7.125 4.050 13.865 25.040 99

Teaching and modelling 445
The size of the herds varied from 10 tomore than 200 heads, with a large diversityof objectives and management rules amongbreeders. Productivity was difficult to eval-uate not only because of the variety of endproducts (e.g., milk, animals for slaughteror sale, work, manure), but also because ofthe economic value of live animals, sincethe herd provides a source of capital thatmay be used if necessary. Furthermore,herd productivity parameters are widelydependent on forage resource availabilityand thus on climatic conditions. The per-formance of N’Dama cows differs fromthose of temperate cattle breeds: meanweight is 250 kg and daily milk productionis about 2.7 kg [6]. The age at first calvingvaries from 50 to 60 months and the annualmean fertility is below 50%. In such a sys-tem, long-term analyses are required becauseof the low reproductive rate and the highinter-annual variability of climatic condi-tions.
3.1.2. Principles of the demographic model
Since the productivity of a herd dependsmainly on its age and sex structure, matrixmodelling has been chosen. A practicalinterest of such a method [13] is that it doesnot require specific mathematical or mod-elling knowledge. Matrix models are dis-crete-time, recurrent models, so they can bedeveloped using spreadsheets.
Given an initial herd state and a set ofdemographic rates (i.e., fecundity, mortal-ity, off-take and input rates), matrix modelssimulate the future herd structure and sizeat annual or shorter time intervals. Themethod was based on the formalism of herddynamics in tropical livestock systemsdescribed by Lesnoff [14]. The state of theherd at time t is described by a vector x(t),in which each component represents thenumber of animals belonging to a givenclass of age and sex. In matrix notation,annual models are defined by the recurrentequation x(t + 1year) = Ax(t), where A is theannual projection matrix, used to calculate
the herd vector for the next year. The Amatrix contains the rates that define how thesex-age classes change size over a year. Let
, denote the number of animalsof sex s (s = f for females or m for males)in age class i at the beginning of the year t.Components represent the numberof living newborns of sex s during the year.For the Leslie annual matrix model, recur-rence formulas are:
,
, .
The ms,i are the fecundity rates, i.e. theexpected number of living newborns of sexs during the year per cow in age class i atthe beginning of the year. The ss,i refer tosurvival rates, including inputs, for animalsof sex s in age class i at the beginning of theyear:
.
In the case of large populations, the tran-sition rates correspond to the probabilitiesof different events (i.e., births, deaths, off-take and inputs). In the case of a small herd,each sex-age class contains a small (integer)number of animals. Thus, the number of ani-mals at t+1 is generated by random drawsfrom a multinomial distribution whose param-eters are the former rates.
On the basis of such a matrix model, webuilt a spreadsheet template that studentsuse without referring to matrix notation.
3.1.3. Tool utilisation and progress during the training courses
The training course ran over 2 sessionsof 3 hours. During the first session, the stu-dents had to build a conceptual model thatdescribes herd productivity. No computerwas required for this session. First, theteachers described the agro-pastoral con-text and the cattle breeding system. The stu-dents had to extract the relevant information
xs i, t( ) i 1≥
xs 1, t( )
xs 1, t( ) ms i, xf i, t( )i∑=
xs i 1+, t 1+( ) ss i, xs i, t( )= i 1≥
ss i, 1 Ps i, death( ) Ps i, offtake( )––=
Ps i, input( )+
446 C.-H. Moulin et al.
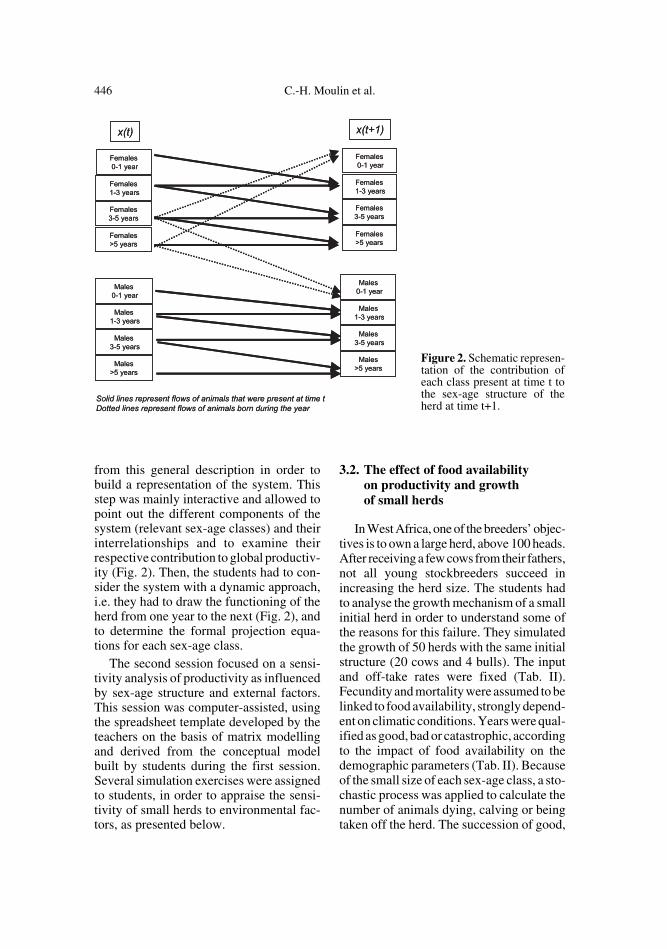
from this general description in order tobuild a representation of the system. Thisstep was mainly interactive and allowed topoint out the different components of thesystem (relevant sex-age classes) and theirinterrelationships and to examine theirrespective contribution to global productiv-ity (Fig. 2). Then, the students had to con-sider the system with a dynamic approach,i.e. they had to draw the functioning of theherd from one year to the next (Fig. 2), andto determine the formal projection equa-tions for each sex-age class.
The second session focused on a sensi-tivity analysis of productivity as influencedby sex-age structure and external factors.This session was computer-assisted, usingthe spreadsheet template developed by theteachers on the basis of matrix modellingand derived from the conceptual modelbuilt by students during the first session.Several simulation exercises were assignedto students, in order to appraise the sensi-tivity of small herds to environmental fac-tors, as presented below.
3.2. The effect of food availability on productivity and growth of small herds
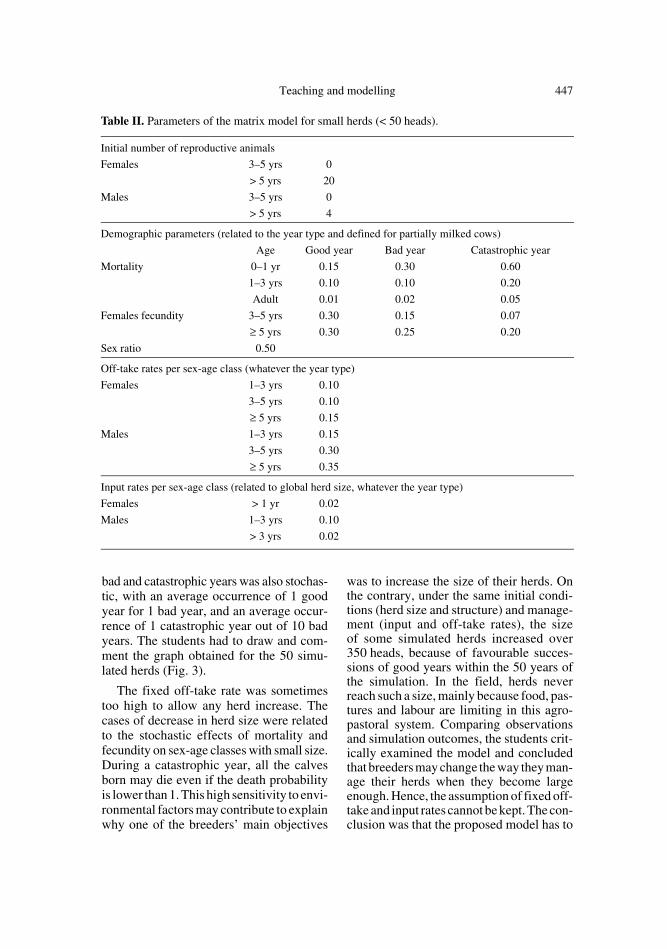
In West Africa, one of the breeders’ objec-tives is to own a large herd, above 100 heads.After receiving a few cows from their fathers,not all young stockbreeders succeed inincreasing the herd size. The students hadto analyse the growth mechanism of a smallinitial herd in order to understand some ofthe reasons for this failure. They simulatedthe growth of 50 herds with the same initialstructure (20 cows and 4 bulls). The inputand off-take rates were fixed (Tab. II).Fecundity and mortality were assumed to belinked to food availability, strongly depend-ent on climatic conditions. Years were qual-ified as good, bad or catastrophic, accordingto the impact of food availability on thedemographic parameters (Tab. II). Becauseof the small size of each sex-age class, a sto-chastic process was applied to calculate thenumber of animals dying, calving or beingtaken off the herd. The succession of good,
Figure 2. Schematic represen-tation of the contribution ofeach class present at time t tothe sex-age structure of theherd at time t+1.
Teaching and modelling 447
bad and catastrophic years was also stochas-tic, with an average occurrence of 1 goodyear for 1 bad year, and an average occur-rence of 1 catastrophic year out of 10 badyears. The students had to draw and com-ment the graph obtained for the 50 simu-lated herds (Fig. 3).
The fixed off-take rate was sometimestoo high to allow any herd increase. Thecases of decrease in herd size were relatedto the stochastic effects of mortality andfecundity on sex-age classes with small size.During a catastrophic year, all the calvesborn may die even if the death probabilityis lower than 1. This high sensitivity to envi-ronmental factors may contribute to explainwhy one of the breeders’ main objectives
was to increase the size of their herds. Onthe contrary, under the same initial condi-tions (herd size and structure) and manage-ment (input and off-take rates), the sizeof some simulated herds increased over350 heads, because of favourable succes-sions of good years within the 50 years ofthe simulation. In the field, herds neverreach such a size, mainly because food, pas-tures and labour are limiting in this agro-pastoral system. Comparing observationsand simulation outcomes, the students crit-ically examined the model and concludedthat breeders may change the way they man-age their herds when they become largeenough. Hence, the assumption of fixed off-take and input rates cannot be kept. The con-clusion was that the proposed model has to
Table II. Parameters of the matrix model for small herds (< 50 heads).
Initial number of reproductive animals
Females 3–5 yrs 0
> 5 yrs 20
Males 3–5 yrs 0
> 5 yrs 4
Demographic parameters (related to the year type and defined for partially milked cows)
Age Good year Bad year Catastrophic year
Mortality 0–1 yr 0.15 0.30 0.60
1–3 yrs 0.10 0.10 0.20
Adult 0.01 0.02 0.05
Females fecundity 3–5 yrs 0.30 0.15 0.07
≥ 5 yrs 0.30 0.25 0.20
Sex ratio 0.50
Off-take rates per sex-age class (whatever the year type)
Females 1–3 yrs 0.10
3–5 yrs 0.10
≥ 5 yrs 0.15
Males 1–3 yrs 0.15
3–5 yrs 0.30
≥ 5 yrs 0.35
Input rates per sex-age class (related to global herd size, whatever the year type)
Females > 1 yr 0.02
Males 1–3 yrs 0.10
> 3 yrs 0.02

448 C.-H. Moulin et al.
be improved by accounting for the changesof management rules according to the cur-rent herd size. Hence, the students wereasked to identify which parameters of themodel have a strong impact on the herdgrowth and should be considered size depend-ent. A simple modification of the model,such as a change of the off-take of repro-ductive cows, is sufficient to regulate theherd size and to give more realistic results.
3.3. Discussion about the demographic model
The modelling and simulation approachesdeveloped in this exercise present majorpedagogical interests. Whereas the flowdiagram only allows studying the impact ofone factor on the reproductive perform-ances, simulations on a spreadsheet makestudents appraise the complex interactionsbetween demographic parameters, and theirrelationships to environmental factors (cli-mate and food resources) and breeders’ prac-tices (off-take, input of live animals). Stu-dents are able to develop a critical analysisof the simulator, because they previouslybuilt a conceptual model of herd function-ing. This phase implies that relevant choicesare to be made in accordance with the objec-tives of the study. Students become aware
of what part of the reality the model repre-sents. For instance, they discuss the choiceof an annual time scale. Students frequentlypropose to divide the annual cycle into sev-eral periods to represent the seasonal vari-ations in the demographic rates. This hasbeen shown to be relevant at a fortnightscale for sheep [14] and a monthly scale forcattle [11]. Nevertheless, for this trainingcourse, an annual time-step is chosen andstudents know that, for instance, the impactof the duration of the dry season [10] cannotbe studied with such a model. In the sameway, when simulated data do not fit obser-vations, students may assess what compo-nents of the model have to be improved. Atlast, this training course offers the possibil-ity to the students to handle quite unfamiliarparameter values, which are, however, rel-evant in tropical conditions. They under-stand how modelling can be complemen-tary to on-farm monitoring. The formerrequires field data in order to parameteriseand validate the model; the latter is anexpensive procedure, which cannot beapplied to investigate alternative manage-ment decisions. They can also see the inter-est of formalising a new situation into aframework (conceptual diagram) and test-ing it rapidly with a very common tool suchas a spreadsheet. The initial presentation is
Figure 3. Simulations of the evolution of a small herd size under stochastic successions of good,bad or catastrophic annual climatic conditions.

Teaching and modelling 449
of particular importance: students are thenable to point out the pertinent assumptionsthat have to be tested.
4. GENERAL DISCUSSION AND CONCLUSION
Both teachers and students are users ofanimal science models. Teachers resort tomodelling to reach pedagogical objectives.Students use the modelling process to for-malise the biological laws and mechanisms,and the simulations to explore the behav-iour of the system. To achieve our peda-gogic objectives, we could have used exist-ing models, such as research models ordecision support tools. Instead, we preferredto build new models that could be namedteaching support tools. The reasons for thischoice are discussed below.
Some research models deal with live-stock on a farm setting. The herd is only asub-system that is poorly or not really mod-elled; even if the animal is the basic com-ponent of the model, the main outputs arethe economic results [8]. In other models,the animal is the system modelled; the accu-mulation of animals in classes makes up thesimulated flock [3, 5]. Because the herd isnot clearly described, these models do notfit our teaching objectives. Other researchmodels are specially designed to representherd functioning [7, 11, 14]. They are not,however, shaped for an interactive use byinexperienced people. In addition, theyhave been developed with software lan-guages mostly unknown to undergraduatestudents. These are the main reasons whysuch models cannot be used in short trainingcourses. Moreover, these models are com-plicated because of many feedback loopsadded to better represent reality. They aretoo complex for teaching purposes, giventhat our main pedagogical goal is to high-light the sensitivity of the system to directexternal factors.
Decision support tools for herd manage-ment, often based on research models, maybe used for teaching purposes. For example,
GRAZPLAN [9] has been chosen by teach-ers of the University of New England for a4-year curriculum. Students become veryfamiliar with this software and could easilyuse it, as long as this software can solve theproblems they will encounter during theirprofessional careers. Another type of deci-sion tool, as spreadsheet templates, is avail-able for flock management decisions [1].Such a tool could have been used duringtraining courses but, since its main objec-tive is an economic optimisation, it is notdirectly adaptable to flock functioning sim-ulations.
As a consequence, none of these model-ling approaches was convenient for ourteaching goals. Another argument that playsin favour of developing our own models forteaching is that students could take part inthe elaboration of the model and thus learnto be critical when encountering unrealisticbehaviour of the system. Indeed, in suchextreme cases, students are to criticise theconceptual model (which is their view of thereal system) and/or the hypotheses devel-oped during the formalisation step. All thesepoints are of main interest as part of the stu-dents’ own experience. This is why modelsfor teaching have to be flexible and simple,making a top-bottom approach easier (fromthe results back to the hypotheses andinversely). In such a context, teacher-cum-researchers rely on their research experi-ences to deliberately simplify the researchmodels in order to achieve the formerlydescribed objectives.
The two techniques described in thispaper illustrate how modelling can origi-nally be used in livestock dynamics teach-ing. This pedagogical approach emphasisesthe usefulness of modelling in teaching, asalready experienced in other animal sciencecourses such as animal nutrition [18]. More-over, because our approach is progressiveand interactive, we are confident that, in thelong-term, students will be well-informedusers of more elaborated models such asdecision support tools.

450 C.-H. Moulin et al.
REFERENCES
[1] Benoit M., Un outil de simulation du fonction-nement du troupeau ovin allaitant et de sesrésultats économiques : une aide pour l’adap-tation à des contextes nouveaux, INRA Prod.Anim. 11 (1998) 199–209.
[2] Benoit M., Laignel G., Liénard G., Facteurstechniques, cohérence de fonctionnement etrentabilité en élevage ovin allaitant. Exemplesdu Massif Central Nord et du Montmorillon-nais, in: Proceedings of the 6th RencontresRecherches Ruminants, Paris, France, 1999,pp. 19–22.
[3] Blackburn H.D., Cartwright T.C., Descriptionand validation of the Texas A&M sheep sim-ulation model, J. Anim. Sci. 65 (1987) 373–386.
[4] Blanc F., Martin G.B., Bocquier F., Modellingreproduction in farm animals. Reprod. Fert.Dev. 13 (2001) 337–353.
[5] Bosman H.G., Ayantunde A.A., Steenstra F.A.,Udo H.M.J., A simulation model to assessproductivity of goat production in the tropics,Agric. Syst. 54 (1997) 539–576.
[6] Coulomb J., La race N’Dama : quelques cara-ctéristiques zootechniques, Rev. Élev. Méd.Vét. Pays Trop. 29 (1976) 367–380.
[7] Cournut S., Dedieu B., Comment simuler lefonctionnement d’un troupeau ovin viande ?in: Proceedings of the 7th Rencontres Recher-ches Ruminants, Paris, France, 2000, pp. 337–340.
[8] Dijkhuizen A.A., Stelwagen J., RenkemaJ.A., A stochastic model for the simulation ofmanagement decisions in dairy herd, with spe-cial reference to production, reproduction,culling and income, Prev. Vet. Med. 4 (1986)273–289.
[9] Donnely J.R., Freer M., Salmon L., MooreA.D., Simpson R.J., Dove H., Bolger T.P.,Evolution of the GRAZPLAN decision sup-port tools and adoption by the grazing industryin temperate Australia, Agric. Syst. 74 (2002)115–139.
[10] Ezanno P., Ickowicz A., Bocquier F., Factorsaffecting the body condition score of N’Damacows under extensive range management inSouthern Senegal, Anim. Res. 52 (2003) 37–48.
[11] Ezanno P., Ickowicz A., Faye B., Intégrer ladynamique de l’état corporel des vaches dansun modèle démographique : exemple destroupeaux bovins N’Dama (Sénégal), in: Pro-ceedings of the 9th Rencontres RecherchesRuminants, Paris, France, 2002, p. 78.
[12] Girard N., Lasseur J., Stratégies d’élevage etmaîtrise de la répartition temporelle de lareproduction. Exemple des élevages ovinsallaitant en montagne méditerranéenne, Cah.Agric. 6 (1997) 115–124.
[13] Leslie P.H., On the use of matrices in certainpopulation mathematics, Biometrika 33(1945) 183–212.
[14] Lesnoff M., Dynamics of a sheep populationin a Sahelian area (Ndiagne district in Sen-egal): a periodic matrix model, Agric. Syst. 61(1999) 207–221.
[15] Moulin C.H., Le concept de fonctionnementde troupeau. Diversité des pratiques et varia-bilité des performances animales dans un sys-tème agropastoral sahélien, INRA Ét. Rech.Syst. Agraires Dév. 27 (1993) 73–93.
[16] Nugent R.A., Jenkins T.G., Simulated effectsof culling ewes for age and failure to conceiveon biological efficiency of an annual lambingproduction system, J. Anim. Sci. 71 (1993)310–320.
[17] Ortavant R., Bocquier F., Pelletier J., ThimonierJ., Volland-Nail P., Seasonality of reproduc-tion in sheep and its control by photoperiod,Aust. J. Biol. Sci. 41 (1988) 69–85.
[18] Sauvant D., La modélisation systémique ennutrition, Reprod. Nutr. Dev. 32 (1992) 217–230.
[19] Spedding C.R.W., General aspects of model-ling and its application in livestock produc-tion, in: Korver S., Van Arendonk J.A.M.(Eds.), Modelling of livestock production sys-tems, Kluwer Academic Publishers, Dor-drecht, The Netherlands, 1988, pp. 3–9.
[20] Thériez M., Molénat G., Landais E., Feedingand management of prolific sheep underextensive management: the Romanov experi-ment in France, in: Fahmy M.H. (Ed.), Prolificsheep, CAB International, Wallingford, UK,1996, pp. 429–451.
[21] Tichit M., Ingrand S., Dedieu B., Bouche R.,Cournut S., Lasseur J., Moulin C.H.,Napoléone M., Thénard V., Le fonctionne-ment du troupeau : une interaction entre laconduite de l’éleveur et le comportementreproductif d’animaux, in: Proceedings of the9th Rencontres Recherches Ruminants, Paris,France, 2002, pp. 103–106.
[22] Tillard E., Moulin C.H., Faugère O., FaugèreB., Le suivi individuel des petits ruminants auSénégal : un mode d’étude des troupeaux enmilieu villageois, INRA Prod. Anim. 10(1997) 67–78.
[23] Wery J., Lecoeur J., Learning crop physiologyfrom the development of a crop simulationmodel, J. Nat. Resour. Life Sci. Educ. 29(2000) 1–7.