Embed Size (px)
Citation preview
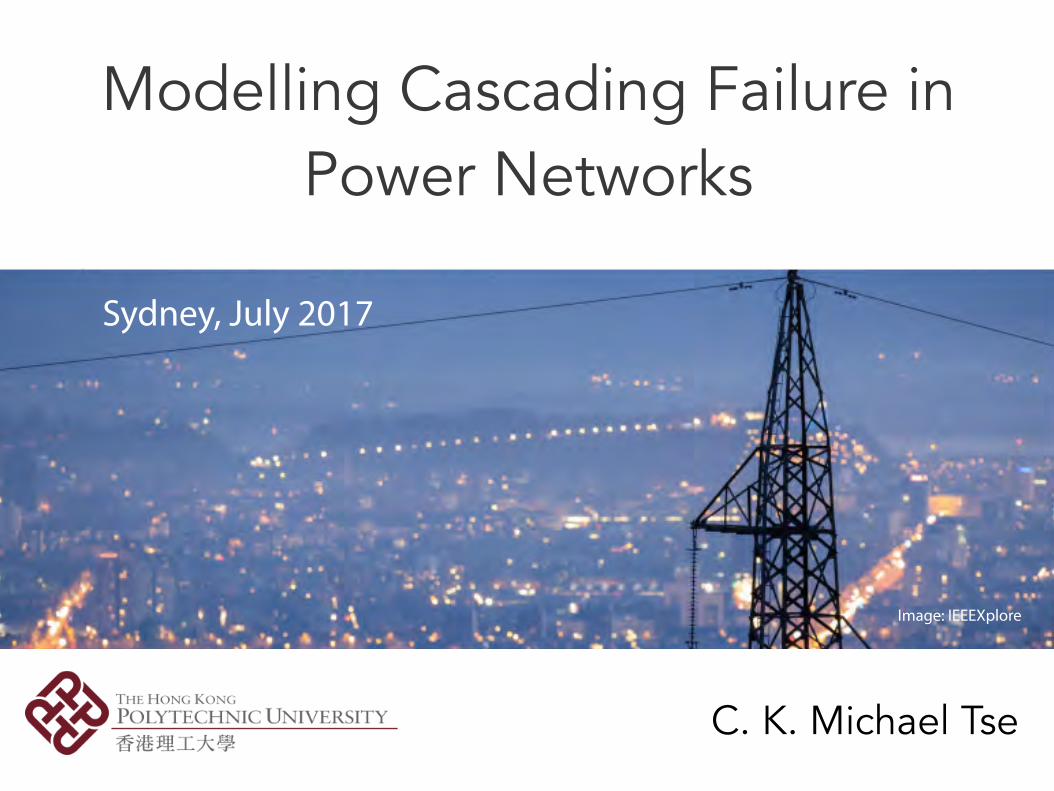
Modelling Cascading Failure in Power Networks
C. K. Michael Tse
Sydney, July 2017
Image: IEEEXplore
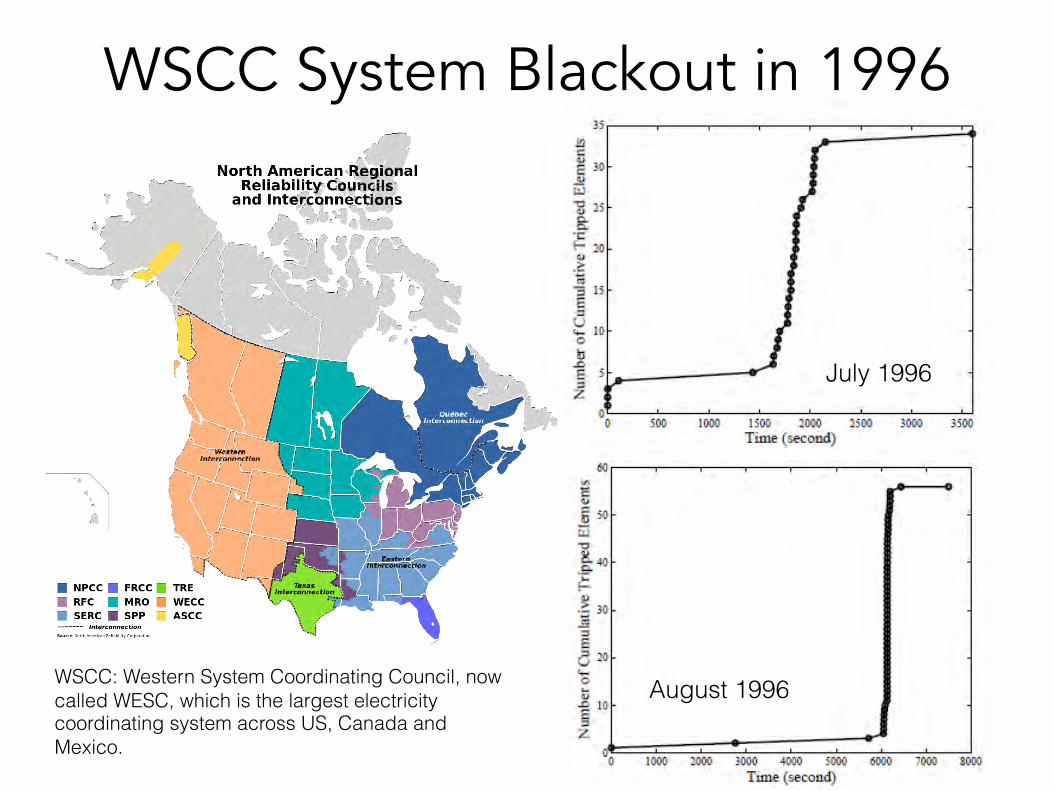
WSCC System Blackout in 1996
July 1996
August 1996WSCC: Western System Coordinating Council, now called WESC, which is the largest electricity coordinating system across US, Canada and Mexico.
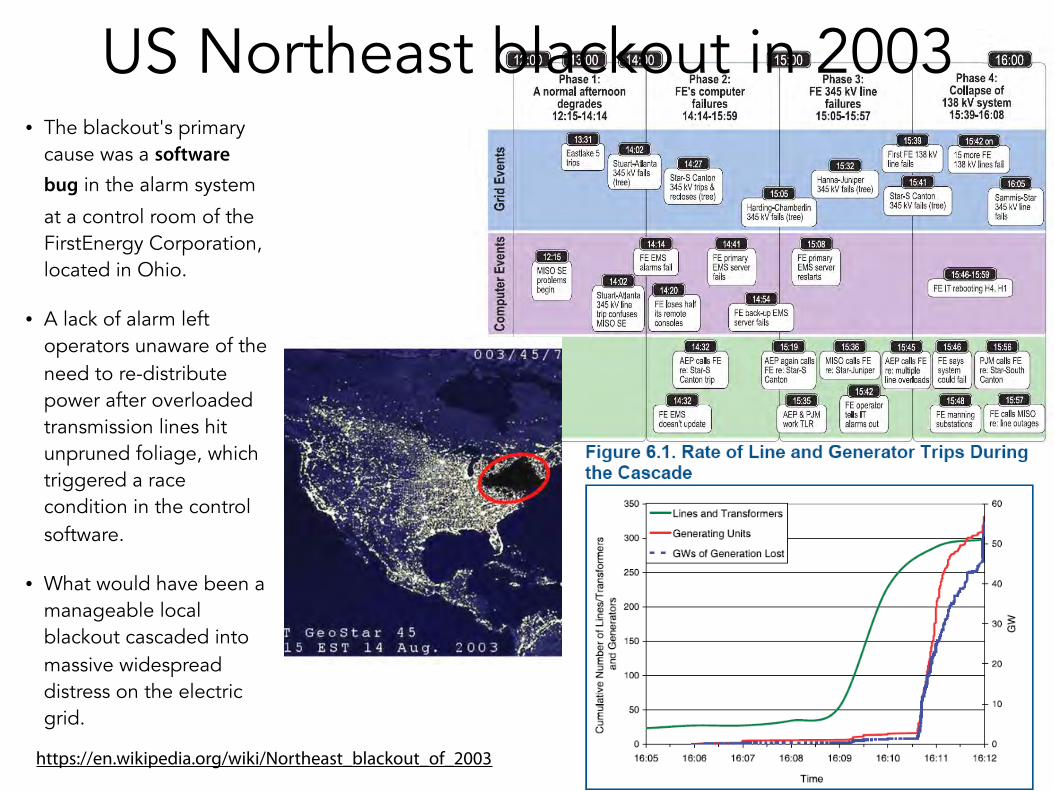
• The blackout's primary cause was a software
bug in the alarm system
at a control room of the FirstEnergy Corporation, located in Ohio.
• A lack of alarm left operators unaware of the need to re-distribute power after overloaded transmission lines hit unpruned foliage, which triggered a race condition in the control software.
• What would have been a manageable local blackout cascaded into massive widespread distress on the electric grid.
https://en.wikipedia.org/wiki/Northeast_blackout_of_2003
US Northeast blackout in 2003
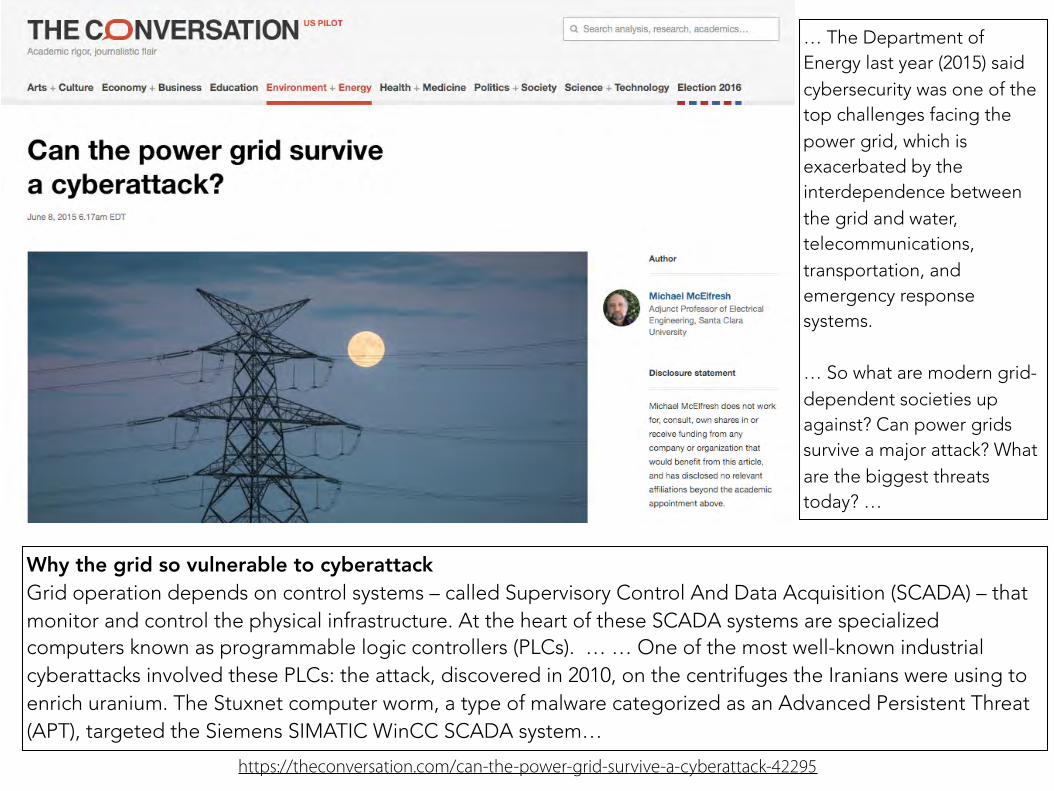
https://theconversation.com/can-the-power-grid-survive-a-cyberattack-42295
… The Department of Energy last year (2015) said cybersecurity was one of the top challenges facing the power grid, which is exacerbated by the interdependence between the grid and water, telecommunications, transportation, and emergency response systems.
… So what are modern grid-dependent societies up against? Can power grids survive a major attack? What are the biggest threats today? …
Why the grid so vulnerable to cyberattack Grid operation depends on control systems – called Supervisory Control And Data Acquisition (SCADA) – that monitor and control the physical infrastructure. At the heart of these SCADA systems are specialized computers known as programmable logic controllers (PLCs). … … One of the most well-known industrial cyberattacks involved these PLCs: the attack, discovered in 2010, on the centrifuges the Iranians were using to enrich uranium. The Stuxnet computer worm, a type of malware categorized as an Advanced Persistent Threat (APT), targeted the Siemens SIMATIC WinCC SCADA system…
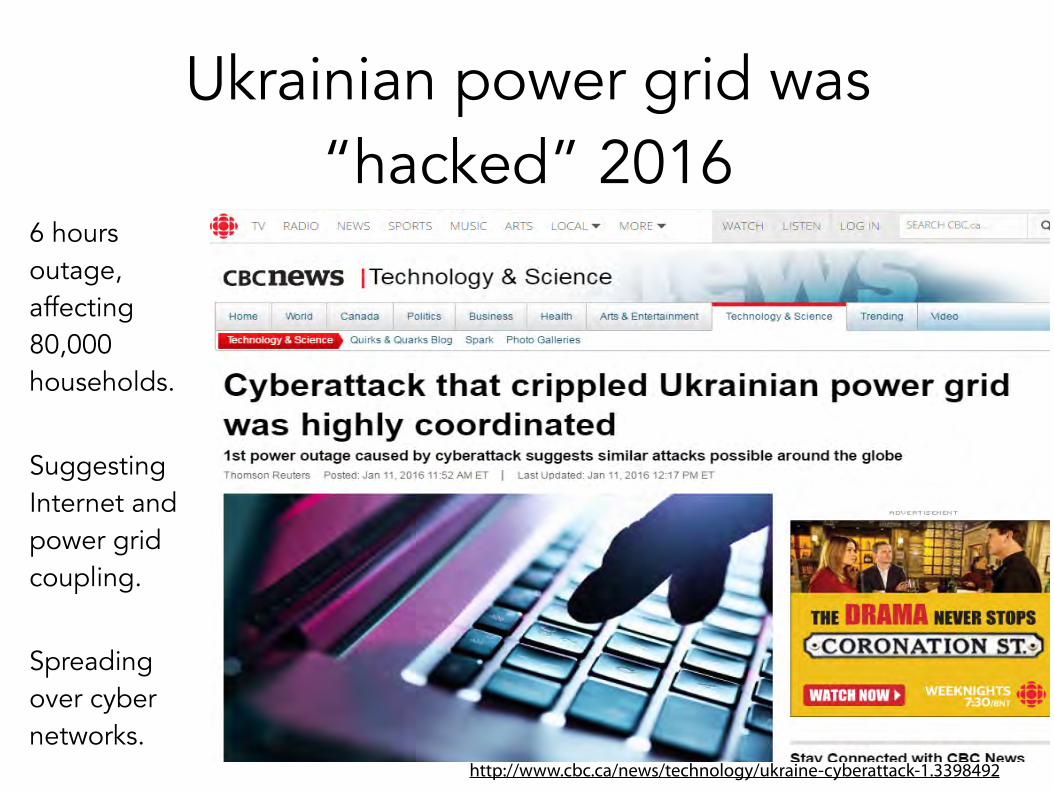
Ukrainian power grid was “hacked” 2016
http://www.cbc.ca/news/technology/ukraine-cyberattack-1.3398492
6 hours outage, affecting 80,000 households.
Suggesting Internet and power grid coupling.
Spreading over cyber networks.
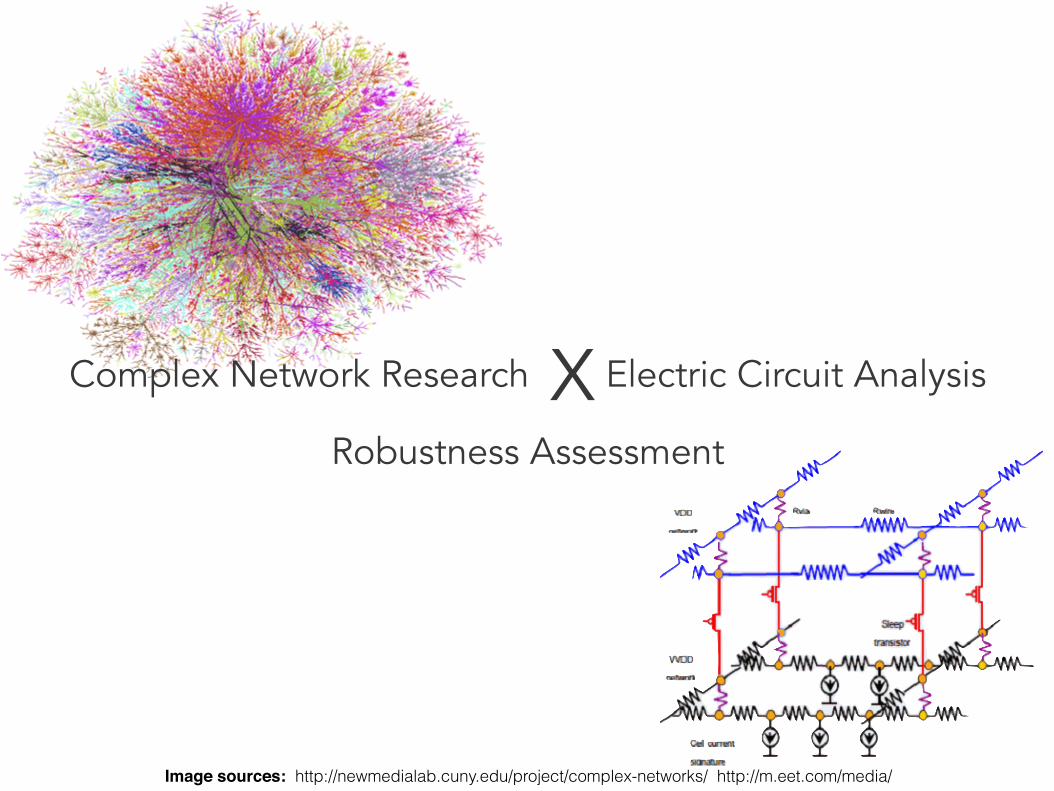
Image sources: http://newmedialab.cuny.edu/project/complex-networks/ http://m.eet.com/media/
Complex Network Research X Electric Circuit Analysis
Robustness Assessment
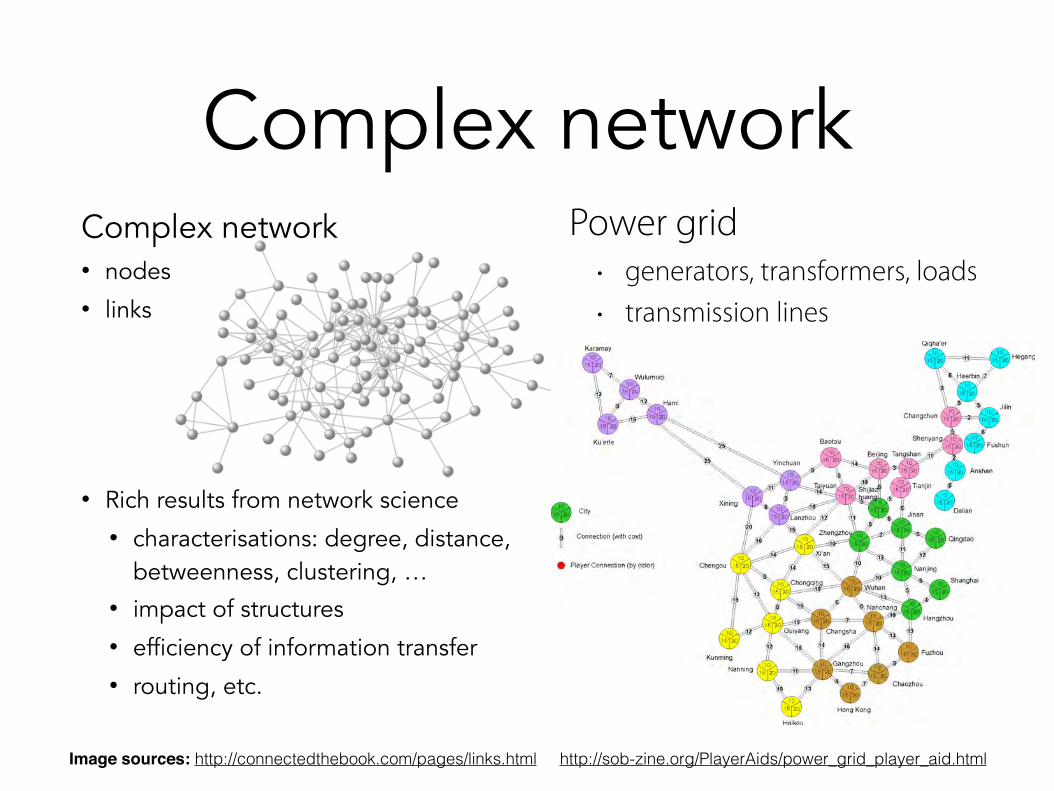
Complex networkComplex network • nodes • links
• Rich results from network science • characterisations: degree, distance,
betweenness, clustering, … • impact of structures • efficiency of information transfer • routing, etc.
Image sources: http://connectedthebook.com/pages/links.html http://sob-zine.org/PlayerAids/power_grid_player_aid.html
Power grid • generators, transformers, loads • transmission lines
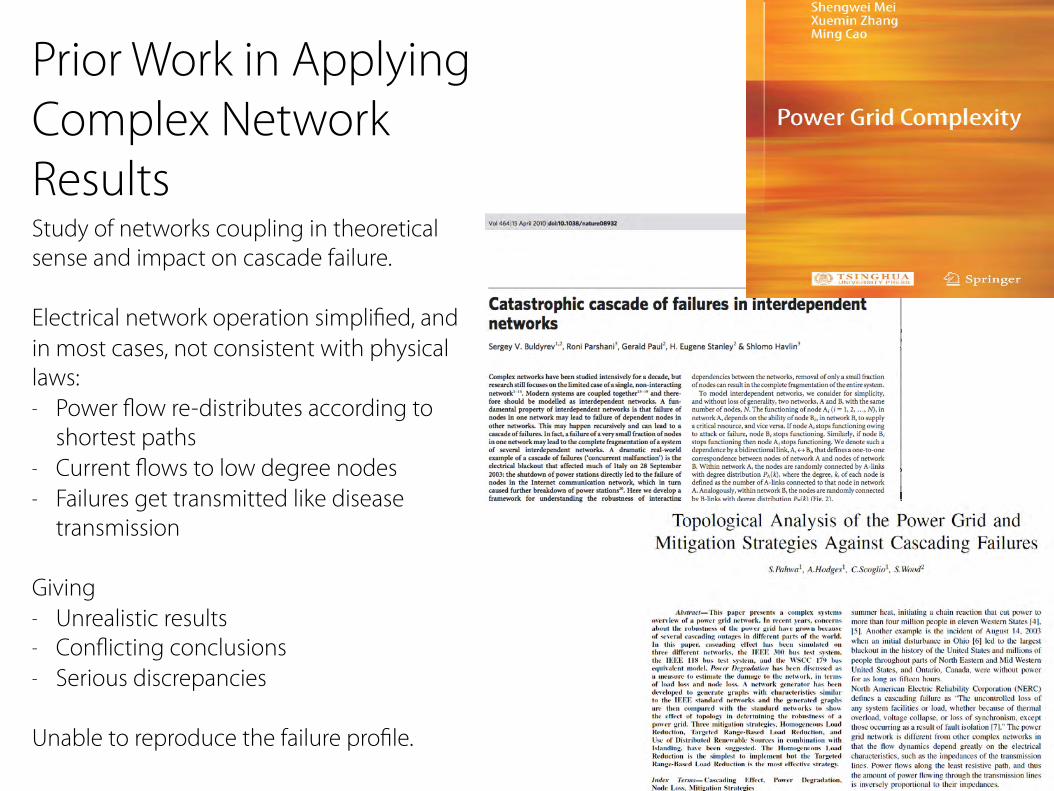
Prior Work in Applying Complex Network Results Study of networks coupling in theoretical sense and impact on cascade failure.
Electrical network operation simplified, and in most cases, not consistent with physical laws: - Power flow re-distributes according to
shortest paths - Current flows to low degree nodes - Failures get transmitted like disease
transmission
Giving - Unrealistic results - Conflicting conclusions - Serious discrepancies
Unable to reproduce the failure profile.
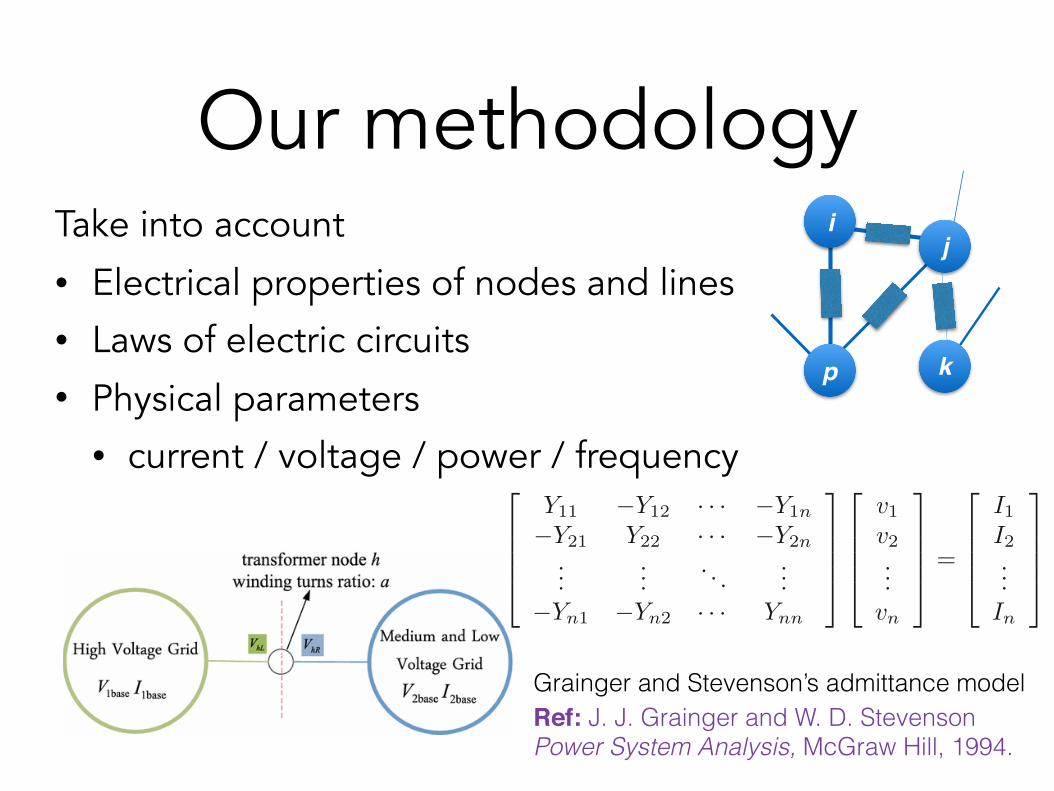
Our methodologyTake into account • Electrical properties of nodes and lines • Laws of electric circuits • Physical parameters
• current / voltage / power / frequency
Grainger and Stevenson’s admittance model Ref: J. J. Grainger and W. D. Stevenson Power System Analysis, McGraw Hill, 1994.
2
6664
Y11 �Y12 · · · �Y1n
�Y21 Y22 · · · �Y2n...
.... . .
...�Yn1 �Yn2 · · · Ynn
3
7775
2
6664
v1v2...vn
3
7775=
2
6664
I1I2...In
3
7775
ij
p k
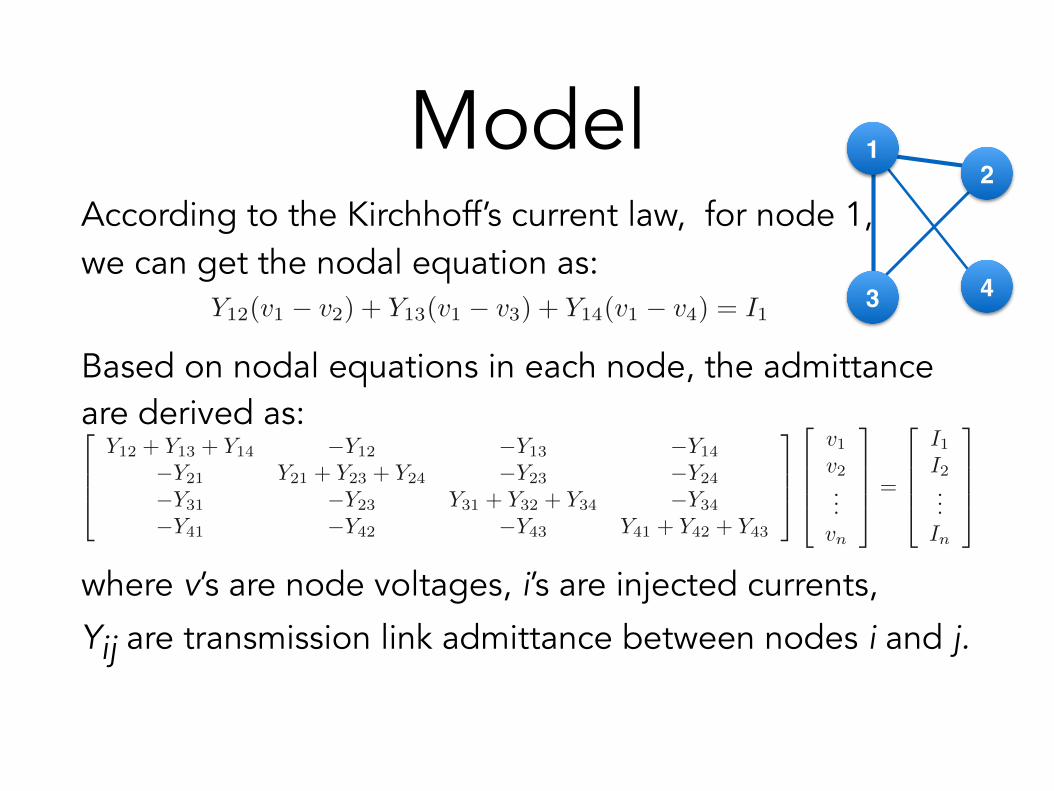
ModelAccording to the Kirchhoff’s current law, for node 1, we can get the nodal equation as:
Based on nodal equations in each node, the admittance are derived as:
where v’s are node voltages, i’s are injected currents,
Yij are transmission link admittance between nodes i and j.
12
3 4Y12(v1 � v2) + Y13(v1 � v3) + Y14(v1 � v4) = I1
2
664
Y12 + Y13 + Y14 �Y12 �Y13 �Y14
�Y21 Y21 + Y23 + Y24 �Y23 �Y24
�Y31 �Y23 Y31 + Y32 + Y34 �Y34
�Y41 �Y42 �Y43 Y41 + Y42 + Y43
3
775
2
6664
v1v2...vn
3
7775=
2
6664
I1I2...In
3
7775
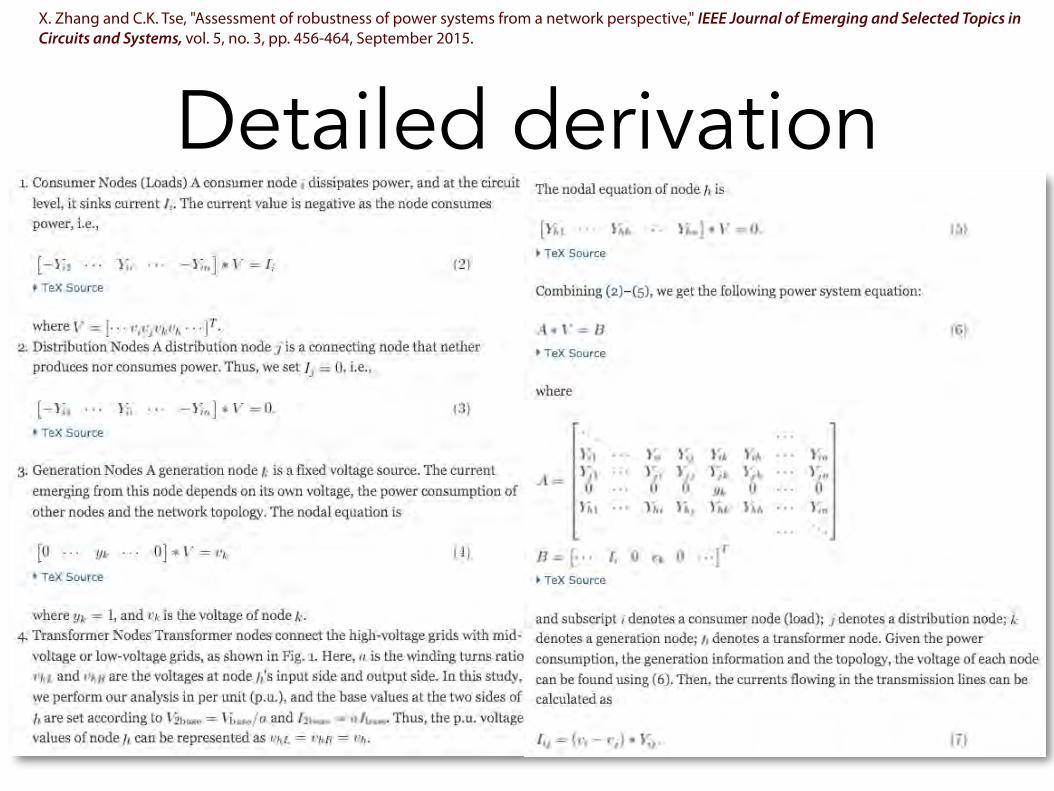
Detailed derivationX. Zhang and C.K. Tse, "Assessment of robustness of power systems from a network perspective," IEEE Journal of Emerging and Selected Topics in Circuits and Systems, vol. 5, no. 3, pp. 456-464, September 2015.
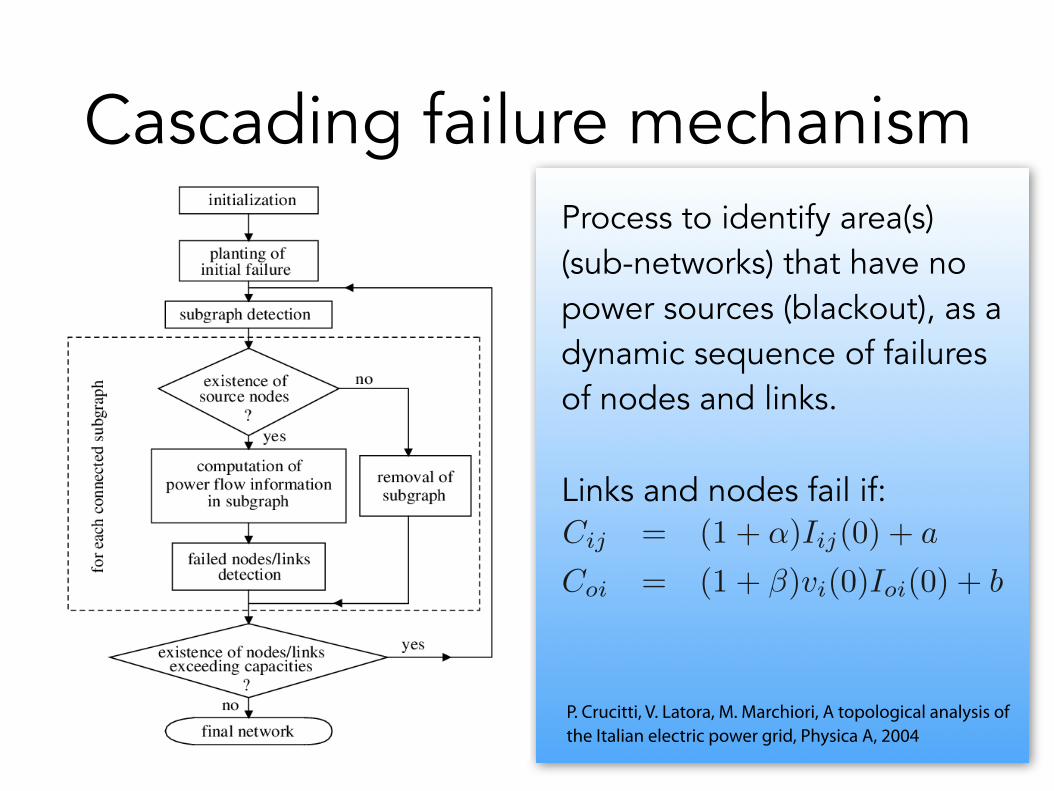
Cascading failure mechanism
P. Crucitti, V. Latora, M. Marchiori, A topological analysis of the Italian electric power grid, Physica A, 2004
Cij
= (1 + ↵)Iij
(0) + a
Coi
= (1 + �)vi
(0)Ioi
(0) + b
Process to identify area(s) (sub-networks) that have no power sources (blackout), as a dynamic sequence of failures of nodes and links.
Links and nodes fail if:
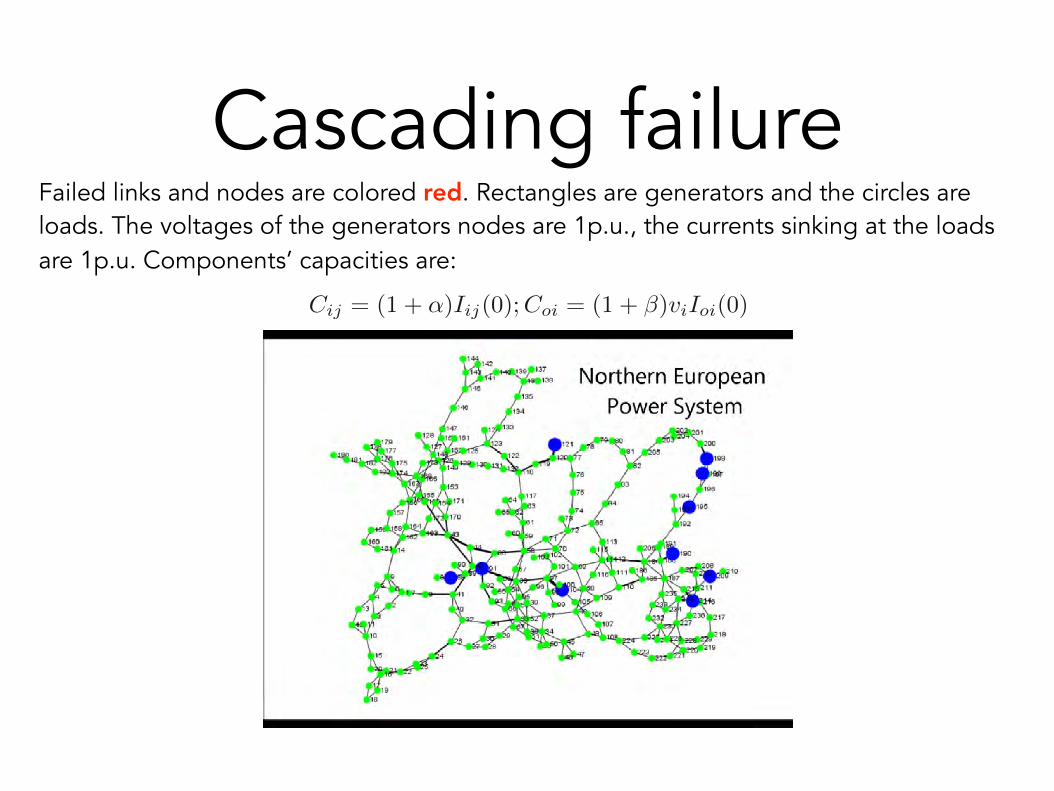
Cascading failureFailed links and nodes are colored red. Rectangles are generators and the circles are loads. The voltages of the generators nodes are 1p.u., the currents sinking at the loads are 1p.u. Components’ capacities are:
Cij
= (1 + ↵)Iij
(0);Coi
= (1 + �)vi
Ioi
(0)
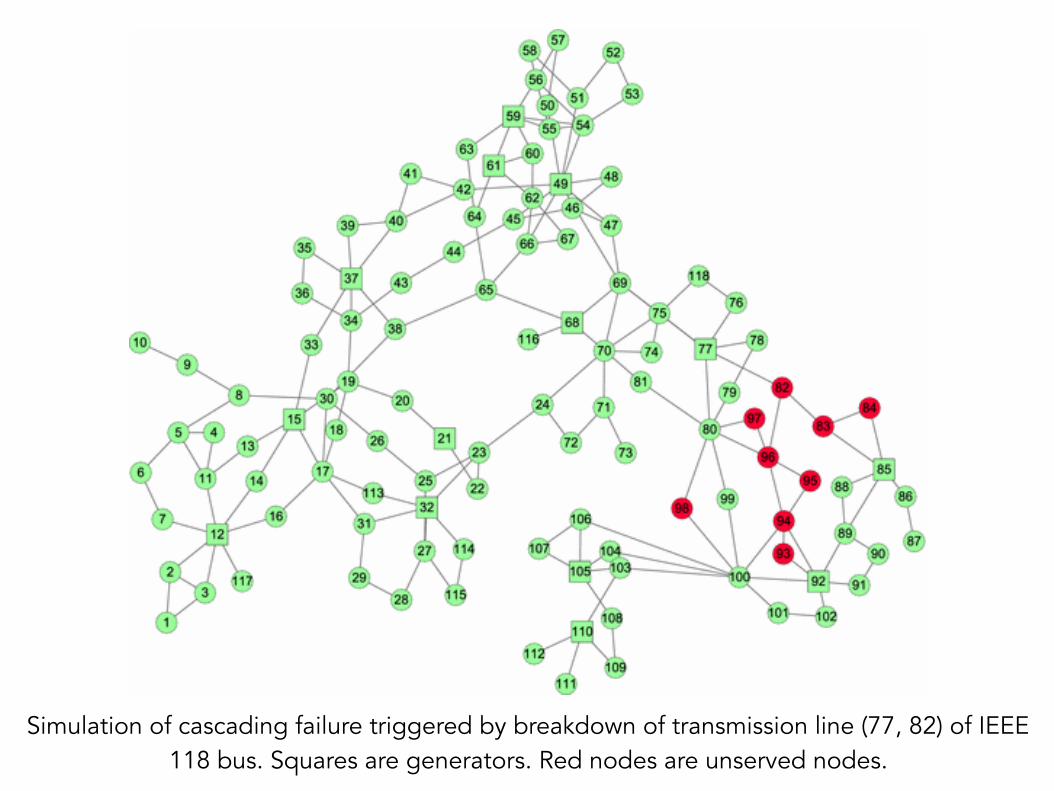
Simulation of cascading failure triggered by breakdown of transmission line (77, 82) of IEEE 118 bus. Squares are generators. Red nodes are unserved nodes.
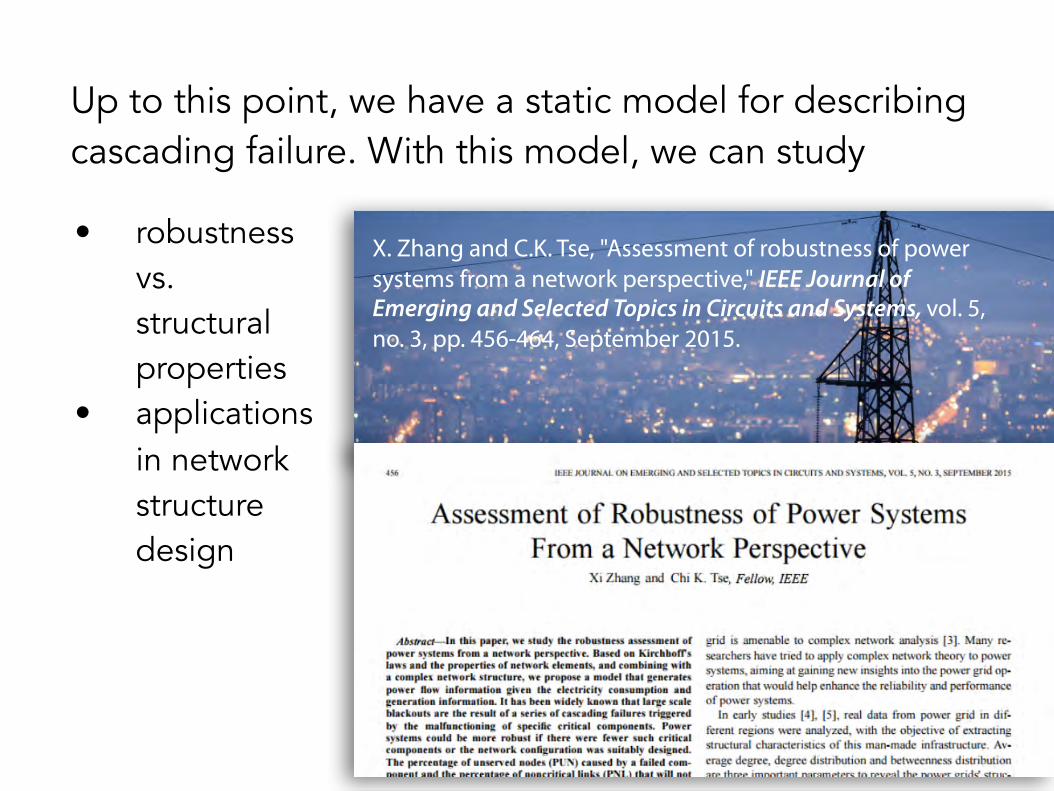
Up to this point, we have a static model for describing cascading failure. With this model, we can study
X. Zhang and C.K. Tse, "Assessment of robustness of power systems from a network perspective," IEEE Journal of Emerging and Selected Topics in Circuits and Systems, vol. 5, no. 3, pp. 456-464, September 2015.
• robustness vs. structural properties
• applications in network structure design
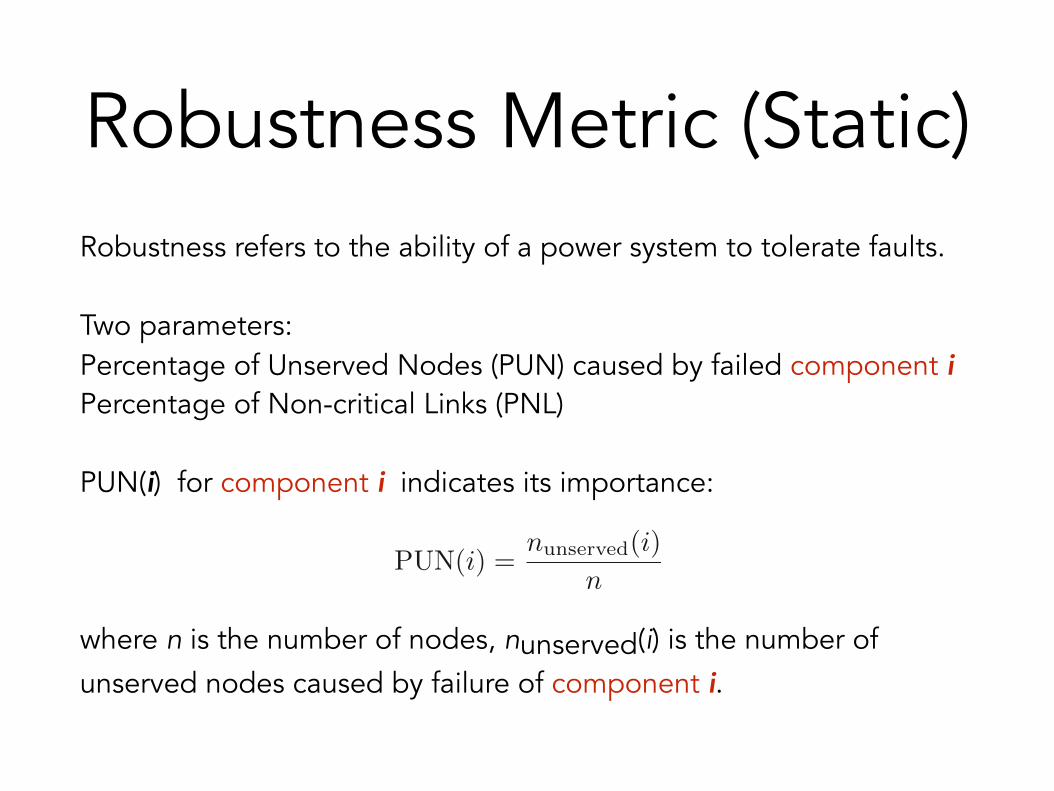
Robustness Metric (Static)Robustness refers to the ability of a power system to tolerate faults.
Two parameters: Percentage of Unserved Nodes (PUN) caused by failed component i Percentage of Non-critical Links (PNL)
PUN(i) for component i indicates its importance:
where n is the number of nodes, nunserved(i) is the number of unserved nodes caused by failure of component i.
PUN(i) =nunserved(i)
n
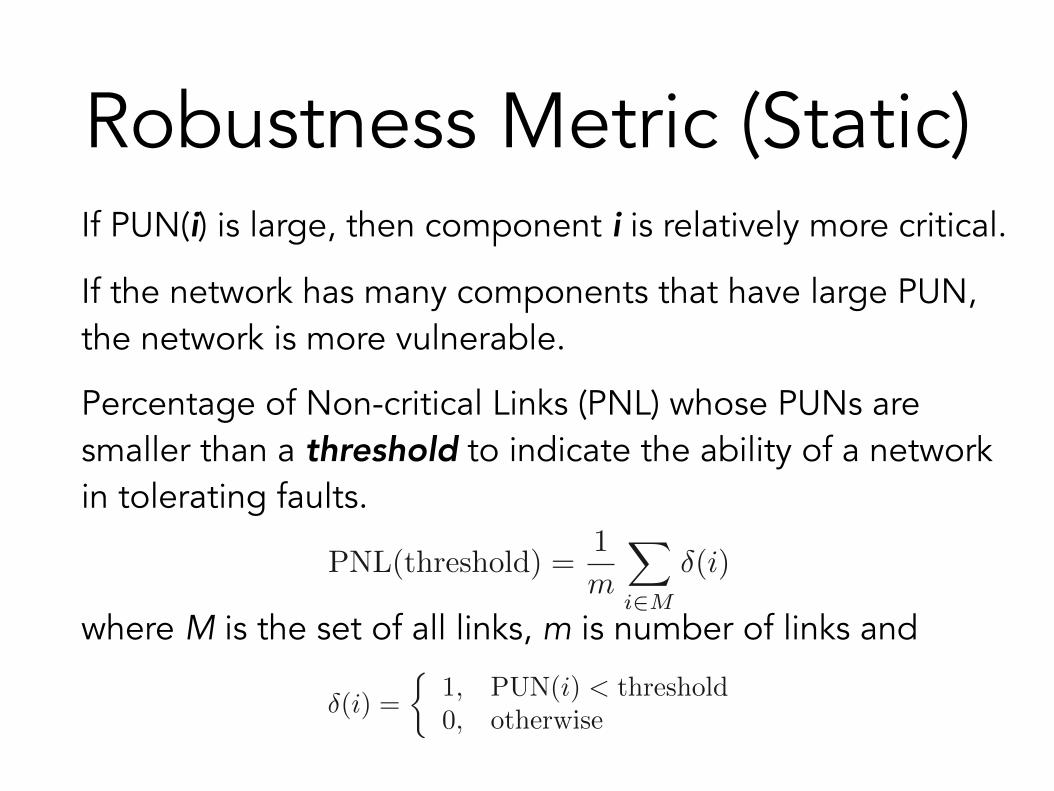
If PUN(i) is large, then component i is relatively more critical.
If the network has many components that have large PUN, the network is more vulnerable.
Percentage of Non-critical Links (PNL) whose PUNs are smaller than a threshold to indicate the ability of a network in tolerating faults.
where M is the set of all links, m is number of links and
Robustness Metric (Static)
PNL(threshold) =
1
m
X
i2M
�(i)
�(i) =
⇢1, PUN(i) < threshold
0, otherwise
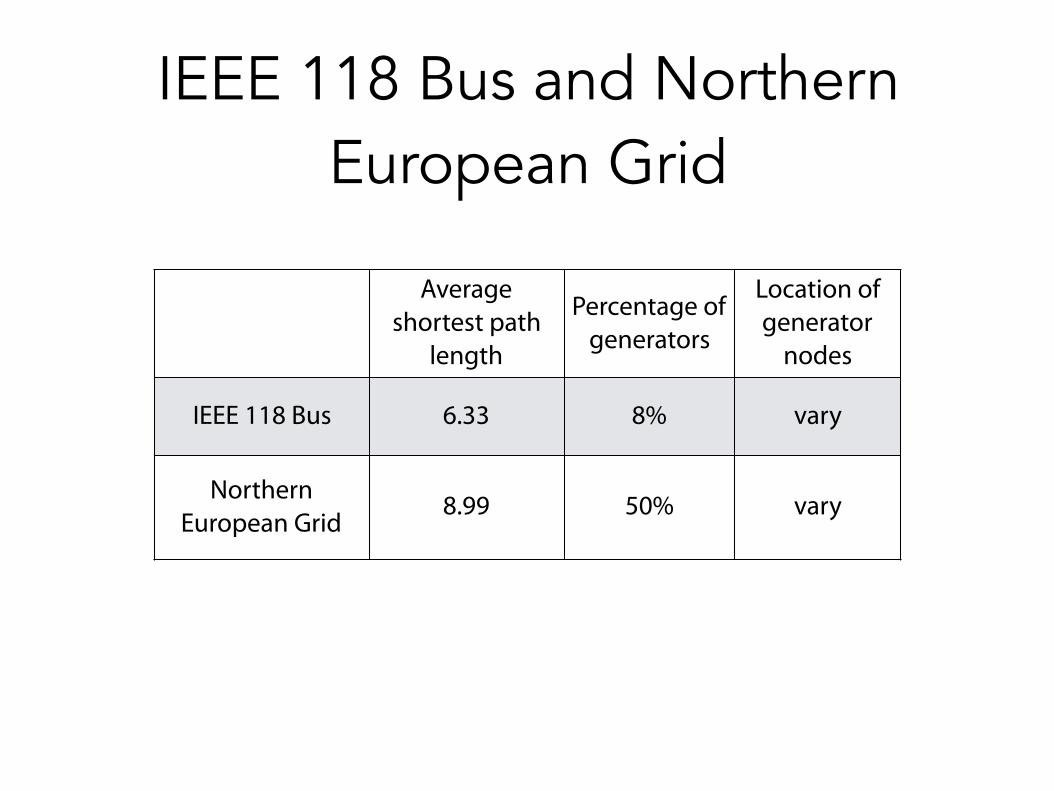
Average shortest path
length
Percentage of generators
Location of generator
nodes
IEEE 118 Bus 6.33 8% vary
Northern European Grid
8.99 50% vary
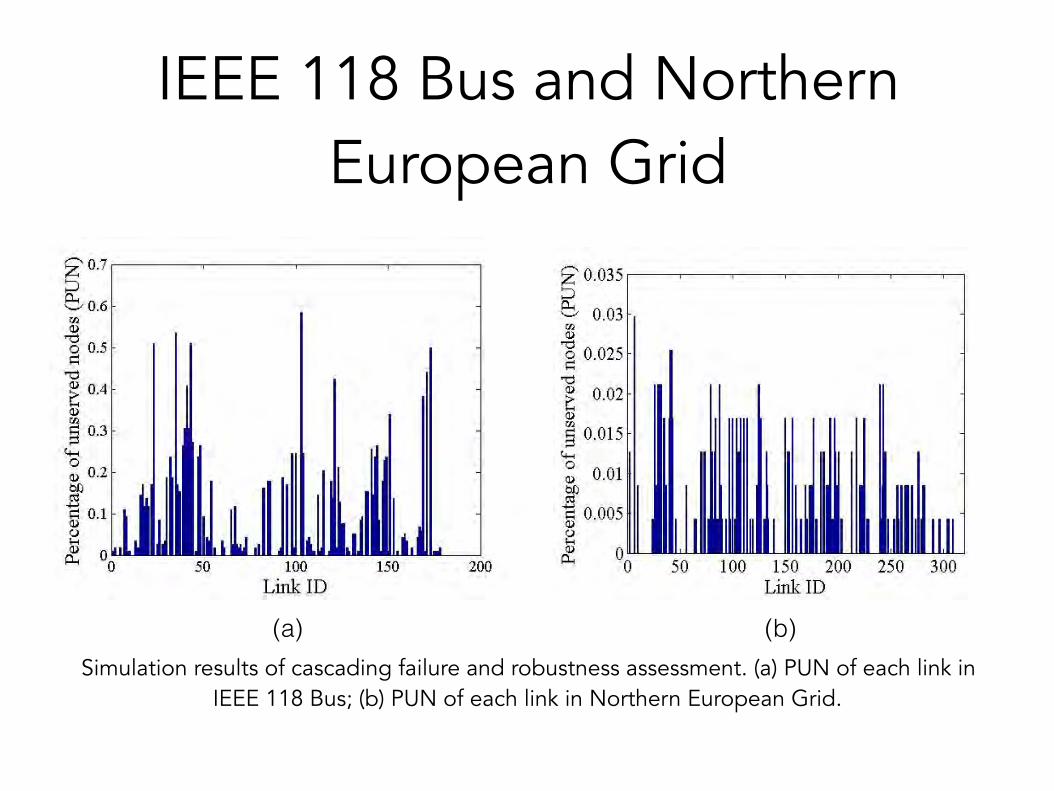
IEEE 118 Bus and Northern European Grid
IEEE 118 Bus and Northern European Grid
Simulation results of cascading failure and robustness assessment. (a) PUN of each link in IEEE 118 Bus; (b) PUN of each link in Northern European Grid.
(a) (b)
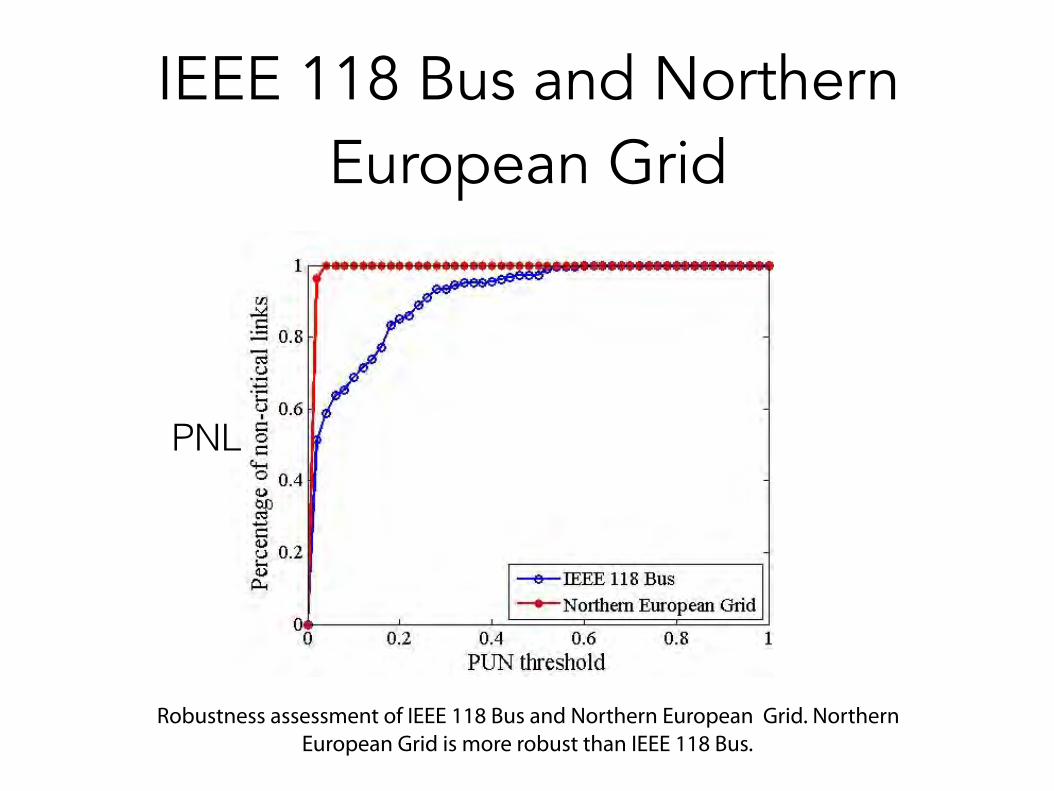
IEEE 118 Bus and Northern European Grid
PNL
Robustness assessment of IEEE 118 Bus and Northern European Grid. Northern European Grid is more robust than IEEE 118 Bus.
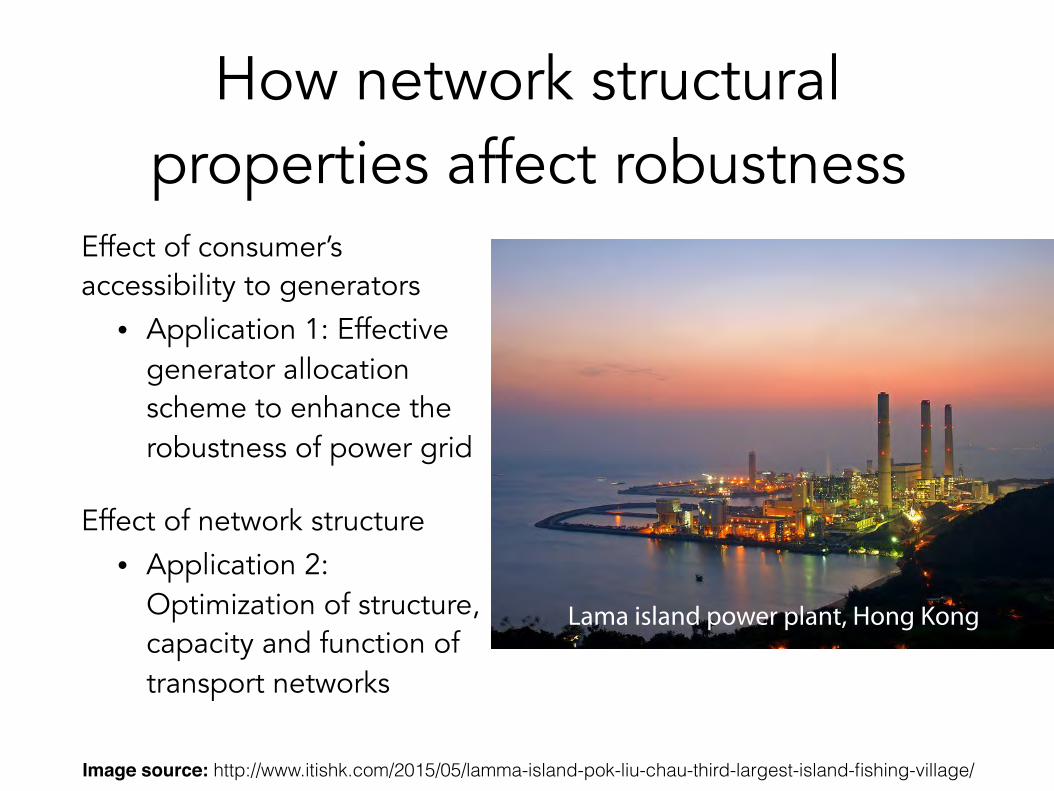
How network structural properties affect robustness
Effect of consumer’s accessibility to generators
• Application 1: Effective generator allocation scheme to enhance the robustness of power grid
Effect of network structure • Application 2:
Optimization of structure, capacity and function of transport networks
Lama island power plant, Hong Kong
Image source: http://www.itishk.com/2015/05/lamma-island-pok-liu-chau-third-largest-island-fishing-village/
How decentralisation of power accessibility affects
robustness
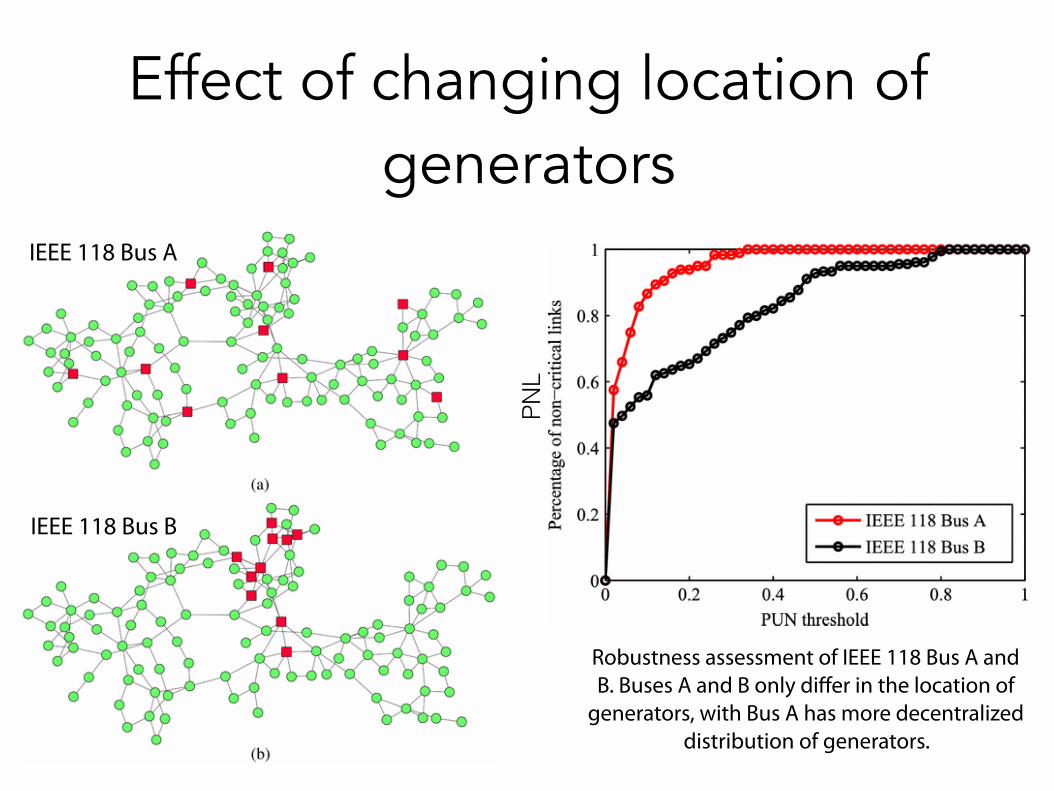
Effect of changing location of generators
IEEE 118 Bus A
IEEE 118 Bus B
Robustness assessment of IEEE 118 Bus A and B. Buses A and B only differ in the location of
generators, with Bus A has more decentralized distribution of generators.
PNL
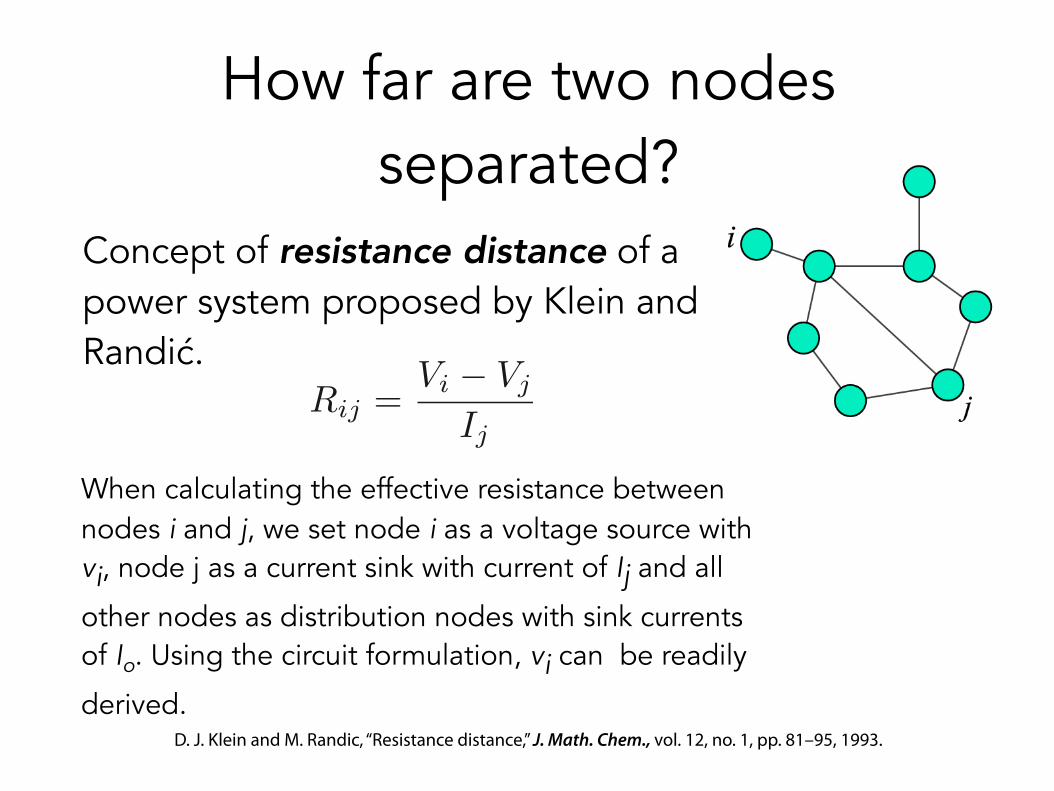
How far are two nodes separated?
Concept of resistance distance of a power system proposed by Klein and Randić.
When calculating the effective resistance between nodes i and j, we set node i as a voltage source with vi, node j as a current sink with current of Ij and all
other nodes as distribution nodes with sink currents of Io. Using the circuit formulation, vi can be readily
derived.
Rij =Vi � Vj
Ij
D. J. Klein and M. Randic, “Resistance distance,” J. Math. Chem., vol. 12, no. 1, pp. 81–95, 1993.
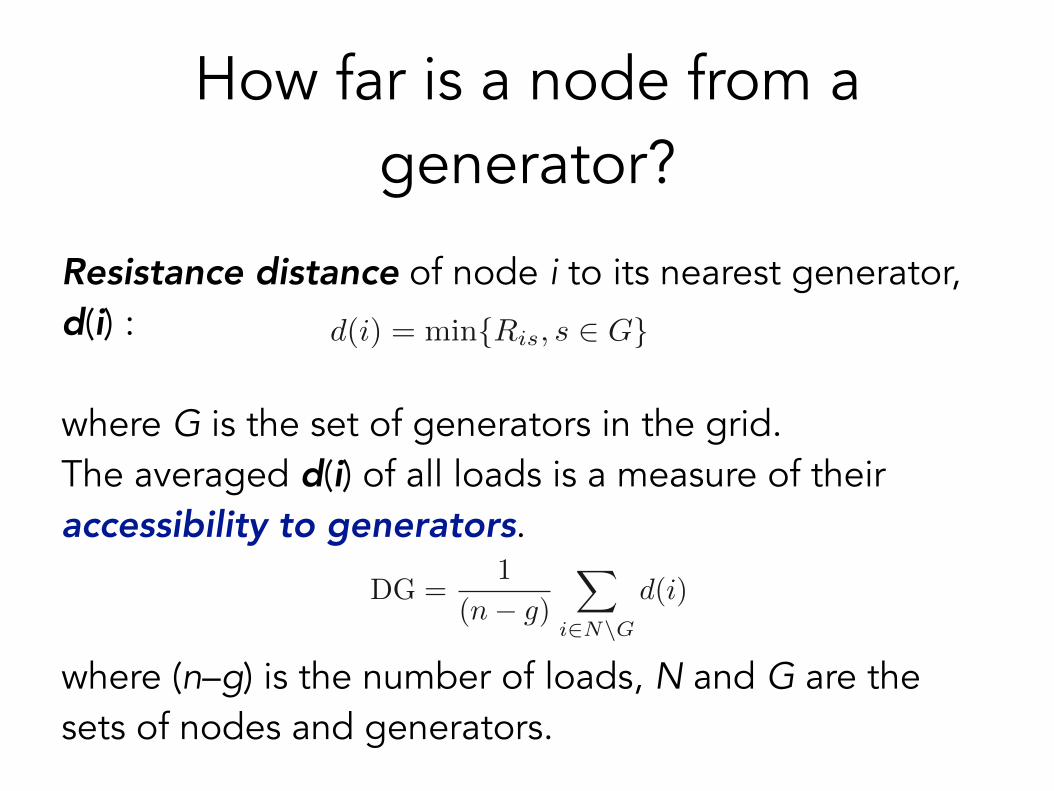
How far is a node from a generator?
Resistance distance of node i to its nearest generator, d(i) :
where G is the set of generators in the grid. The averaged d(i) of all loads is a measure of their accessibility to generators.
where (n–g) is the number of loads, N and G are the sets of nodes and generators.
d(i) = min{Ris, s 2 G}
DG =1
(n� g)
X
i2N\G
d(i)
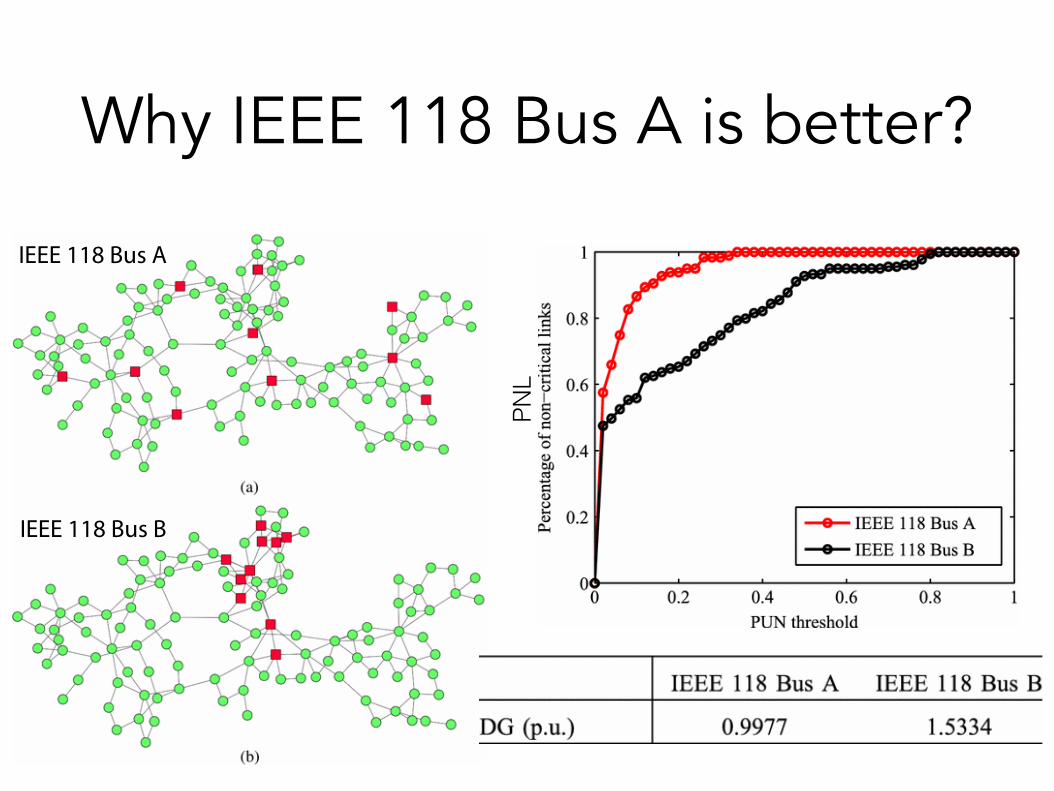
IEEE 118 Bus A
IEEE 118 Bus BPN
L
Why IEEE 118 Bus A is better?
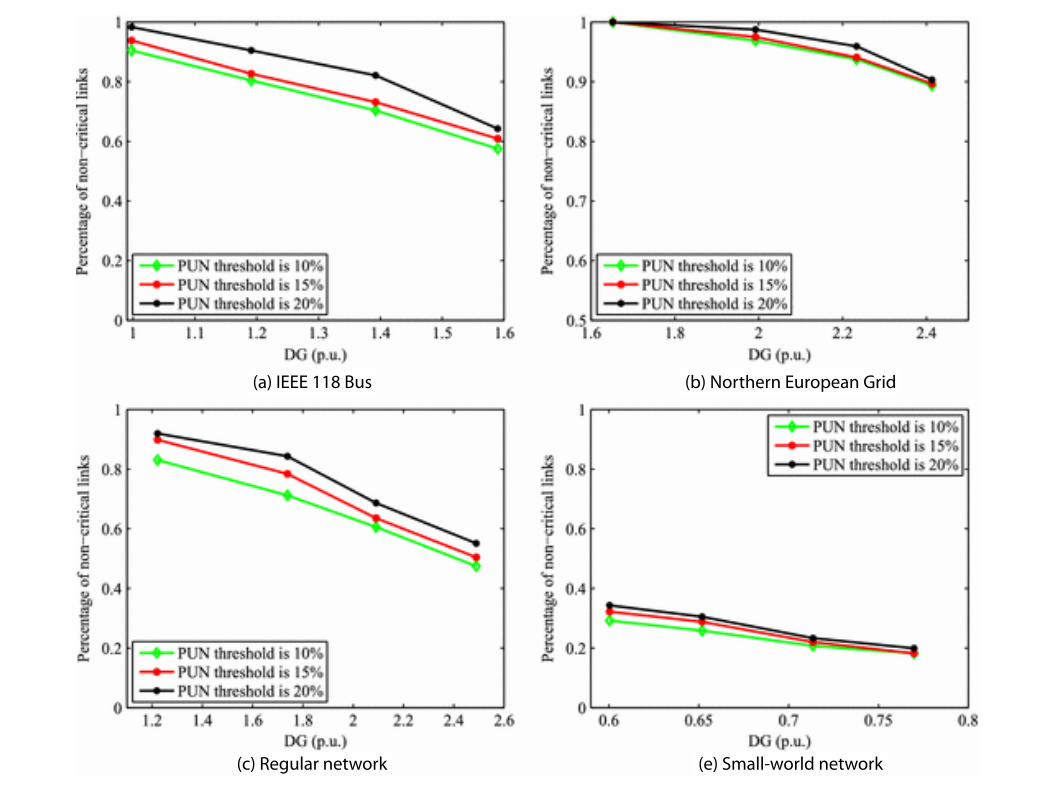
(a) IEEE 118 Bus (b) Northern European Grid
(c) Regular network (e) Small-world network
Interim Conclusion
For a given network structure, DG can indicate the accessibility to generators of all consumers. A smaller DG helps to increase the robustness of a power system.
Thus, the metric DG proposed here is an effective design parameter for guiding the power engineers to choose appropriate locations for generators in a given network structure to achieve a more robust power system.
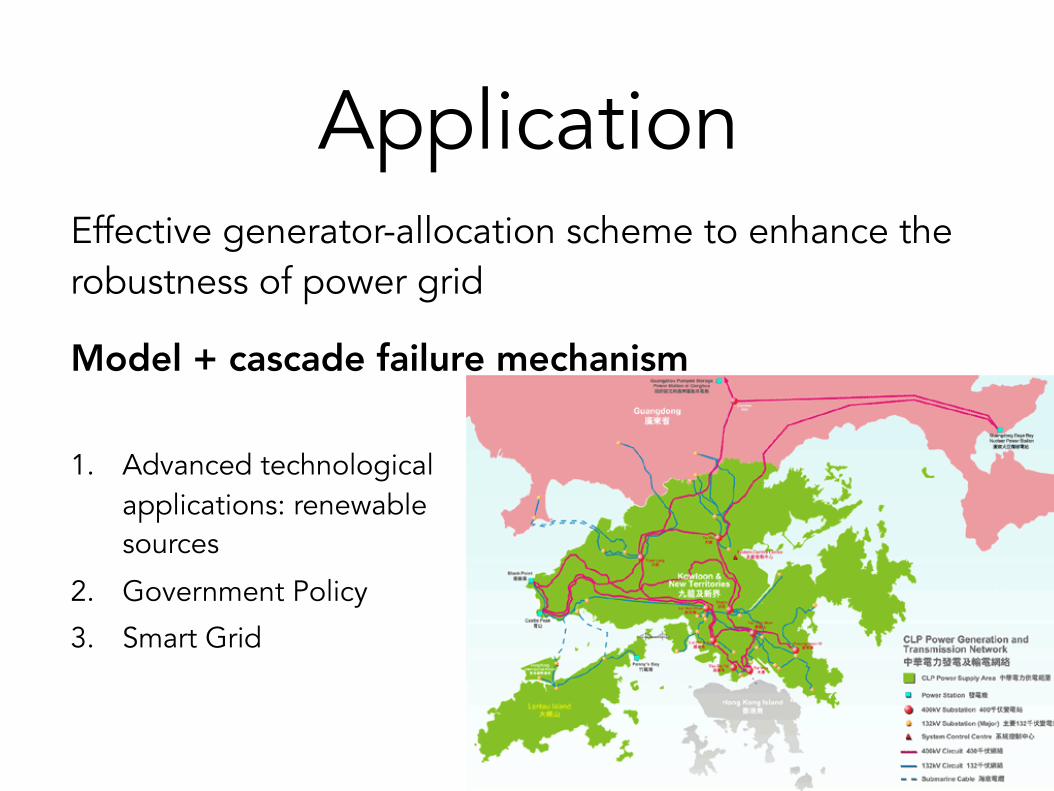
ApplicationEffective generator-allocation scheme to enhance the robustness of power grid
Model + cascade failure mechanism
1. Advanced technological applications: renewable sources
2. Government Policy
3. Smart Grid
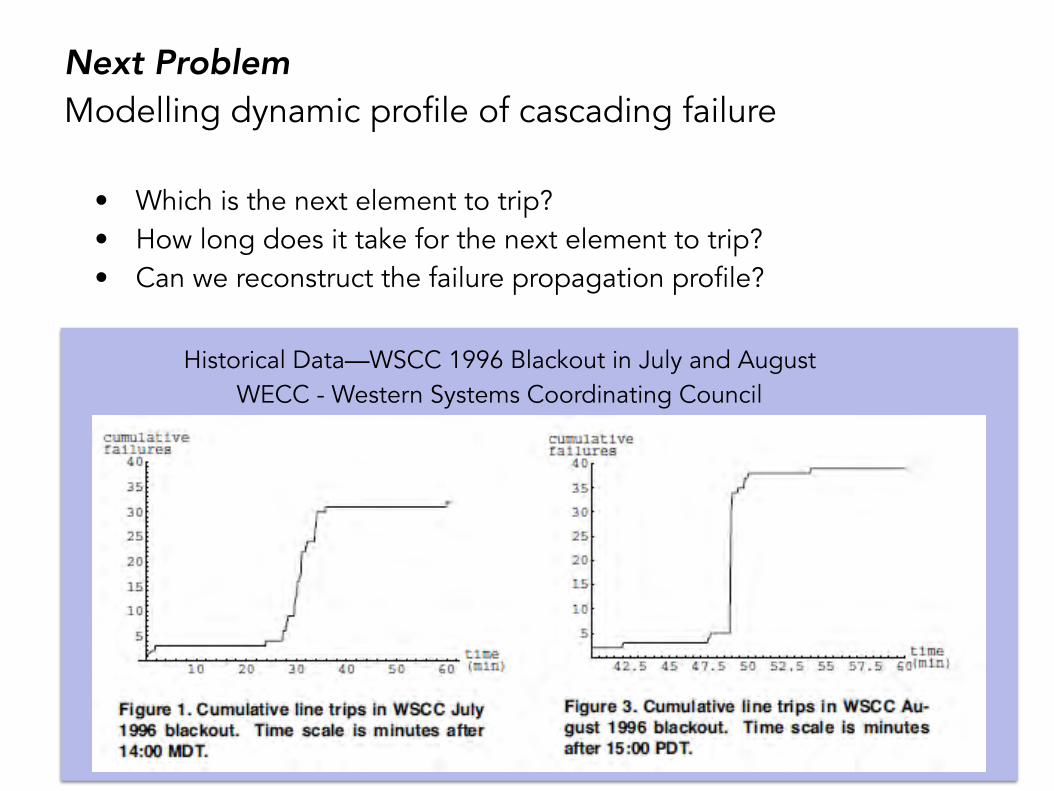
Next Problem Modelling dynamic profile of cascading failure
• Which is the next element to trip? • How long does it take for the next element to trip? • Can we reconstruct the failure propagation profile?
Historical Data—WSCC 1996 Blackout in July and August WECC - Western Systems Coordinating Council
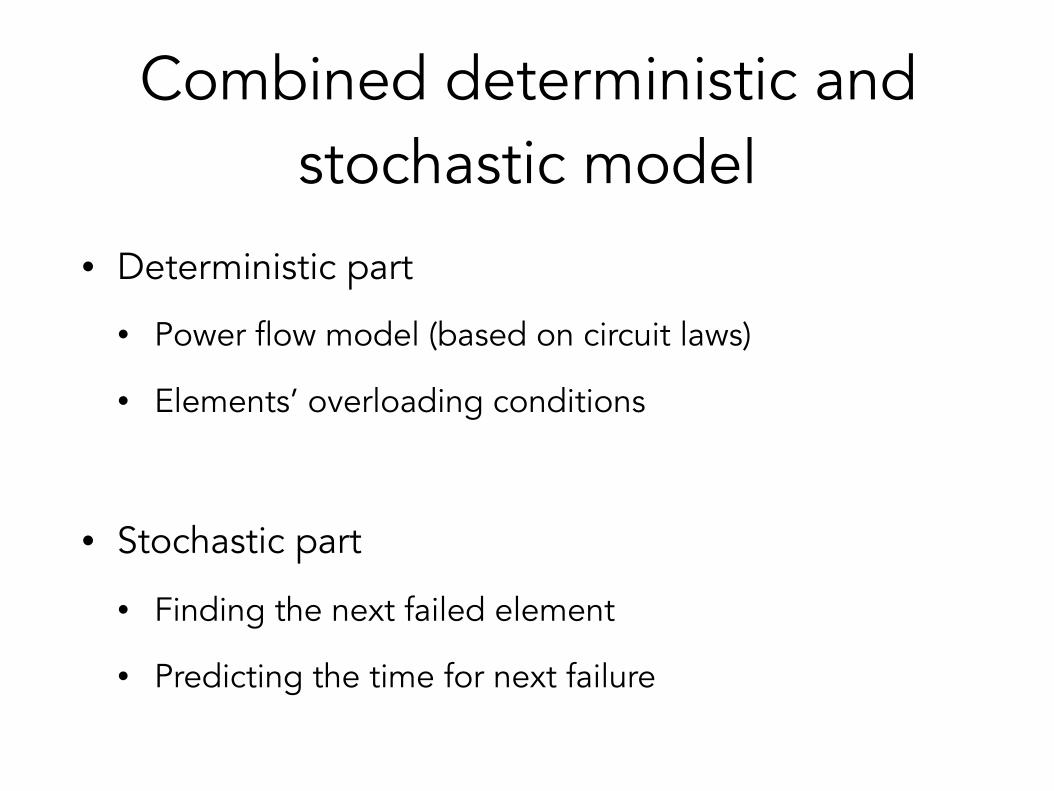
Combined deterministic and stochastic model
• Deterministic part
• Power flow model (based on circuit laws)
• Elements’ overloading conditions
• Stochastic part
• Finding the next failed element
• Predicting the time for next failure
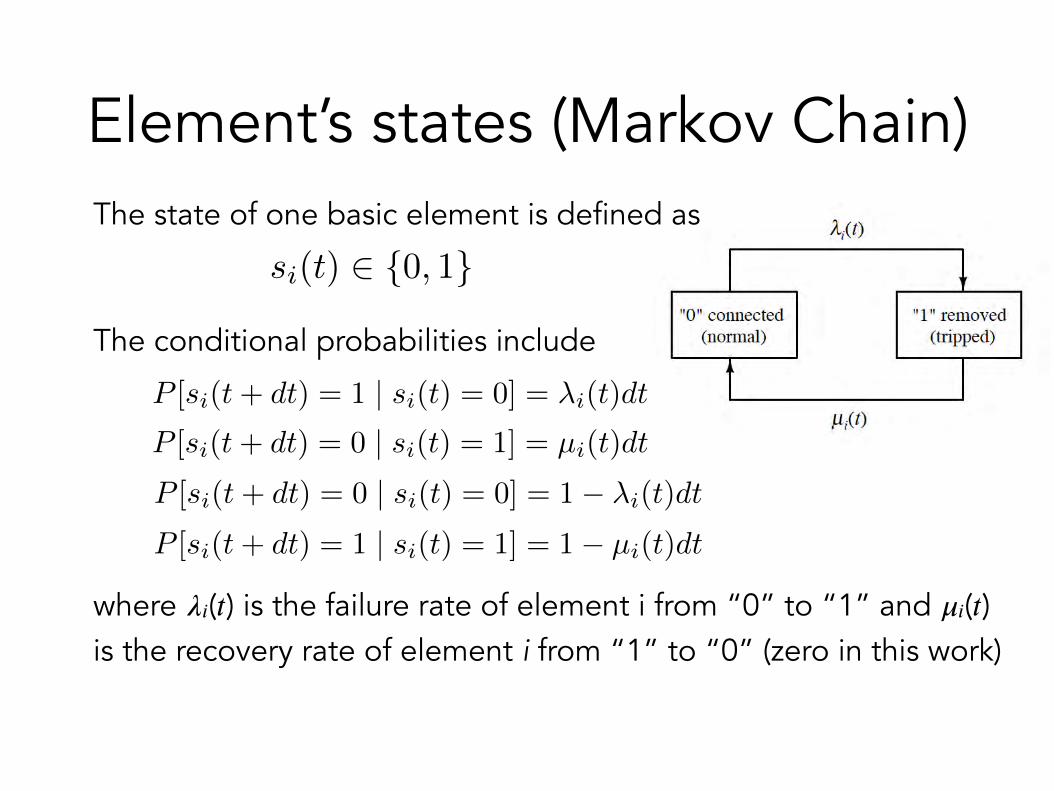
Element’s states (Markov Chain)The state of one basic element is defined as
The conditional probabilities include
where 𝜆𝑖(𝑡) is the failure rate of element i from “0” to “1” and 𝜇𝑖(𝑡) is the recovery rate of element i from “1” to “0” (zero in this work)
si(t) 2 {0, 1}
P [si(t+ dt) = 1 | si(t) = 0] = �i(t)dt
P [si(t+ dt) = 0 | si(t) = 1] = µi(t)dt
P [si(t+ dt) = 0 | si(t) = 0] = 1� �i(t)dt
P [si(t+ dt) = 1 | si(t) = 1] = 1� µi(t)dt
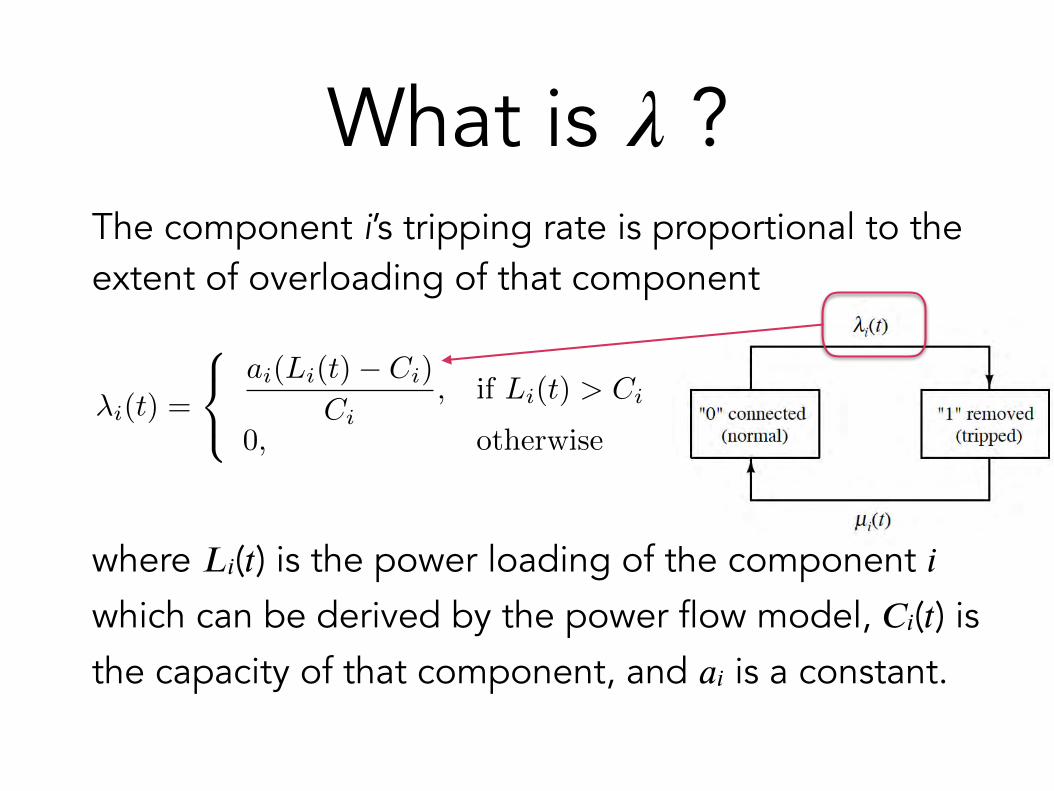
What is 𝜆 ? The component i’s tripping rate is proportional to the extent of overloading of that component
where 𝐿𝑖(𝑡) is the power loading of the component 𝑖 which can be derived by the power flow model, 𝐶𝑖(𝑡) is the capacity of that component, and 𝑎𝑖 is a constant.
�i(t) =
8<
:
ai(Li(t)� Ci)
Ci, if Li(t) > Ci
0, otherwise
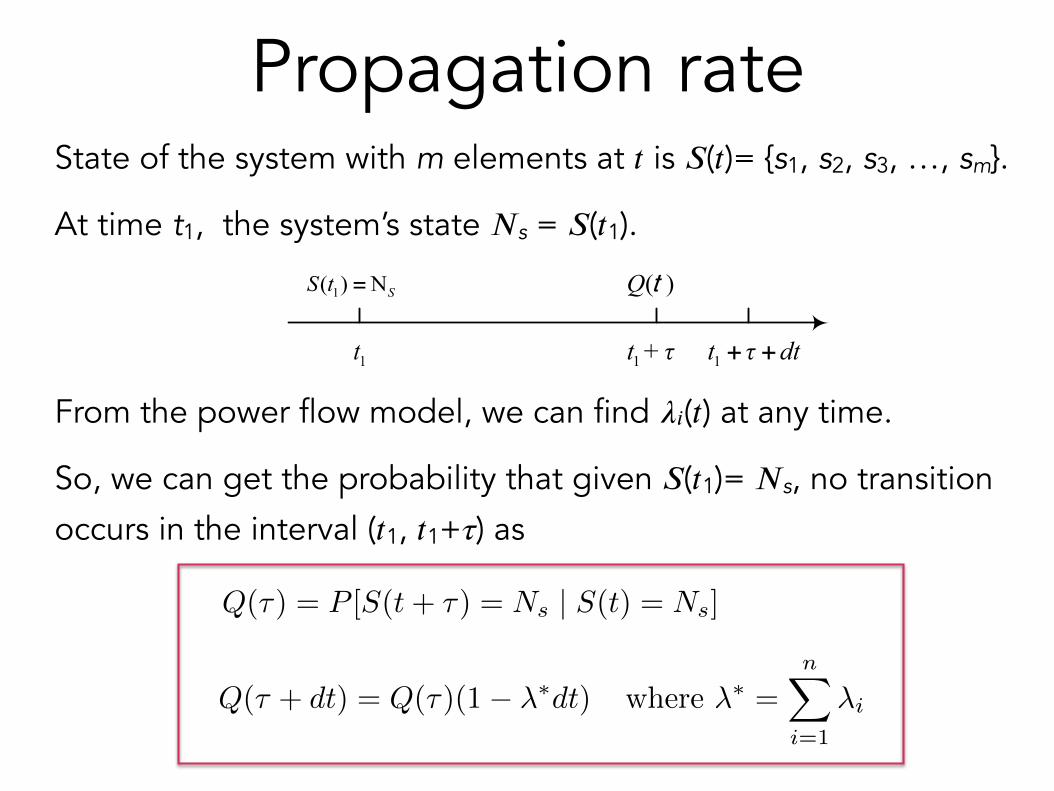
State of the system with m elements at 𝑡 is 𝑆(𝑡)= {s1, s2, s3, …, sm}.
At time t1, the system’s state 𝑁s = 𝑆(𝑡1).
From the power flow model, we can find 𝜆𝑖(𝑡) at any time.
So, we can get the probability that given 𝑆(𝑡1)= 𝑁s, no transition occurs in the interval (𝑡1, 𝑡1+𝜏) as
Propagation rate
( )Q t
1t 1t + τ
1( ) NSS t =
1t τ dt+ +
Q(⌧) = P [S(t+ ⌧) = Ns | S(t) = Ns]
Q(⌧ + dt) = Q(⌧)(1� �⇤dt) where �⇤ =nX
i=1
�i
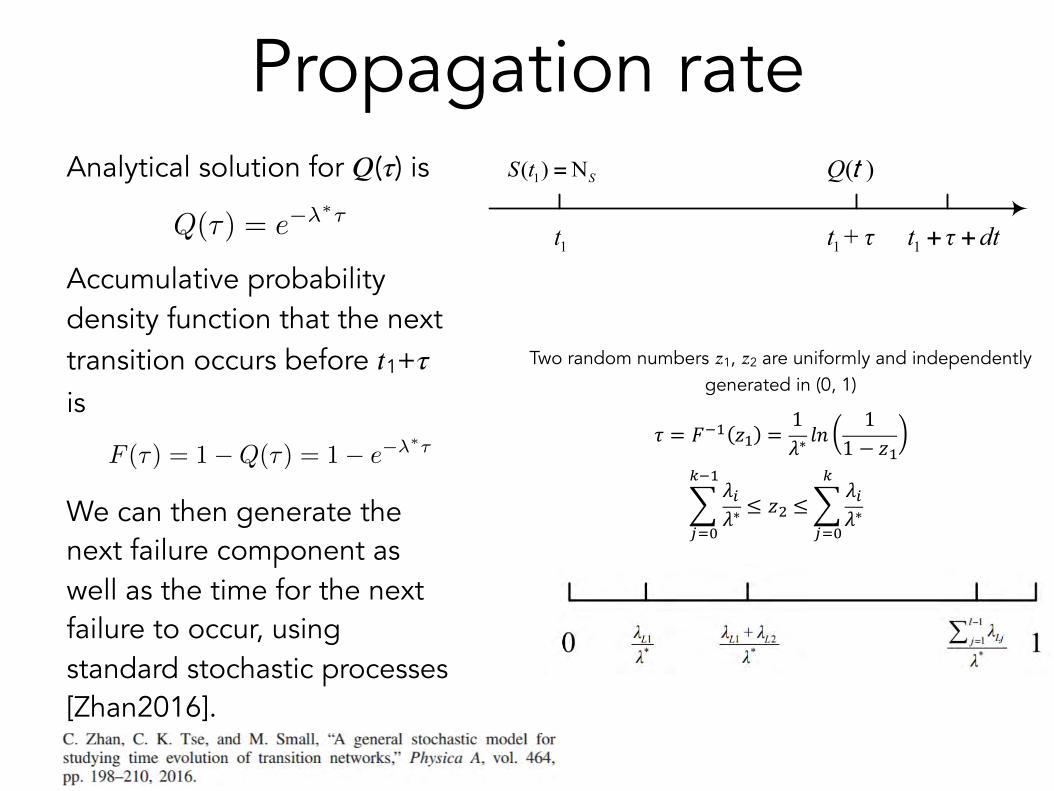
Propagation rateAnalytical solution for 𝑄(𝜏) is
Accumulative probability density function that the next transition occurs before 𝑡1+𝜏 is
We can then generate the next failure component as well as the time for the next failure to occur, using standard stochastic processes [Zhan2016].
Q(⌧) = e��⇤⌧
F (⌧) = 1�Q(⌧) = 1� e��⇤⌧
( )Q t
1t 1t + τ
1( ) NSS t =
1t τ dt+ +
! = #$% &% = 1(∗ *+
11 − &%
!"#"∗ ≤ &' ≤! "#
"∗(
)*+
(,-
)*+
Two random numbers 𝑧1, 𝑧2 are uniformly and independently generated in (0, 1)
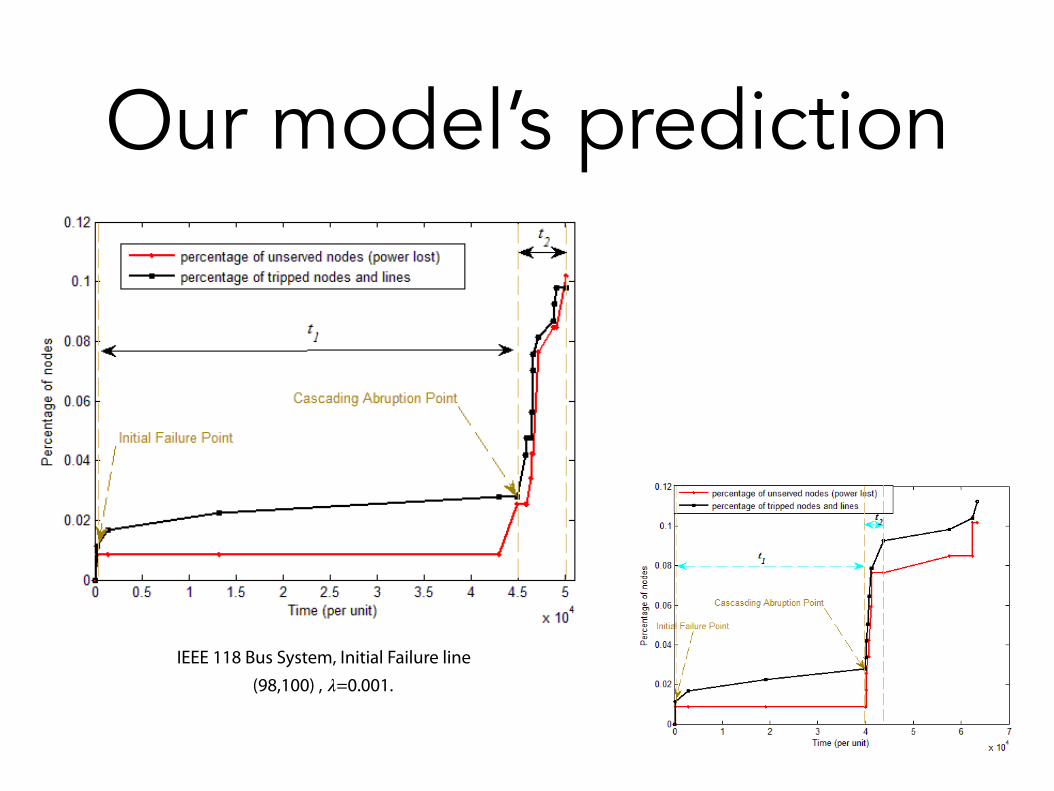
Our model’s prediction
IEEE 118 Bus System, Initial Failure line
(98,100) , 𝜆=0.001.
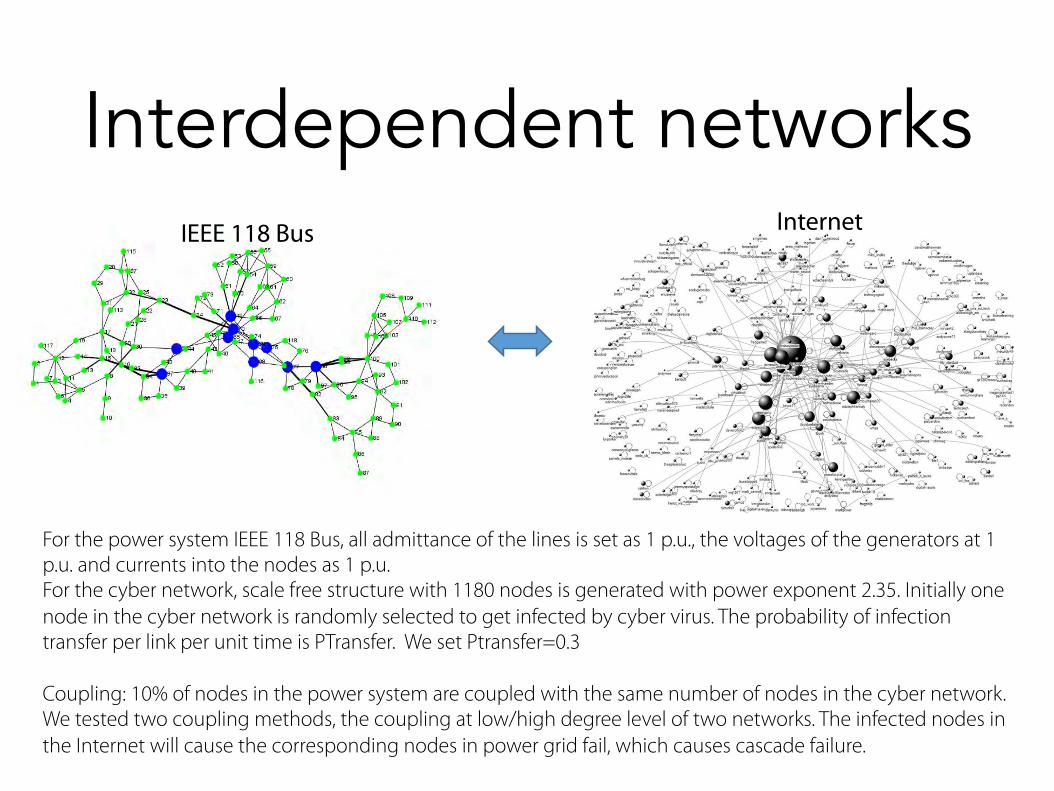
Interdependent networksIEEE 118 Bus Internet
For the power system IEEE 118 Bus, all admittance of the lines is set as 1 p.u., the voltages of the generators at 1 p.u. and currents into the nodes as 1 p.u. For the cyber network, scale free structure with 1180 nodes is generated with power exponent 2.35. Initially one node in the cyber network is randomly selected to get infected by cyber virus. The probability of infection transfer per link per unit time is PTransfer. We set Ptransfer=0.3
Coupling: 10% of nodes in the power system are coupled with the same number of nodes in the cyber network. We tested two coupling methods, the coupling at low/high degree level of two networks. The infected nodes in the Internet will cause the corresponding nodes in power grid fail, which causes cascade failure.
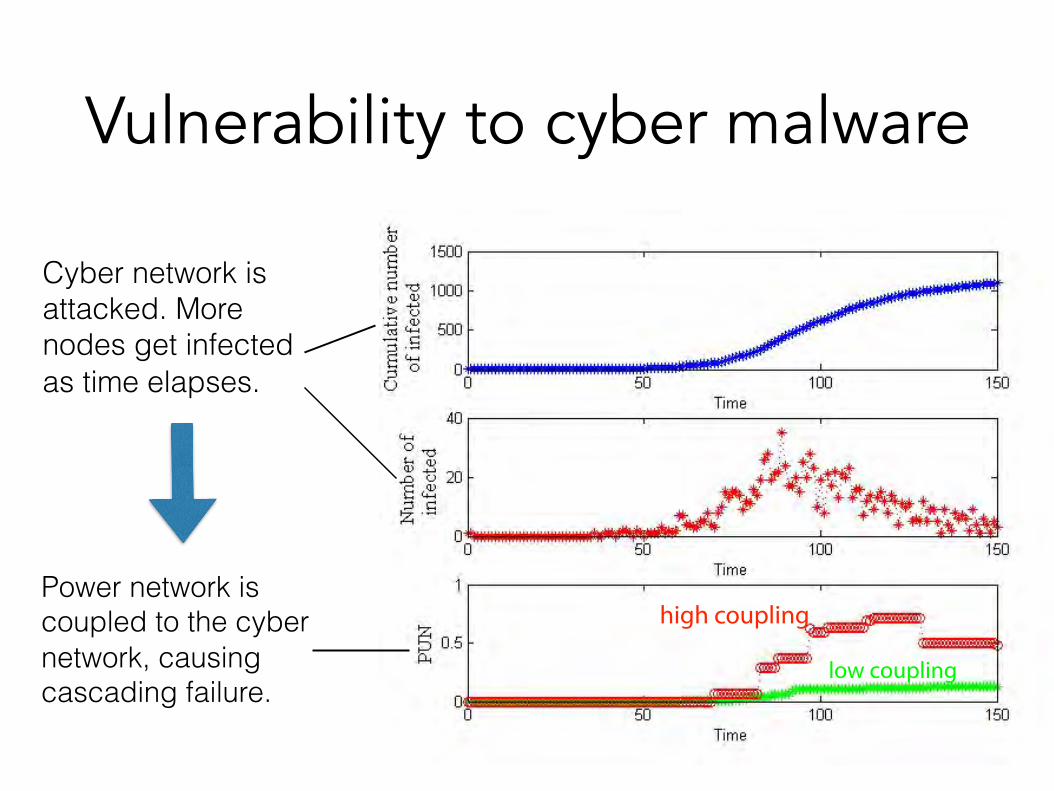
Vulnerability to cyber malware
Cyber network is attacked. More nodes get infected as time elapses.
Power network is coupled to the cyber network, causing cascading failure.
low coupling
high coupling
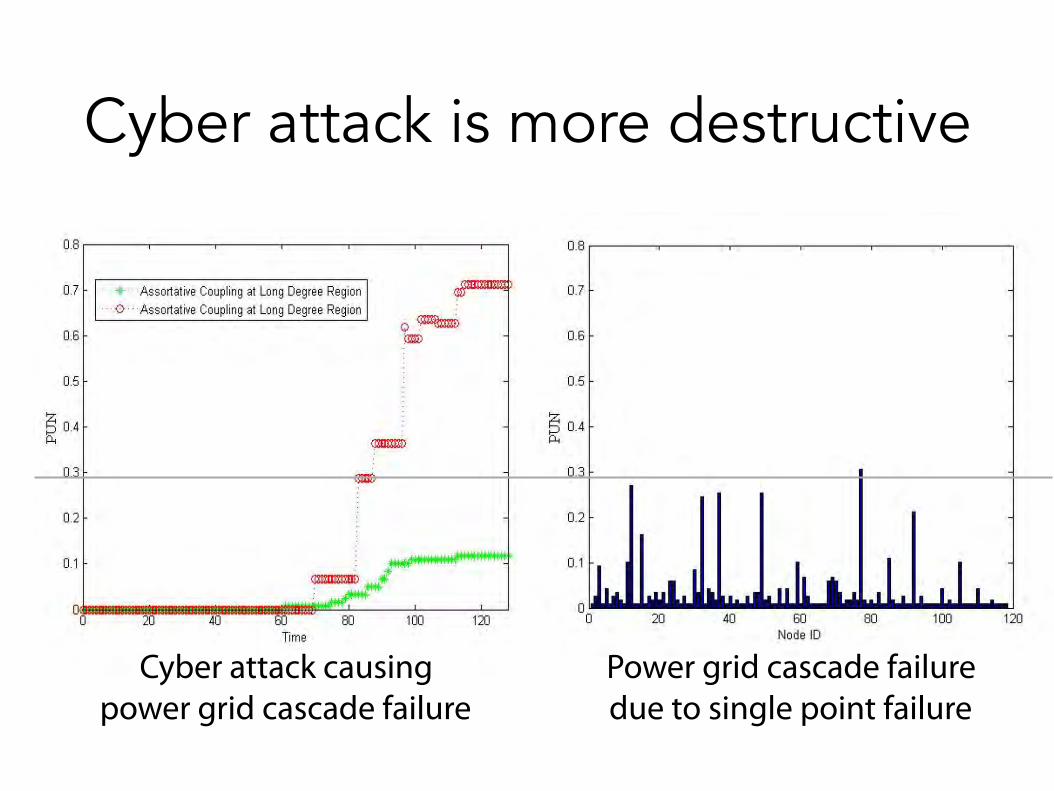
Cyber attack is more destructive
Cyber attack causing power grid cascade failure
Power grid cascade failure due to single point failure
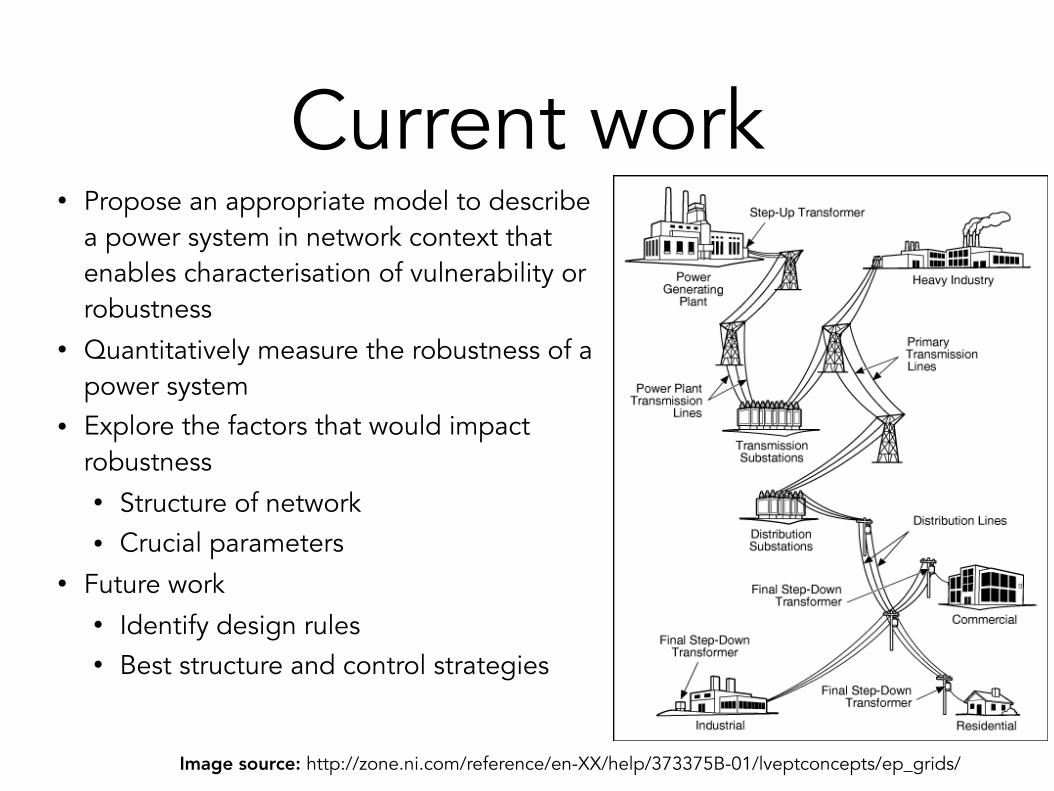
Current work• Propose an appropriate model to describe
a power system in network context that enables characterisation of vulnerability or robustness
• Quantitatively measure the robustness of a power system
• Explore the factors that would impact robustness • Structure of network • Crucial parameters
• Future work • Identify design rules • Best structure and control strategies
Image source: http://zone.ni.com/reference/en-XX/help/373375B-01/lveptconcepts/ep_grids/

Recent Publications X. Zhang and C.K. Tse, "Assessment of robustness of power systems from a network perspective," IEEE Journal of Emerging and Selected Topics in Circuits and Systems, vol. 5, no. 3, pp. 456-464, September 2015.
X. Zhang, C. Zhan and C. K. Tse, "Modeling the dynamics of cascading failures in power systems," IEEE Journal on Emerging and Selected Topics in Circuits and Systems, vol. 6, no. 2, pp. 192-204, June 2017.
X. Zhang, D. Liu, C. Zhan and C. K. Tse, "Effects of cyber coupling on cascading failures in power systems," IEEE Journal on Emerging and Selected Topics in Circuits and Systems, vol. 6, no. 2, pp. 228-238, June 2017.
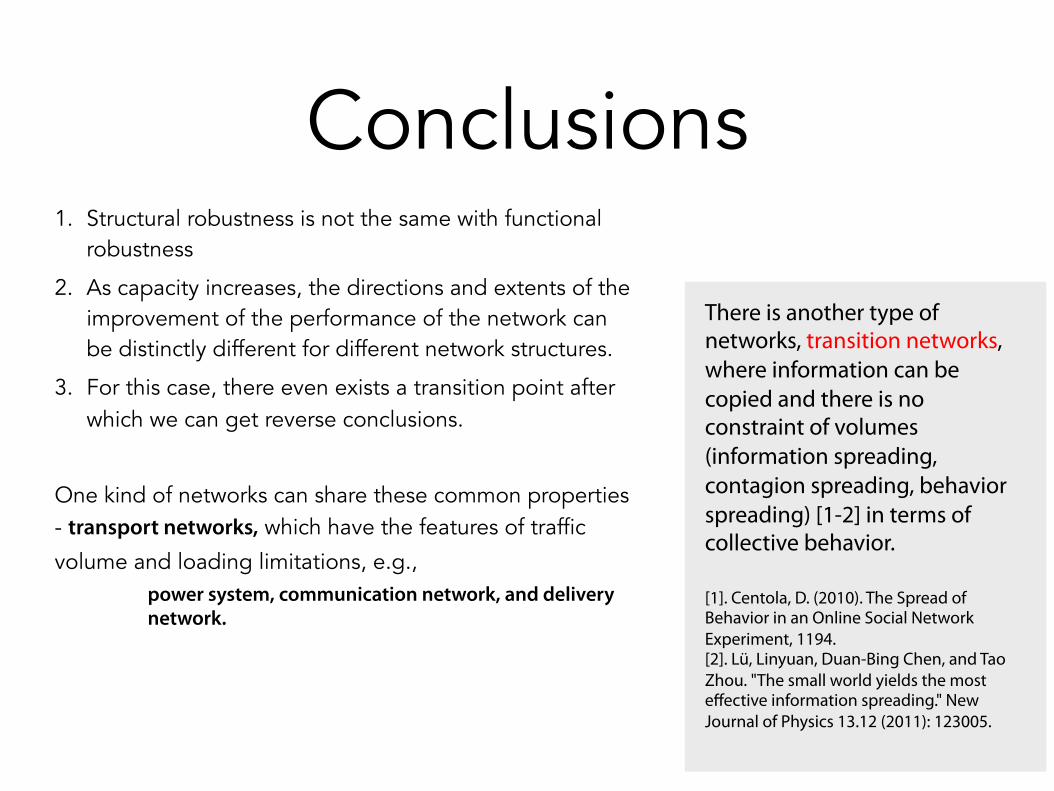
Conclusions1. Structural robustness is not the same with functional
robustness
2. As capacity increases, the directions and extents of the improvement of the performance of the network can be distinctly different for different network structures.
3. For this case, there even exists a transition point after which we can get reverse conclusions.
One kind of networks can share these common properties - transport networks, which have the features of traffic
volume and loading limitations, e.g., power system, communication network, and delivery network.
There is another type of networks, transition networks, where information can be copied and there is no constraint of volumes (information spreading, contagion spreading, behavior spreading) [1-2] in terms of collective behavior.
[1]. Centola, D. (2010). The Spread of Behavior in an Online Social Network Experiment, 1194. [2]. Lü, Linyuan, Duan-Bing Chen, and Tao Zhou. "The small world yields the most effective information spreading." New Journal of Physics 13.12 (2011): 123005.

Acknowledgements Mr Xi Zhang and Mr Dong Liu, PhD students
Dr Choujun Zhan, Postdoc Dr Jiajing Wu, Former PhD student