Embed Size (px)
Citation preview

Palaeontologia Electronica http://palaeo-electronica.org
MODELLING MIDDLE PLIOCENE WARM CLIMATES OF THE USA
Alan M. Haywood, Paul J. Valdes, Bruce W. Sellwood, Jed O. Kaplan, and Harry J. Dowsett
Alan M. Haywood. Postgraduate Research Institute for Sedimentology, The University of Reading, PO Box 227, Whiteknights, Reading, RG6 6AB,UK and Department of Meteorology, The University of Reading, Earley Gate, PO Box 243,Whiteknights, Reading, RG6 6BB,UKPaul J. Valdes. Department of Meteorology, The University of Reading, Earley Gate, PO Box 243,Whitek-nights, Reading, RG6 6BB,UKBruce W. Sellwood. Postgraduate Research Institute for Sedimentology, The University of Reading, PO Box 227, Whiteknights, Reading, RG6 6AB,UKJed O. Kaplan. Max-Planck-Institute for Biogeochemistry, Postfach 10 01 64, D-07701 Jena, GermanyHarry J. Dowsett. Eastern Earth Surface Processes, U.S. Geological Survey, 926A National Center, Reston, VA 20192, USA
ABSTRACT
The middle Pliocene warm period represents a unique time slice in which tomodel and understand climatic processes operating under a warm climatic regime.Palaeoclimatic model simulations, focussed on the United States of America (USA), forthe middle Pliocene (ca 3 Ma) were generated using the USGS PRISM2 2° x 2° dataset of boundary conditions and the UK Meteorological Office’s HadAM3 general circu-lation model (GCM).
Model results suggest that conditions in the USA during the middle Pliocene canbe characterised as annually warmer (by 2° to 4° C), less seasonal, wetter (by a maxi-mum of 4 to 8 mm/day) and with an absence of freezing winters over the central andsouthern Great Plains. A sensitivity experiment suggests that the main forcing mecha-nisms for surface temperature changes in near coastal areas are the imposed Pliocenesea surface temperatures (SST’s). In interior regions, reduced Northern Hemisphereterrestrial ice, combined with less snow cover and a reduction in the elevation of thewestern cordillera of North America, generate atmospheric circulation changes andpositive albedo feedbacks that raise surface temperatures. A complex set of climaticfeedback mechanisms cause an enhancement of the hydrological cycle magnifying themoisture bearing westerly wind belt during the winter season (Dec., Jan., Feb.). Predic-tions produced by the model are in broad agreement with available geological evi-dence. However, the GCM appears to underestimate precipitation levels in the interiorand central regions of the southern USA.
KEY WORDS: Middle Pliocene, GCM, USA, evaluation.
Copyright: Palaeontological Association, 22 June 2001Submission: 28 February 2001 Acceptance: 15 May 2001
Haywood, Alan M., Valdes, Paul J., Sellwood, Bruce W., Kaplan, Jed O., and Harry J. Dowsett, 2001. Modelling Middle Pliocene Warm Climates of the USA. Palaeontologia Electronica, vol. 4, issue 1, art. 5: 21pp., 933KB. http://palaeo-electronica.org/2001_1/climate/issue1_01.htm.

ALAN M. HAYWOOD, PAUL J. VALDES, BRUCE W. SELLWOOD, JED O. KAPLAN, AND HARRY J. DOWSETT: MODELLING MIDDLE PLIOCENE WARM CLIMATES OF THE USA
INTRODUCTION
The middle Pliocene has beendescribed as the last period of geologicaltime that displayed greater sustainedwarmth and reduced climatic variabilityover a time period greater than any Qua-ternary interglacial (Dowsett and Poore1991; Dowsett et al. 1996). Geologicalproxy evidence supporting this assertionincludes sea surface temperatures (SST)reconstructed from planktonic foramin-ifera (Dowsett and Poore 1991; Dowsett etal. 1992; Dowsett et al. 1996; Raymo1994), ostracods (Cronin 1991; Forester1991), siliceous microfossil records (Mor-ley and Dworestzky, 1991; Barron 1992,1996), terrestrial vegetation records(Thompson 1991; Heusser and Morley1996; Thompson and Fleming 1996) andnumerous records of higher-than-presentsea levels (Dowsett and Cronin 1990;Brigham-Grette 1994; Zubakov andBorzenkova 1990). As a result, the middlePliocene represents a unique time periodin which to examine the behaviour of theEarth’s climate system under a regime ofgreater-than-present warmth.
A relatively precise stratigraphy, widegeographical distribution of sample sites,and numerous extant climatic boundaryconditions all combine to make the middlePliocene an ideal time period for palaeocli-matic modelling studies using general cir-culation models (GCM; Dowsett et al.1999). With anthropogenic greenhousegas emissions forcing greater warmth(IPCC 1995), significant potential benefitexists in the careful investigation of pastwarm periods in Earth’s history, such asthe middle Pliocene. Furthermore, palaeo-climatic modelling investigations of thisinterval provide us with an opportunity toassess the validity and robustness of pre-dictions produced by GCM that are beingused to model past, present, and future cli-mates alike (Chandler et al. 1994; Sloan et
al. 1996; Haywood et al. 1999, 2000a,2000b).
This paper describes the results of anew palaeoclimatic modelling study,focused on the USA, for the middlePliocene using a state-of-the-art GCM.Previous GCM studies of the middlePliocene have been carried out by Chan-dler et al. (1994), Sloan et al. (1996), andHaywood et al. (1999, 2000a, 2000b).However, this is the first to examine, indetail, the nature and dynamics of thepalaeoclimate and the validity of modelpredictions on a regional scale.
The geological record of the USA dur-ing the middle Pliocene is diverse and wellsuited for the regional assessment ofGCM predictions (Figure 1). A wealth ofgeological data are available, derived fromtectonic basins that contain long sedimen-tary records of palaeoenvironmentalchange. In addition, numerous localitiesdisplay evidence for Pliocene lacustrine,fluvial, and shallow marine environments(Thompson 1991; Thompson and Fleming1996).
MODEL DESCRIPTION
The HadCM3 GCM
The HadCM3 GCM used in this studywas developed at the Hadley Centre forClimate Prediction and Research, which isa part of the UK Meteorological Office.This GCM consists of a linked atmo-spheric model, ocean model,and sea icemodel. However, for the present study weuse only the atmospheric component ofthe model (HadAM3).
The horizontal resolution of the modelis 2.50 degrees of latitude by 3.75 degreesof longitude. This gives a grid spacing inthe mid-latitudes of 278 km in the North-South direction and 417 km East-West,comparable to a T42 spectral resolutionmodel. The HadAM3 atmospheric modelconsists of 19 layers.
2

ALAN M. HAYWOOD, PAUL J. VALDES, BRUCE W. SELLWOOD, JED O. KAPLAN, AND HARRY J. DOWSETT: MODELLING MIDDLE PLIOCENE WARM CLIMATES OF THE USA
Pope et al. (2000) describes theimpact of the new physical parametriza-tions used in the HadAM3. The land-seamask and orographic details used do notdiffer from HadAM2 (Johns et al. 1997;Johns 1996). The model has a timestep of30 minutes and a new radiation schemethat can represent the effects of minortrace gases (Edwards and Slingo 1996).Parametrizations of simple backgroundaerosol climatology discussed by Cusacket al. (1998) are also included. The modelconvection scheme has also beenimproved according to Gregory et al.(1997). A new land-surface schemeincludes the representation of the freezingand melting of soil moisture. The repre-sentation of evaporation now includes thedependence of stomatal resistance ontemperature, vapour pressure, and CO2concentration (Cox et al. 1999). Theabove changes have increased the abilityof the HadAM3 model to perform a realis-tic simulation of surface heat flux.
Boundary Conditions
For this modelling study the requiredboundary conditions for the HadAM3model were supplied by the United StatesGeological Survey’s (USGS) PlioceneResearch Interpretations and SynopticMapping (PRISM) Groups, PRISM2enhanced 2° x 2° digital data set, or theywere specified as current values. Carbondioxide was set at 315 ppm, a value in linewith previous modelling studies for themiddle Pliocene (i.e., Chandler et al.1994). In practice, using prescribed SSTmeans that the model is relatively insensi-tive to the precise choice of CO2 concen-tration. Prescribed boundary conditionsintegrated into the model that are specificto the middle Pliocene include: (1) conti-nental configuration, modified by a 25 mincrease in global sea level, (2) modifiedpresent-day elevations (elevation of thewestern cordillera of North Americareduced by 50 per cent; 950 m), (3)reduced ice sheet size and height for
Figure 1. Summary of middle Pliocene palaeoclimatic/palaeoenvironmental evidence derived from the geologicalrecord of the United States.
3

ALAN M. HAYWOOD, PAUL J. VALDES, BRUCE W. SELLWOOD, JED O. KAPLAN, AND HARRY J. DOWSETT: MODELLING MIDDLE PLIOCENE WARM CLIMATES OF THE USA
Greenland (50%) and Antarctica (33%),(4) Pliocene vegetation distributions, and(5) Pliocene SST and sea ice distributions(see Haywood et al. 2000a and Dowsett etal. 1999 for more detailed descriptions ofPRISM2 boundary conditions and theirintegration into the UKMO GCM).
The PRISM2 data set is the latest in aline of data sets generated by the USGSthat reconstruct the palaeoenvironment ofthe middle Pliocene. The PRISM2 recon-struction consists of a series of 28 globalscale data sets on a 2° latitude by 2° longi-tude grid, and as such, represents themost complete and detailed global recon-struction of climate and environmentalconditions older than the last glacial (Dow-sett et al. 1999). PRISM2 evolved fromnumerous studies that summarised condi-tions at a large number of marine and ter-restrial localities (e.g., Cronin and Dowsett1990; Poore and Sloan 1996). A detaileddescription of the new PRISM2 data set,that fully documents the construction ofPRISM2 and how it differs from earlierPRISM data sets, is now available as aUSGS Open File Report (see Dowsett etal. 1999).
MODEL EXPERIMENTS
Model Experiments, Integration, and Statistical Testing
Two modelling experiments aredescribed in this article. The first (middlePliocene control experiment) uses the fullset of PRISM2 boundary conditions toinvestigate the nature of the middlePliocene palaeoclimate and its relative dif-ference to the present-day climate of theUSA. The second experiment (Pliocenesensitivity experiment) utilises globalPRISM2 Pliocene SST estimates, sealevel and vegetation distributions whilesetting terrestrial ice cover and orographicparameters to modern conditions. Specifi-cally, this increases ice volume over
Greenland and Antarctica by 50 percentand 33 percent respectively, and raisesthe elevation of the western cordillera ofNorth America by 50 percent. The aim ofthis approach is to investigate the relativeimportance of certain climatic boundaryconditions in producing the climatechanges predicted by the HadAM3 modelfor the middle Pliocene over the USA.
For both experiments the HadAM3,GCM was integrated for 12 years and cli-matological means were compiled for thefinal 10 years only. Time-series analysis ofall climate variables for the whole of the12-year simulation show that disregardingthe first two years of simulation is sufficientfor the model climatology to reach adynamic equilibrium. Furthermore, theslowest component to reach equilibrium issoil moisture. An examination of globalmean soil moisture showed no significanttrend in the upper layers after two years.However, there was a small residual trendin the deepest layer that lasted for approx-imately five years. Overall, the length ofthe model run is comparable to previousmodelling studies for the middle Pliocene(e.g., Sloan et al. 1996). In the results, sta-tistical tests of the Pliocene control-runmodel predictions are based on the Stu-dent t-test described by Chervin andSchneider (1976). Although this statisticaltest has many limitations (see Wigley andSanter 1990), it is commonly used and is asimple test. Moreover, the changes in cli-mate between the middle Pliocene andpresent-day are generally large and soclearly exceed the statistical test.
BIOME 4
An important feature of our simula-tions with the HadAM3 model is that weuse a Biome model (BIOME 4) to translateclimate model output from the Pliocenecontrol experiment, (specifically the sea-sonal cycle of temperature, precipitation,
4

ALAN M. HAYWOOD, PAUL J. VALDES, BRUCE W. SELLWOOD, JED O. KAPLAN, AND HARRY J. DOWSETT: MODELLING MIDDLE PLIOCENE WARM CLIMATES OF THE USA
and solar radiation) into biome distribu-tions. Such an approach has two specificadvantages. The first is that it condensesmultivariate climate data into a small num-ber of biomes producing an effective andinformative summary of the middlePliocene simulations produced by theHadAM3 model. Secondly, it greatlyimproves our ability to compare model-simulated climate with estimations ofpalaeoclimate derived from fossil pollen. Inthis study we use the BIOME 4 model,which is the latest in a series of mechanis-tically based models that were developedfrom physiological considerations thatplace constraints on the growth andregeneration of different plant functionaltypes. These constraints were calculatedvia the use of limiting factors for plantgrowth. These factors include the meantemperature of the coldest and warmestmonths, the number of growing degreedays (GDD) above 0° and 5°C, and via thecalculation of a coefficient (Priestley – Tay-lor coefficient) for the extent to which soilmoisture supply satisfies atmosphericmoisture demand. GDD are calculated bylinear interpolation between mid-monthsand by a one-layer soil moisture balancemodel (Prentice et al. 1993) independentof the HadAM3 model hydrology.
The BIOME 4 model is representativeof a gradual evolution of biome models(see Prentice et al. 1992; Prentice et al.1993; Prentice et al. 1998) and differs fromearlier BIOME models by the addition ofadditional plant functional types for tundraclimates and by factoring in the impor-tance that differing atmospheric CO2 con-centrations have on plant growth (Kaplan2001). To minimise any model bias,theBIOME 4 model, like its parent models,has been validated and calibrated to vege-tation distribution, productivity and otherbiogeochemical data for the present-dayand the recent past. Known biases in theBIOME 4 model relate to the precise loca-
tion of the forest-grassland boundary intemperate and subtropical latitudes(Kaplan 2001).
As an equilibrium vegetation model,BIOME 4 is an ideal tool for assessingvegetation distribution at a particular timein the past. However, plant assemblagesheavily influenced by short-term dynamicprocesses (e.g., fire, recurrent extremeweather events) may be incorrectly simu-lated in model. In this application, we haverun BIOME 4 using a 2.5° by 3.75° gridcorresponding to the same resolution asthe HadAM3 GCM. Absolute values formonthly mean surface temperature, pre-cipitation, and cloud cover derived fromthe ten-year climatological means from theHadAM3 Pliocene control run were usedto provide the climatic information neces-sary for the BIOME 4 model.
MODEL RESULTS - PLIOCENE CONTROL
Surface Temperature Difference
The HadAM3 model predicts a distinctwarm anomaly over the USA during themiddle Pliocene (Figure 2). This anomalyis visible over the annual cycle and duringwinter (DJF) and summer (JJA) intervals.The geographical distribution of the warm-ing is remarkably continuous. Annualmean temperature (∆T) changes show anaverage increase of 2° to 5°C. Surfacetemperature increases are highest duringthe DJF period with DT values of + 5° to10°C common over most interior regionsof the USA. Temperature variations ofabove 20°C during DJF are also predictedfor the Hudson Bay region of NE NorthAmerica. Surface temperature changesduring JJA reveal a less consistent patternof change. Overall, a warming of 2° to 5°Cis predicted over many areas of the USA.However, larger DT variations of 5° to10°C are restricted to the Great Plainsregion. Predicted sporadic cooling overisolated areas of the USA during the mid-
5

ALAN M. HAYWOOD, PAUL J. VALDES, BRUCE W. SELLWOOD, JED O. KAPLAN, AND HARRY J. DOWSETT: MODELLING MIDDLE PLIOCENE WARM CLIMATES OF THE USA
dle Pliocene is caused by differences inthe assigned position of the coast speci-fied in the PRISM2 data set.Temperature Forcing and Feedbacks
Lower terrestrial ice cover in theNorthern Hemisphere and higher SST inthe North Atlantic-North Pacific provide theinitial forcing mechanism behind the pre-dicted surface temperature increases overthe USA at 3 Ma B.P. However, reductionsin albedo, particularly during DJF gener-ated by reduced snow cover and alteredPliocene vegetation distributions, would
have caused an increase in the absorptionof solar radiation promoting further warm-ing. The snow depth decrease occurs overthe USA despite a general increase in win-tertime precipitation. An increased propor-tion of precipitation during the warmermiddle Pliocene simulation falls as rainand not as snow. Comparison of absolutetemperature patterns for present-day andthe middle Pliocene over the annual cycle,DJF and JJA, reveal interesting differ-ences (Figure 3). During the middlePliocene, the freezing line over the annualperiod and DJF is positioned further to the
Figure 2. HadAM3 model prediction: difference in surface temperature (°C) during the middle Pliocene over North Amer-ica for both the winter (DJF) and summer (JJA) seasons.
6

ALAN M. HAYWOOD, PAUL J. VALDES, BRUCE W. SELLWOOD, JED O. KAPLAN, AND HARRY J. DOWSETT: MODELLING MIDDLE PLIOCENE WARM CLIMATES OF THE USA
north of the present-day position (~10°N).Furthermore, the pattern of decreasingtemperatures with increasing latitude dur-ing the middle Pliocene is less spatiallyvariable than for present-day. This is afunction of the prescribed reduction in ele-vation (by 50%) of the western cordillera ofNorth America within the PRISM2 bound-ary conditions. Variations in Precipitation and Evaporation Rates
A clear signal of changing precipita-tion rates over the USA during the middlePliocene is predicted by the HadAM3model (Figure 4). Two zones of changeare evident. Over the annual cycle andduring winter (DJF), northern parts of theUSA experience more rainfall (+ 4.00 to8.00 mm/day). This increase in precipita-tion occurs as a broad belt across NorthAmerica between 40° to 60°N. Thisincrease of precipitation is consistent withan enhancement of the moisture bearing
westerly winds over the USA during themiddle Pliocene. In the southern and cen-tral areas of the USA, particularly duringJJA, total precipitation rates decrease byan average 2.00 mm/day.
Changes in the pattern and amount ofevaporation and humidity over the USAare mainly a reflection of the altered pre-cipitation distribution and warmer surfacetemperatures. Areas experiencingenhanced precipitation via moisture bear-ing westerly winds in the northern USAhave elevated evaporation rates by asmuch as 0.50 to 1.00 mm/day. Thisreflects the greater moisture availability forevaporation and the warmer surface tem-peratures. Conversely, central and south-ern parts of the USA have lowerevaporation rates relative to present-day(by a maximum of 4.00 mm/day duringJJA) due to a decreased availability ofmoisture. Humidity values also show acorresponding decrease by as much as 30percent in this area during JJA.
Figure 3. HadAM3 model prediction: present-day and middle Pliocene absolute surface temperatures (°C) over NorthAmerica for the annual period, winter (DJF), and summer (JJA) seasons.
7

ALAN M. HAYWOOD, PAUL J. VALDES, BRUCE W. SELLWOOD, JED O. KAPLAN, AND HARRY J. DOWSETT: MODELLING MIDDLE PLIOCENE WARM CLIMATES OF THE USA
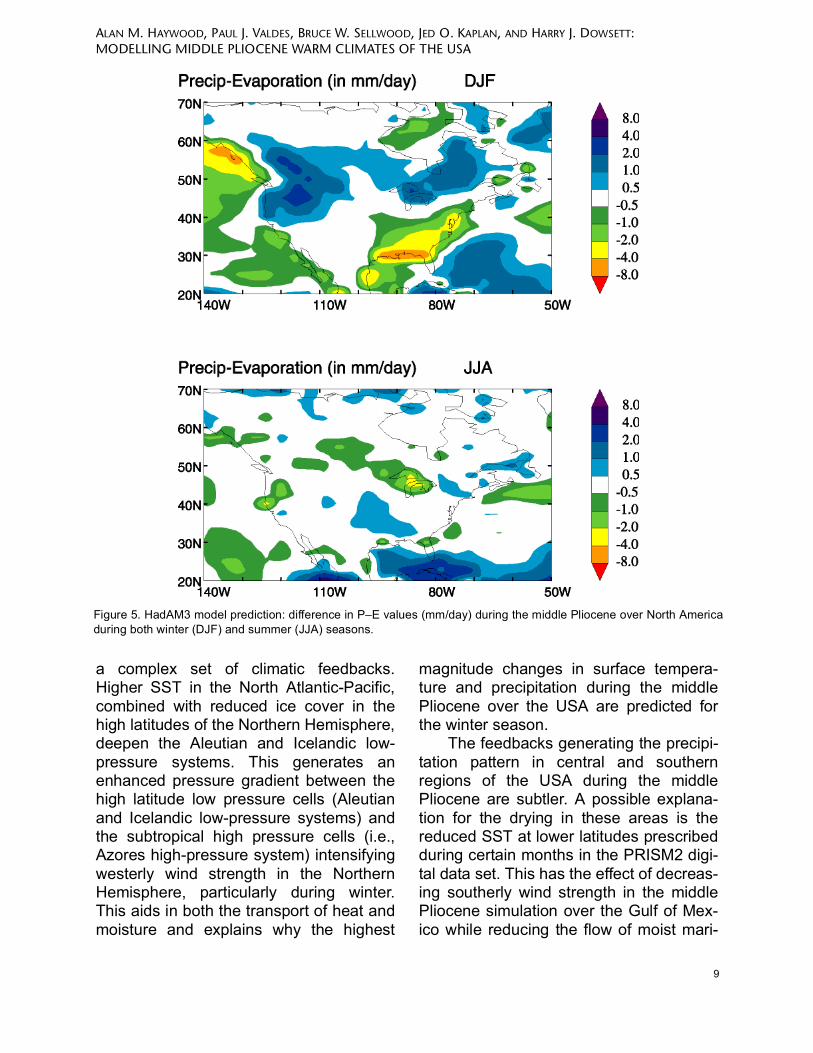
Precipitation minus evaporation (P-E)changes over the USA, for the Pliocenecontrol simulation, indicates small anoma-lies compared to present-day model simu-lations during JJA. However, significantanomalies are observed for the winter(DJF) season (Figure 5). The model sug-gests that for the northern USA, during themiddle Pliocene, a substantially greater(0.00 to 4.00 mm/day) precipitation fluxexisted compared to present-day. In con-trast, the southeast of the USA during DJFhas a greater evaporative flux (0.50 to8.00 mm/day) compared to model simula-tions for the present, which extends further
south into the Gulf of Mexico. These P-Eanomalies are a product of the predictedPliocene precipitation changes over theUSA during DJF (see Figure 5).Precipitation Forcing and Feedbacks
The primary forcing mechanism, pro-ducing the altered precipitation patternover the USA during the middle Pliocene,is a strong increase in westerly windstrength (Figure 6). These enhanced west-erly winds aid the transport of moisturethat falls mostly as rain because of thehigher annual surface temperatures. Thewesterly wind increase is brought about by
Figure 4. HadAM3 model prediction: difference in the total precipitation rate (mm/day) during the middle Pliocene overNorth America for both winter (DJF) and summer (JJA) seasons.
8
ALAN M. HAYWOOD, PAUL J. VALDES, BRUCE W. SELLWOOD, JED O. KAPLAN, AND HARRY J. DOWSETT: MODELLING MIDDLE PLIOCENE WARM CLIMATES OF THE USA
a complex set of climatic feedbacks.Higher SST in the North Atlantic-Pacific,combined with reduced ice cover in thehigh latitudes of the Northern Hemisphere,deepen the Aleutian and Icelandic low-pressure systems. This generates anenhanced pressure gradient between thehigh latitude low pressure cells (Aleutianand Icelandic low-pressure systems) andthe subtropical high pressure cells (i.e.,Azores high-pressure system) intensifyingwesterly wind strength in the NorthernHemisphere, particularly during winter.This aids in both the transport of heat andmoisture and explains why the highest
magnitude changes in surface tempera-ture and precipitation during the middlePliocene over the USA are predicted forthe winter season.
The feedbacks generating the precipi-tation pattern in central and southernregions of the USA during the middlePliocene are subtler. A possible explana-tion for the drying in these areas is thereduced SST at lower latitudes prescribedduring certain months in the PRISM2 digi-tal data set. This has the effect of decreas-ing southerly wind strength in the middlePliocene simulation over the Gulf of Mex-ico while reducing the flow of moist mari-
Figure 5. HadAM3 model prediction: difference in P–E values (mm/day) during the middle Pliocene over North Americaduring both winter (DJF) and summer (JJA) seasons.
9

ALAN M. HAYWOOD, PAUL J. VALDES, BRUCE W. SELLWOOD, JED O. KAPLAN, AND HARRY J. DOWSETT: MODELLING MIDDLE PLIOCENE WARM CLIMATES OF THE USA
time air into the continental interior of theUSA, particularly during JJA.
The reduced height of the westerncordillera of North America by 50% in themiddle Pliocene simulation should havethe effect of reducing the rain shadoweffect to interior parts of the USA. Intu-itively, this should also increase precipita-tion in this area. Discrimination of theeffects of such a change from other fac-tors, such as increased SST that alsoincrease precipitation in the region, will beaddressed in the following section.
PLIOCENE SENSITIVITY EXPERIMENT
Surface Temperature Difference and Forcing
In response to the altered boundaryconditions imposed in the Pliocene sensi-tivity experiment, the HadAM3 model pre-dicts reduced surface temperaturescompared to the Pliocene control overwide regions of the USA during both winterand summer seasons (Figure 7). Themagnitude of this cooling varies spatiallywith severest cooling (>5°C) concentratedover the western United States, associ-ated with the western cordillera. However,
Figure 6. HadAM3 model prediction: difference in surface wind strength (m/s-1) and vector mean winds during the mid-dle Pliocene over North America for the winter (DJF) season.
10

ALAN M. HAYWOOD, PAUL J. VALDES, BRUCE W. SELLWOOD, JED O. KAPLAN, AND HARRY J. DOWSETT: MODELLING MIDDLE PLIOCENE WARM CLIMATES OF THE USA
areas in close proximity to the coast, pen-insulas (e.g., Florida) and bays (e.g., Hud-son Bay) do not exhibit a cooling trend.This is due to the warmer SST imposedfrom the PRISM2 data set. This modelsuggests that in these regions the simu-lated warming observed from the Pliocene– present-day control experiment aresolely attributable to the warmer PlioceneSST. Conversely, the increase in NorthernHemisphere terrestrial ice and snow covercombined with the regional specifiedincrease (~50%) in the elevation of theNorth American western cordillera prima-rily drove the cooler temperatures over
western and central parts of the USAobserved in the Pliocene sensitivity exper-iment. Therefore, the primary forcingmechanisms for the simulated warmerconditions in the Pliocene – present-daycontrol experiment are reduced NorthernHemisphere terrestrial ice and snow cover(via an ice albedo feedback) and the low-ered elevation of the western cordillera ofNorth America. Precipitation/Wind Strength Difference and Forcing
Overall, the HadAM3 model predic-tions for the Pliocene sensitivity experi-
Figure 7. HadAM3 model prediction: difference in surface temperature (°C) over North America between the Pliocenesensitivity experiment and the Pliocene control simulation for both winter (DJF) and summer (JJA) seasons.
11

ALAN M. HAYWOOD, PAUL J. VALDES, BRUCE W. SELLWOOD, JED O. KAPLAN, AND HARRY J. DOWSETT: MODELLING MIDDLE PLIOCENE WARM CLIMATES OF THE USA
ment suggest a pattern of reducedprecipitation levels over the USA for thePliocene sensitivity experiment (Figure 8).The largest reductions are observed dur-ing the winter (DJF) season in a latitudinalrange corresponding to the westerly windbelt. This reduction in precipitation is gen-erated by a number of feedback mecha-nisms. Increased Northern Hemispheresnow and ice cover, combined with theincreased elevation of the western cordil-lera of North America, reduces surfacetemperatures, evaporation, and the mois-ture available for precipitation. Enhanced
terrestrial ice cover and lower surface tem-peratures, which occur generally in theNorthern Hemisphere, weaken the Icelan-dic low and Azores high-pressure sys-tems. This has the effect of weakening themoisture-bearing westerly wind belt in thePliocene sensitivity experiment (Figure 9).Therefore, increased precipitation levelssimulated for the Pliocene – present-daycontrol experiment for the region resultfrom reduced snow and ice cover in theNorthern Hemisphere and the reducedelevation of the western cordillera of NorthAmerica.
Figure 8. HadAM3 model prediction: difference in the total precipitation rate (mm/day) over North America between thePliocene sensitivity experiment and the Pliocene control simulation for both winter (DJF) and summer (JJA) seasons.
12

ALAN M. HAYWOOD, PAUL J. VALDES, BRUCE W. SELLWOOD, JED O. KAPLAN, AND HARRY J. DOWSETT: MODELLING MIDDLE PLIOCENE WARM CLIMATES OF THE USA
EVALUATION AND DISCUSSION OFMODEL RESULTS
Statistical Analyses of Pliocene Control Results
Statistical analyses of the model out-put for the middle Pliocene control run is anecessary step in trying to determine howmuch of the change in climatic variables
are truly due to the imposed Plioceneboundary conditions (PRISM2 data set), orinter-annual variability within the modelitself. In this study, a threshold of 95 per-cent is considered significant. This doesnot automatically imply that any simulatedchanges that do not achieve a 95 percentsignificance level are not true representa-tions of differences in the middle Pliocene
Figure 9. HadAM3 model prediction: difference in surface wind strength (m/s-1) and vector mean winds over NorthAmerica between the Pliocene sensitivity experiment and the Pliocene control simulation for the winter (DJF) sea-son.
13

ALAN M. HAYWOOD, PAUL J. VALDES, BRUCE W. SELLWOOD, JED O. KAPLAN, AND HARRY J. DOWSETT: MODELLING MIDDLE PLIOCENE WARM CLIMATES OF THE USA
climate. Rather, they could representeither true variations or inter-annual vari-ability. Statistical results for surface tem-perature changes (°C), total precipitation(mm/day) are summarised in Figure 10.
Statistical results for surface tempera-tures over North America as a whole sug-gest that much of the modelled differencesin middle Pliocene surface temperaturesfrom present-day are significant, espe-cially during DJF. The improved signifi-cance during DJF can be attributed to thehigher magnitude of surface temperaturechange predicted by the HadAM3 modelduring that season.
Statistical results for changes in totalprecipitation suggest that most of the pre-dicted changes are significant. During JJAthe geographical coverage of significantresults is diminished compared to DJF.The difference between seasons canagain be attributed to larger changes inprecipitation occurring during DJF.
The geographical distribution of signif-icant results for surface pressure (notshown in Figure 10) and wind strength
changes is widespread over North Amer-ica during DJF. This is, once again, areflection of the magnitude of change inthese variables during winter that aredriven by changes to the high latitude, lowand sub-tropical high-pressure cells.Comparison to Geological Record
Comparison of the simulated regionalclimatic features produced by the GCMwith Pliocene geological palaeoclimaticdata has been carried out in a semi-quan-titative fashion and is summarised asTable 1. Broadly, the comparison suggeststhat the climatic predictions generated bythe HadAM3 over the USA are robust andagree with the data. The geological evi-dence of surface temperature warming ofbetween 2° to 4°C and enhanced winter-warming over many areas of the USA (seeboxes 1, 2, 3, 6, 8, and 10 on Figure 1)closely approximates the simulations ofsurface temperature changes predicted bythe HadAM3 model. Furthermore, the sim-ulated retreat of the freezing line duringthe middle Pliocene accords well with the
Figure 10. Statistical significance test results for middle Pliocene model simulations of (a) surface temperature (°C)change and (b) total precipitation rate change (mm/day) over North America. Shaded areas show the geographicalcoverage of statistically significant results (tested to a 95% significance level).
14

ALAN M. HAYWOOD, PAUL J. VALDES, BRUCE W. SELLWOOD, JED O. KAPLAN, AND HARRY J. DOWSETT: MODELLING MIDDLE PLIOCENE WARM CLIMATES OF THE USA
fossil vertebrate record (Hibbard 1960;Auffenburg 1974; Graham 1986; Thomp-son 1991) of the USA, which suggests thatfreezing winters were absent on the cen-tral and southern Great Plains (Box 8: Fig-ure 1). A simulated northward regressionof the freezing line is not a unique featureproduced by the HadAM3 model. Sloan etal. (1996) detected the same northwardshift of the freezing line using the NCARGenesis GCM and the PRISM1 data set.
In contrast to surface temperature,geological evidence for middle Pliocenehydrological characteristics exhibit greatvariability within the USA itself, thus mak-ing the assessment of the GCM predic-tions substantially harder. Furthermore,the weakness of the statistical testingresults reduces our ability to evaluate themodel predictions. Nevertheless, geologi-cal evidence from northern offshore, cen-tral, and interior regions of the USA (boxes1, 2, 4, 8, and 10: Figure 1) includingpalaeolake levels and pollen support the
assertion of an enhanced hydrologicalcycle during the middle Pliocene (Thomp-son 1991; Forester 1991; Thompson andFleming 1996). Moreover, the geographi-cal location of sites supporting higher pre-cipitation levels in the northern USAcoincide with the model-predicted zone ofenhanced precipitation associated with themoisture bearing westerly wind belt. Thissuggests that the primary cause of theexistence of large stable lakes or higherlake levels in northern areas of the USAsuggested by the geological record (boxes1, 2, and 4, Figure 1) is related to thehigher winter precipitation level generatedby the enhancement of westerly winds.
Evidence from fossil pollen, verte-brates, and soil carbonates support a pat-tern of enhanced precipitation in thesouthern USA on the eastern side of thewestern Cordillera of North America aswell as further north (Box 10, Figure 1).This change in precipitation may haveresulted from a reduced rain-shadow
Table 1. Semi-quantitative comparison of middle Pliocene GCM outputs for areas 1 to 10 of the United States (see Fig-ure 1) compared to geological data for the same areas.
Area of U.S.(referring to
box numbers
from Fig. 1).
Annual model temp.
change from PD
(°C)
Statisticallysignificant
to(%)
Geological data
estimate(°C)
Quality ofcomparison
(G/M/P)
Annual model precip. change from PD
(mm/day)
Statistically significant
to(%)
Geological data
estimate (mm/day)
Quality of comparis
on(G/M/P)
Area 1 + 2 to 5 >99 + 2 - 4 G + 0.2 to 2 >99 Wetter M
Area 2 + 2 to 10 >99 Warmer M 0 to 2 >99 Wetter M
Area 3 + 2 to 10 >99 Warmer M 0 to 2 >99 Wetter M
Area 4 + 2 to 10 >99 Warmer M 0 to 2 >99 Wetter M
Area 5 Comparison not possible
Area 6 + 2 to 5 >99 Warmer M -1 to 0 >95 N/A -
Area 7 Comparison not possible
Area 8 + 2 to 10 >99 Warmer M - 2 to 0 >99 + 150 mm/yr.
P
Area 9 Comparison not possible
Area 10 + 2 - 10 >99 Warmer M - 2 to 0 <90 Wetter P
15

ALAN M. HAYWOOD, PAUL J. VALDES, BRUCE W. SELLWOOD, JED O. KAPLAN, AND HARRY J. DOWSETT: MODELLING MIDDLE PLIOCENE WARM CLIMATES OF THE USA
effect, produced by the lowered elevationof the mountain chain (Smith 1993;Thompson 1991; Thompson and Fleming1996). Specifically, increases in rainfallhave been suggested for Texas, Arizona,Nevada, and southern California. TheHadAM3 model’s simulations of the middlePliocene climate do not detect this trend ofwetter conditions reconstructed from geo-logical evidence.
There are numerous possible expla-nations for this data-model inconsistency.Firstly, the GCM may be incorrectly simu-lating the small scale effects on condensa-tion and precipitation rates resulting fromthe change of orography associated withlowering the western Cordillera within thePliocene control simulation as specified inthe PRISM2 boundary conditions. How-ever, this is unlikely as the model correctlysimulates precipitation increases in thenorthern parts of the USA. Therefore, thesimulated reduction in southerly winds thatreduces the transport of moisture intosouthern and central areas of the USA isthe most likely source of the data-modelinconsistency.
Present-day predictions of precipita-tion amounts over the same area by themodel show no dry anomalies when theoutputs are compared to observed climaticdata. Therefore, the reduced strength ofsoutherly winds and consequent moisturetransport in the southern and central areasof the USA must be linked to either anincorrect model response or deficienciesin PRISM2 boundary conditions. Any errorin PRISM2 SST in the low latitudes andGulf of Mexico region would lead to theGCM incorrectly representing changes inatmospheric circulation during the middlePliocene for the area in question.
Heating or cooling air over mountain-tops can produce strong density contrastsin the atmosphere compared with airmasses over adjacent regions. This mayresult in strong rising or sinking motions in
the atmosphere (Norris et al. 2000). Sum-mer heating over a large mountain rangeproduces a rising, low-density air mass,low atmospheric pressure over the moun-tains and thus strong winds blowingtowards the mountain front. In the North-ern Hemisphere, the winds blow counterclockwise around the range due to theCoriolis force. During winter, cooling of themountain surfaces produces dense fallingair masses that spread out away from themountain front. In this case, NorthernHemisphere winds blow in a clockwisedirection (Norris et al. 2000). The strengthof the winds around mountains dependsupon the breadth of the range and thestrength of cooling produced by radiationfrom the land surface. Thus, the pattern ofair movements around the western cordil-lera of North America will act to enhancethe movement of southerly winds into theinterior of the USA during JJA. However,PRISM2 specifies a 50 percent reductionin the elevation of this mountain chain.This will reduce the strength of counterclockwise air motion around the mountainsand potentially affect the strength of south-erly wind strength and hence precipitationover southern and central areas of theUSA. The data-model inconstancy maytherefore be a reflection of more sluggishcounter clockwise air motion around thewestern cordillera of North America. Fur-thermore, it may indicate that the elevationof this mountain chain has been reducedin the PRISM2 data set erroneously or bya magnitude that is too great.
Data-model comparison of precipita-tion characteristics over the Great Plainsregion of the USA identifies another cleardiscrepancy between the geologicalrecord (Box 8, Figure 1) and the predic-tions of the HadAM3 model. While themodel predictions mimic the geologicalrecord in terms of temperature changes inthis area, simulated precipitation changesare opposite to the more humid conditions
16

ALAN M. HAYWOOD, PAUL J. VALDES, BRUCE W. SELLWOOD, JED O. KAPLAN, AND HARRY J. DOWSETT: MODELLING MIDDLE PLIOCENE WARM CLIMATES OF THE USA
suggest by fossil vertebrates (Hibbard1960; Auffenburg 1974; Graham 1986;Thompson 1991). The model simulationsfor precipitation change are not statisticallysignificant over the Great Plains. However,with the uncertainties surrounding the sta-tistical technique, these results alone areinsufficient to ascribe the cause of the dis-crepancy to the model and not to our inter-pretation of the geological record. Firstly,the chronological control on the Pliocenevertebrate record of the USA is less robustthan for other areas. Furthermore, thepalaeoenvironmental interpretationderived from the Great Plains may be erro-neous. Specifically, the existence of giantland tortoises on the Great Plains duringthe Pliocene may not be a reflection ofenhanced temperatures and moisture lev-els. If the model predictions are robust,then this would suggest that temperatureand the absence of freezing winters aloneare the most significant driving forces inallowing the advancement northward ofgiant land tortoises in the USA. If not, thenthe most likely cause of the error relates tothe deficiencies discussed in the last para-graph, namely the model’s underestima-tion of the strength of southerly winds thattransport moisture inland from the Gulf ofMexico.
High resolution core records takenfrom the Glenns Ferry Formation in Idaho(Thompson 1996) and the Black Rock andPit of Death in Utah (Thompson et al.1995), all suggest that warmer and wetterconditions existed during the middlePliocene in the USA, and as such supportthe simulations provided by the HadAM3(boxes 2 and 4, Figure 1). However, withinthe overall trend, significant and frequentvariations in moisture and temperature aredetected via pollen and magnetic suscepti-bility changes within the respective cores.For the Glenns Ferry Formation, the peri-odicities of these variations do not appearto match any known Milankovitch astro-
nomical time frame (Thompson 1996).However, oscillations in the Milankovitch-band frequencies, specifically the 41 kyrobliquity cycle, have been detected for thePliocene from marine records (Tiede-mann et al. 1994) and also from terrestrialdiatom records at Tulelake in northern Cal-ifornia (Adam et al. 1990).
The palaeoclimate modelling resultspresented in this paper reflect a simplesnap shot for the middle Pliocene. Clearly,this approach is insufficient in the light ofgeological evidence suggesting climaticvariation within the middle Pliocene.Future modelling studies should aim toaddress the issue of climatic variabilitywithin the middle Pliocene by the use ofsensitivity experiments that alter orbitalparameters. Results from such modelexperiments can then be evaluatedagainst geological evidence to betterassess the predictions of the GCM. BIOME 4 Result
The biome map for the North Ameri-can continent during the middle Pliocene,generated by BIOME 4 and the climaticoutput of the HadAM3 model, can be com-pared to the PRISM2 distribution of vege-tation types over the region. The aim ofsuch an approach is to assess how wellthe simulated climate produced byHadAM3-BIOME 4 for the middle Pliocenemimics the boundary conditions imposedinto it. If the model predictions are robust,then the biome distributions that are pre-dicted by BIOME 4 should closely approxi-mate those in PRISM2 that were used aspart of the boundary conditions for theGCM.
Several difficulties are implicit withsuch an approach. The first centresaround the accuracy of the PRISM2boundary conditions imposed in themodel. If certain boundary conditionswithin the PRISM2 reconstruction are erro-neous or out of phase with one another
17

ALAN M. HAYWOOD, PAUL J. VALDES, BRUCE W. SELLWOOD, JED O. KAPLAN, AND HARRY J. DOWSETT: MODELLING MIDDLE PLIOCENE WARM CLIMATES OF THE USA
then the resulting climate and biome simu-lation will be wrong. Under these circum-stances it is very unlikely that the biomedistribution for North America produced byBIOME 4 will match that described inPRISM2.
Secondly, great care is required indetermining whether any observed dis-crepancies are related to the model, or dif-ferences in the biome classificationschemes used in BIOME 4 and PRISM2.PRISM2 uses a simplified seven-stageclassification of the Hansen et al. (1983)biome scheme. Grassland, steppe, andsavanna type vegetation are all incorpo-rated into one classification due to difficul-ties in distinguishing between them withpollen evidence (Thompson and Fleming1996). In contrast, BIOME 4 uses anadvanced classification of 23 differentbiomes. It is important to remember thatthe BIOME models, just like the HadAM3,
represent simplifications of reality andtherefore are open to potential sources oferror just as any other models (Williamsonet al. 1998).
At first sight, the HadAM3-BIOME 4models predicted only a few biomes inlocations generally similar to PRISM2biome distributions (Figure 11). However,most of this discrepancy is attributed to thediffering classification schemes betweenBIOME 4 and PRISM2. BIOME 4 doescorrectly capture the expansion of forestedareas north and the concurrent retreat ofbarren and tundra areas that is a key char-acteristic of the reconstructed middlePliocene vegetation distribution, comparedwith present-day (Thompson and Fleming1996; Dowsett et al. 1999). Comparison ofthe locations of biome boundariesbetween the BIOME 4 and PRISM2 is vir-tually impossible due to the different clas-sification schemes used in both biome
Figure 11. Map of 12 biomes as simulated by BIOME 4 from HadAM3 model’s seasonal cycle of temperature, precipi-tation, and cloud cover over North America for the middle Pliocene.
18

ALAN M. HAYWOOD, PAUL J. VALDES, BRUCE W. SELLWOOD, JED O. KAPLAN, AND HARRY J. DOWSETT: MODELLING MIDDLE PLIOCENE WARM CLIMATES OF THE USA
reconstructions. However, the latitudeboundary at which tundra climatesbecome common is similar between bothbiome reconstructions, as is the latitudewhen forest types switch from warm orcool mixed to colder forms.
Nevertheless, the BIOME 4 resultsshow significant variation from theimposed PRISM2 biomes that cannot beexplained by the classification problemalone. Firstly, BIOME 4 predicts a signifi-cant advance of biomes representingdesert or arid areas compared withPRISM2 in eastern and central areas ofthe southern USA. Specifically, the geo-graphical distribution of xerophytic shru-bland moves northward and eastwardcompared to the reconstructions of desertareas in PRISM2. We believe that this dis-crepancy reflects the dryer than expectedconditions predicted by the HadAM3 forthis region in the Pliocene control experi-ment.
Secondly, BIOME 4 completely fails topredict the presence of grassland in thewestern USA. In contrast, PRISM2 sug-gests that grasslands cover a significantgeographical area of that region. This maysuggest that the HadAM3 model could beover estimating precipitation levels in thehigher latitudes of the western USA.
Thirdly, BIOME 4 predicts temperateconifer forest over parts of the southeastUSA where PRISM2 identifies deciduouswoodland. The results of our Pliocenesensitivity experiment have demonstratedthat, at least for this area of the USA, theprescribed PRISM2 SST are primarilyresponsible for forcing the simulatedchanges in the middle Pliocene climate.PRISM2 SST reconstructions for coastalareas around this region of the USA areslightly warmer (1° to 2°C), the same orslightly cooler (0.5° to 1°C) than presentduring certain months of the year (seeDowsett et al. 1999). In this case, the
available evidence suggests that thePRISM2 biomes and SST could be out ofphase with one another leading to anunderestimation of surface temperaturechange in the middle Pliocene controlexperiment over this region by theHadAM3 model.
CONCLUSIONS
The UK Meteorological Office’sHadAM3 GCM has been used to producea regional climate simulation of the middlePliocene over the USA that is in broadagreement with available geologicalpalaeoenvironmental evidence. Gener-ally, a warmer, less seasonal and wetterclimate is simulated for the USA during themiddle Pliocene. However, according tothe geological record and outputs from abiome model (BIOME 4), the HadAM3model appears to misrepresent changesto the intensity of the hydrological cycle inthe southern USA. This inconsistency isrelated to the way in which the HadAM3model represents changes to the dynamiccirculation of the atmosphere (changes insoutherly wind strength) during the middlePliocene. This problem may arise due toan incorrect response of the model to theimposed boundary conditions. Alterna-tively, incorrectly prescribed boundaryconditions (elevation of western cordilleraof North America or SST) in the PRISM2data set could also be capable of generat-ing the data-model inconsistency.
Future work will continue to evaluatethe robustness of the HadAM3 model pre-dictions for the middle Pliocene. Specifi-cally, we aim to evaluate the reliability ofthe model by comparing its outputs toproxy geological data from other regionsand perhaps more significantly attempt tomodel climate variability within thePRISM2 time slice itself.
19
ALAN M. HAYWOOD, PAUL J. VALDES, BRUCE W. SELLWOOD, JED O. KAPLAN, AND HARRY J. DOWSETT: MODELLING MIDDLE PLIOCENE WARM CLIMATES OF THE USA
ACKNOWLEDGEMENTS
The authors would like to thank theUnited States Geological Survey for pro-viding the PRISM2 digital data set. Wewould also like to thank Dr. Mark Chandlerof the Goddard Institute of Space Science(GISS/NASA) for his advice and experi-ence concerning aspects of middlePliocene palaeoclimate modelling. Thisresearch was carried out in receipt of aReading University Endowment TrustFund award, which is gratefully acknowl-edged.
REFERENCES
Adam, D.P., Bradbury, J.P., Rieck, H.J. and Sarana-Wojcicki, A.M. 1990. Environmental changes in theTulelake basin, Siskiyou and Modoc Counties, Cali-fornia, from 3 to 2 million years before present. U.S.Geological Survey Bulletin, 1933: 13 pp.
Auffenburg, W. 1974. Checklist of fossil land tortoises(Testudinidae). Bull. Florida Mus. Biol. Sci., 18:121-251.
Barron, J.A. 1992. Pliocene paleoclimatic interpretationof DSDP Site 580 (NW Pacific) using diatoms.Marine Micropaleontology, 20: 23-44.
Barron, J.A. 1996. Diatom constraints on the position ofthe Antarctic Polar Front in the middle part of thePliocene. Marine Micropaleontology, 27, (1/4): 195-214.
Brigham-Grette, J. 1994. Warm Pliocene high sea-levelevents in the Arctic Alaska. EOS, Transactions ofthe American Geophysical Union, Spring Meet-ing, 75, (Suppl.).
Chandler, M., Rind, D., Thompson, R. 1994. Joint inves-tigations of the middle Pliocene climate II: GISSGCM Northern Hemisphere results. Global andPlanetary Change, 9: 197-219.
Chervin, R.M. and Schneider, S.H. 1976. On determiningthe statistical significance of climate experiments withGeneral Circulation Models. Journal of Atmo-spheric Sciences, 33: 405-412.
Cox, P., Betts R., Bunton C., Essery R., Rowntree P.R.and Smith J. 1999. The impact of new land-surfacephysics on the GCM simulation and climate sensitiv-ity. Climate Dynamics, 15: 183-203.
Cronin, T.M. 1991. Pliocene shallow water paleoceanog-raphy of the North Atlantic Ocean based on marineostracodes. Quaternary Science Reviews, 10, (2/3): 175-188.
Cusack, S., Slingo A., Edwards, J.M. and Wild, M. 1998.The radiative impact of a simple aerosol climatologyon the Hadley Centre GCM. Q.J.R. Met. Soc., 124:2517-2526.
Dowsett, H.J. and Cronin, T.M. 1990. High eustatic sealevel during the middle Pliocene: evidence fromsoutheastern U.S. Atlantic coastal plain. Geology,18: 435-438.
Dowsett, H.J. and Poore, R.Z. 1991. Pliocene sea sur-face temperatures of the North Atlantic Ocean at 3.0Ma. Quaternary Science Reviews, 10: 189-204.
Dowsett, H.J., Cronin, T.M., Poore, R.Z., Thompson,R.S., Whatley, R.C. and Wood, A.M. 1992. Micropal-eontological evidence for increased meridional heattransport in the North Atlantic Ocean during thePliocene. Science, 258: 1133-1135.
Dowsett, H.J., Barron, J. and Poore, R.Z. 1996. MiddlePliocene sea surface temperatures: A global recon-struction. Marine Micropaleontology, 27, (1/4):13-25.
Dowsett, H.J., Barron, J.A., Poore, R.Z., Thompson,R.S., Cronin, T.M., Ishman, S.E. and Willard, D.A.1999. Middle Pliocene paleoenvironmental recon-struction: PRISM2. USGS Open File Report, 99-535, http://pubs.usgs.gov/openfile/of99-535.
Edwards, J.M. and Slingo A. 1996. Studies with a flexiblenew radiation code 1: Choosing a configuration for alarge-scale model. Q.J.R. Met. Soc., 122: 689-719.
Forester, R.M. 1991. Pliocene-climate history of theWestern United States derived from lacustrine ostra-codes. Quaternary Science Reviews, 10: 133-146.
Graham, R.W. 1986. Plant-animal interactions and Pleis-tocene extinctions. In D.K. Elliott (Editor), Dynamicsof Evolution. Wiley, Chichester: 131-154.
Gregory, D., Kershaw, R., Inness, P.M. 1997. Parametri-sation of momentum transport by convection II: testsin single column and general circulation models.Q.J.R. Meteorol. Soc., 123: 1153-1183.
Hansen, J., Russell, G., Rind, D., Stone, P., Lacis, A.,Lebedeff, S., Ruedy, R. and Travis, L. 1983. Efficientthree-dimensional global models for climate studies:models I and II. Monthly Weather Review, 111: 609-662.
Haywood, A.M., Valdes, P.J., Sellwood, B.W. 1999.Palaeoclimate reconstruction of the middle-Plioceneclimate using the UKMO GCM. Report submitted tothe USGS PRISM Group. The University of Read-ing, UK. Available at http://www.rdg.ac.uk/AcaDepts/sl/Sed/Research/Climate/Password1/report.html
Haywood, A.M., Valdes, P.J., Sellwood, B.W. 2000a.Global scale palaeoclimate reconstruction of the mid-dle Pliocene climate using the UKMO GCM: initialresults. Global and Planetary Change, 25, (3/4):239-256.
Haywood, A.M., Sellwood, B.W., Valdes, P.J. 2000b.Regional warming: Pliocene (ca 3 Ma) Paleoclimateof Europe and the Mediterranean. Geology, 28, (12):1063-1066.
Heusser, L. and Morley, J. 1996. Pliocene climate ofJapan and environs between 4.8 and 2.8 Ma: A jointpollen and marine faunal study. Marine Micropale-ontology, 27 (1/4): 86-106.
Hibbard, C.W. 1960. An interpretation of Pliocene andPleistocene climates in North America. Michigan
20

ALAN M. HAYWOOD, PAUL J. VALDES, BRUCE W. SELLWOOD, JED O. KAPLAN, AND HARRY J. DOWSETT: MODELLING MIDDLE PLIOCENE WARM CLIMATES OF THE USA
Academy of Science, Arts and letters PresidentialAddress 62, Annu. Rep: 5-30.
IPCC, 1995. Climate Change 1995: The science of Cli-mate Change. Houghton, J.T., Meria Filho, L.G., Cal-lander, B.A., Harris, N., Kattenberg, A. and Maskell,K. (Eds.). Cambridge University Press, Cambridge,UK: 572 pp.
Johns, T.C. 1996. A description of the second HadleyCentre Coupled Model (HadCM2). ClimateResearch Technical Note 71, Meteorological Office,Bracknell, UK: 19 pp.
Johns, T.C., Carnell, R.E., Crossley, J.F., Gregory, J.M.,Mitchell, J.F.B., Senior, C.A., Tett, S.F.B., Wood, R.A.1997. The second Hadley Centre coupled ocean-atmosphere GCM: model description, spinup andvalidation. Climate Dynamics, 13: 103-134.
Kaplan, J.O. 2001. Geophysical Applications of Vegeta-tion Modeling. Ph.D. Thesis, Lund University, Lund.
Morley, J.J. and Dworetzky, B.A. 1991. EvolvingPliocene-Pleistocene climate: A North Pacific per-spective. Quaternary Science Reviews, 10: 225-238.
Norris, R.D., Corfield, R.M. and Haynes-Baker, J. 2000.Mountains and Eocene climate. In Huber, B.T.,MacLeod, K.G., Wing, S.L. 2000. Warm Climates inEarth History. Cambridge University Press, Cam-bridge, UK: 161-196.
Pope, V.D., Gallani, M.L., Rowntree, P.R. and Stratton,R.A. 2000. The impact of new physical parametriza-tions in the Hadley Centre climate model - HadAM3.Climate Dynamics, 16, (2/3): 123-146.
Poore, R.Z. and Sloan, L.C. 1996. Climates and climatevariability of the Pliocene (Eds). Marine Micropale-ontology, 27, (1/4): 326pp.
Prentice, I.C., Cramer, W., Harrison, S.P., Leemans, R.,Monserud, R.A. and Solomon, A.M. 1992. A globalbiome model based on plant physiology and domi-nance, soil properties and climate. Journal of Bio-geography, 19: 117-134.
Prentice, I.C., Sykes, M.T. and Cramer, W. 1993. A simu-lation model for the transient effects of climatechange on forest landscapes. Ecological Modelling,65: 51-70.
Prentice, I.C., Harrison, S.P., Jolly, D., and Guiot, J.1998. The climate and Biomes of Europe at 6000 yrBP: Comparison of Model Simulations and Pollen-Based Reconstructions. Quaternary ScienceReviews, 17, (6/7): 659-668.
Raymo, M.E. 1994. The initiation of Northern Hemi-sphere glaciation. Annual Review of Earth andPlanetary Science, 22: 353-383.
Sloan, L.C., Crowley, T.J., Pollard, D. 1996. Modeling ofmiddle Pliocene climate with the NCAR GENESISgeneral circulation model. Marine Micropaleontol-ogy, 27, (1/4): 51-61.
Smith, G.A., Wang, Y., Cerling, T.E. and Geissman, J.W.1993. Comparison of a paleosol carbonate isotoperecord to other records of Pliocene-early Pleistoceneclimate in the western United States. Geology, 21: 1-17.
Thompson, R.S. 1996. Pliocene and early Pleistoceneenvironments and climates of the western SnakeRiver Plain, Idaho. Marine Micropaleontology, 27,(1/4): 141-156.
Thompson, R.S. 1991. Pliocene environments and cli-mates in the western United States. Quaternary Sci-ence Reviews, 10: 115-132.
Thompson, R.S. and Fleming, R.F. 1996. MiddlePliocene vegetation: reconstructions, paleoclimaticinferences, and boundary conditions for climate mod-eling. Marine Micropaleontology, 27, (1/4): 27-49.
Thompson, R.S., Oviatt, C.G., Roberts, A.P., Buchner, J.,Kelsey, R., Bracht, C., Forester, R.M., and Bradbury,J.P. 1995. Stratigraphy, sedimentology, paleontology,and paleomagnetism of Pliocene-early Pleistocenelacustrine deposits in two cores from western Utah.U.S. Geological Survey Open-File Report, 95-1: 94pp.
Tiedemann, R., Sarnthein, M. and Shackleton, N.J.1994. Astronomic timescale for the Pliocenedelta18O and dust records of Ocean Drilling ProgramSite 659. Paleoceanography, 9, (4): 619-638.
Wigley, T.M.L. and Santer, B.D. 1990. Statistical compar-ison of spatial fields in model validation, perturbation,and predictability experiments. Journal of Geophys-ical Research-Atmospheres, 95, (D1): 851-865.
Willard, D.A., Cronin, T.M., Ishman, S.E., and Litwin, R.J.1993. Terrestrial and marine records of climate andenvironmental change during the Pliocene in sub-tropical Florida. Geology, 21: 679-682.
Williamson, J.W., Summers, R.L and Webb III, T. 1998.Applying Plant Functional Types to Construct BiomeMaps from Eastern North America Pollen Data: Com-parisons with Model Results. Quaternary ScienceReviews, 17, (6/7): 607-628.
Zubakov, V.A. and Borzenkova, I.I. 1990. Global palaeo-climate of the late Cenozoic. Dev. Palaeontologyand Stratigraphy, 12, Elsevier, Amsterdam: 456 pp.
21