Embed Size (px)
Citation preview
Modelling Options for the Public Funding of Hospital Medicines in Australia
THE CURRENT SYSTEM AND PROPOSALS FOR
REFORM
PREPARED BY
Laurie Brown, Alicia Payne, Binod Nepal, Cathy
Gong and Gabrielle Cooper
MARCH 2010
Modelling Options for the Public Funding of Hospital Medicines in Australia
NATSEM March 2010
2
ABOUT NATSEM
The National Centre for Social and Economic Modelling was established on 1 January 1993, and supports
its activities through research grants, commissioned research and longer term contracts for model
maintenance and development.
NATSEM aims to be a key contributor to social and economic policy debate and analysis by developing
models of the highest quality, undertaking independent and impartial research, and supplying valued
consultancy services.
Policy changes often have to be made without sufficient information about either the current
environment or the consequences of change. NATSEM specialises in analysing data and producing models
so that decision makers have the best possible quantitative information on which to base their decisions.
NATSEM has an international reputation as a centre of excellence for analysing microdata and constructing
microsimulation models. Such data and models commence with the records of real (but unidentifiable)
Australians. Analysis typically begins by looking at either the characteristics or the impact of a policy change
on an individual household, building up to the bigger picture by looking at many individual cases through the
use of large datasets.
It must be emphasised that NATSEM does not have views on policy. All opinions are the authors’ own and
are not necessarily shared by NATSEM.
© NATSEM, University of Canberra 2010
All rights reserved. Apart from fair dealing for the purposes of research or private study, or criticism
or review, as permitted under the Copyright Act 1968, no part of this publication may be reproduced,
stored or transmitted in any form or by any means without the prior permission in writing of the
publisher.
National Centre for Social and Economic Modelling
University of Canberra ACT 2601 Australia
170 Haydon Drive Bruce ACT 2617
Phone + 61 2 6201 2780
Fax + 61 2 6201 2751
Email [email protected]
Website www.natsem.canberra.edu.au
Modelling Options for the Public Funding of Hospital Medicines in Australia
NATSEM March 2010
3
AUTHOR NOTE
Laurie Brown is a Professor and Research Director (Health) at the National Centre for Social and
Economic Modelling, University of Canberra. At the time of undertaking this research, Alicia Payne,
Binod Nepal and Cathy Gong were Research Fellows at NATSEM. Gabrielle Cooper is a Professor and
Head of the Discipline of Pharmacy, Faculty of Health, at the University of Canberra.
ACKNOWLEDGEMENTS
The authors would like to thank the following for their professional contribution to this Report
through interviews conducted by Professor Gabrielle Cooper:
Professor Michael Dooley BPharm, Vic.Coll.Pharm., Grad.Dip.Hosp.Pharm., Vic.Coll.Pharm.,
Professor of Clinical Pharmacy (and Director of Pharmacy, Bayside Health), Monash
University, Melbourne Victoria,
Mr Andrew Petrie BPharm FSHP, Director Medicines and Pharmacy Services Unit, Queensland
Health,
Mr Neil Keens BPharm MBA, Director of Pharmacy, The Canberra Hospital and current President
Society of Hospital Pharmacists of Australia
and we acknowledge the assistance provided and the time given to answering our questions and
queries by other individuals from Government, AIHW, ABS, the Pharmaceutical Industry and Hospital
Pharmacy in Australia.
This project was supported through an untied research grant from Pfizer Australia.
GENERAL CAVEAT
NATSEM research findings are generally based on estimated characteristics of the population. Such
estimates are usually derived from the application of microsimulation modelling techniques to
microdata based on sample surveys.
These estimates may be different from the actual characteristics of the population because of
sampling and non-sampling errors in the microdata and because of the assumptions underlying the
modelling techniques.
The microdata do not contain any information that enables identification of the individuals or
families to which they refer.
Modelling Options for the Public Funding of Hospital Medicines in Australia
NATSEM March 2010
4
ABBREVIATIONS
ABS Australian Bureau of Statistics
ACHS Australian Council on Health Care Standards
ACSQHC Australian Commission for Safety and Quality in Health Care
AHCA Australian Health Care Agreements
AIHW Australian Institute of Health and Welfare
ALOS Average length of stay
AR-DRG Australian Refined Diagnosis Related Groups
ATC Anatomical Therapeutic Chemical classification
COAG Council of Australian Governments
CURF Confidentialised unit record file
DoHA Department of Health and Ageing
ICD-10-AM International Statistical Classification of Diseases and Related Health Problems, 10th
Revision, Australian Modification
IPA Individual Patient Approval
JATAG Joint Australian Therapeutics Advisory Groups
MSAPs Medical Superintendant Signed Authority Protocols
NHCDC National Hospital Cost Data Collection
NHHRC National Health and Hospitals Reform Commission
NHMD National Hospital Morbidity Database
NPHE National Public Hospital Establishments
PBS Pharmaceutical Benefits Scheme
PBAC Pharmaceutical Benefits Advisory Committee
PHEC Private Hospital Establishment Collection
SDL Standard Drug List (for Queensland Hospitals)
SHPA Society of Hospital Pharmacists of Australia
TGA Therapeutic Goods Administration
Modelling Options for the Public Funding of Hospital Medicines in Australia
NATSEM March 2010
5
CONTENTS
About NATSEM 2
Acknowledgements 3
General Caveat 3
Abbreviations 4
Executive Summary 7
Executive Summary 7
1 Introduction 13
1.1 Methods 14
2 Background 15
2.1 Public and Private Hospitals in Australia 15
2.1.1 Public hospitals 15
2.1.2 Private hospitals 16
2.2 Overview of Hospital Medicines in Australia 18
2.2.1 Structures of funding for the use of prescribed medicines in Australia 19
2.2.2 The Pharmaceutical Benefits Scheme and its use in hospitals 20
2.2.3 Hospital formularies 22
2.2.4 Drug Committees 24
2.2.5 The influence of PBS listing on the hospital formulary 25
2.2.6 Off Label- non-TGA approved therapies 26
2.2.7 Ability of Industry to influence formulary applications 26
2.3 Policy Context - National Health and Hospitals Reform Commission 27
3 Identified Issues with the Current System and Opportunities for Reform 30
3.1 Continuity of Care and Health Outcomes 30
3.2 Cost Shifting 30
3.3 Inequities of Access and Funding 31
3.4 Value for Money 31
3.5 Duplication of Work 31
4 Proposals for Reform 32
4.1 Society of Hospital Pharmacists of Australia (SHPA) 32
4.2 Joint Australian Therapeutics Advisory Groups (JATAG) 33
4.3 Pfizer Australia 34
5 Constructing a System Dynamics Model of the Hospital Medicines System 37
5.1 Modelling Approach 37
5.2 Data Sources 38
5.2.1 National Hospital Cost Data Collection 38
5.2.2 National Public Hospital Establishments Data Collection 40
5.2.3 National Hospital Morbidity Database 42
Modelling Options for the Public Funding of Hospital Medicines in Australia
NATSEM March 2010
6
5.2.4 Private Hospital Establishment Collection 43
5.2.5 IMS Health Pharmaceutical Sales Data 44
5.2.6 Quality and Safety of Hospital Care – Adverse Drug Events 44
5.3 Causal Loop Diagram of the Hospital Medicines System 46
6 General Findings 50
6.1 Use of Medicines in Australia’s Hospitals 50
6.2 Hospital Medicines by Therapeutic Class 55
6.3 Adverse Drug Events 56
6.4 Possible Impacts of the Reform Options 57
7 Conclusions 61
References 63
APPENDIX 1 Terms of Reference for the National Health & Hospitals Reform Commission 66
APPENDIX 2 Decision Algorithms on the Evaluation of Medicines 67
APPENDIX 3 Public and Private Hospital Activity and Cost of Pharmacy by Selected DRG and by State 68
Boxes, figures and tables
Figure 1 Typology of Australian Hospitals 16
Figure 2 Causal Loop Diagram of the Hospital Medicines System 47
Figure 3 Share of separations by public hospital peer group, 2006-07 51
Figure 4 Average length of stay by public hospital peer group, 2006-07 51
Figure 5 Average cost of per separation by public hospital peer group, 2006-07 52
Figure 6 Average cost of pharmaceuticals per separation by public hospital peer group, 2006-07 53
Figure 7 Average cost of pharmaceuticals per separation as a proportion of total cost by public hospital peer group, 2006-07 54
Table 1 Australian public hospital peer groups 17
Table 2 Number of hospitals and hospital beds by broad public hospital peer group, 2007-08 17
Table 3 Number of public and private hospitals and number of beds per 1,000 weighted population by state and territory, 2007-08 18
Table 4 Selected recommendations by the NHHRC and their implications for hospital medicines. 29
Table 5 Percentage of total costs by component, and cost ratio by component, Public & Private Sector, Round 11 40
Table 6 Components of system dynamics model 48
Table 7 Cost of hospital medicines by therapeutic class, 2007-08 55
Table 8 Separations with adverse events 57
Table 9 Likely impact for public hospitals of select reform option in addressing key issues 58
Modelling Options for the Public Funding of Hospital Medicines in Australia
NATSEM March 2010
7
EXECUTIVE SUMMARY
The National Health and Hospital Reform Commission (NHHRC) was charged with developing a long
term reform plan for the Australian health care system. One area where the funding and regulation is
complex and which gives rise to a number of medical and financial problems and concerns is hospital
pharmacy. Despite various proposals for change in the public funding of hospital medicines, this has
attracted little attention in the reform agenda. This Report seeks to:
• review hospital pharmacy in Australia and the current system for the public funding of
hospital medicines in Australia;
• identify the key issues and problems that exist with the current funding and bureaucratic
arrangements;
• develop a system dynamics model to estimate the clinical, economic and organisational
consequences of proposals for reform; and
• identify possible options for reform and evaluate the likely impact of a select few within the
policy context of NHHRC deliberations and recommendations.
In undertaking this research, we found that there were many challenges to building a system
dynamics model, especially related to the availability of detailed data on the use and cost of
medicines; on clinical pharmacy, distribution and management processes that take place within
hospitals; and patient outcomes, at the level of individual hospitals. Hence, this Report examines
only the nature of the modelling task, scopes the available data upon which the model could be
constructed, and details the structure of a system dynamics model through a causal loop diagram.
Hospital Pharmacy in Australia
Prescription medicines are funded and subsidised differently depending on whether they are sold in
the ‘community’ or administered in hospital, whether it is a private or public hospital, whether the
patient receiving the drugs in hospital is an ‘in’ or ‘out’ patient and the type of drug itself. As of 2007-
08, there were 762 public and 552 private hospitals in Australia. There is significant variation
between these hospitals, the services they provide, their size and the number of patients they treat.
In 2007-08, over $2bn of public funds were spent on covering the cost of medicines in Australian
hospitals – medicines in public hospitals costing $1.4bn and in private hospitals around $0.6bn,
noting that many medicines dispensed in private hospitals are funded via the PBS. The provision and
funding of pharmaceuticals in Australia, both in the community and hospital, is regulated by two
main policies: the National Medicines Policy - including its third pillar ‘Quality Use of Medicines’ -
which sets out the aims and principles for the supply and use of medicines in Australia; and the
Australian Health Care Agreements (AHCA), which are bilateral five year agreements between the
Commonwealth and each State/Territory Government.
Medications approved for use in a public hospital are listed in a formulary. Formularies identify to
prescribers what medications can be used in a public hospital and for what indications. Unlike the
PBS for which a list of subsidised drugs is agreed on at the national level, hospitals are generally
responsible for selecting their own individual formularies, with some exceptions such as in
Modelling Options for the Public Funding of Hospital Medicines in Australia
NATSEM March 2010
8
Queensland and Western Australian where State-wide formularies operate. The complex area of cost
effectiveness evaluation requires skills that are often not available in each individual hospital. As a
result, there has been the development of specialised therapeutic advisory groups in most States to
provide State governments and hospital Drug Committees evidence and cost-effectiveness data with
which to make informed decisions on medications availability and indications. Public hospitals will
develop policies to refuse direct representation to Drug Committees from pharmaceutical company
‘reps’ to make sure that the decision of inclusion is made on clinical grounds and not as a marketing
exercise for industry. One particularly challenging area for public hospitals is the area of use of
medications for non-approved (not approved by TGA) uses of medications. Clinicians are keen to
provide the best care to patients particularly when few alternatives may be available or the patient
has limited time for treatment, and hence public hospitals will develop processes to enable patients
to be availed of ‘off-label’ treatment for which there is limited evidence.
Identified Issues with the Current System and Opportunities for Reform
The system of funding and regulation of hospital medicines is complex and fragmented. This has a
number of implications. The following were identified as major issues of concern:
• Lack of continuity of care and poor health outcomes - a substantial number of adverse drug
events and admissions to hospital are attributable to confusion surrounding the overlap of or
gaps between community and hospital care;
• System incentives for cost shifting e.g. between in- and out-patients, and between State and
Commonwealth Governments;
• Inequities of access to and funding of medicines - individual formularies in most hospitals
mean that the same drugs, or at least, the same brands of drugs are not available across all
public hospitals, and many patients in private hospitals are able to access the PBS to cover
drugs administered while they are in hospital;
• Value for money – the current emphasis is on evaluating the efficacy of drugs and drug
committees and TAGs do not necessarily have the expertise to undertake appropriate cost-
effectiveness evaluations to ensure ‘value for money’;
• Duplication of work and bureaucratic workloads required to maintain the system - the
management of a formulary for each individual public hospital represents duplication of
work, and State and Commonwealth administrative procedures and requirements impose an
unnecessary workload, duplication and waste of resources.
Proposals for Reform
A number of reform options have been proposed. The following three were investigated in this
Report:
Modelling Options for the Public Funding of Hospital Medicines in Australia
NATSEM March 2010
9
1. The Australian government provides funding for all pharmacy services (clinical distribution
and management) including all medicines used in hospitals (this is the Society of Hospital
Pharmacists of Australia’s (SHPA) Option 5);
2. The extension of the PBS to cover all hospital medicines (this is SHPA’s Option on 2); and
3. A national hospital formulary is established with a national committee to administer it and
the Commonwealth Government funding the cost of all pharmaceuticals in hospitals (as
proposed by the Joint Australian Therapeutics Advisory Groups).
These reflect the broad interest by key stakeholders.
A System Dynamics Model of the Hospital Medicines System
Hospital medicines are funded, acquired, prescribed and consumed within a system driven by cause
and effect, and is characterised by complex ideas and information. The ‘hospital medicines system’ is
a complex system in that it is highly coupled with dynamic processes that play out over time, has
feedback effects and many outcomes resulting from the interactions that occur between its many
parts. System dynamics is a method to enhance the understanding of the functioning and to analyse
the behaviour of complex systems over time, with the help of computer simulation. This approach
involves system variables, the interactions between them through feedback loops, and the study of
the effects of these interactions over time. The utility or power of system dynamics modelling is its
simulation capabilities for testing what if scenarios.
There is a broad range of data that ideally is required to populate a system dynamics model of hospital
medicines. Most of the publicly available statistical collections do not routinely report data at the fine
level – e.g. at the level of an individual hospital - required for the modelling but review of the possible
data sources suggest that such information may be made available on request. A combination of
datasets would need be used to build the model equations and populate the different stages of the
model. Likely sources of data include:
• The Commonwealth Department of Health and Ageing National Hospital Cost Data
Collection (NHCDC);
• The Australian Institute of Health and Welfare (AIHW) National Public Hospital
Establishments (NPHE);
• AIHW’s National Hospital Morbidity Database (NHMD);
• Australian Bureau of Statistics Private Hospital Establishment Collection; and
• IMS Health Pharmaceutical Sales Data.
Information on adverse drug events can be obtained from AIHW’s NHMD using ICD-10-AM codes Y40-
Y59 which identify separations with an external cause coded as an adverse effect caused by ‘drugs,
medicaments or biological substances in therapeutic use’.
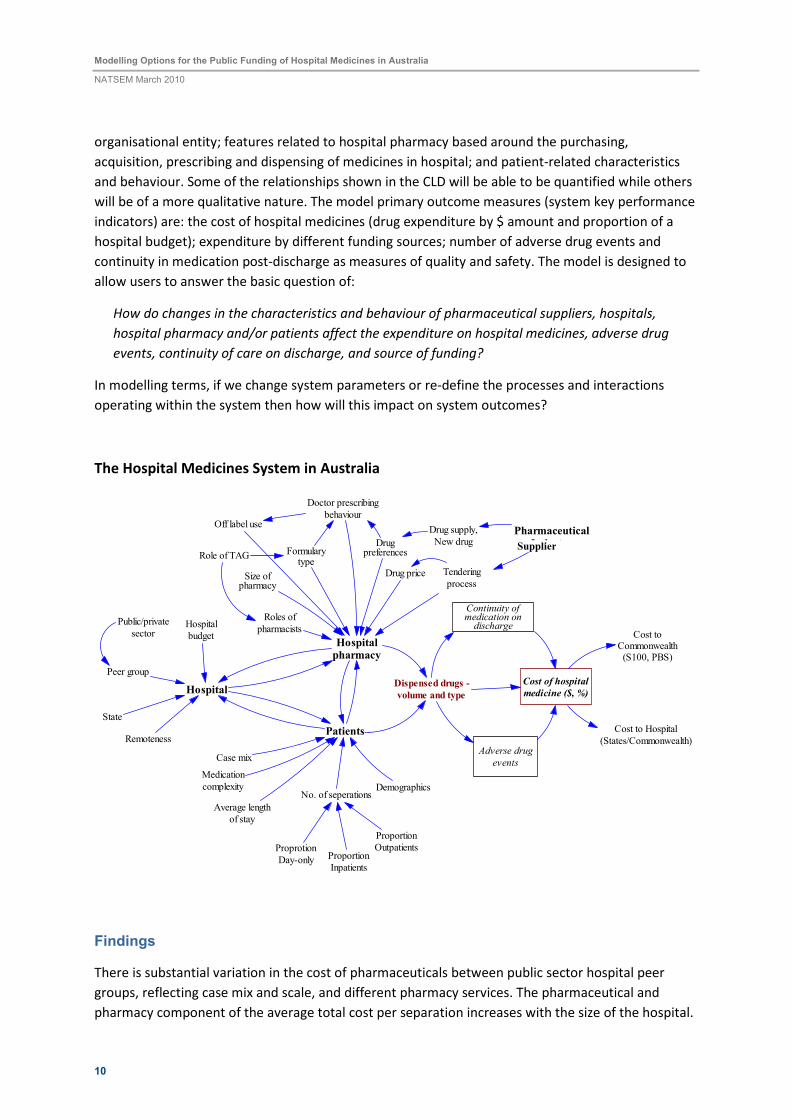
The causal loop diagram (CLD) (visual representation of the system dynamics model) developed for
the hospital medicines system is provided in the figure below. The model is based on four interacting
parts: the industry characteristics and business activities of pharmaceutical companies
manufacturing and supplying hospital based medicines; the characteristics of the hospital as an
Modelling Options for the Public Funding of Hospital Medicines in Australia
NATSEM March 2010
10
organisational entity; features related to hospital pharmacy based around the purchasing,
acquisition, prescribing and dispensing of medicines in hospital; and patient-related characteristics
and behaviour. Some of the relationships shown in the CLD will be able to be quantified while others
will be of a more qualitative nature. The model primary outcome measures (system key performance
indicators) are: the cost of hospital medicines (drug expenditure by $ amount and proportion of a
hospital budget); expenditure by different funding sources; number of adverse drug events and
continuity in medication post-discharge as measures of quality and safety. The model is designed to
allow users to answer the basic question of:
How do changes in the characteristics and behaviour of pharmaceutical suppliers, hospitals,
hospital pharmacy and/or patients affect the expenditure on hospital medicines, adverse drug
events, continuity of care on discharge, and source of funding?
In modelling terms, if we change system parameters or re-define the processes and interactions
operating within the system then how will this impact on system outcomes?
The Hospital Medicines System in Australia
Cost of hospital
medicine ($, %)
Adverse drug
events
Continuity ofmedication ondischarge
Hospitalpharmacy
Formularytype
Case mix
Size ofpharmacy
Roles of
pharmacists
Drug price
Drugpreferences
Tendering
process
Patients
No. of seperations
Proportion
Inpatients
Proportion
OutpatientsProprotion
Day-only
Demographics
Hospital
Peer group
State
Public/private
sector
Remoteness
Hospital
budget
Dispensed drugs -
volume and type
Cost toCommonwealth(S100, PBS)
Cost to Hospital
(States/Commonwealth)
Average length
of stay
Drug supply,
New drug
Medication
complexity
Doctor prescribing
behaviourOff label use
Role of TAG
Pharmaceutical
Industry
Findings
There is substantial variation in the cost of pharmaceuticals between public sector hospital peer
groups, reflecting case mix and scale, and different pharmacy services. The pharmaceutical and
pharmacy component of the average total cost per separation increases with the size of the hospital.
Supplier
Modelling Options for the Public Funding of Hospital Medicines in Australia
NATSEM March 2010
11
In 2007-08, the proportion of the total cost of a separation attributable to the costs of
pharmaceuticals and pharmacy services varies from 2.5 percent in small regional acute (D1) hospitals
to 5.1 per cent in major city and regional hospitals. Two ATC categories account for nearly half of all
pharmaceutical sales in public and private hospitals - cancer and immunosuppressant therapies (ATC
Category L) make up nearly 30 percent of all hospital expenditure on drugs and systemic anti-
infection drugs (ATC – J) contribute to a further 20 percent. The number of pharmaceutical
companies selling products in the different ATC classes varies considerably - in general, the more
companies selling products within a therapeutic class, the lower was the annual growth rate in the
cost of drug purchase. By 2007-08, the total number of separations to Australian public and private
hospitals had increased to 7.9 million, but a staggering 106,012 separations were reported as having
an adverse drug event in hospital i.e. over one in every 75 hospital stays had an adverse drug event
that was sufficiently severe that it was reported on the patient’s medical file and coded into official
hospital statistics.
The possible impacts of the three chosen reform options on key issues and outcomes were
investigated. Extending the PBS or establishing a national hospital medicines formulary funded by the
Commonwealth Government offers significant advantages. The first option ‘ Commonwealth
Government as single funder’ performs the least well as it does not directly impact on issues around
hospital formularies which are central to the public funding of hospital medicines and performance
of hospital pharmacy and which are addressed by the other two options. Each of the options:
• is universal in that it supports all patients;
• increases equity of access to hospital medicines with a focus on meeting the clinical needs of
individual patients;
• improves the supplies of medicines on discharge;
• removes incentives for cost shifting; and
• shifts funding to the Commonwealth Government as the single funder, and addresses State-
Commonwealth administration issues.
The reform options offer other benefits but these either vary between the options or are less clear,
for example: integration with community care (and PBS), including improving continuity of
medication on discharge; adherence to QUM principles and improved patient safety; reduction in
unnecessary bureaucratic processes, administrative workloads and duplication of work; robust
tendering processes and pricing mechanisms; and economic evaluation leading to value for money
(cost-effectiveness) and responsible spending. Like all policy reform options, ‘the devil is in the detail’
and these options need further scoping and assessment.
At present, expenditure on hospital medicines is capped through public hospital budgets but under
these reform options, expenditure is likely to become uncapped, with funding being ‘activity-based’.
Mechanisms need to be put into place to link medicine use to health outcomes, with funding
arrangements and formularies allowing for flexibility at the level of the individual hospital to
dispense medicines that best suit the clinical needs of the patients while encouraging responsible
and cost-effective spending. The introduction of an enhanced PBS-hospital formulary or a national
hospital medicines formulary will both positively impact on hospitals through streamlining, at the
Modelling Options for the Public Funding of Hospital Medicines in Australia
NATSEM March 2010
12
level of the individual hospital, drug-listing, pricing, tendering and other acquisition processes.
However, while there is strong support for increasing the clinical role of pharmacists, how these
reform options will impact on clinical pharmacy services is uncertain. A possible limitation with both
formulary options is the restriction to approved uses only. The impact of these reform options on the
total cost of hospital pharmacy and more specifically on the cost of medicines is also uncertain
because of the possible incentives for hospitals to use more medicines under an uncapped funding
system versus the efficiencies and savings that the Commonwealth could achieve as monopsony
funder and purchaser dictating terms to the pharmaceutical companies supplying drugs and through
economies of scale. This change in funding arrangements would have major implications for the
pharmaceutical suppliers in Australia.
Conclusions
Although a number of submissions were made to the National Health and Hospitals Reform
Commission, no direct recommendations were made by the Commission concerning the public
funding of hospital medicines. The broader issues raised by the Commission are relevant to and
overlap the changes proposed in the three reform options examined.
The development of the system dynamics model through the causal loop diagram provided a means
to enhance our understanding of the systemic causes of hospital medicine use and costs in Australia.
Further work to quantify and operationalise the model will allow the policy levers and reform options
discussed, or alternative formulations, to be more thoroughly and rigorously tested on the simulation
and the results evaluated for their improvement to key outcomes. Models are a cost-efficient way of
testing ‘what-if’ policy scenarios that address real world issues.
It is timely given the release of the NHHRC’s final report on and the Commonwealth Government’s
interest in reforming Australia’s health care system that the reform of public funding of hospital
medicines is also addressed. The three proposals examined in this Report would all provide benefits.
These and other possible alternatives should be studied in much greater detail to provide the
Commonwealth Government with the necessary platform to introduce policy change to the publicly
funding of medicines in Australian hospitals.
Key words: Hospitals, pharmaceuticals, funding, reform options, system dynamics modelling
Modelling Options for the Public Funding of Hospital Medicines in Australia
NATSEM March 2010
13
1 INTRODUCTION
Medications are the most common intervention a patient will experience in an Australian public
hospital, costing some $1.4 billion dollars annually1. The National Health and Hospital Reform
Commission (NHHRC) was charged with developing a long term reform plan for the Australian health
care system. One area where the funding and regulation is complex and which gives rise to a number
of medical and financial problems and concerns is hospital pharmacy. Despite various proposals for
change in the public funding of hospital medicines, this has attracted little attention in the reform
agenda.
This Report examines the current system for the public funding of hospital medicines in Australia and
investigates possible options for reform. A key aim of the Report is to provide an overview of
hospital pharmacy in Australia, and identify the key issues and problems that exist with the current
funding and organisational arrangements. Options for change are then canvassed. The development
of a system dynamics model to estimate the clinical, economic and organisational consequences of
selected funding models-policy options for government, the pharmaceutical industry, hospital
administrators, peak health professional bodies (especially hospital pharmacy) and patients is
investigated.
In undertaking this research, we found that there were many challenges to building such a model -
especially related to the availability of detailed data on the use and cost of medicines, the workings
of hospital pharmacies in terms of clinical pharmacy, distribution and management related processes
that take place within hospitals, and patient outcomes, at the level of individual hospitals. Hence,
this Report examines only the nature of the modelling task, scopes the available data upon which the
model could be constructed, and details the structure of a system dynamics model through a causal
loop diagram.
In developing the model structure, we identify the key agents, relationships and interactions that
occur within Australia’s ‘hospital medicines system’. While we have not as yet quantified the
processes nor ‘populated’ the model with data, we have been able to use the model structure to
hypothesize the likely impacts of each reform option in terms of both economic and patient
outcomes. The Report highlights the next steps needed to build a fully-functional model that can be
used to better inform future policy options for the funding, supply and use of medicines in Australia’s
public and private hospitals.
This research has been undertaken within the context of the NHHRC’s deliberations and
recommendations and with the view to contributing to the policy debate around the supply and use
of medicines in hospitals in Australia. A summary of the policy context is given in Section 2.3. Also
by way of background, we initially provide a brief overview of public and private hospitals in Australia
in Section 2.1 and medicines in Australian hospitals in Section 2.2.
We provide the results of the research in Sections 3–6. Firstly, the findings on the current issues and
problems with medicine use in hospitals and related costs are provided; secondly, three possible
1 http://d01.aihw.gov.au/cognos/cgi-bin/ppdscgi.exe?DC=Q&E=/ahs/phe0607_f
Modelling Options for the Public Funding of Hospital Medicines in Australia
NATSEM March 2010
14
reform options are reviewed; thirdly, the modelling work is described in which system dynamics
modelling is introduced as a modelling approach, the data sources are discussed and the structure of
a system dynamics model for hospital medicines outlined. In Section 6, we provide the results of
some aggregate analyses and speculate on the likely impact of the different reform options. The
Report concludes with a brief discussion of these findings and recommendations for future work.
1.1 METHODS
This work is based on a detailed review of the literature on hospital pharmacy and the funding and
use of medicines in Australian hospitals. A number of interviews with key stakeholders from both the
pharmaceutical industry and hospital pharmacy were also conducted. These interviews provided
further information on and insight into the operation of the current system and its problems, as well
as on possible options for change.
Administrative statistical collections held by the Australian Institute of Health and Welfare (AIHW), by
the Commonwealth Department of Health and Ageing (DoHA), the Australian Bureau of Statistics
(ABS), were evaluated as possible data sources for the modelling as well as pharmaceutical sales data
collected by IMS Health Australia Pty Ltd in its hospital audit database. Reports and data on the
quality use of medicines and patient safety were also reviewed.
Process maps2 were constructed to assist in designing the system dynamics model which was then
developed using the software package ‘Vensim’. A number of different software packages are
available to construct system dynamics models. Vensim is readily available, is widely used and is well
supported.
2 A process map (flowchart) is basically a visual picture of a process (or system). A key element of process
mapping is establishing boundaries around processes i.e. identifying where each process starts and finishes,
and how each interacts with other processes.
Modelling Options for the Public Funding of Hospital Medicines in Australia
NATSEM March 2010
15
2 BACKGROUND
2.1 PUBLIC AND PRIVATE HOSPITALS IN AUSTRALIA
In Australia, hospital services account for around one-third of national expenditure on health care
(Productivity Commission, 2009). Australian hospitals can be divided into the public and private
sectors and within these into further groups based on their patient throughput and the treatments
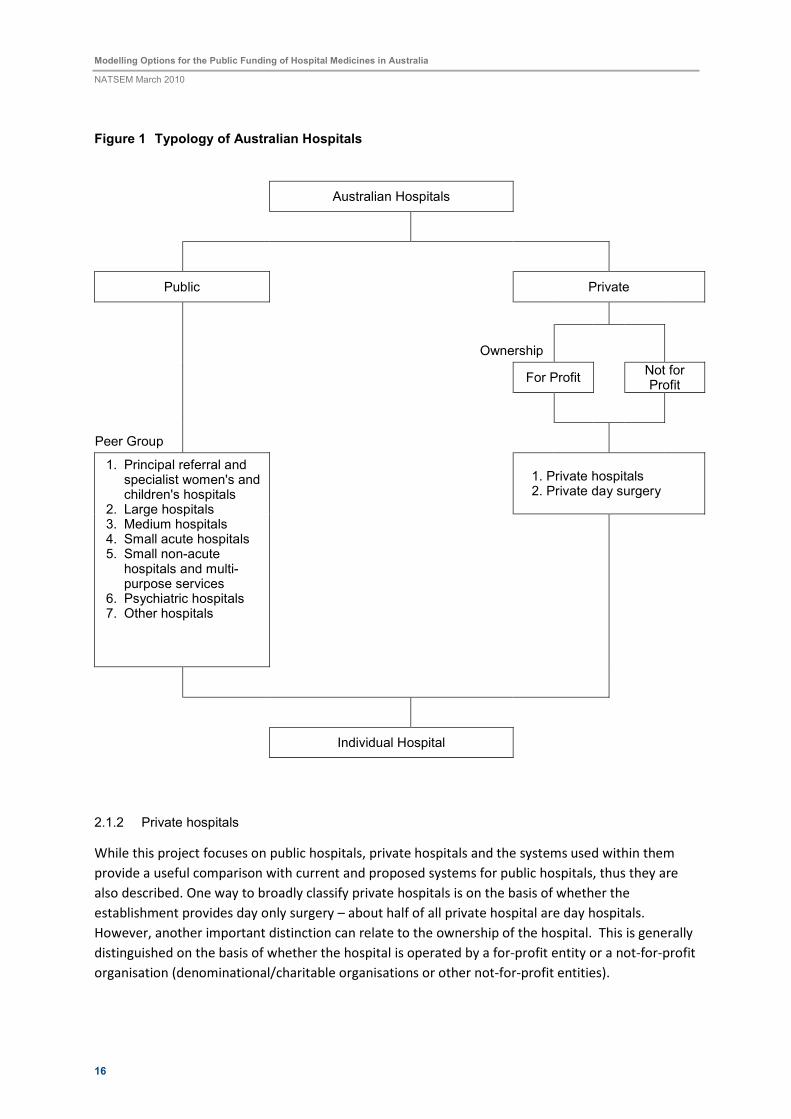
provided, as shown in Figure 1. As of 2007-08, there were 762 public hospitals in Australia to which
there were 4.7million admissions, and 552 private hospitals to which there were 3.1 million
admissions (DoHA 2009a). In 2009, the Productivity Commission undertook a review of the relative
performance of public and private hospitals in Australia. The Commission found that the efficiency of
public and private hospitals was, on average, similar and using their experimental cost estimates
that, at a national level, public and private hospitals have similar average costs (Productivity
Commission, 2009). However, there are significant variations between hospitals, the treatments they
provide, their size and the number of separations they treat, and in the composition of their costs.
2.1.1 Public hospitals
The majority of Australia’s hospitals are public, in which all Australians can access treatment free of
charge, funded by the government. As will be discussed further in Section 2.2 hospitals are the
responsibility of state and territory governments, although some of their funding comes from the
Commonwealth Government through the Australian Health Care Agreements. In 2006-07, $27 billion
was spent on public hospital services, of which 40 per cent was funded by the Commonwealth
Government ($10.8 billion), 53 per cent by state, territory and local governments and the remaining
seven per cent came from non-government sources, for example ‘out-of-pocket’ payments by
individuals (DoHA, 2009a).
Across all public hospitals there were 56,467 available beds, accounting to 2.5 public hospital beds
per 1,000 weighted population (DoHA, 2009a). Half of people admitted to public hospitals were
discharged on the same day. The majority of public patients (67 per cent) received acute medical
care, 18 per cent underwent surgery, six percent had medical procedures, a further six per cent were
admitted to maternity and three per cent to sub-acute services (DoHA, 2009a).
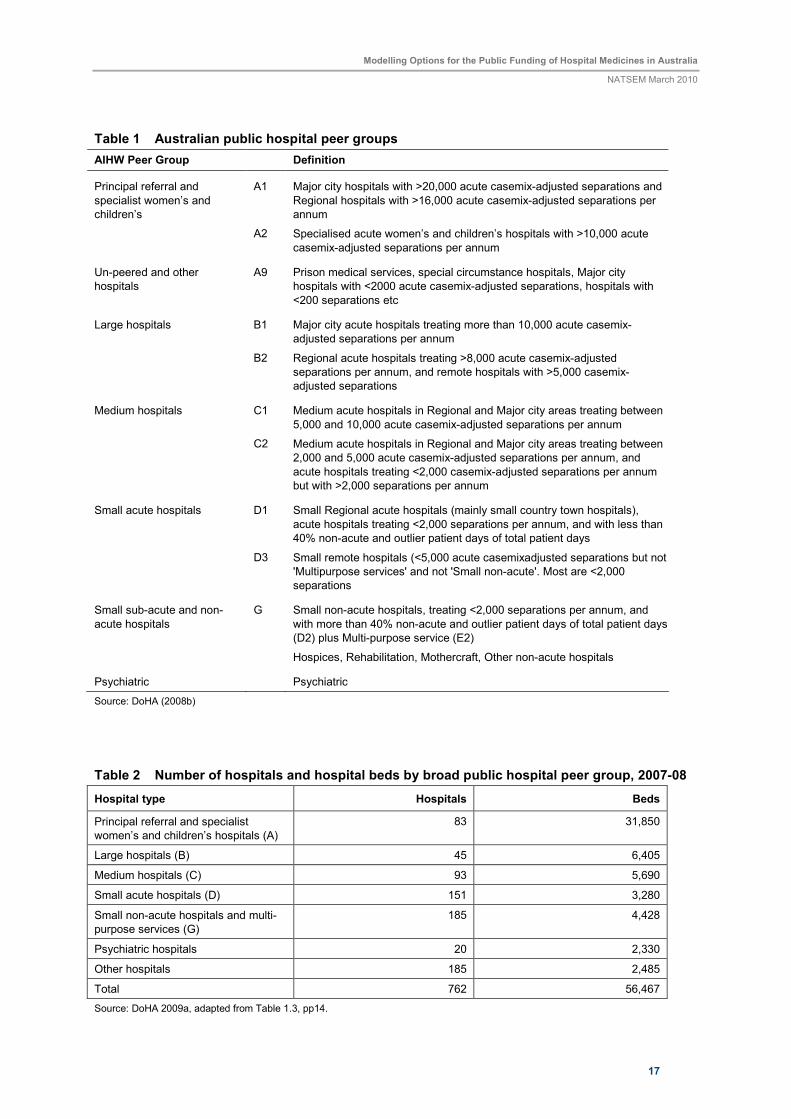
In order to compare hospitals of a similar size and case mix, the ‘peer group’ structure has been
developed to classify hospitals. As detailed in Table 1, public hospitals in Australia can be classified
into seven main categories, and ten sub-groups within those, based on their number of admissions in
a year and location. Specialist psychiatric hospitals form their own grouping. ‘Principal referral’ and
‘specialist’ hospitals are classified as those treating more than 20,000 patients if they are located in a
major city and more than 16,000 if they are in regional areas. These major hospitals account for more
than half of all available beds, and represent 11 per cent of all public hospitals. ‘Small acute’, ‘small
non-acute and multi-purpose services’, psychiatric and ‘other’ hospitals represent 71 per cent of all
Australia’s public hospitals, but only 22 per cent of hospital beds (DoHA 2009a). Table 2 shows the
number of hospitals and beds in each broad group. Peer group is a key structure for the comparison
of hospitals, and thus an ideal unit for modelling for this project. Section 5 presents analysis of data
comparing the costs and use of public hospitals by peer group.
Modelling Options for the Public Funding of Hospital Medicines in Australia
NATSEM March 2010
16
Figure 1 Typology of Australian Hospitals
Australian Hospitals
Public
Private
Ownership
For Profit
Not for Profit
Peer Group
1. Private hospitals 2. Private day surgery
1. Principal referral and specialist women's and children's hospitals
2. Large hospitals 3. Medium hospitals 4. Small acute hospitals 5. Small non-acute hospitals and multi-purpose services
6. Psychiatric hospitals 7. Other hospitals
Individual Hospital
2.1.2 Private hospitals
While this project focuses on public hospitals, private hospitals and the systems used within them
provide a useful comparison with current and proposed systems for public hospitals, thus they are
also described. One way to broadly classify private hospitals is on the basis of whether the
establishment provides day only surgery – about half of all private hospital are day hospitals.
However, another important distinction can relate to the ownership of the hospital. This is generally
distinguished on the basis of whether the hospital is operated by a for-profit entity or a not-for-profit
organisation (denominational/charitable organisations or other not-for-profit entities).
Modelling Options for the Public Funding of Hospital Medicines in Australia
NATSEM March 2010
17
Table 1 Australian public hospital peer groups
AIHW Peer Group Definition
Principal referral and
specialist women’s and
children’s
A1 Major city hospitals with >20,000 acute casemix-adjusted separations and
Regional hospitals with >16,000 acute casemix-adjusted separations per
annum
A2 Specialised acute women’s and children’s hospitals with >10,000 acute
casemix-adjusted separations per annum
Un-peered and other
hospitals
A9 Prison medical services, special circumstance hospitals, Major city
hospitals with <2000 acute casemix-adjusted separations, hospitals with
<200 separations etc
Large hospitals B1 Major city acute hospitals treating more than 10,000 acute casemix-
adjusted separations per annum
B2 Regional acute hospitals treating >8,000 acute casemix-adjusted
separations per annum, and remote hospitals with >5,000 casemix-
adjusted separations
Medium hospitals C1 Medium acute hospitals in Regional and Major city areas treating between
5,000 and 10,000 acute casemix-adjusted separations per annum
C2 Medium acute hospitals in Regional and Major city areas treating between
2,000 and 5,000 acute casemix-adjusted separations per annum, and
acute hospitals treating <2,000 casemix-adjusted separations per annum
but with >2,000 separations per annum
Small acute hospitals D1 Small Regional acute hospitals (mainly small country town hospitals),
acute hospitals treating <2,000 separations per annum, and with less than
40% non-acute and outlier patient days of total patient days
D3 Small remote hospitals (<5,000 acute casemixadjusted separations but not
'Multipurpose services' and not 'Small non-acute'. Most are <2,000
separations
Small sub-acute and non-
acute hospitals
G Small non-acute hospitals, treating <2,000 separations per annum, and
with more than 40% non-acute and outlier patient days of total patient days
(D2) plus Multi-purpose service (E2)
Hospices, Rehabilitation, Mothercraft, Other non-acute hospitals
Psychiatric Psychiatric
Source: DoHA (2008b)
Table 2 Number of hospitals and hospital beds by broad public hospital peer group, 2007-08
Hospital type Hospitals Beds
Principal referral and specialist
women’s and children’s hospitals (A)
83 31,850
Large hospitals (B) 45 6,405
Medium hospitals (C) 93 5,690
Small acute hospitals (D) 151 3,280
Small non-acute hospitals and multi-
purpose services (G)
185 4,428
Psychiatric hospitals 20 2,330
Other hospitals 185 2,485
Total 762 56,467
Source: DoHA 2009a, adapted from Table 1.3, pp14.
Modelling Options for the Public Funding of Hospital Medicines in Australia
NATSEM March 2010
18
In 2007-08, private hospitals received $7.1 billion in government funding (DoHA 2009a). As will be
discussed further in Section 2.2, the way in which pharmaceuticals are paid for in private hospitals is
quite different to that in public hospitals, as drugs for the majority of patients are covered by the
Commonwealth Pharmaceutical Benefits Scheme (PBS) or patients’ private health insurance. There
were 1.3 private hospital beds per 1,000 weighted population, and 66 per cent of patients admitted
were discharged on the same day (DoHA, 2009a). The mix of treatments delivered in private
hospitals was somewhat different to that in public hospitals, with patients being less likely to receive
acute care and more likely to have surgery in private hospitals than in the public system. In private
hospitals 34 per cent of patients received acute medical care, 38 per cent had surgery, 20 per cent
had medical procedures, three per cent were in maternity and four per cent received sub-acute
services (DoHA, 2009a).
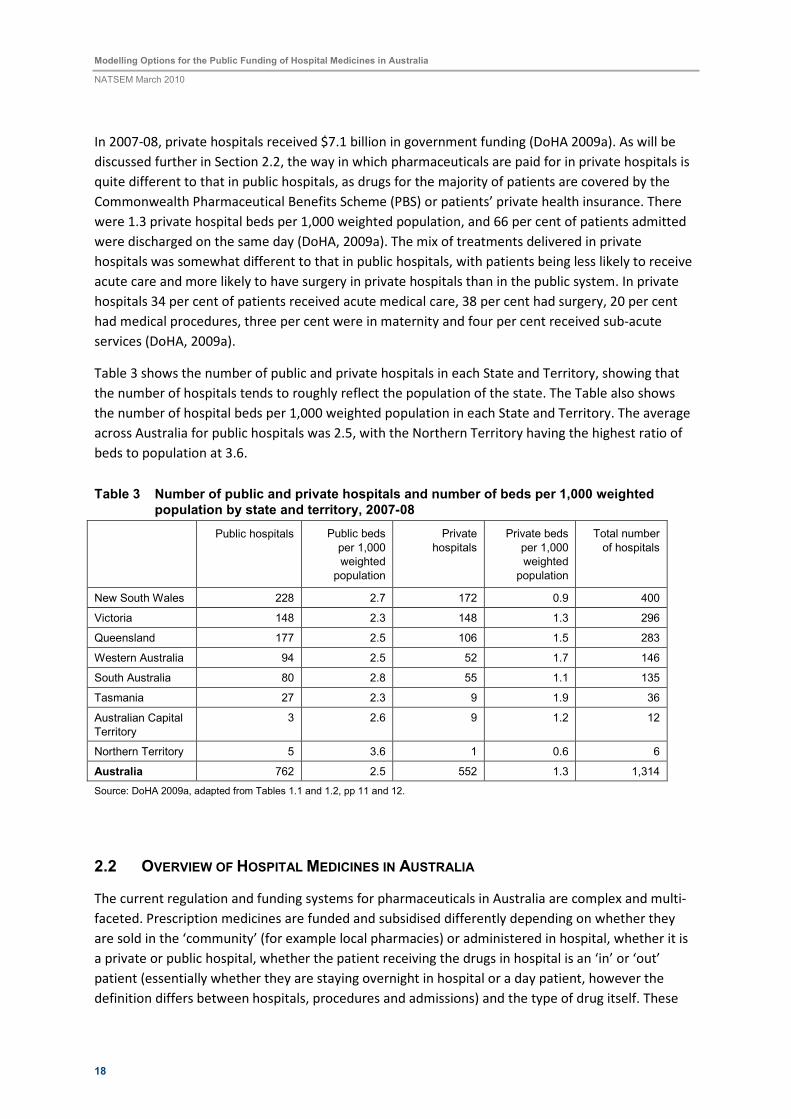
Table 3 shows the number of public and private hospitals in each State and Territory, showing that
the number of hospitals tends to roughly reflect the population of the state. The Table also shows
the number of hospital beds per 1,000 weighted population in each State and Territory. The average
across Australia for public hospitals was 2.5, with the Northern Territory having the highest ratio of
beds to population at 3.6.
Table 3 Number of public and private hospitals and number of beds per 1,000 weighted population by state and territory, 2007-08
Public hospitals Public beds
per 1,000
weighted
population
Private
hospitals
Private beds
per 1,000
weighted
population
Total number
of hospitals
New South Wales 228 2.7 172 0.9 400
Victoria 148 2.3 148 1.3 296
Queensland 177 2.5 106 1.5 283
Western Australia 94 2.5 52 1.7 146
South Australia 80 2.8 55 1.1 135
Tasmania 27 2.3 9 1.9 36
Australian Capital
Territory
3 2.6 9 1.2 12
Northern Territory 5 3.6 1 0.6 6
Australia 762 2.5 552 1.3 1,314
Source: DoHA 2009a, adapted from Tables 1.1 and 1.2, pp 11 and 12.
2.2 OVERVIEW OF HOSPITAL MEDICINES IN AUSTRALIA
The current regulation and funding systems for pharmaceuticals in Australia are complex and multi-
faceted. Prescription medicines are funded and subsidised differently depending on whether they
are sold in the ‘community’ (for example local pharmacies) or administered in hospital, whether it is
a private or public hospital, whether the patient receiving the drugs in hospital is an ‘in’ or ‘out’
patient (essentially whether they are staying overnight in hospital or a day patient, however the
definition differs between hospitals, procedures and admissions) and the type of drug itself. These
Modelling Options for the Public Funding of Hospital Medicines in Australia
NATSEM March 2010
19
complexities, disparities between situations and areas of ‘loose’ regulation lead to the issues that
have been identified by various pharmacy groups, and constitute the reasons for this Report. This
section provides an overview of the structures, regulation and funding of hospital pharmaceuticals in
Australia and the processes by which medicines are selected for use in hospitals. While this Report
focuses on the issues facing public hospitals, it is important to explain the broader context of
pharmaceutical funding in Australia, including community pharmacy and private hospitals in order to
appreciate the broader policy context in which pharmaceutical use and funding operates. In
preparation of this section of the Report, several key authorities were interviewed to provide insight
into those issues that influence medications availability and utilisation within the hospital sector (See
the acknowledgements section for details of contributors).
2.2.1 Structures of funding for the use of prescribed medicines in Australia
First, all medications available for therapeutic use in Australia are required to be approved by the
Therapeutic Goods Administration as provided by the Therapeutic Goods Act 1989. This Act laid
down a framework for the regulation of therapeutic goods in Australia to ensure quality, safety and
efficacy of medicines and medical devices. The Therapeutic Goods Act 1989, Regulations and Orders
set out the requirements for inclusion of therapeutic goods in the Australian Register of Therapeutic
Goods, including advertising, labelling, product appearance and appeal guidelines. Some provisions
such as the scheduling of substances and the safe storage of therapeutic goods are covered by the
relevant State or Territory legislation. The Therapeutic Goods Administration (TGA) is a unit of the
Australian Government Department of Health and Ageing and is responsible for administering the
provisions of the legislation. Once a medication has been approved for use by the TGA that
medication may be used by a registered health professional for the indication for which it was
approved3.
Under this umbrella, the provision of prescribed medicines4 is divided into two main systems:
community, including all prescriptions presented to ‘local’ pharmacies, and hospital. The provision
and funding of pharmaceuticals in Australia, both in the community and hospital, is regulated by two
main policies: the National Medicines Policy including its third pillar ‘Quality Use of Medicines’ which
sets out the aims and principles for the supply and use of medicines in Australia; and the Australian
Health Care Agreements (AHCA), which are bilateral five year agreements between the
Commonwealth and each State and Territory Government. These govern the health funding given
from Commonwealth to State and Territory Governments. While the Medical Benefits Scheme
(covering the use of GP and specialist services provided outside of hospital) is funded by the
Commonwealth Government, hospitals are funded by State and Territory Governments (although a
substantial proportion of this funding comes to the states from the Commonwealth through the
AHCA).
3 http://www.tga.gov.au/docs/html/tga/tgaginfo.htm 4 Prescribed medicines include: a) prescription drugs listed on the PBS (including the Repatriation
Pharmaceutical Benefits Scheme). These are either ‘benefit paid pharmaceuticals’ or ‘below copayment medicines’; and b) ‘private medicines’ which are pharmaceuticals dispensed through private prescriptions but are not items listed in the PBS or RPBS, or which do not meet PBS criteria for dispensing through the PBS.
Modelling Options for the Public Funding of Hospital Medicines in Australia
NATSEM March 2010
20
2.2.2 The Pharmaceutical Benefits Scheme and its use in hospitals
The majority of prescription drugs provided in the community (i.e. not in hospital) are subsidised by
the Commonwealth Government through the Pharmaceutical Benefits Scheme (PBS). The PBS
subsidises the cost of prescribed medicines that have been assessed by the Pharmaceutical Benefits
Advisory Committee (PBAC) and found to be cost-effective in the management of conditions
contributing to a significant disease burden in Australia. There is also a subcommittee of the PBAC
that addresses pharmacoeconomic issues known as the Economic Sub-committee of the PBAC. This
committee has expertise in evaluating the cost effectiveness data provide by industry to justify the
inclusion of their product on the PBS. The Scheme works by covering the additional costs of
medications above a set co-payment that is made by individuals. The annual co-payment amount
that can be made by an individual is also capped through the safety net arrangements to ensure that
people with complex and high pharmaceutical needs are not disadvantaged. PBS reimbursements
account for approximately 90 per cent of total prescription drug expenditure (Medicines Australia,
2005). Advantaged by the national scale, competitive prices are negotiated keeping the cost of
medicines relatively low. The PBS budget is uncapped. In addition to this scheme, the Repatriation
PBS (RPBS) is a Commonwealth Government (Department of Veterans’ Affairs) funded scheme
providing eligible veterans and their dependants a more comprehensive range of medications and
dressings than is available through the PBS (Australian Government Department of Health and
Ageing, 2009).
An important point to note here regarding the PBS is that each drug on the PBS is listed for the
treatment of a particular ‘indication’, that is, for the treatment of a specific condition or conditions.
The drug is only subsidised through the PBS when it is prescribed for that indication. However,
sometimes drugs can be useful in treating other conditions that may not be included in the drug’s
PBS listed indication. In this case a GP might prescribe the drug as a private prescription, meaning
that it is not covered by the PBS, and could be extremely expensive for the patient. Private
prescriptions are relatively rare in community pharmacy, however, in hospitals the use of medicines
outside their PBS indications is common practice (SHPA, 2008). This has implications for the
discussion of suggestions for the PBS to be instituted in public hospitals.
Within a public hospital all drugs are provided by the hospital (with the exception of some very small
hospitals and health centres that do not have their own pharmacies). This includes of course any
drugs that are prescribed during the patient’s time in hospital, but also any medications that the
patient may have been taking before their admission to hospital, for example, for a long-term
condition. Thus, when a patient is admitted to hospital, a doctor and pharmacist both take their
medication history and if there are any medications that they will need to continue taking during
their stay in hospital in addition to any new prescriptions, then these are also provided by the
hospital. These medications will be the same molecule but not always be the same brand as the
patient was receiving upon admission. On discharge from hospital, the hospital pharmacy will
generally provide the patient with a few days’ supply (the number of days differs with the hospital
and in some cases the particular patient) of medication to take home, including both any new
medications relating to the hospital stay and any existing medications that the patient is
recommended to continue taking. The patient then needs to see their GP before this supply runs out
in order to be given new scripts to collect from a community pharmacy. As will be explained in the
next section, several issues arise from this ‘hand-over’ between hospital and community – in
Modelling Options for the Public Funding of Hospital Medicines in Australia
NATSEM March 2010
21
particular medication errors arising from the confusion in the substitution of medications between
admission and discharge, and the adequacy of the supply of medication post discharge (some States
are trialling the use of the PBS on discharge to allow for a months supply of medicines rather than a
few days).
While the PBS is primarily a community pharmacy initiative, there are exceptions under which it does
apply in hospitals. While drugs are funded ‘by the hospital’ while a patient is admitted, the source of
this funding depends on whether the hospital is public or private, whether the patient is an in or out
patient and the type of drug. First, the broad majority of medications in a private hospital are
covered by the PBS, and thus Commonwealth funded, or if not by the patient themselves or their
insurer. In a public hospital the majority of medications are funded by the hospital, and thus the
State. Within a public hospital, the funding of drugs then depends on whether the patient is an in or
out patient. Again this definition differs between hospitals, but generally ‘inpatient’ refers to patients
who stay overnight in the hospital, while outpatients are those that come in to see specialists or
receive treatment, for example chemotherapy, but do not stay overnight in the hospital. A reform
introduced in the 1998-2003 Australian Health Care Agreement (AHCA) led to patients being seen at
outpatients, admitted as day cases or being discharged from a public hospital in Victoria, Queensland
and Western Australia being covered by the PBS.
An the exception to this is the Section 100 scheme through which the Commonwealth Government
supports the provision of a group of highly specialised and expensive medications in unique
environments. The scheme includes provision of medications for:
(a) Highly Specialised Drugs
These are medicines for the treatment of chronic conditions, which, because of their clinical use or
other special features, are restricted to supply through public and private hospitals having access to
appropriate specialist facilities. To prescribe these drugs as pharmaceutical benefit items, medical
practitioners are required to be affiliated with these specialist hospital units. A general practitioner
or non-specialist hospital doctor may only prescribe highly specialised drugs to provide maintenance
therapy under the guidance of the treating specialist. Benefits are available for the listed clinical
indications only. There is no facility for individual patient approval for indications outside those
listed. To gain access to a Commonwealth Pharmaceutical Benefits Scheme funded drug under this
program, a patient must attend a participating hospital and be a day admitted patient, a non-
admitted patient or a patient on discharge, be under appropriate specialist medical care, meet the
specific medical criteria and be an Australian resident in Australia (or other eligible person). A patient
will be required to pay a contribution for each supply of a highly specialised drug at a similar rate to
the PBS. A Commonwealth subsidy is not available for hospital in-patients (may be an outpatient)
(http://www.pbs.gov.au/html/healthpro/browseby/section100?subbook=HS).
(b) Opiate Dependence Treatment Program
The Australian Government funds the cost of buprenorphine hydrochloride, buprenorphine
hydrochloride with naloxone hydrochloride and methadone hydrochloride supplied as
pharmaceutical benefits through clinics and pharmacies approved by State and Territory
Governments.
Modelling Options for the Public Funding of Hospital Medicines in Australia
NATSEM March 2010
22
(c) Botulinum Toxin Program
Used for spasticity and spasm with approved indications.
(d) Human Growth Hormone Program
Used for growth assistance due to inadequate hormone secretion.
(e) IVF/GIFT Program
Used for assisted reproduction.
(f) Special Authority Program
Used for provision of specialized treatments for specific types of breast cancer.
While this appears fairly straightforward, the division between in and outpatients is blurry, and it is
seemingly common practice for inpatients to be taken to a different part of the hospital to receive
certain treatments, for example chemotherapy, where possible so that they can be classified as
outpatients and the treatment will be covered by the PBS rather than the hospital’s own budget. A
key point to note here is that unlike the PBS, hospital pharmacy budgets are generally capped.
Hospitals generally allocate a fixed proportion of the hospital budget for pharmaceuticals, apparent
in the fact that expenditure by public hospitals on drug supplies has consistently been five per cent
over the past several years (AIHW 2003, 2004, 2005, 2006, 2007, 2008). A high level of financial
diligence is required by hospitals to maintain budgetary control over medication expenditure in a
climate of the development of high cost therapies with varying levels of evidence for their impact on
patient care.
2.2.3 Hospital formularies
Medications approved for use in a public hospital are listed in a formulary. Formularies identify to
prescribers what medications can be used in a public hospital and for what indications. Unlike the
PBS for which a list of subsidised drugs is agreed on at the national level, hospitals are generally
responsible for selecting their own individual formularies, with some exceptions such as in
Queensland, to be discussed further.
Public hospitals in conjunction with their state health departments will develop a tender document
for the supply of medications listed in the formulary. This tender document is used by public
hospitals to optimise their expenditure on medications. Individual hospitals or groups of hospitals
will purchase medications that they require from that tender but there is no obligation to do so. The
tender document identifies an agreed price for a medication provided by a company. The price
provides a starting point at which negotiations may start between the Director of Pharmacy and the
company for medications. The practice of “bundling” refers to the negotiations that occur between
the Director of Pharmacy and the supplier to find a mutually satisfactory price for a group of
medications that may or may not be part of the tender document. For example, a hospital may have
a high demand for item X and request a lower price than the tender price but as an added benefit it
Modelling Options for the Public Funding of Hospital Medicines in Australia
NATSEM March 2010
23
also uses product Y which may not be on the tender document but the price may be negotiated
based on the volume required in a given period. In addition bonus stock may be provided by the
company if the quantity purchased is above a negotiated level. The other negotiations that may
occur are the time of billing of the stock may be deferred to reduce costs to the hospital in a high
usage period (i.e. winter) to smooth out financial strain on the organisation during peak periods.
Negotiated arrangements are left up to the individual Director of Pharmacy Services in the hospital
or group of hospitals. Products purchased by the hospital will be transported by the company to the
hospital at the company’s cost. A problem with the current tendering process is that it is frequently
delayed, such that prices can become out-of-date and manufacturing schedules and supply affected.
Within states, some hospitals group together to decide on and share a formulary, for example, in
Victoria this is quite common. Queensland and Western Australia have adopted state level
formularies, so that all drugs across all public hospitals and institutions are negotiated and selected
together (Queensland Health, 2009; Pfizer, 2008). The state-wide formulary originated from a
Standard Drug List for Queensland Hospitals (SDL) that was first developed in 1973 (Aldous & Petrie,
2008). Maintained by the Queensland Hospitals Drug Advisory Committee, the state-wide formulary
has been adopted in an attempt to reduce effort and resources required to ensure safe, rational and
cost-effective use of medications in keeping with the Quality Use of Medicines principles 2000, while
ensuring equity of access to necessary medications by all hospitals across a large state (Aldous &
Petrie, 2008). The “Standard Drug List” is a negotiated medication formulary that applies consistently
across the state. Instead of each hospital brokering a price for a medication directly with the supplier
this is done centrally. In consolidating this process, those involved (Queensland Health) believe that
they can have greater control of expenditure and negotiate better prices for the health system as a
whole.
Queensland medications are supplied to a central store in Brisbane and it is Queensland Health’s task
to transport medications across the entire state to all hospitals, health care and Aboriginal health
centers. The key to this system is a strong Drug Committee (Queensland Hospitals Drug Advisory
Committee) structure in approving medications for use in the state and an opportunity for Individual
Patient Approval (IPA) and Medical Superintendant Signed Authority Protocols (MSAPs). This process
is similar to the approval system within the PBS system where a set of criteria dictate approval or
exceptional drugs (usually expensive)5.The use of formularies on a large scale has the potential to
make pharmaceutical purchasing very competitive and therefore keep the cost low (Morgan, 2007;
Braae et al. 1999; Huskamp et al. 2003).
However, others see the Queensland formulary as being highly constrained as there are limited
ranges of brands within some drug categories. This has the potential to leave both the government
and suppliers exposed if circumstances were to change, for example, if there was a quality or safety
scare on one particular medicine. Other suppliers may not be able to readily deliver the necessary
stocks and there would be significant cost implications if large volumes of medicines had to be
imported. In addition, given the relatively small size of the hospital pharmaceutical industry in
Australia, if a manufacturer is unsuccessful in the tendering process then they may lose access to the
entire market.
5 Http://www.health.qld.gov.au/qhcss/mapsu/sdl.asp
Modelling Options for the Public Funding of Hospital Medicines in Australia
NATSEM March 2010
24
In public hospitals where there is a devolved budget to specialty areas (e.g. oncology) the clinical
team will work with the Director of Pharmacy to develop a budget for medications. Given some
clinical areas like oncology are proportionally the highest consumers of high cost drugs, there is
significant advantage for them to work closely with their specialist pharmacists to rationalise choices
of therapy in an attempt to contain costs as much as possible to enable best use of scarce resources.
In most cases the developed formulary will accommodate the needs of most patients within the
hospital. When there is a rare occurrence of a need for a non-formulary medication the Director of
Pharmacy will decide on the urgency of the situation. If there is a similar medication already on the
formulary it may be recommended if clinically appropriate. In consultation with the clinician involved
with the patient the Director will seek clinical evidence for the indication and efficacy for the
treatment, the cost implications both short term and long term and liaise with the Chair of the Drug
Committee and if need be with the Hospital Chief Executive Office to make sure the implications of
the supply are recognised. Mostly these situations are “one offs” and can be accommodated by the
budget. There are some medications that need to be held by the hospital for rare occurrences. These
are often held in the major hospital and shared between a region in the event of rare poisonings or
other incidents. It is an accepted role that public hospitals take on for the service of the community
in general.
2.2.4 Drug Committees
This complex area of cost effectiveness evaluation requires skills that are often not available in each
individual hospital. As a result, there has been the development of specialised therapeutic advisory
groups in most states that provide for state governments and drug committees evidence and cost-
effectiveness data with which to make informed decisions on medications availability and
indications. As a group they are known as the Council of Australian Therapeutic Advisory Groups6.
Their role is to investigate and evaluate new initiatives in therapeutics and by doing so promote safe,
rational, high quality, cost-effective use of medicines in public hospitals and the wider community in
an unbiased and objective manner. These committees specifically support the Drug and Therapeutics
Committees in public hospitals across Australia in making informed and rational decisions on
applications made for listing medications on the hospital formulary.
Historically, public hospitals across the country have developed drug committees that are delegated
to make decisions concerning which medications will be available to patients via a formulary in their
hospital or group of hospitals. In general, these committees consist of senior clinicians, clinical
pharmacologists and the Director of Pharmacy with support from senior pharmacists who provide
clinical trial and data support. It would be unusual for such a committee to have any
pharmacoeconomic experience or input.
Drug committees usually meet monthly and the items on the agenda are requests for new
medications or indications for a medication directly from a clinician. Generally, drug companies are
not permitted to make application directly to these committees. The data presented to the
committees is usually presented in a pre-formatted way using application forms developed by the
committee. Each hospital tends to have its own forms and approaches to medicines decision-
6 http://www.ciap.health.nsw.gov.au/nswtag/
Modelling Options for the Public Funding of Hospital Medicines in Australia
NATSEM March 2010
25
making. Frequently data included in the submissions is from drug companies that the clinician has
been provided to assist the application. Pharmacoeconomic data is sometimes presented although it
is generally based on less complex modeling evaluations than considered by PBAC. Those individuals
interviewed identified that access to PBS pharmacoeconomic data would assist hospital drug
committees to make more informed decision on the financial impact of a new therapy on their drug
budgets. Currently this data is not available to public hospital drug committees as it is “commercial-
in-confidence” data. In addition, for many hospital indications, there may be little clinical data
specifically relating to hospital uses upon which a full PBS-type decision could be made. This gap in
data and evaluation is one of the major hurdles that would need to be overcome if there were to be
a move towards a national or harmonized system for funding of medicines between community and
hospital sectors.
The governance of hospital drug committees rests with the appointed clinicians. Their role is to make
informed decisions on the clinical relevance and importance of a therapy taking into account current
evidence on safety and efficacy and other available therapies at a comparative cost. Costs may also
include factors such as reduced length of stay or staffing reductions due to the impact of the new
therapy.
Most hospitals will not accept a drug for use in the hospitals without approval by the drug
committee. This includes the recent practice of “familiarisation programs” where new medication is
supplied directly to patients on the approval of a clinician who is participating in such a program7.
These programs are offered by the pharmaceutical industry to facilitate deferred costs, cost free or
or subsidised access medications that are included on the Australian Register for Therapeutic Goods
by the TGA for public hospital patients prior to Pharmaceutical Benefits Scheme (PBS) listing or prior
to some other funding arrangement. This method of “product familiarisation” has produced
significant patient, clinician and hospital issues around continuance of supply if the medication does
not get PBS listing and as such has required the development of Guiding Principles for Product
Familiarisation for Public Hospitals from the Council of Australian Therapeutic Advisory Group to
make sure the pharmaceutical industry and clinicians are aware of their responsibilities to the patient
in such ventures.
The great challenge for many drug committees is to maintain some financial control over the costs of
therapeutic agents available in the hospital. Rationalisation of the number of brands and selection of
only a few medications from a class of agents is frequently done and this is based on evidence and
therapeutic guidelines prepared by the learned societies and prescribing services (e.g. National
Prescribing Service or Therapeutic Guidelines or the UK NICE Guidelines) or from the Council of
Australian Therapeutic Advisory Groups. Medications required outside those recommendations must
be supported by a clinician with significant clinical argument for such variance provided to the
committee.
2.2.5 The influence of PBS listing on the hospital formulary
Once a medicine is listed on the PBS there is pressure for that medicine to then be listed on a public
hospital formulary. This does not automatically occur. A submission must be made to the Drug
7 http://www.ciap.health.nsw.gov.au/nswtag/publications/guidelines/CATAGPFPGuidingPrinciples.pdf
Modelling Options for the Public Funding of Hospital Medicines in Australia
NATSEM March 2010
26
Committee by the industry for inclusion by a clinician. Given the number of individual products listed
on the PBS it is not realistic for a hospital to stock all brands or individual products within a group of
medicines on the hospital formulary. Frequently a drug committee will decide to chose select items
to be listed on a formulary that address the majority of patient’s needs with clinicians input and trial
evidence to support that decision. Multiple brands of the same medication are not stocked. This
means patients will receive the same medication in hospital but often receive a different brand that
may be a different colour or shape that may cause confusion if they are not properly counselled. It is
the role of the clinical pharmacist to ensure patients and clinicians are educated in the variance in all
hospital prescribed medications, and that they recognise the potential consequences of changing
brands, especially in terms of medication adherence.
2.2.6 Off Label- non-TGA approved therapies
One particularly challenging area for public hospitals is the area of use of medications for non-
approved (not approved by TGA) uses of medications. Clinical practice evolves at a much faster rate
than legislative or bureaucratic processes or even commercial interest. The rates at which new
developments in clinical practice occur make it very difficult for organisations and industry to keep
up with the formal application processes to occur in healthcare provision. Clinicians are keen to
provide the best patient care to patients particularly when few alternatives may be available or the
patient has limited time for treatment (e.g. end of life issues). In this circumstance public hospitals
will develop processes to enable patients to be availed of treatment for which there is limited
evidence (i.e. recent published data from a reputable journal) but the patients or next of kin will
need to give consent.
Interestingly children are the group most often in the situation of needing medications for which
they are not approved by TGA. Given the scarcity of clinical trials undertaken in children there is
often no approved indication for the use of medications used in adults for this population. In addition
there is often no formulation developed for the paediatric population therefore the pharmacy will
have to develop an extemporaneous preparation for the very young to enable the medication to be
administered in a usable way. In these situations consent needs to be attained for each episode of
care and as much information as possible needs to be provided to the patient or carer. Missing will
be any long-term data on the treatment in specific clinical situations. When this occurs clinicians are
encouraged to submit the cases to the medical literature to build up some body of experience.
2.2.7 Ability of Industry to influence formulary applications
The pharmaceutical industry has recently adopted the 15th edition of the Medicines Australia Code of
Conduct8 that governs standards, support, professionalism and promotion of quality use of
medicines consistent with the National Medicines Policy9. The development of policies by public
hospitals to refuse direct representation to drug committees from industry is to make sure that the
decision of inclusion is made on clinical grounds and not as a marketing exercise for industry. When it
appears to a Drug Committee that the application has been provided for a clinician by industry
without evidence of the clinical need the application may not proceed.
8 http://www.medicinesaustralia.com.au/pages/images/Medicines_Australia_Code_of_Conduct
_Edition_15.pdf
9 http://www.health.gov.au/internet/main/publishing.nsf/Content/National+Medicines+Policy-2
Modelling Options for the Public Funding of Hospital Medicines in Australia
NATSEM March 2010
27
In most public hospitals access to clinicians by the pharmaceutical industry representatives (reps) is
limited. Junior medical staff are usually not accessible to reps unless they are sponsoring a meeting
at the hospital. Senior staff may receive reps in their offices to keep them informed of new products
available.. Attendance at conferences or reviewing current publications in their area of practice is
more commonly used as the method of choice for prescribers. Adoption of best practice guidelines
developed by the specialist professional societies and other expert groups such as the NPS, Council of
Australian Therapetuic Advisory Groups and NICE have more influence on prescribing and clinical
practice. Many public hospitals will have policies and behaviours that must be adhered to by
pharmaceutical industry representatives while they are in a public hospital.
2.3 POLICY CONTEXT - NATIONAL HEALTH AND HOSPITALS REFORM COMMISSION
The National Health and Hospitals Reform Commission (NHHRC) was established by the
Commonwealth Government after the terms of reference were announced by the Council of
Australian Governments (COAG) in late 2007. The Commission was charged with the task of providing
advice on performance benchmarks and practical reforms to the Australian health system which
could be implemented to address problems with access to services, the growing burden of chronic
disease, population ageing, costs and inefficiencies generated by blame and cost shifting, and the
escalating costs of new health technologies. The NHHRC was required to develop a long term reform
plan for a modern Australia and which addressed eight specific issues (see Appendix 1). While all of
these can be related in someway to hospital pharmacy, four are of particular relevance, as identified
by SHPA (2008):
1. reduce inefficiencies generated by cost-shifting, blame-shifting and buck-passing;
2. better integrate and coordinate care across all aspects of the health sector, particularly
between primary care and hospital services around key measurable outputs for health;
3. better integrate acute services and aged care services, and improve the transition between
hospital and aged care; and
4. provide a well qualified and sustainable health workforce into the future.
In addition, a set of service design and governance principles were developed to underpin the
NHHRC’s thinking about health reform and the design of Australia’s future health system (NHHRC,
2008 & 2009). The Commission identified the service design principles as: people and family centred;
equity; shared responsibility; strengthening prevention and wellness; value for money; providing for
future generations; recognising broader environmental influences that shape our health; and
comprehensive. The governance principles included: taking the long term view; safety and quality;
transparency and accountability; public voice; a respectful and ethical system; responsible spending
on health, and a culture of reflective improvement and innovation. These principles apply to both the
public and private sector, and to both hospital and community based services.
Modelling Options for the Public Funding of Hospital Medicines in Australia
NATSEM March 2010
28
The Commission recognised that Australia currently has ‘a fragmented health system with a complex
division of funding responsibilities and performance accountabilities between different levels of
government’ and that ‘it is ill-equipped to respond to these challenges’ (2009, p3). In developing ‘a
practical national plan for health reform that will benefit Australians, not just now but well into the
future’ (p3, 2009), the NHHRC identified a number of health and health care challenges and made
numerous recommendations. However, neither hospital pharmacy nor the funding and use of
medicines in hospital were discussed by the NHHRC in its final report. Nonetheless, various
priorities/policy levers and recommendations made by the Commission in it’s reform agenda target
major changes in the operation and funding of Australian public hospitals. As such they are very
relevant to and will impact on the public funding of hospital medicines, the way in which hospital-
based pharmacists undertake their work, and on patient outcomes in terms of adverse drug events
and continuity of medication use on discharge. These are summarised in Table 4.
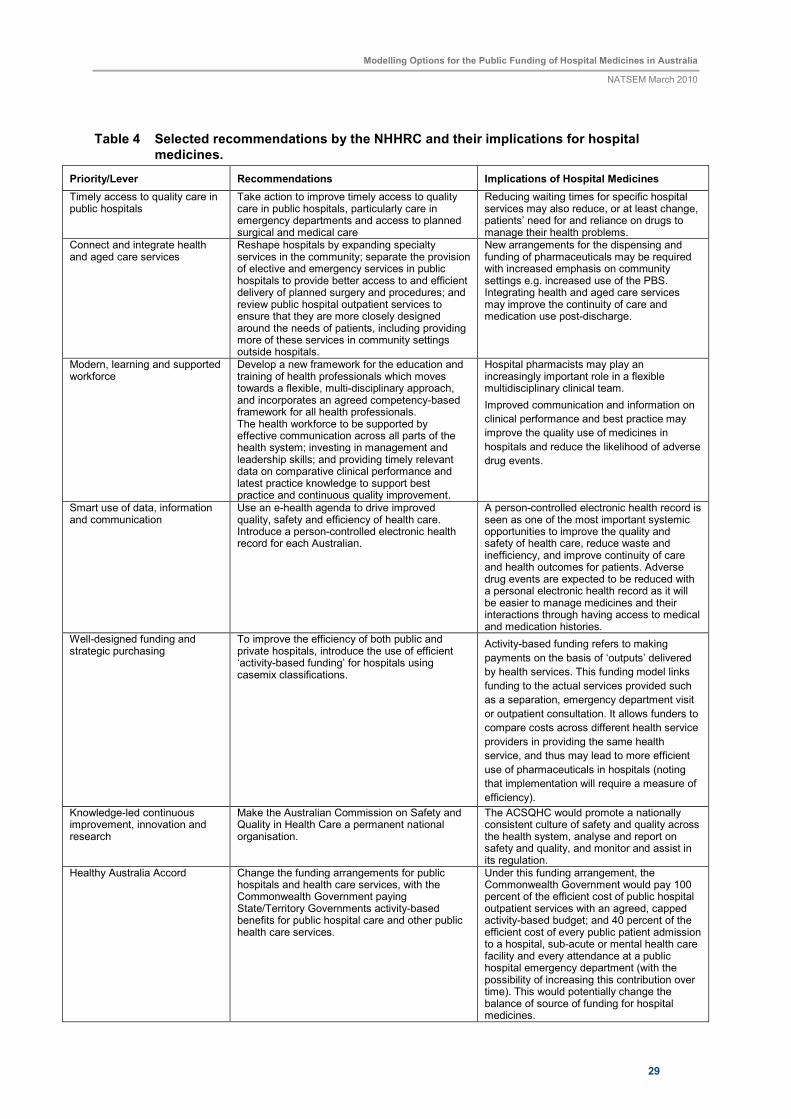
Modelling Options for the Public Funding of Hospital Medicines in Australia
NATSEM March 2010
29
Table 4 Selected recommendations by the NHHRC and their implications for hospital medicines.
Priority/Lever Recommendations Implications of Hospital Medicines
Timely access to quality care in public hospitals
Take action to improve timely access to quality care in public hospitals, particularly care in emergency departments and access to planned surgical and medical care
Reducing waiting times for specific hospital services may also reduce, or at least change, patients’ need for and reliance on drugs to manage their health problems.
Connect and integrate health and aged care services
Reshape hospitals by expanding specialty services in the community; separate the provision of elective and emergency services in public hospitals to provide better access to and efficient delivery of planned surgery and procedures; and review public hospital outpatient services to ensure that they are more closely designed around the needs of patients, including providing more of these services in community settings outside hospitals.
New arrangements for the dispensing and funding of pharmaceuticals may be required with increased emphasis on community settings e.g. increased use of the PBS. Integrating health and aged care services may improve the continuity of care and medication use post-discharge.
Modern, learning and supported workforce
Develop a new framework for the education and training of health professionals which moves towards a flexible, multi-disciplinary approach, and incorporates an agreed competency-based framework for all health professionals. The health workforce to be supported by effective communication across all parts of the health system; investing in management and leadership skills; and providing timely relevant data on comparative clinical performance and latest practice knowledge to support best practice and continuous quality improvement.
Hospital pharmacists may play an increasingly important role in a flexible multidisciplinary clinical team.
Improved communication and information on
clinical performance and best practice may
improve the quality use of medicines in
hospitals and reduce the likelihood of adverse
drug events.
Smart use of data, information and communication
Use an e-health agenda to drive improved quality, safety and efficiency of health care. Introduce a person-controlled electronic health record for each Australian.
A person-controlled electronic health record is seen as one of the most important systemic opportunities to improve the quality and safety of health care, reduce waste and inefficiency, and improve continuity of care and health outcomes for patients. Adverse drug events are expected to be reduced with a personal electronic health record as it will be easier to manage medicines and their interactions through having access to medical and medication histories.
Well-designed funding and strategic purchasing
To improve the efficiency of both public and private hospitals, introduce the use of efficient ‘activity-based funding’ for hospitals using casemix classifications.
Activity-based funding refers to making
payments on the basis of ‘outputs’ delivered
by health services. This funding model links
funding to the actual services provided such
as a separation, emergency department visit
or outpatient consultation. It allows funders to
compare costs across different health service
providers in providing the same health
service, and thus may lead to more efficient
use of pharmaceuticals in hospitals (noting
that implementation will require a measure of
efficiency).
Knowledge-led continuous improvement, innovation and research
Make the Australian Commission on Safety and Quality in Health Care a permanent national organisation.
The ACSQHC would promote a nationally consistent culture of safety and quality across the health system, analyse and report on safety and quality, and monitor and assist in its regulation.
Healthy Australia Accord
Change the funding arrangements for public hospitals and health care services, with the Commonwealth Government paying State/Territory Governments activity-based benefits for public hospital care and other public health care services.
Under this funding arrangement, the Commonwealth Government would pay 100 percent of the efficient cost of public hospital outpatient services with an agreed, capped activity-based budget; and 40 percent of the efficient cost of every public patient admission to a hospital, sub-acute or mental health care facility and every attendance at a public hospital emergency department (with the possibility of increasing this contribution over time). This would potentially change the balance of source of funding for hospital medicines.
Modelling Options for the Public Funding of Hospital Medicines in Australia
NATSEM March 2010
30
3 IDENTIFIED ISSUES WITH THE CURRENT SYSTEM AND OPPORTUNITIES
FOR REFORM
As described in the previous section, the funding and regulation of hospital medicines is complex and
fragmented. Several issues relating to the costs and funding of hospital medicines have been
identified as arising from this and will be discussed here. The system of regulation and funding of
hospital medicines has implications for the cost of medicines, equity of access and government
funding, the continuity of care and health outcomes and the work required to maintain the system.
3.1 CONTINUITY OF CARE AND HEALTH OUTCOMES
The division of funding and regulation of pharmaceuticals between the community and hospital
sectors in Australia has long been identified by pharmacists as an issue of concern in terms of health
outcomes (SHPA, 2008; Pfizer, 2008). Although data is somewhat limited, it suggests that a
substantial number of adverse drug events and admissions to hospital are attributable to confusion
surrounding the overlap of community and hospital care (SHPA 2008, Pfizer 2008). For example an
earlier study found that for 72 per cent of patients the list of medications prescribed by the hospital
at discharge differed from what the patient’s GP understood the patient to be taking before
admission (Mant et al 2000). The practice of patients’ ‘usual’ medications being provided by the
hospital while they are admitted along with enough for several days at discharge is a key source of
problems in this regard. Patients can become confused when taking home small amounts of
medications from the hospital, especially when they may look different or have different names to
what they are used to due to branding. Further, patients may be unable to get to the GP following
discharge before their supply runs out. Current ‘silo’ funding arrangements also prevent continuing
medication management being provided by hospital pharmacists on discharge, and it had been
suggested that such management would be useful in preventing adverse drug events following
discharge and smoothing the transition from hospital to home (SHPA, 2008).
3.2 COST SHIFTING
Cost shifting, especially between the Commonwealth and State governments, is commonly identified
as a problem with the current funding arrangements for medications in Australia (JATAG, 2009;
Pfizer, 2008; SHPA, 2008). It could be said to an extent that this is artificial as hospitals receive
around half their funding from the Commonwealth via the AHCA (Pfizer, 2008). However, it has been
suggested that there are in fact incentives to shift costs embodied in the system, leading to inequities
and inefficiencies (SHPA, 2008). First, there are incentives within public hospitals to shift inpatients to
outpatients in order to claim Commonwealth funding for medications. Second, the provision of
patients’ usual prescriptions while in hospital shifts this cost from the PBS to State funds, and then
back to the State at discharge.
Modelling Options for the Public Funding of Hospital Medicines in Australia
NATSEM March 2010
31
3.3 INEQUITIES OF ACCESS AND FUNDING
Across the hospital system, there are inequities of access to, and funding of, medications between
patients in public and private hospitals. Many patients in private hospitals are able to access the PBS
to cover drugs administered while they are in hospital, with the remainder being paid by the patient
themselves or by their insurer. In public hospitals the majority of drugs are covered by the State or
Territory government through the hospital’s budget. While the PBS is not capped, drugs used in
public hospitals are part of the hospital budget which is capped and many hospitals may need to stop
buying medications especially towards the end of financial year. Individual formularies in most
hospitals mean that the same drugs, or at least, the same brands of drugs are not available across all
public hospitals. As discussed in the previous section, it is common for drugs to be used for purposes
outside of their PBS indications in hospital, and in this case the drug is covered by the hospital
budget. However, if the patient were to continue using the drug outside of hospital, it would not be
covered by the PBS for this indication. In a private hospital, it is likely such a prescription would be
covered by the patient’s insurance or by the patient themselves.
3.4 VALUE FOR MONEY
A key issue surrounding the largely individual formularies for each public hospital is whether this
generates the best value for money in drug expenditure when each hospital must negotiate its own
price and supply of drugs. Arguably if formularies were put together at a national or state level, drugs
would be able to be purchased more cost effectively. However, as identified by Pfizer (2008), drug
manufacturers could face difficulties in meeting such supply demands, and the change in market
balance would have broad implications for competition and pricing. While efficiency is important,
drug efficacy also has to be kept in mind and that formularies need to offer choice in therapy as
some patients may not tolerate or respond to certain key medications in a therapeutic class.
3.5 DUPLICATION OF WORK
Further, the management of a formulary for each individual public hospital represents the
duplication of work. Arguably greater cost effectiveness would also be achieved by a national or state
level committee/s to formulate a national / state level drug list.
State and Commonwealth administrative procedures and requirements are also seen to impose
additional administrative activities that are often viewed to be unnecessary, a duplication and a
waste of resources.
Modelling Options for the Public Funding of Hospital Medicines in Australia
NATSEM March 2010
32
4 PROPOSALS FOR REFORM
Three key submissions were made to the NHHRC regarding the funding of hospital medicines and
their suggestions for reform are briefly outlined here. These suggestions provide examples of the
types of questions that would be desirable to ‘answer’ using a model such as that scoped in this
Report. Notably the SHPA (2008), the Joint Australian Therapeutic Advisory Group (2008) and Pfizer
(2008) submissions all include recommendations for collecting better data on pharmaceuticals used
in hospitals for enhanced analysis and planning. The submissions made to the Commission share
some similar broad aims including equitable access to medicines for all patients across the care
continuum and adherence to Quality Use of Medicines principles. However they differ in the reforms
they suggest to reach these aims, and also in some further aims and principles. Discussion with
interested stakeholders indicated that these options encompassed the majority of suggestions
regarding possible reform.
4.1 SOCIETY OF HOSPITAL PHARMACISTS OF AUSTRALIA (SHPA)
SHPA is the national professional organisation representing pharmacists, pharmacy technicians and
associates practicing in public and private hospitals and other health service facilities. SHPA has
compared five reform options, including the status quo, across a range of aims. The possible reform
directions analysed are as follows (SHPA, 2004 & 2008):
1. Continue the current implementation of Clause 35 of previous AHCA.
2. Expand the availability of medicines on the PBS to better suit the hospital environment e.g.
access to inpatients in public hospitals, revised pack sizes and access for inpatients.
3. Introduce a hospital specific PBS list i.e. additional medicines, indications, revised pack sizes
and access for inpatients.
4. The Australian government provides funding for all medicines used in hospitals (block
funding) and work towards systems to merge with the PBS.
5. The Australian government provides funding for all pharmacy services (clinical distribution
and management) including all medicines used in hospitals.
SHPA compare how each of these options with regard to an extensive range of objectives, including
(SHPA, 2008):
• Supports all patients: in public and private hospitals, non-admitted, inpatients and medicines
required on discharge
• Builds on local evaluation and monitoring systems used to promote the quality use of
medicines and manage the cost of medicines in hospitals
• Efficient distribution system for medicines
Modelling Options for the Public Funding of Hospital Medicines in Australia
NATSEM March 2010
33
• Meets the clinical needs of individual patients, this includes access to investigational
medicines and medicines for non registered indications
• Clinical governance
• Corporate governance
• Data collection, evaluation and review
• Equity of access and remove incentives for cost shifting
• Integration with community based PBS and other services
• QUM and patient safety
• Seamless to prescribers and patients
• Staffing requirements
• Teaching and research
• Technology requirements
• Impact on medicines industry
Comparing the expected outcomes of each of the options against these objectives, SHPA suggests
that Option 4 or 5 would be most desirable: either the Commonwealth provides funding for all
medicines used in hospitals, with a view towards merging the system to the PBS; or, the
Commonwealth provide funding for all pharmacy services (clinical distribution and management)
including all medicines used in hospitals.
We have selected Options 2 and 5 for evaluation in this study. In Option 5, both the acquisition costs
of medicines and the costs of the professional pharmacy services that accompany their use in
hospitals are funded together with funds from the Commonwealth. However, SHPA points out that
there will still be some medicines that will be funded by the hospital or third parties (e.g. medicines
used in clinical trials, new medicines prior to PBS listing or medicines for patients ineligible for
services through Medicare).
4.2 JOINT AUSTRALIAN THERAPEUTICS ADVISORY GROUPS (JATAG)
This was formally an individual submission to the NHHRC submitted by Charles Denaro, Chair of
JATAG (Denaro, 2008). While the document was not vetted by all stakeholders in the Joint TAGs, it
did reflect many ideas canvassed by JATAG and thus we label these reform ideas as those of ‘JATAG’
rather than Assoc. Professor Denaro. In addition to a range of suggested administrative reforms, the
major reform suggested that is relevant to this Report is the move towards a national formulary and
establishment of a national committee to administer this.
The submission states that this proposal would:
Modelling Options for the Public Funding of Hospital Medicines in Australia
NATSEM March 2010
34
‘in one single blow – eliminate the current inequity of access to high-cost pharmaceuticals that is occurring
across the country, stop cost-shifting and its inherent waste, allow patients to be discharged from hospital
with adequate supplies of medications, would allow health professionals moving from one institution to
another to work with the same set of medications, policies and procedures’ (Denaro, 2008, p2)
A key issue underlying JATAG’s call for reform is the need for improved and detailed pharmaco-
economic evaluation of pharmaceuticals to assist in the decision-making on their listing on hospitals’
(or State) drug formularies. This currently occurs with drugs submitted for listing on the PBS. JATAG
indicates that many high-cost pharmaceuticals are suited for in-hospital or public hospital use and
are unlikely to be considered by the Pharmaceuticals Benefits Advisory Committee (PBAC), or will
have been rejected for PBS-listing on cost-effectiveness grounds. Denaro states ‘the decision to list
such pharmaceuticals on hospital formularies is haphazard across the country and in many instances,
decisions are made at a local hospital level’ (Denaro, 2008, p1). As a result of this variable decision-
making process, access to medicines – especially high cost drugs – in hospitals is inequitable across
the country and cost-shifting between hospital services and between State and Commonwealth is
common. This results in wastage of resources in unnecessary bureaucratic processes and duplication
of work, and in many cases value for money in purchasing medications is not achieved.
In the ‘JATAG’ call for reform, it is also suggested that the lack of uniformity in hospital formularies
impacts on patient safety through the risk of adverse drug events. When doctors, nurses or
pharmacists move from one institution to another, or between the public and private sector, they
may face different formulary listings, different methods for prescribing, and different hospital
policies and procedures which may impact on the prescribing and safe dispensing of medicines.
A single national formulary for all public hospitals would require the Commonwealth to fund the cost
of all pharmaceuticals in hospitals. This proposal is equivalent to SHPA’s Option 3 ‘a hospital specific
PBS list’.
4.3 PFIZER AUSTRALIA
Pfizer’s submission summarises and analyses a range of current and past reform suggestions but with
a focus on two of NHHRC’s principles ‘value for money’ and ‘responsible spending on health’.
Pfizer defines eight principles relating to funding and five relating to the safe, appropriate and
effective use of medicines in hospitals that they feel should govern any reforms, and compare past
and current reform suggestions against these objectives. The principles for reform identified by Pfizer
are as follows (Pfizer 2008):
Funding principles
1. Ensuring access to medicines for all Australians in hospital
2. Creating harmony between the hospital and community funding systems
3. Maintaining the integrity of the PBS and RPBS
Modelling Options for the Public Funding of Hospital Medicines in Australia
NATSEM March 2010
35
4. Preserving individual hospitals’ ability to select their own formularies to meet their local
needs
5. Selecting medicines should involve assessing their clinical benefits, not just their cost
6. Exploring better use of medicines data to establish hospital budgets
7. Reducing unnecessary administration
8. Formalising the funding of medicines by private health insurers
Quality principles
9. Enhancing the role of hospital pharmacists and specialist physicians
10. Linking funding of medicines to quality improvement
11. Funding research into medicines and their use
12. Providing the infrastructure necessary for safe and effective medicine use
13. Implementing APAC guidelines
Pfizer then discusses the merit of the following proposed reforms with regard to these principles
(Pfizer, 2008):
1. The Australian government should pay for all public hospital medicines (e.g. SHPA Option 5)
2. The extension of the PBS to cover all hospital medicines (e.g. SHPA Option 2)
3. All hospitals use an identical medicines lists [formulary], funded by the Commonwealth (e.g.
SHPA option 3 or JATAG proposal)
4. The Commonwealth reimburses all medical services via a voucher system (as general
practitioners are reimbursed in the community).
Pfizer highlights potential problems with each of these proposed reforms, and notably rejects the
idea of a national formulary, highlighting the issue that manufacturers, both big and small, would
have trouble meeting supply for the entire nation, and that companies that did not make the list
would likely collapse with broad implications for competition and pricing. Extending the PBS is
attractive although like SHPA and JATAG, Pfizer notes that a number of problems would need to be
overcome in this approach also. Pfizer identifies some advantages associated with the voucher
system, although they believe it would be difficult to administer. Its key advantage is it would
eliminate the funding difference between public and private hospitals. The Commonwealth would
provide equal baseline for both, but private hospitals would be free to charge additional fees for
extra services.
Of the four reform options reviewed by Pfizer, Options 1-3 are already covered in the two SHPA
proposals and that by JATAG. The voucher system essentially aims to extend ‘Medicare’ type funding
arrangements into hospitals. Given this focuses on broader issues of funding hospital costs – not just
those associated with the acquisition of medicines and associated hospital pharmacy costs - this will

Modelling Options for the Public Funding of Hospital Medicines in Australia
NATSEM March 2010
36
option will not be examined here. However, it can be noted that this proposal calls for the
Commonwealth Government to become the primary funder of hospital services, medicines being one
component of total costs, and as such has some similarities to the SHPA Option 5 or Pfizer’s Option 1
– a key difference being the opportunity of ‘gap’ payments or above scheduled fees for extra
services, and the funding being activity-based i.e. funding is tied to the services provided as
advocated by the NHHRC.
Modelling Options for the Public Funding of Hospital Medicines in Australia
NATSEM March 2010
37
5 CONSTRUCTING A SYSTEM DYNAMICS MODEL OF THE HOSPITAL
MEDICINES SYSTEM
5.1 MODELLING APPROACH
Hospital medicines are funded, acquired, prescribed and consumed within a system driven by cause
and effect, and is characterised by complex ideas and information. The ‘hospital medicines system’ is
a complex system in that it is highly coupled with dynamic processes that play out over time, has
feedback effects and many outcomes resulting from the interactions that occur between its many
parts.
System dynamics modelling was first developed in the 1950s as a method to enhance the
understanding of the functioning and to analyse the behaviour of complex systems over time, now
with the help of computer simulation (Homer and Hirsch, 2006; Lyell et al, 2008). This approach
involves key system variables, the interactions between them through feedback loops, and the study
of the effects of these interactions over time. Coyle (1996, p. 10) defines system dynamics as follows:
‘System dynamics deals with the time-dependent behaviour of a managed system with the aim of
describing the system and understanding, through qualitative and quantitative models, how information
feedback governs its behaviour, and designing robust information feedback structures and control policies
through simulation and optimization’.
Time delays, feedback loops, stocks and flows10, simulation and optimization are the central concepts
in a system dynamics approach (Kirkwood, 1998). Coyle (2000) describes 3 stages of system dynamics
modelling:
1. description of the system by some type of diagram (e.g. process maps, a feedback and causal
loop diagram that links the stocks and flows and sources of information as a graphical
notation for representing the system structure);
2. study of the diagram (checking its suitability for the problem, specification of system
boundaries, coverage, logic etc.); and
3. quantification (write equations that determine the flows and interactions, estimate
parameters and initial conditions, simulate the model and analyse results).
The changing value (behaviour) of one stock (variable) may cause another to change as described by
equations and algorithms. Model parameters are established by analysing real data on actual
linkages or cause and effect relationships existing at a particular point. Each stock becomes a variable
that identifies a quantifiable property of the system that changes over time. Each connecting line can
have equations or rules that formalise how one variable affects another. The aim is to establish a
predictive framework that allows you to assess changes in target variables and outcomes by changes
in specific explanatory variables and processes, for example, to be able to predict the cost of hospital
medicines and use of clinical pharmacy services from other system attributes.
10 A stock is any entity that accumulates or depletes over time. A flow is the rate of change in the stock.
Modelling Options for the Public Funding of Hospital Medicines in Australia
NATSEM March 2010
38
Quantitative modelling is the common practice in system dynamics modelling but Coyle suggests
qualitative modelling can also be carried out using a system dynamics approach. An illustration of
qualitative or ‘soft’ variables can be found in the system dynamics sub-model of elective care in
England, owing to the lack of hard statistics (Royston et al. 1999). Coyle (2000), however, cautions
that quantification of essentially qualitative or soft variables, such as motivation, can increase
uncertainty in the results.
The utility or power of system dynamics modelling is its simulation capabilities for testing what if
scenarios. While initially developed to help corporate managers to improve their understanding of
industrial processes, system dynamics is now being used widely for policy analysis, including
application in the health field. There are now a number of applications of system dynamics to model
issues related to various health care sub-systems in Australia, including a model of hospital
medication errors by McDonnell and Heffernan (2005) and national medicines use (PBS
drugs)(Heffernan et al, 2004). In the first of these, the model represented the interactions among the
key determinants of medication errors, including the complex interactions of patients and staff,
information, medications, work practices (including the potential impacts of information and
communication technology on work behaviour) and the infrastructure and policies within a hospital
environment. This model included qualitative variables such as the quality of interaction. In the
second paper, Heffernan and colleagues replicated the demographic projections of first (2002) IGR
report and extended the model by incorporating additional detail on medicines use such as drivers of
new drug use, feedback of benefits of medicines use on macroeconomics, and structural changes in
over, under and misuse of medicines over the next four decades. A further example is that by Gray
et al. (2006) who used a system dynamics model enhanced by agent-based modelling techniques to
simulate interactions between the acute and aged case systems in Australia. As these researchers
comment ‘computer simulations offer an inexpensive, low risk method to test the impact of policy
options in health care’ (p450).
5.2 DATA SOURCES
There is a broad range of data that ideally is required to populate the system dynamics model. This
Section describes various available datasets providing information that could possibly be useful for the
modelling of the funding and use of hospital medicines. Most of these statistical collections do not
routinely provide data at the fine level required for the modelling. Customised data requests would
need to be made and it is questionable whether unit record data (e.g. at the level of individual
hospitals) would be made available. However, the data that is publicly available suggests that the level
of data may possibly exist if access to this could be granted.
A combination of datasets would need be used to build the model equations and populate the different
stages of the model.
5.2.1 National Hospital Cost Data Collection
The Department of Health and Ageing’s National Hospital Cost Data Collection (NHCDC) database has
been identified as perhaps the most useful dataset for this model, and a preliminary analysis is
Modelling Options for the Public Funding of Hospital Medicines in Australia
NATSEM March 2010
39
provided in Section 6. This Section describes the characteristics of the publicly available dataset
which would be useful to the modelling. However, if a higher level of detail could be made available
then this would be even more useful to the model.
The NHCDC contains cost and activity data from both public and private acute care hospitals across
Australia (DoHA 2008a). The most recent round of published results (2006-07) were based on
responses from 47per cent of all public hospitals and 36per cent of all private hospitals, spanning
86per cent and 59 per cent of public and private acute separations respectively.
A range of hospital groupings are provided for the purposes of comparison across cost components,
including number of separations, average length of stay, total days stay, the average total cost per
separation and a detailed break down of the components of this cost (including pharmacy) and
within these their direct and overhead components, by 666 Diagnosis Related Groups (DRGs). DRG
cost weights (the average cost of respective DRGs relative to the average cost of all separations) are
produced using the NHCDC, for public and private hospitals, peer groups, teaching and non-teaching
hospitals, major urban and non-major urban hospitals, and the five biggest States (NSW, Victoria,
Queensland, South Australia and Western Australia). Public hospital funding is commonly allocated
using these weights, such that establishment funding is relative to the frequency of separations for
each DRG multiplied by associated cost weights. This funding allocation process motivates public
hospitals to maintain costs at levels similar to their peers, after accounting for differences in case
mix. Peer groups are also derived from the NHCDC for the purposes of cost per case mix-adjusted
separation analysis (comparing the costs and activities) across hospitals with similar levels of activity.
Cost data is included for private hospitals also, however, comparison of this data with that for public
hospitals is problematic as the range of costs incurred across the two sectors are inherently different.
For example, a large share of medical and pharmaceutical expenditure in private hospitals is billed
directly to patients, which are subsequently not included in the NHCDC.
The summary data provided in Table 5 quantifies the extent of these differences by comparing the
percentage of total costs allocated to each cost component (also referred to as cost buckets), and the
ratio of these costs, across the public and private sectors. As shown in the three final columns, cost
ratios for thirteen of the sixteen components differ by more than 1.5 times or 150 per cent between
the public and private sector, whether in terms of direct costs, overhead costs or both. Considerable
caution thus needs to be exercised when comparing average costs between the public and private
sectors.
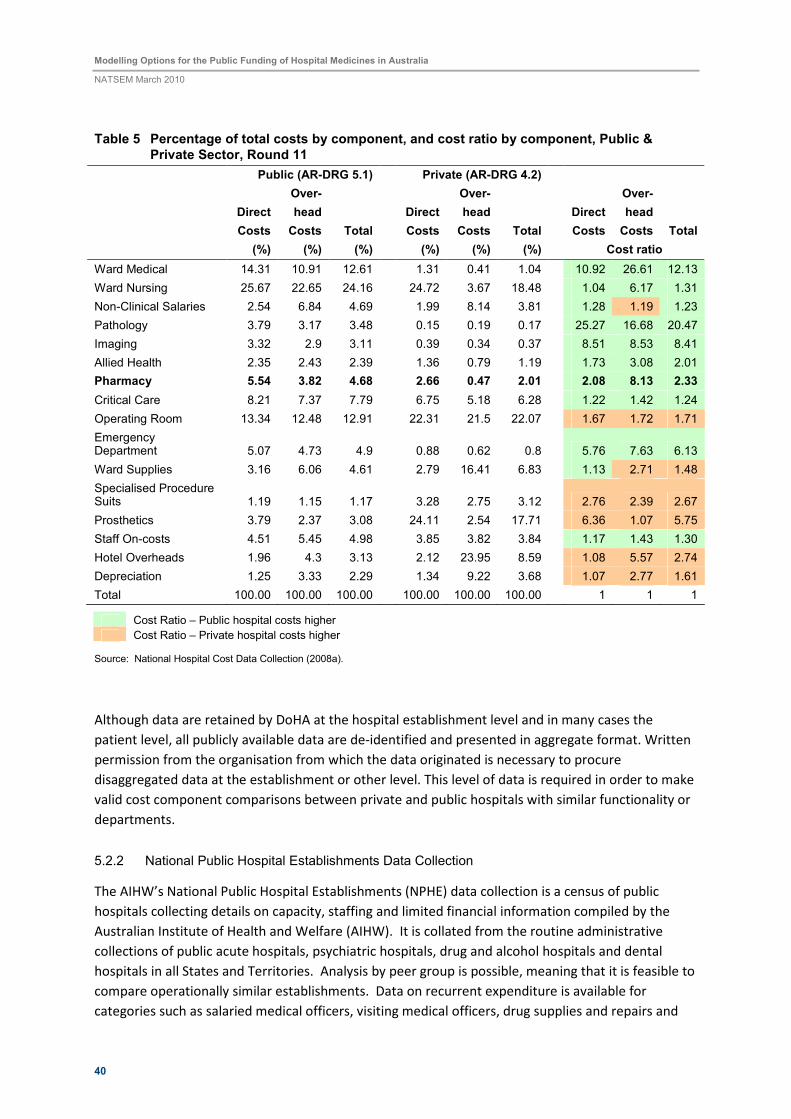
Modelling Options for the Public Funding of Hospital Medicines in Australia
NATSEM March 2010
40
Table 5 Percentage of total costs by component, and cost ratio by component, Public & Private Sector, Round 11
Public (AR-DRG 5.1) Private (AR-DRG 4.2)
Direct
Costs
Over-
head
Costs Total
Direct
Costs
Over-
head
Costs Total
Direct
Costs
Over-
head
Costs Total
(%) (%) (%) (%) (%) (%) Cost ratio
Ward Medical 14.31 10.91 12.61 1.31 0.41 1.04 10.92 26.61 12.13
Ward Nursing 25.67 22.65 24.16 24.72 3.67 18.48 1.04 6.17 1.31
Non-Clinical Salaries 2.54 6.84 4.69 1.99 8.14 3.81 1.28 1.19 1.23
Pathology 3.79 3.17 3.48 0.15 0.19 0.17 25.27 16.68 20.47
Imaging 3.32 2.9 3.11 0.39 0.34 0.37 8.51 8.53 8.41
Allied Health 2.35 2.43 2.39 1.36 0.79 1.19 1.73 3.08 2.01
Pharmacy 5.54 3.82 4.68 2.66 0.47 2.01 2.08 8.13 2.33
Critical Care 8.21 7.37 7.79 6.75 5.18 6.28 1.22 1.42 1.24
Operating Room 13.34 12.48 12.91 22.31 21.5 22.07 1.67 1.72 1.71
Emergency Department 5.07 4.73 4.9 0.88 0.62 0.8 5.76 7.63 6.13
Ward Supplies 3.16 6.06 4.61 2.79 16.41 6.83 1.13 2.71 1.48
Specialised Procedure Suits 1.19 1.15 1.17 3.28 2.75 3.12 2.76 2.39 2.67
Prosthetics 3.79 2.37 3.08 24.11 2.54 17.71 6.36 1.07 5.75
Staff On-costs 4.51 5.45 4.98 3.85 3.82 3.84 1.17 1.43 1.30
Hotel Overheads 1.96 4.3 3.13 2.12 23.95 8.59 1.08 5.57 2.74
Depreciation 1.25 3.33 2.29 1.34 9.22 3.68 1.07 2.77 1.61
Total 100.00 100.00 100.00 100.00 100.00 100.00 1 1 1
Cost Ratio – Public hospital costs higher
Cost Ratio – Private hospital costs higher
Source: National Hospital Cost Data Collection (2008a).
Although data are retained by DoHA at the hospital establishment level and in many cases the
patient level, all publicly available data are de-identified and presented in aggregate format. Written
permission from the organisation from which the data originated is necessary to procure
disaggregated data at the establishment or other level. This level of data is required in order to make
valid cost component comparisons between private and public hospitals with similar functionality or
departments.
5.2.2 National Public Hospital Establishments Data Collection
The AIHW’s National Public Hospital Establishments (NPHE) data collection is a census of public
hospitals collecting details on capacity, staffing and limited financial information compiled by the
Australian Institute of Health and Welfare (AIHW). It is collated from the routine administrative
collections of public acute hospitals, psychiatric hospitals, drug and alcohol hospitals and dental
hospitals in all States and Territories. Analysis by peer group is possible, meaning that it is feasible to
compare operationally similar establishments. Data on recurrent expenditure is available for
categories such as salaried medical officers, visiting medical officers, drug supplies and repairs and
Modelling Options for the Public Funding of Hospital Medicines in Australia
NATSEM March 2010
41
maintenance. However, with both the public data cubes and AIHW standard reports, expenditure
data is only available by State and Territory (not type of hospital).
Some data is publicly available in data cubes and requests can be made to access extracts of the data
at a unit (hospital) record level. The available data cubes contain data on capacity measures including
number of hospitals, number of beds, separations, bed days and occasions of service and financial
and staffing measures. The data is also largely published in the annually updated publication
Australian Hospital Statistics (see AIHW 2008 for 2006-07 data) which also includes summary tables
on public hospital recurrent expenditure and revenues.
The data also includes:
Types of services:
• Specialised service indicators (a broad range of indicators relating to sections of the
hospital for example including obstetric/maternity service, specialist paediatric service,
psychiatric unit/ward, intensive care unit etc).
• Type of non-admitted patient occasions of service (for example accident and emergency,
dialysis, pathology, radiology and organ imaging)
• Type of admitted patient episode (for example mental health, alcohol and drug, nursing
home type, rehabilitation etc).
Administrative data:
• Full time equivalent staff: Salaried medical officers, registered nurses, enrolled nurses,
student nurses, trainee/pupil nurses, other personal care staff, diagnostic and health
professionals, administrative and clerical staff, domestic and other staff
• Number of hospitals
• Number of available beds for admitted patients
Establishment data:
• State or territory of the hospital
• Sector (public hospitals only)
• Charging status (public patients, private patients, DVA patients, compensable and ineligible
patients)
Financial data:
• Total revenue
• Patient revenues
• Recoveries
• Other revenues
• Total expenditure
• Total salaries and wages expenditure by staffing categories
• Total non-salary expenditure (payments to visiting medical officers, drug supplies,
superannuation payments, medical and surgical supplies, food supplies, domestic services,
repairs and maintenance, patient transport, administrative expenses, interest payments,
depreciation, other recurrent expenditure)
• Average admitted patient cost proportion
Quality of care (relative stay index):
• Number of Separations from public hospitals for admitted patients
• Number of Patient days for admitted patients
Demographic data:
• Sex
• Age group (in 5-year groups)
• Indigenous status
Modelling Options for the Public Funding of Hospital Medicines in Australia
NATSEM March 2010
42
As data is collected by each hospital, the actual definitions used by the data providers may vary from
year to year and between jurisdictions and sectors. Comparisons between the States and Territories,
reporting years and hospital sectors should be therefore made with caution.
5.2.3 National Hospital Morbidity Database
The AIHW’s National Hospital Morbidity Database (NHMD) is a comprehensive census of hospital
separations across both the public and private sectors. This database is compiled by the AIHW from
data supplied by the State and Territory health authorities and is a collection of records for admitted
patients separated from public and private hospitals in Australia. Cost data is not available restricting
analysis to epidemiological and administrative metrics. Cross-tabs are publicly reported for a range
of variables, including comparisons between the public and private sector for some variables and
metrics. However, the data cubes do not permit any more detailed comparisons to be made
between the public and private sectors. While requests can be made for either custom data extracts
or access to the unit records upon which the collection has been built, this is likely to involve the
need to obtain clearance from individual State and Territory authorities which may impose their own
restrictions on the use of their data.
This dataset includes information on:
Clinical data
• Urgency of admission
• Principal diagnosis (the diagnosis established after study to be chiefly responsible for
occasioning the patient's episode of care in hospital)
• Additional diagnoses (include co-existing conditions and/or complications)
• Procedures (surgical and non-surgical)
• Major Diagnostic Category (MDC) and Australian Refined Diagnosis Related Group (AR-DRG)
• Care type (for example acute, rehabilitation, palliative, newborn) (from 1995-96 for some
jurisdictions; the newborn category was introduced in 1998-99)
• Admission mode (source from which the person was transferred/referred)
• Separation mode (status at separation: discharge/transfer/death and place to which person
is released)
• Intended length of stay (same day or overnight)
• External causes of injury or poisoning
• Places of occurrence of external cause
• Activity when injured (from 1998-99)
Establishment data
• State or territory of the hospital (NSW, VIC, QLD, WA, SA, TAS, ACT, NT)
• Sector (public/private hospital)
• RRMA (Rural, Remote and Metropolitan Areas) and other characteristics of the hospital (for
public hospitals only) (from 1995-96)
• ARIA (Accessibility/Remoteness Index of Australia) of the hospital (from 1998-99, and only
for some jurisdictions)
• Remoteness Area of the hospital (from 2000-01).
Financial data
• Estimated average cost for the AR-DRG (for the public and private sectors)
Modelling Options for the Public Funding of Hospital Medicines in Australia
NATSEM March 2010
43
Quality of care-Length of stay data
• Admission and separation dates
• Leave days
• Same day flag (to indicate separation/discharge on the same day as admission)
Patients: Demographic data
• Sex
• Date of birth
• Age, age group (in 5-year groups)
• Country of birth (from 1996-97)
• Indigenous status
• State and local area of residence (Statistical Local Area, Statistical Subdivision, Statistical
Division; from 1997-98)
• RRMA Rural (Remote and Metropolitan Areas) of patient's residence (from 1995-96)
• Remoteness Area of patient's residence (from 2000-01).
Details on Source of funding
• Funding source data elements including Admitted patient election status, Funding source
for hospital patient, Department of Veterans' Affairs patient and Medicare eligibility status
5.2.4 Private Hospital Establishment Collection
Information on private hospitals is compiled by the ABS (not AIHW as for public hospitals). The ABS’s
Private Hospital Establishment Collection contains statistical information for 1992-93 to 2006-07
financial years, obtained from an annual census of all licensed private hospitals in Australia. It
contains details about the facilities, activities, staffing and finances of all private hospitals, including
both private acute and/or psychiatric hospitals and free-standing day hospital facilities.
The dataset includes information on:
Clinical data:
• Number of separations
• Number of patient days for admitted patients
• Average length of stay for admitted patients
• The average number of sessions per operating theatre per week
• The total number of procedures
• Principle diagnosis
• Mode of Separation
• Occasions of service in non-admitted patients services (value)
• Major diagnostic category
• Procedure
• External causes of principle diagnose
• Specialized units: Neonatal Intensive Care unit (level II, level III), Separate Intensive Care
Unit and/or separate Coronary Care Unit, Combined Intensive/coronary care units, High
dependency unit, Rehabilitation unit, Hospice care unit.
Administrative data:
• Number of hospitals
• Number of hospitals with operating theatres, number of operating theatres
• Number of hospitals with dedicated day surgery units, number of dedicated day surgery
units
• Number of available beds for admitted patients
Modelling Options for the Public Funding of Hospital Medicines in Australia
NATSEM March 2010
44
• Full time equivalent staff : Salaried medical officers, Registered nurses, Enrolled nurses,
Student nurses, Trainee/pupil nurses, Other personal care staff, Diagnostic and health
professionals, Administrative and clerical staff, Domestic and other staff.
Establishment data:
• State or territory of the hospital (NSW, VIC, QLD, WA, SA, TAS, ACT, NT)
• Sector (Acute hospitals and Psychiatric hospitals; Free-standing day hospital facilities)
Financial data:
• Patient revenues
• Recoveries
• Total expenditure
• Total salaries and wages expenditure by staffing categories
• Total non-salary expenditure (Payments to visiting medical officers, Superannuation
payments, Drug supplies, Medical and surgical supplies, Food supplies, Domestic services,
Repairs and maintenance, Patient transport, Administrative expenses, Interest payments,
Depreciation, Other recurrent expenditure)
Average admitted patient cost proportion:
• The proportion of patient separations reported as being covered by hospital insurance
Demographic data:
• Sex
• Age group (in 5-year groups)
• Election status (public and private patients, self-paying patients)
Details on source of funding:
• Election status (public and private patients, self-paying patients)
5.2.5 IMS Health Pharmaceutical Sales Data
IMS Health Australia Pty Ltd collects confidential data on ‘warehouse’ sales of pharmaceuticals to
community (retail) and hospital pharmacies in Australia. These data can be purchased by interested
clients (or accessed through third party access agreements). Their National Hospital Audit database
contains information at the national level on pharmaceutical sales available by manufacturer,
products, packs, molecule, and therapeutic class. IMS Health records both the volume (number of
units sold) and the dollar value of the sales. The data are available by month, and although it is
collected for both public and private hospitals, it is not broken down by sector in the national
hospital audit. While it may be possible to aggregate sales by State/Territory, it is not routinely
collated by jurisdiction.
Given the aggregated nature of this dataset, it is unlikely that it could contribute significantly in the
model development. However, one advantage is that it can provide information on the use and cost
of pharmaceuticals by hospitals by therapeutic class. The cost of pharmaceuticals vary significantly
among the different therapeutic classes, hence a hospital’s casemix will impact on its overall
pharmaceutical budget.
5.2.6 Quality and Safety of Hospital Care – Adverse Drug Events
Adverse drug events are one performance indicator for monitoring and assessing the quality and
safety of hospital care. Adverse drug events can include inappropriate dosages, inappropriate
combinations of drugs and use of drugs not recommended for a particular age group (Burgess et al,
2005; Roughead and Semple, 2009). Under the National Health Performance Framework, ‘safety’ has
Modelling Options for the Public Funding of Hospital Medicines in Australia
NATSEM March 2010
45
been defined in terms of the avoidance or reduction to acceptable limits of actual or potential harm
from health care management or the environment in which health care is delivered (AIHW 2009).
Similar definitions are commonly used (Runciman, 2006) - the former Australian Council for Safety
and Quality in Health Care, now succeeded by the Australian Commission for Safety and Quality in
Health Care (ACSQHC) defined safety as the degree to which potential risk and unintended results
are avoided or minimised (www.aihw.gov.au/safequalityhealth/definitions.cfm). From this
perspective, an adverse event is an incident in which harm results to a person receiving health care
(Runciman, 2006; AIHW 2009). Thus, an adverse drug event is any incident involving a medicine that
causes harm to the patient. They include harm that results from known adverse drug reactions,
medication errors or system failures associated with the manufacture, distribution or use of
medicines (NPS, 2009; Roughead and Semple, 2009). At an aggregate level, ‘quality’ is assessed in
terms of the extent to which a health care service or product produces a desired outcome. At a more
detailed level, as described in the National Health Performance Framework, quality is seen as a
guiding principle in assessing how well the health system is performing in its mission to improve the
health of Australians (www.aihw.gov.au/safequalityhealth /definitions.cfm).
The Australian Commission for Safety and Quality in Health Care (ACSQHC) was established 1 January
2006 to provide national leadership in health care safety and quality (www.aihw.gov.au/
safequalityhealth/aust_stats.cfm). The ACSQHC publishes a number of reports which provide a
general picture of adverse drug events in Australia but has limited data which could be used in
quantifying the system dynamics model.
The Australian Council on Healthcare Standards (ACHS) is an independent private sector not-for-
profit organisation which aims to improve the quality of health care in Australia through the ongoing
review of performance, assessment and accreditation (www.aihw.gov.au/safequalityhealth/aust_
stats.cfm). The ACHS publishes a clinical indicator report based on its Clinical Indicator Program (CIP)
(ACHS, 2008). The CIP is a service offered to public and private hospitals in Australia and New
Zealand. The CIP has a large number of clinical indicators, ranging across 23 different areas and
includes information on selected adverse events, adverse drug reactions being one of these. In 2006,
some 159 hospitals provided data on eight clinical indictors for adverse drug events but only two
related to non-specific adverse drug reactions, the other six relating to the drug Warfarin. In
addition, the Productivity Commission has highlighted a number of weaknesses with this source of
data:
• participation in the CIP is voluntary, and so the sample may not be representative;
• the number of reporting hospitals is often small, and so sample sizes may not be sufficient
to reach robust conclusions about the relative performance of the public and private
hospital systems; and
• the ACSQHC review raised concerns about data collection and validation methods used for
the CIP (Productivity Commission, 2009a).
The ACHS is not prescriptive about how participating organisations collect their data and there is no
requirement that an organisation monitors a specific number of indicators. However, they must
ensure that the data they do collect are in strict accordance with the specified definitions in order to
provide consistency in the data submitted to ACHS.
The best source of data to examine adverse drug events as a system outcome measure appears to be
AIHW’s National Hospital Morbidity Database (as described above). Using specific ICD-10-AM codes,
Modelling Options for the Public Funding of Hospital Medicines in Australia
NATSEM March 2010
46
it is possible to extract adverse event data for both public and private hospitals from the NHMD. The
NHMD separations data include ICD-10-AM diagnoses, places of occurrence, and external causes of
injury and poisoning which indicate that an adverse event was treated and may have occurred during
the hospital admission (AIHW, 2009). However, other ICD-10-AM codes may also indicate that an
adverse event occurred or was treated, and some adverse events are not identifiable using these
codes i.e. it is likely that the data will be an underestimate as adverse events that are not explicitly
described or recorded in hospital medical records will not be ascribed to the ICD-10-AM codes. The
data contained in the NHMD collection should therefore be interpreted as representing selected
adverse events that have resulted in, or have affected, hospital admissions, rather than all adverse
events that occurred in hospitals (AIHW, 2009).
ICD-10-AM codes Y40-Y59 (within Chapter XIX Injury, poisoning and certain other consequences of
external causes) identify separations with an external cause coded as an adverse effect caused by
‘drugs, medicaments or biological substances in therapeutic use’. These hospital stays represent
those caused by an adverse drug event as a complication of medical and surgical care. However, the
AIHW states in its 2009 publication ‘Australian Hospital Statistics 2007-08’ that ‘the data [on adverse
events] for public hospitals are not comparable with the data for private hospitals because their case
mixes differ and recording practices may be different’ (pg 53).
Unfortunately, the AIHW does not routinely report on this specific category of hospital separations,
favouring the broader category of ‘complications of medical and surgical care’ (ICD-10-AM codes
Y40-Y84) and data on adverse drug event separations are suppressed on the NHMD online data cube.
However, customised requests can be made to the AIHW to get Y40-Y59 separations broken down by
a range of variables e.g. age and gender, hospital peer group, or State and Territory (conditional on
sample size).
In addition, the ABS also uses the ICD-10-AM codes Y40-Y59 to report the annual number of deaths
in Australia caused by adverse drug events in hospitals. Again only aggregate numbers are readily
accessible and the small numbers limit the extent of disaggregation by other variables.
5.3 CAUSAL LOOP DIAGRAM OF THE HOSPITAL MEDICINES SYSTEM
In this Section we describe the causal loop diagram (CLD) (visual representation of the system
dynamics model) of the current system of hospital medicines. As discussed in Section 5.1, the CLD
identifies the key agents/elements in the system, the interactions and feedbacks that link them, and
the system outcomes that are of interest.
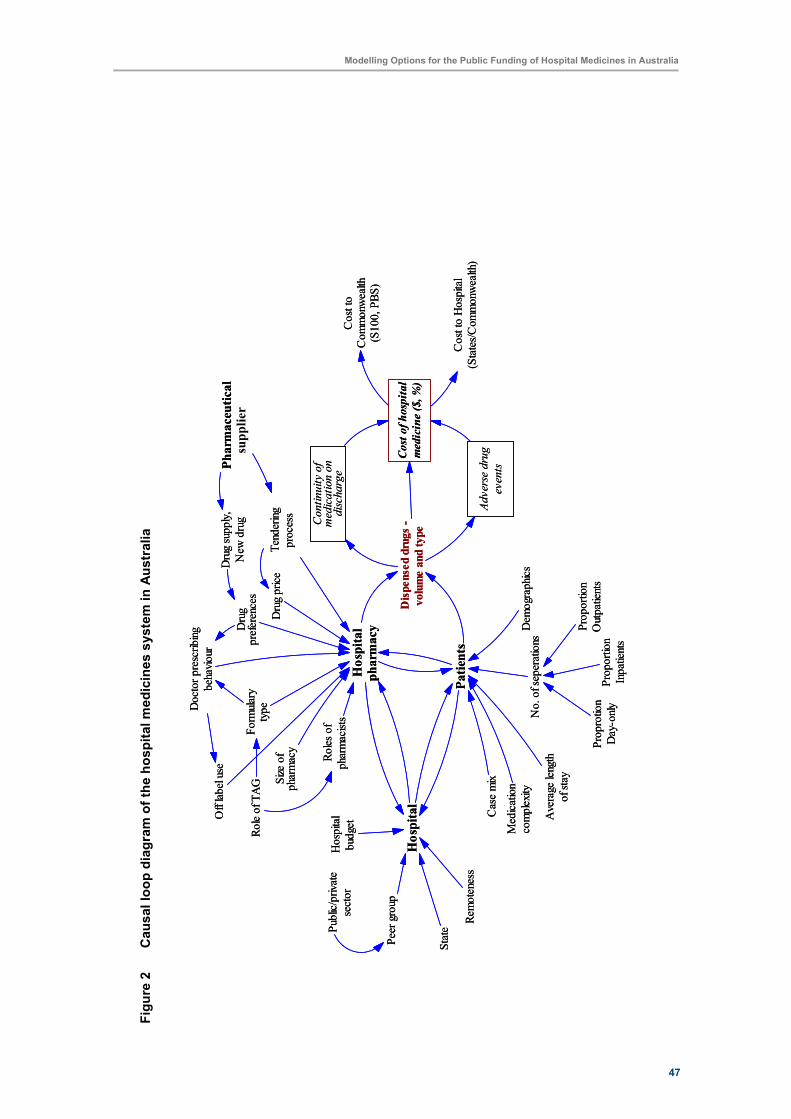
47
Modelling Options for the Public Funding of Hospital Medicines in Australia
Fig
ure
2
Causal lo
op d
iagra
m o
f th
e h
ospital m
edic
ines s
yste
m in A
ustr
alia
Cost of hospital
medicine ($, %)
Adverse drug
events
Continuity of
medication on
discharge
Hospital
pharmacy
Formulary
type
Case mixSize of
pharmacy
Roles of
pharmacists
Drug price
Drug
preferences
Tendering
process
Patients
No. of seperations
Proportion
Inpatients
Proportion
Outpatients
Proprotion
Day-only
Demographics
Hospital
Peer group
StatePublic/private
sector
Remoteness
Hospital
budget
Dispensed drugs -
volume and type
Cost to
Commonwealth
(S100, PBS)
Cost to Hospital
(States/Commonwealth)
Average length
of stay
Drug supply,
New drug
Medication
complexity
Doctor prescribing
behaviour
Off label use
Role of TAG
Pharmaceutical
Industry
supplier
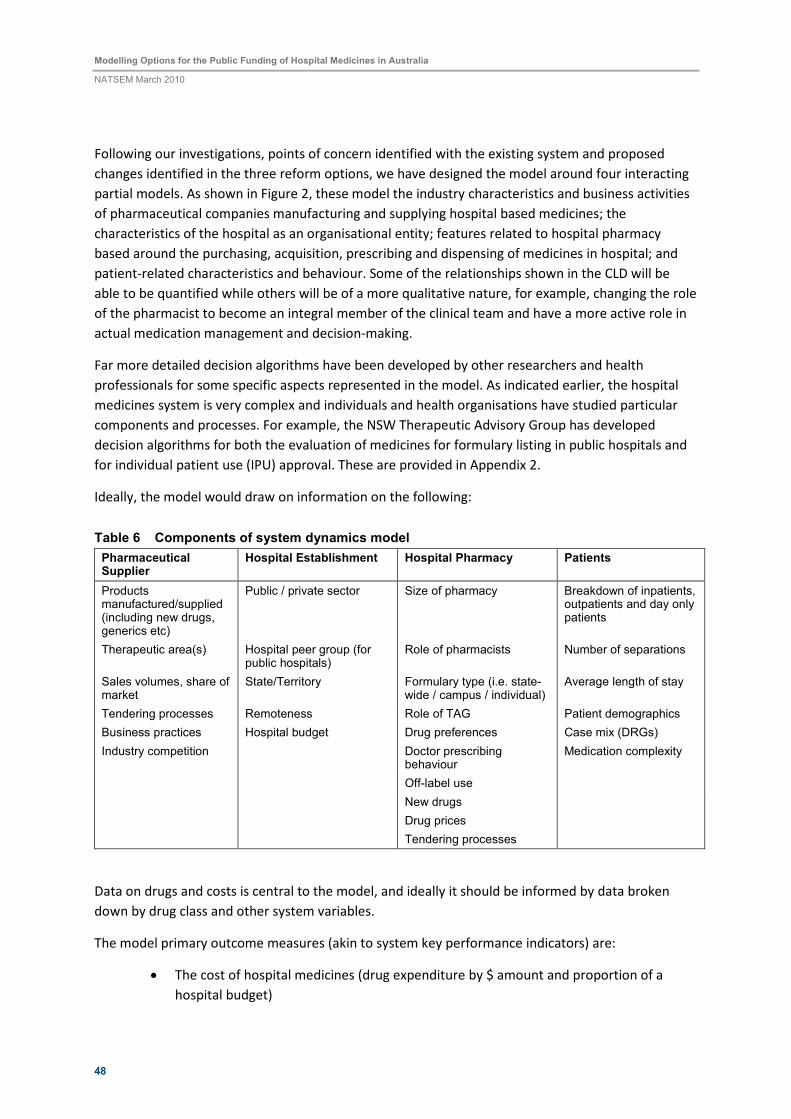
Modelling Options for the Public Funding of Hospital Medicines in Australia
NATSEM March 2010
48
Following our investigations, points of concern identified with the existing system and proposed
changes identified in the three reform options, we have designed the model around four interacting
partial models. As shown in Figure 2, these model the industry characteristics and business activities
of pharmaceutical companies manufacturing and supplying hospital based medicines; the
characteristics of the hospital as an organisational entity; features related to hospital pharmacy
based around the purchasing, acquisition, prescribing and dispensing of medicines in hospital; and
patient-related characteristics and behaviour. Some of the relationships shown in the CLD will be
able to be quantified while others will be of a more qualitative nature, for example, changing the role
of the pharmacist to become an integral member of the clinical team and have a more active role in
actual medication management and decision-making.
Far more detailed decision algorithms have been developed by other researchers and health
professionals for some specific aspects represented in the model. As indicated earlier, the hospital
medicines system is very complex and individuals and health organisations have studied particular
components and processes. For example, the NSW Therapeutic Advisory Group has developed
decision algorithms for both the evaluation of medicines for formulary listing in public hospitals and
for individual patient use (IPU) approval. These are provided in Appendix 2.
Ideally, the model would draw on information on the following:
Table 6 Components of system dynamics model
Pharmaceutical Supplier
Hospital Establishment Hospital Pharmacy Patients
Products manufactured/supplied (including new drugs, generics etc)
Public / private sector Size of pharmacy Breakdown of inpatients, outpatients and day only patients
Therapeutic area(s) Hospital peer group (for public hospitals)
Role of pharmacists Number of separations
Sales volumes, share of market
State/Territory Formulary type (i.e. state-wide / campus / individual)
Average length of stay
Tendering processes Remoteness Role of TAG Patient demographics
Business practices Hospital budget Drug preferences Case mix (DRGs)
Industry competition Doctor prescribing behaviour
Medication complexity
Off-label use
New drugs
Drug prices
Tendering processes
Data on drugs and costs is central to the model, and ideally it should be informed by data broken
down by drug class and other system variables.
The model primary outcome measures (akin to system key performance indicators) are:
• The cost of hospital medicines (drug expenditure by $ amount and proportion of a
hospital budget)
Modelling Options for the Public Funding of Hospital Medicines in Australia
NATSEM March 2010
49
• Expenditure by different funding sources
• Number of adverse drug events (as a complication of surgical and medical care) as a
measure of quality and safety
• Continuity in medication post-discharge (e.g. measured by having a medication action
plan, supply of medicines information to patient or sufficient supply of drugs is
provided on discharge).
The model contains a number of stocks and allows for a wide range of comparative analyses. If the
model can be appropriately populated with data then it is theoretically possible to extract
information, for example, on the range, volume and cost of drugs dispensed by different hospital
peer groups by State/Territory by DRG. The model should be able to illustrate the effect of having a
centralised State-wide formulary versus an individual hospital based formulary, or indicate - at least
qualitatively - the effect of having multi-disciplinary and flexible clinical teams involved in medication
management and decision-making.
In summary, the model has been designed to allow users to answer the basic question of:
How do changes in the pharmaceutical industry, characteristics and behaviour of
hospitals, hospital pharmacy and/or patients affect the expenditure on hospital
medicines, adverse drug events, continuity of care on discharge, and source of funding?
In modelling terms, if we change system parameters or re-define the processes and interactions
operating within the system then how will this impact on system outcomes?
At present, the model has been constructed with the view that the basic unit of analysis is an
individual hospital establishment. However, if unit record data cannot be obtained then the model
could be operationalised using public hospital peer groups and private hospitals as the unit of
analysis.
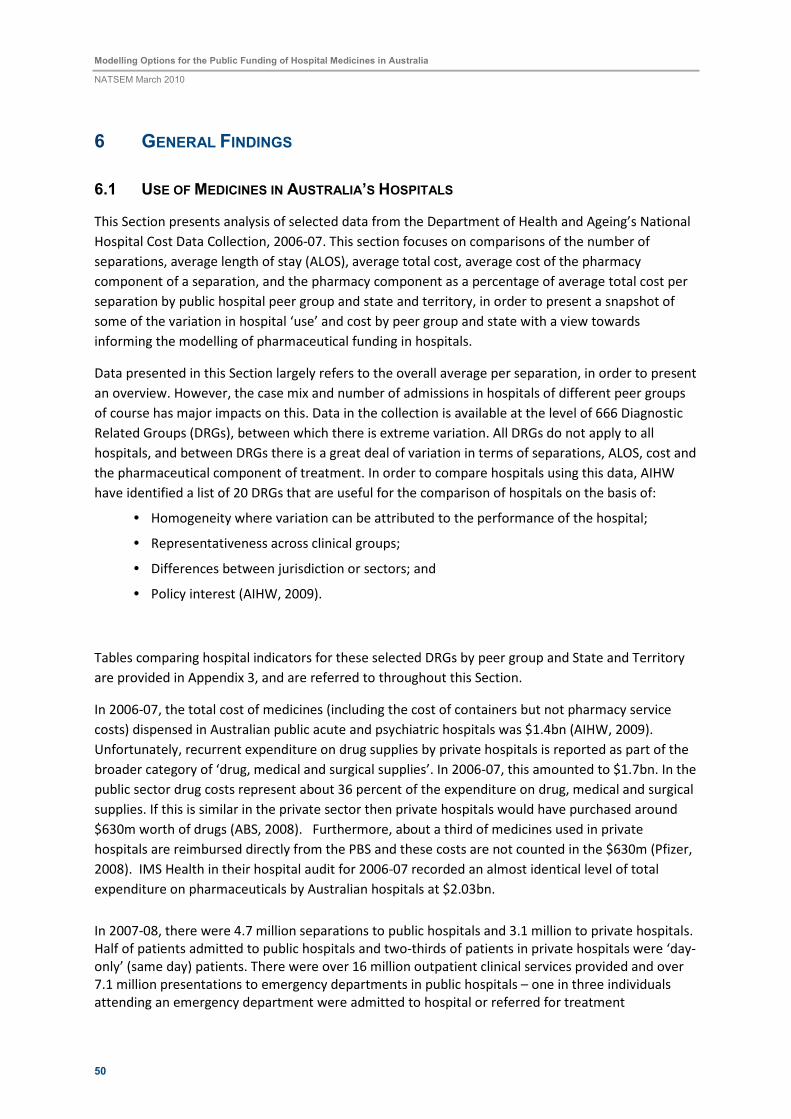
Modelling Options for the Public Funding of Hospital Medicines in Australia
NATSEM March 2010
50
6 GENERAL FINDINGS
6.1 USE OF MEDICINES IN AUSTRALIA’S HOSPITALS
This Section presents analysis of selected data from the Department of Health and Ageing’s National
Hospital Cost Data Collection, 2006-07. This section focuses on comparisons of the number of
separations, average length of stay (ALOS), average total cost, average cost of the pharmacy
component of a separation, and the pharmacy component as a percentage of average total cost per
separation by public hospital peer group and state and territory, in order to present a snapshot of
some of the variation in hospital ‘use’ and cost by peer group and state with a view towards
informing the modelling of pharmaceutical funding in hospitals.
Data presented in this Section largely refers to the overall average per separation, in order to present
an overview. However, the case mix and number of admissions in hospitals of different peer groups
of course has major impacts on this. Data in the collection is available at the level of 666 Diagnostic
Related Groups (DRGs), between which there is extreme variation. All DRGs do not apply to all
hospitals, and between DRGs there is a great deal of variation in terms of separations, ALOS, cost and
the pharmaceutical component of treatment. In order to compare hospitals using this data, AIHW
have identified a list of 20 DRGs that are useful for the comparison of hospitals on the basis of:
• Homogeneity where variation can be attributed to the performance of the hospital;
• Representativeness across clinical groups;
• Differences between jurisdiction or sectors; and
• Policy interest (AIHW, 2009).
Tables comparing hospital indicators for these selected DRGs by peer group and State and Territory
are provided in Appendix 3, and are referred to throughout this Section.
In 2006-07, the total cost of medicines (including the cost of containers but not pharmacy service
costs) dispensed in Australian public acute and psychiatric hospitals was $1.4bn (AIHW, 2009).
Unfortunately, recurrent expenditure on drug supplies by private hospitals is reported as part of the
broader category of ‘drug, medical and surgical supplies’. In 2006-07, this amounted to $1.7bn. In the
public sector drug costs represent about 36 percent of the expenditure on drug, medical and surgical
supplies. If this is similar in the private sector then private hospitals would have purchased around
$630m worth of drugs (ABS, 2008). Furthermore, about a third of medicines used in private
hospitals are reimbursed directly from the PBS and these costs are not counted in the $630m (Pfizer,
2008). IMS Health in their hospital audit for 2006-07 recorded an almost identical level of total
expenditure on pharmaceuticals by Australian hospitals at $2.03bn.
In 2007-08, there were 4.7 million separations to public hospitals and 3.1 million to private hospitals.
Half of patients admitted to public hospitals and two-thirds of patients in private hospitals were ‘day-
only’ (same day) patients. There were over 16 million outpatient clinical services provided and over
7.1 million presentations to emergency departments in public hospitals – one in three individuals
attending an emergency department were admitted to hospital or referred for treatment
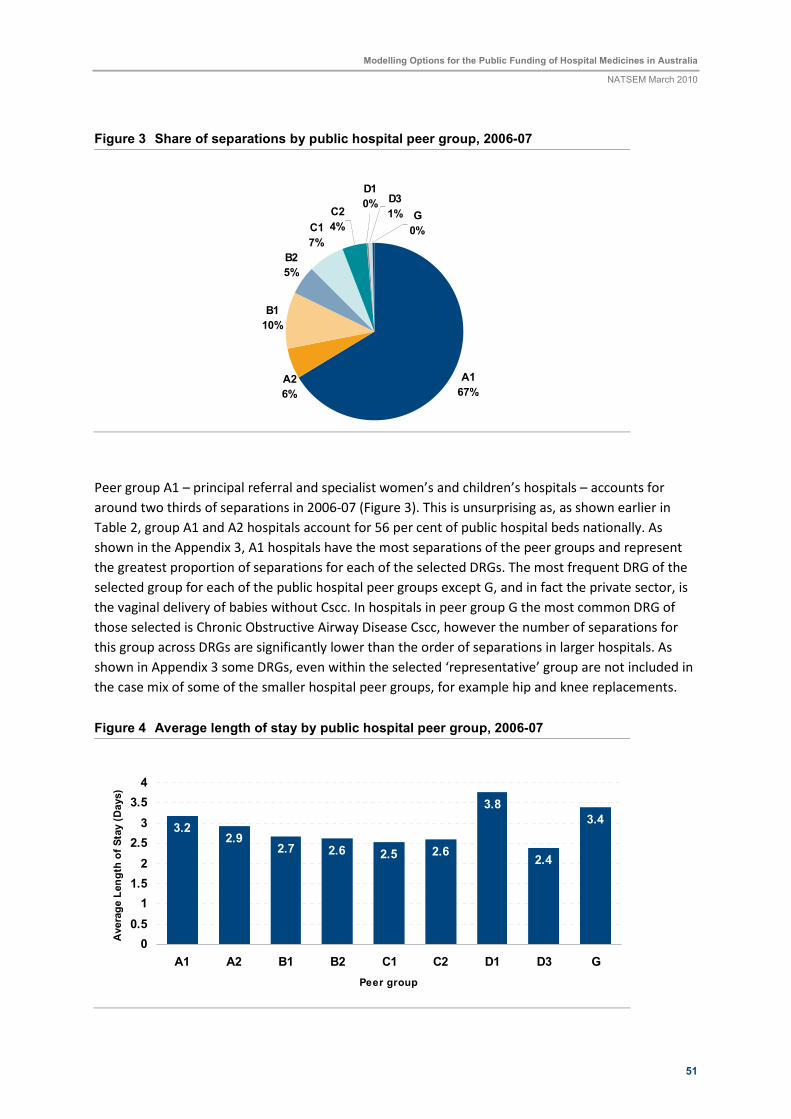
Modelling Options for the Public Funding of Hospital Medicines in Australia
NATSEM March 2010
51
Figure 3 Share of separations by public hospital peer group, 2006-07
A1
67%
B1
10%
B2
5%
C1
7%
C2
4%
D1
0%G
0%
A2
6%
D3
1%
Peer group A1 – principal referral and specialist women’s and children’s hospitals – accounts for
around two thirds of separations in 2006-07 (Figure 3). This is unsurprising as, as shown earlier in
Table 2, group A1 and A2 hospitals account for 56 per cent of public hospital beds nationally. As
shown in the Appendix 3, A1 hospitals have the most separations of the peer groups and represent
the greatest proportion of separations for each of the selected DRGs. The most frequent DRG of the
selected group for each of the public hospital peer groups except G, and in fact the private sector, is
the vaginal delivery of babies without Cscc. In hospitals in peer group G the most common DRG of
those selected is Chronic Obstructive Airway Disease Cscc, however the number of separations for
this group across DRGs are significantly lower than the order of separations in larger hospitals. As
shown in Appendix 3 some DRGs, even within the selected ‘representative’ group are not included in
the case mix of some of the smaller hospital peer groups, for example hip and knee replacements.
Figure 4 Average length of stay by public hospital peer group, 2006-07
3.22.9
2.7 2.6 2.5 2.6
3.8
2.4
3.4
0
0.5
1
1.5
2
2.5
3
3.5
4
A1 A2 B1 B2 C1 C2 D1 D3 G
Peer group
Avera
ge L
ength
of Sta
y (D
ays)
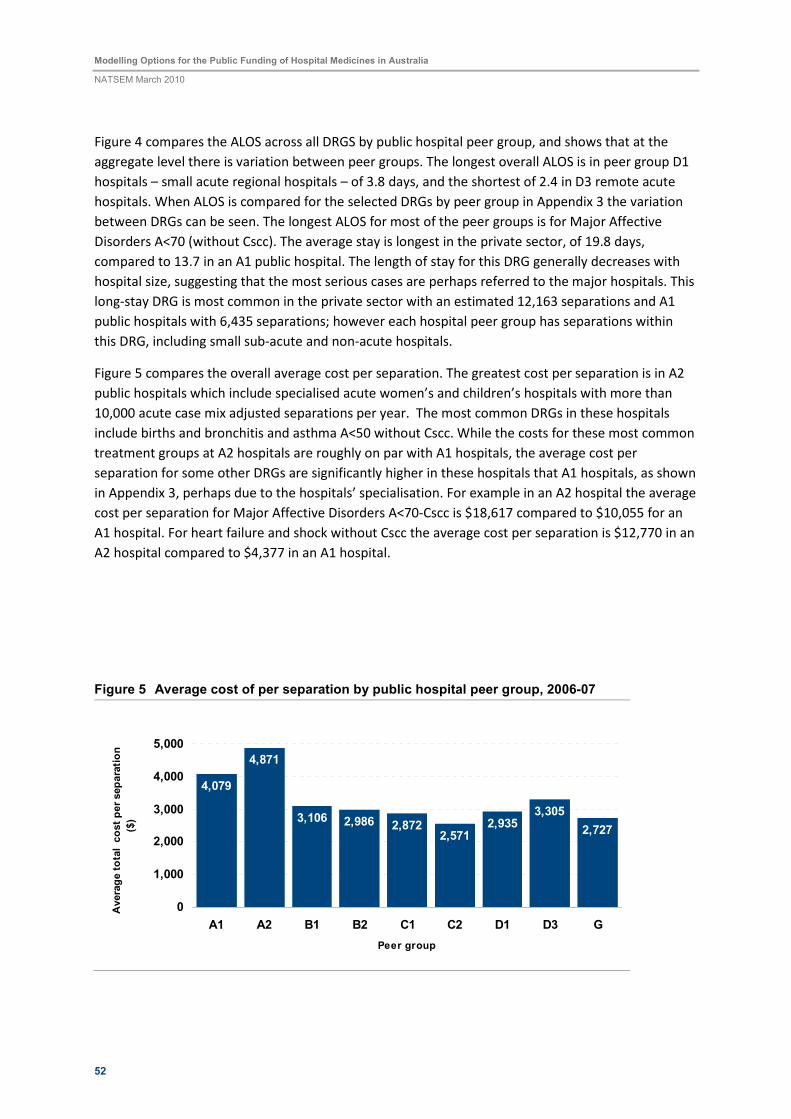
Modelling Options for the Public Funding of Hospital Medicines in Australia
NATSEM March 2010
52
Figure 4 compares the ALOS across all DRGS by public hospital peer group, and shows that at the
aggregate level there is variation between peer groups. The longest overall ALOS is in peer group D1
hospitals – small acute regional hospitals – of 3.8 days, and the shortest of 2.4 in D3 remote acute
hospitals. When ALOS is compared for the selected DRGs by peer group in Appendix 3 the variation
between DRGs can be seen. The longest ALOS for most of the peer groups is for Major Affective
Disorders A<70 (without Cscc). The average stay is longest in the private sector, of 19.8 days,
compared to 13.7 in an A1 public hospital. The length of stay for this DRG generally decreases with
hospital size, suggesting that the most serious cases are perhaps referred to the major hospitals. This
long-stay DRG is most common in the private sector with an estimated 12,163 separations and A1
public hospitals with 6,435 separations; however each hospital peer group has separations within
this DRG, including small sub-acute and non-acute hospitals.
Figure 5 compares the overall average cost per separation. The greatest cost per separation is in A2
public hospitals which include specialised acute women’s and children’s hospitals with more than
10,000 acute case mix adjusted separations per year. The most common DRGs in these hospitals
include births and bronchitis and asthma A<50 without Cscc. While the costs for these most common
treatment groups at A2 hospitals are roughly on par with A1 hospitals, the average cost per
separation for some other DRGs are significantly higher in these hospitals that A1 hospitals, as shown
in Appendix 3, perhaps due to the hospitals’ specialisation. For example in an A2 hospital the average
cost per separation for Major Affective Disorders A<70-Cscc is $18,617 compared to $10,055 for an
A1 hospital. For heart failure and shock without Cscc the average cost per separation is $12,770 in an
A2 hospital compared to $4,377 in an A1 hospital.
Figure 5 Average cost of per separation by public hospital peer group, 2006-07
4,079
4,871
3,106 2,986 2,8722,571
2,9353,305
2,727
0
1,000
2,000
3,000
4,000
5,000
A1 A2 B1 B2 C1 C2 D1 D3 G
Peer group
Avera
ge tota
l c
ost per separa
tion
($)
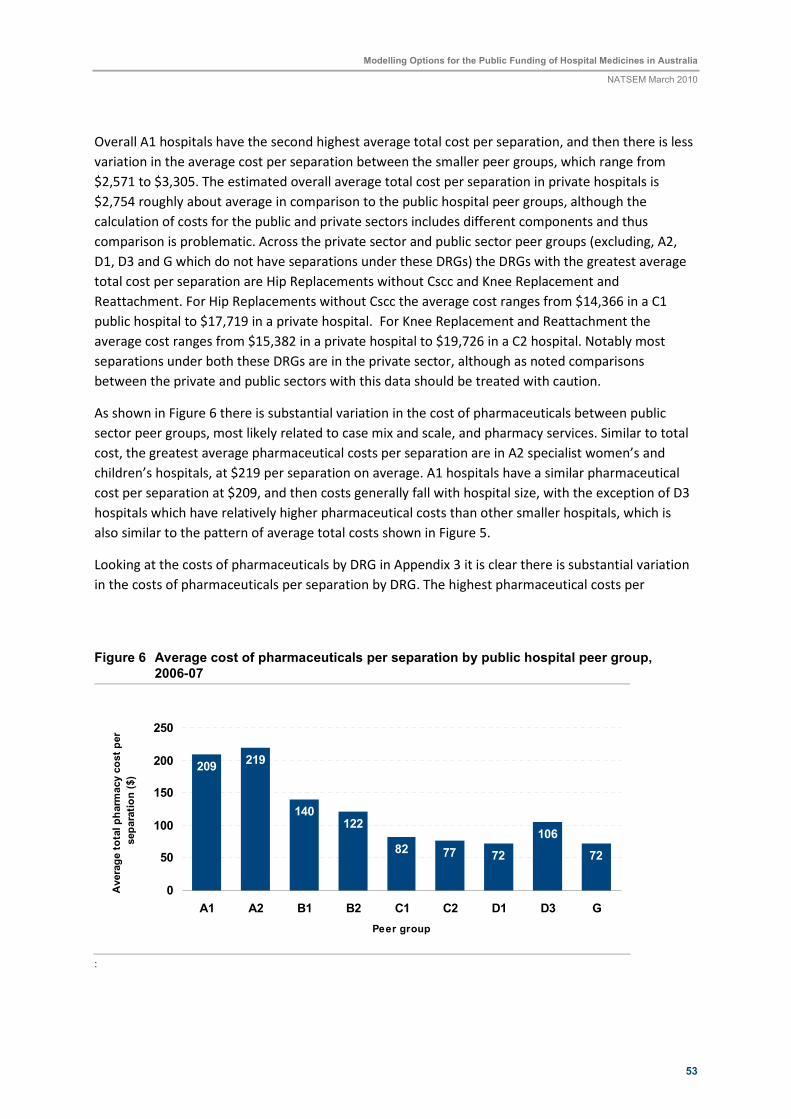
Modelling Options for the Public Funding of Hospital Medicines in Australia
NATSEM March 2010
53
Overall A1 hospitals have the second highest average total cost per separation, and then there is less
variation in the average cost per separation between the smaller peer groups, which range from
$2,571 to $3,305. The estimated overall average total cost per separation in private hospitals is
$2,754 roughly about average in comparison to the public hospital peer groups, although the
calculation of costs for the public and private sectors includes different components and thus
comparison is problematic. Across the private sector and public sector peer groups (excluding, A2,
D1, D3 and G which do not have separations under these DRGs) the DRGs with the greatest average
total cost per separation are Hip Replacements without Cscc and Knee Replacement and
Reattachment. For Hip Replacements without Cscc the average cost ranges from $14,366 in a C1
public hospital to $17,719 in a private hospital. For Knee Replacement and Reattachment the
average cost ranges from $15,382 in a private hospital to $19,726 in a C2 hospital. Notably most
separations under both these DRGs are in the private sector, although as noted comparisons
between the private and public sectors with this data should be treated with caution.
As shown in Figure 6 there is substantial variation in the cost of pharmaceuticals between public
sector peer groups, most likely related to case mix and scale, and pharmacy services. Similar to total
cost, the greatest average pharmaceutical costs per separation are in A2 specialist women’s and
children’s hospitals, at $219 per separation on average. A1 hospitals have a similar pharmaceutical
cost per separation at $209, and then costs generally fall with hospital size, with the exception of D3
hospitals which have relatively higher pharmaceutical costs than other smaller hospitals, which is
also similar to the pattern of average total costs shown in Figure 5.
Looking at the costs of pharmaceuticals by DRG in Appendix 3 it is clear there is substantial variation
in the costs of pharmaceuticals per separation by DRG. The highest pharmaceutical costs per
Figure 6 Average cost of pharmaceuticals per separation by public hospital peer group, 2006-07
209219
140122
82 77 72
106
72
0
50
100
150
200
250
A1 A2 B1 B2 C1 C2 D1 D3 G
Peer group
Avera
ge tota
l pharm
acy c
ost per
separa
tion ($)
:
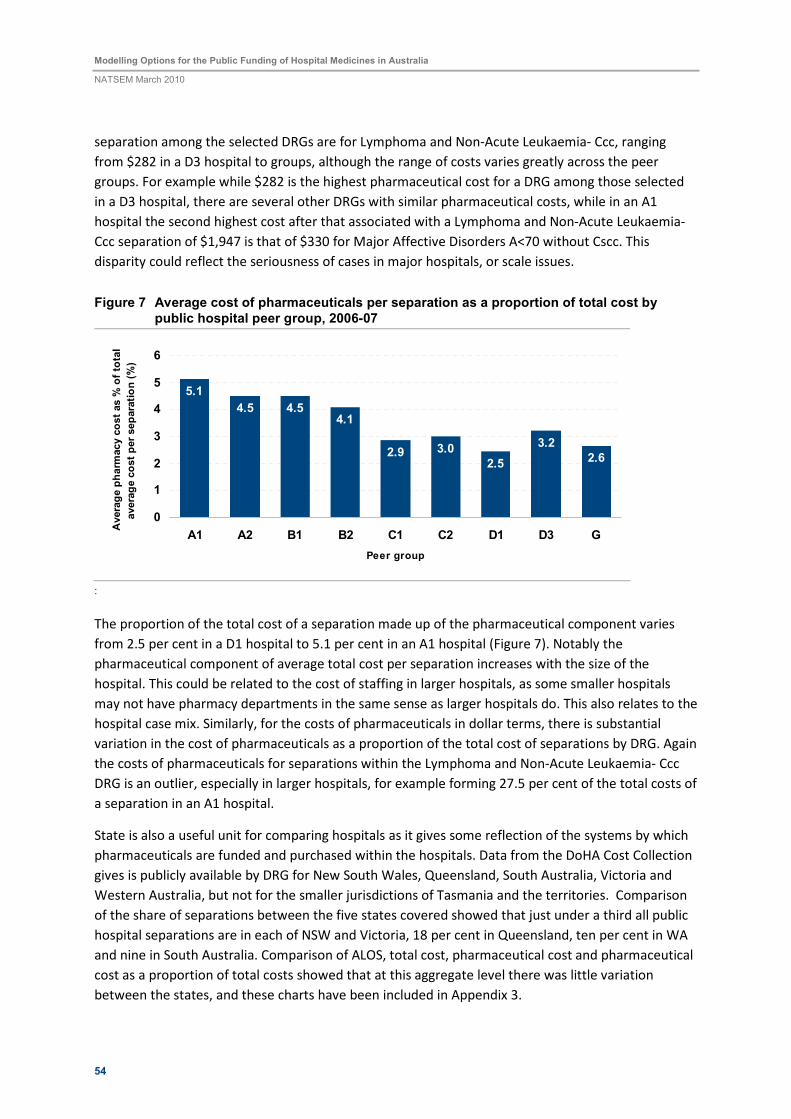
Modelling Options for the Public Funding of Hospital Medicines in Australia
NATSEM March 2010
54
separation among the selected DRGs are for Lymphoma and Non-Acute Leukaemia- Ccc, ranging
from $282 in a D3 hospital to groups, although the range of costs varies greatly across the peer
groups. For example while $282 is the highest pharmaceutical cost for a DRG among those selected
in a D3 hospital, there are several other DRGs with similar pharmaceutical costs, while in an A1
hospital the second highest cost after that associated with a Lymphoma and Non-Acute Leukaemia-
Ccc separation of $1,947 is that of $330 for Major Affective Disorders A<70 without Cscc. This
disparity could reflect the seriousness of cases in major hospitals, or scale issues.
Figure 7 Average cost of pharmaceuticals per separation as a proportion of total cost by public hospital peer group, 2006-07
5.1
4.5 4.54.1
2.9 3.02.5
3.22.6
0
1
2
3
4
5
6
A1 A2 B1 B2 C1 C2 D1 D3 G
Peer group
Avera
ge p
harm
acy c
ost as %
of to
tal
avera
ge c
ost per separa
tion (%
)
:
The proportion of the total cost of a separation made up of the pharmaceutical component varies
from 2.5 per cent in a D1 hospital to 5.1 per cent in an A1 hospital (Figure 7). Notably the
pharmaceutical component of average total cost per separation increases with the size of the
hospital. This could be related to the cost of staffing in larger hospitals, as some smaller hospitals
may not have pharmacy departments in the same sense as larger hospitals do. This also relates to the
hospital case mix. Similarly, for the costs of pharmaceuticals in dollar terms, there is substantial
variation in the cost of pharmaceuticals as a proportion of the total cost of separations by DRG. Again
the costs of pharmaceuticals for separations within the Lymphoma and Non-Acute Leukaemia- Ccc
DRG is an outlier, especially in larger hospitals, for example forming 27.5 per cent of the total costs of
a separation in an A1 hospital.
State is also a useful unit for comparing hospitals as it gives some reflection of the systems by which
pharmaceuticals are funded and purchased within the hospitals. Data from the DoHA Cost Collection
gives is publicly available by DRG for New South Wales, Queensland, South Australia, Victoria and
Western Australia, but not for the smaller jurisdictions of Tasmania and the territories. Comparison
of the share of separations between the five states covered showed that just under a third all public
hospital separations are in each of NSW and Victoria, 18 per cent in Queensland, ten per cent in WA
and nine in South Australia. Comparison of ALOS, total cost, pharmaceutical cost and pharmaceutical
cost as a proportion of total costs showed that at this aggregate level there was little variation
between the states, and these charts have been included in Appendix 3.
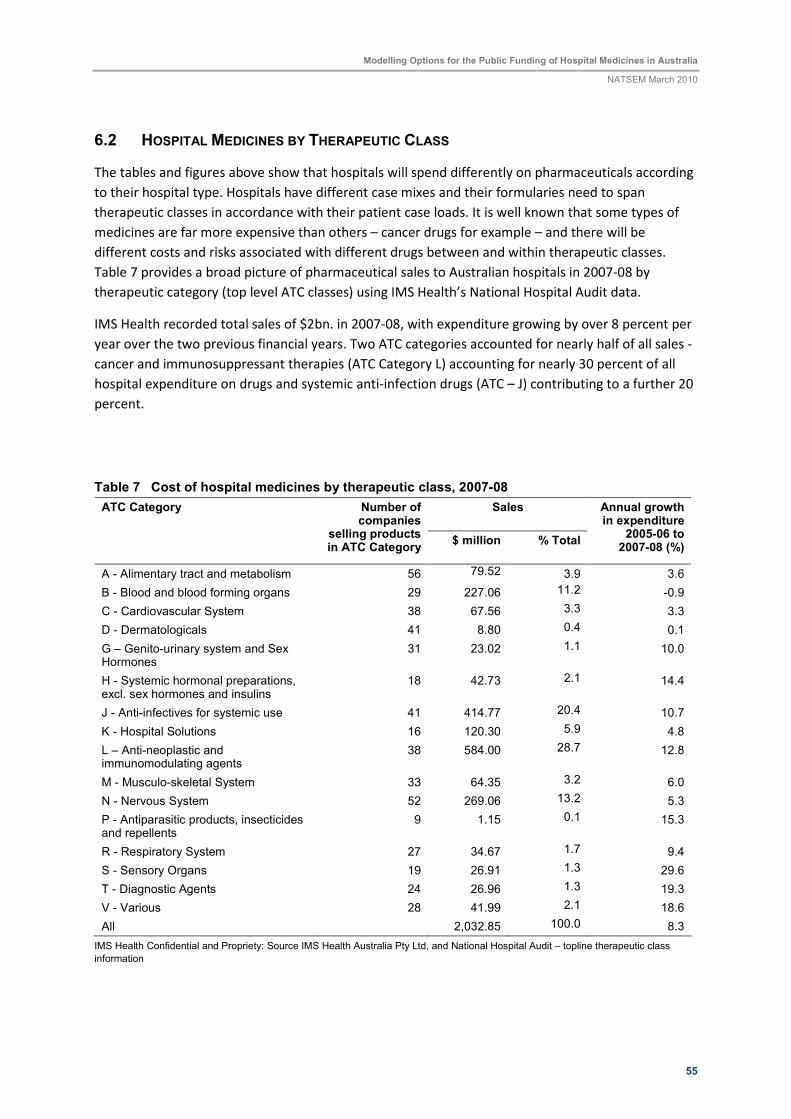
Modelling Options for the Public Funding of Hospital Medicines in Australia
NATSEM March 2010
55
6.2 HOSPITAL MEDICINES BY THERAPEUTIC CLASS
The tables and figures above show that hospitals will spend differently on pharmaceuticals according
to their hospital type. Hospitals have different case mixes and their formularies need to span
therapeutic classes in accordance with their patient case loads. It is well known that some types of
medicines are far more expensive than others – cancer drugs for example – and there will be
different costs and risks associated with different drugs between and within therapeutic classes.
Table 7 provides a broad picture of pharmaceutical sales to Australian hospitals in 2007-08 by
therapeutic category (top level ATC classes) using IMS Health’s National Hospital Audit data.
IMS Health recorded total sales of $2bn. in 2007-08, with expenditure growing by over 8 percent per
year over the two previous financial years. Two ATC categories accounted for nearly half of all sales -
cancer and immunosuppressant therapies (ATC Category L) accounting for nearly 30 percent of all
hospital expenditure on drugs and systemic anti-infection drugs (ATC – J) contributing to a further 20
percent.
Table 7 Cost of hospital medicines by therapeutic class, 2007-08
Sales ATC Category Number of companies
selling products in ATC Category
$ million % Total
Annual growth in expenditure
2005-06 to 2007-08 (%)
A - Alimentary tract and metabolism 56 79.52 3.9 3.6
B - Blood and blood forming organs 29 227.06 11.2 -0.9
C - Cardiovascular System 38 67.56 3.3 3.3
D - Dermatologicals 41 8.80 0.4 0.1
G – Genito-urinary system and Sex Hormones
31 23.02 1.1 10.0
H - Systemic hormonal preparations, excl. sex hormones and insulins
18 42.73 2.1 14.4
J - Anti-infectives for systemic use 41 414.77 20.4 10.7
K - Hospital Solutions 16 120.30 5.9 4.8
L – Anti-neoplastic and immunomodulating agents
38 584.00 28.7 12.8
M - Musculo-skeletal System 33 64.35 3.2 6.0
N - Nervous System 52 269.06 13.2 5.3
P - Antiparasitic products, insecticides and repellents
9 1.15 0.1 15.3
R - Respiratory System 27 34.67 1.7 9.4
S - Sensory Organs 19 26.91 1.3 29.6
T - Diagnostic Agents 24 26.96 1.3 19.3
V - Various 28 41.99 2.1 18.6
All 2,032.85 100.0 8.3
IMS Health Confidential and Propriety: Source IMS Health Australia Pty Ltd, and National Hospital Audit – topline therapeutic class
information
Modelling Options for the Public Funding of Hospital Medicines in Australia
NATSEM March 2010
56
Also provided in Table 7 are the number of pharmaceutical companies selling products in the
different ATC classes. In 2007-08, hospitals accessed ‘alimentary tract and metabolism’ or ‘nervous
system’ products from over 50 suppliers, but in contrast, only 9 companies sold ‘anti-parasitic
products, insecticides and repellents’. In general, the more companies selling products within a
therapeutic class, the lower was the annual growth rate in the cost of drug purchase (a simple linear
regression analysis indicates that the number of companies selling products within an ATC category
explained over 25 percent of the variation in the growth in annual drug expenditure per category –
suggesting competition does influence cost).
6.3 ADVERSE DRUG EVENTS
Some 2-4 percent of all hospital separations are medication related with as many as 30 percent of
unplanned admissions in older Australians (who typically have complex health problems and are on
multiple medications) being due to adverse drug events (Runciman et al, 2003; National Medicines
Safety and Quality Scoping Study Steering Committee, 2009; Roughead and Semple, 2009). The
majority of adverse drug events occur within the community, leading to hospital admission or re-
admission (Roughead and Bedford, 2008). The risk of medication error is particularly high
immediately after a patient is discharged from hospital when discontinuities and a lack of co-
ordination may occur in their care (Mant et al, 2001; Roughead and Semple, 2008). In a survey of GPs
in Sydney, Mant and colleagues found that consultation with the GP about the patient’s medication
during the hospital stay occurred in only 11 per cent of patients recently discharged from hospital
and that medication management was documented in the discharge plan of only 13 per cent of
patients (Mant et al, 2001).
Of the approximate 7 million separations in 2004-05 to Australian public and private hospitals, there
were around 320,000 separations recorded as having complications of surgical and medical care
(ICD-10-AM Codes Y40-Y84). This means that an adverse surgical or medical event occurred in nearly
5 in every 100 separations. Nearly 30 percent of these separations or over 90,000 separations were
due to adverse drug events occurring in hospital (Y40-Y59). Thus, adverse drug events occur in over
one in every 100 separations. As shown in Table 8 by 2007-08, the total number of separations to
Australian public and private hospitals had increased to 7.9 million, but a staggering 358,117
separations were now coded as having a complication of medical and surgical care (AIHW, 2009).
Seventy percent of these separations occurred within public hospitals. Of concern is that the number
of separations recorded as having an adverse drug event increased at a higher rate (around 4.3
percent per annum) than the growth in all hospital separations or those due to complications of
surgical and medical care (Y40-Y84) (both having an annual increase of 3.0 percent per year over the
period 2004-05 to 2007-08).
Poor communication of medical information at key transition points appears to be responsible for up
to 50 percent of all medication errors in hospital and 20 percent of adverse drug events (Victorian
Department of Human Services, 2005). Omission or overdose of medication is the most frequent
type of medication incident reported in hospitals (Roughead and Semple, 2009).
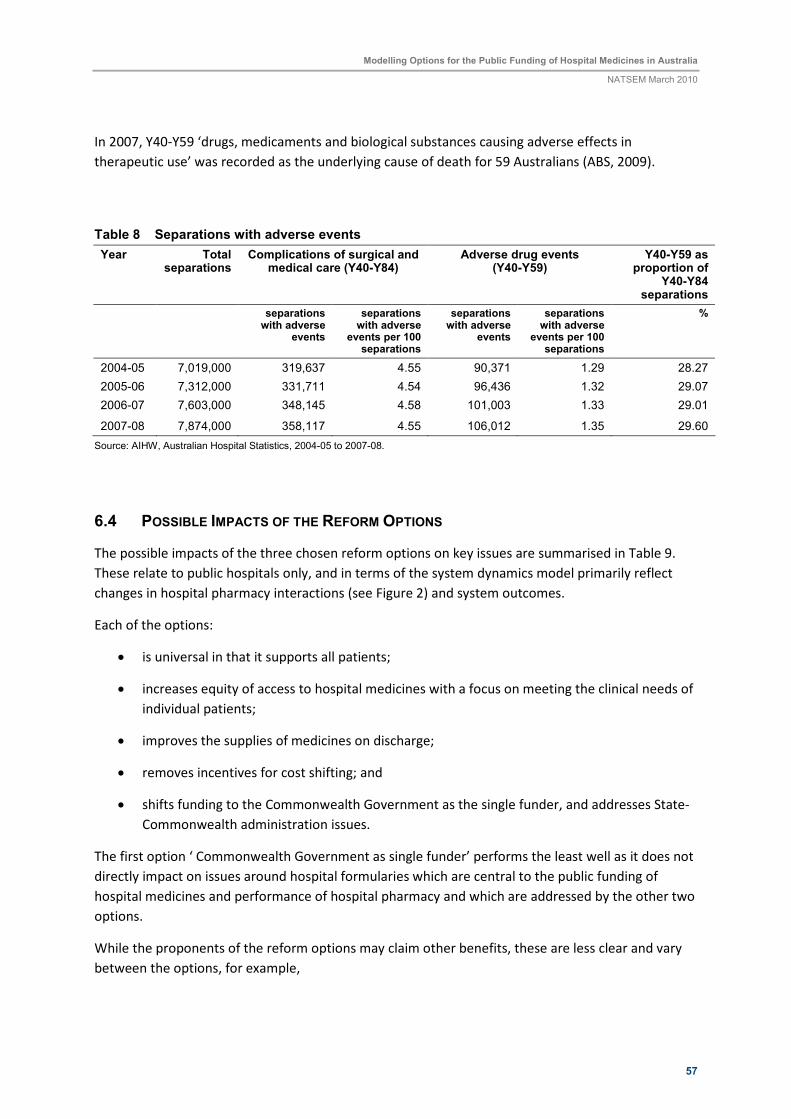
Modelling Options for the Public Funding of Hospital Medicines in Australia
NATSEM March 2010
57
In 2007, Y40-Y59 ‘drugs, medicaments and biological substances causing adverse effects in
therapeutic use’ was recorded as the underlying cause of death for 59 Australians (ABS, 2009).
Table 8 Separations with adverse events
Year Total separations
Complications of surgical and medical care (Y40-Y84)
Adverse drug events (Y40-Y59)
Y40-Y59 as proportion of
Y40-Y84 separations
separations with adverse
events
separations with adverse
events per 100 separations
separations with adverse
events
separations with adverse
events per 100 separations
%
2004-05 7,019,000 319,637 4.55 90,371 1.29 28.27
2005-06 7,312,000 331,711 4.54 96,436 1.32 29.07
2006-07 7,603,000 348,145 4.58 101,003 1.33 29.01
2007-08 7,874,000 358,117 4.55 106,012 1.35 29.60
Source: AIHW, Australian Hospital Statistics, 2004-05 to 2007-08.
6.4 POSSIBLE IMPACTS OF THE REFORM OPTIONS
The possible impacts of the three chosen reform options on key issues are summarised in Table 9.
These relate to public hospitals only, and in terms of the system dynamics model primarily reflect
changes in hospital pharmacy interactions (see Figure 2) and system outcomes.
Each of the options:
• is universal in that it supports all patients;
• increases equity of access to hospital medicines with a focus on meeting the clinical needs of
individual patients;
• improves the supplies of medicines on discharge;
• removes incentives for cost shifting; and
• shifts funding to the Commonwealth Government as the single funder, and addresses State-
Commonwealth administration issues.
The first option ‘ Commonwealth Government as single funder’ performs the least well as it does not
directly impact on issues around hospital formularies which are central to the public funding of
hospital medicines and performance of hospital pharmacy and which are addressed by the other two
options.
While the proponents of the reform options may claim other benefits, these are less clear and vary
between the options, for example,
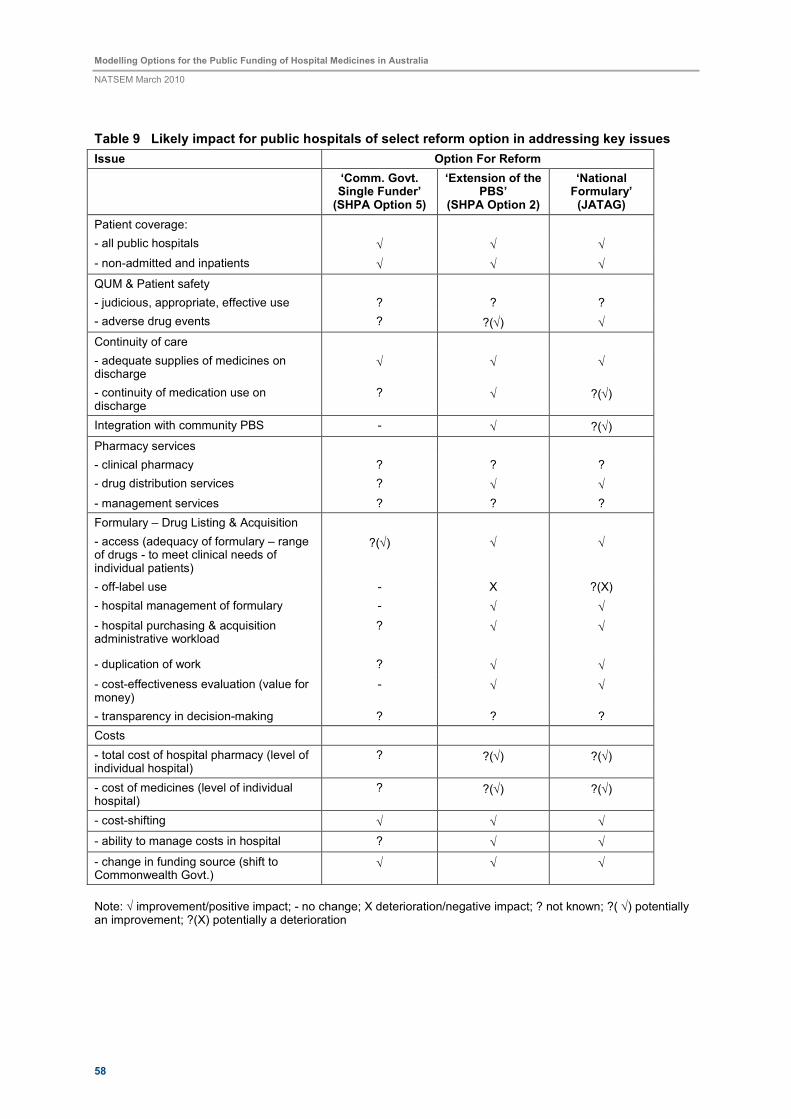
Modelling Options for the Public Funding of Hospital Medicines in Australia
NATSEM March 2010
58
Table 9 Likely impact for public hospitals of select reform option in addressing key issues
Issue Option For Reform
‘Comm. Govt. Single Funder’
(SHPA Option 5)
‘Extension of the PBS’
(SHPA Option 2)
‘National Formulary’ (JATAG)
Patient coverage:
- all public hospitals √ √ √
- non-admitted and inpatients √ √ √
QUM & Patient safety
- judicious, appropriate, effective use ? ? ?
- adverse drug events ? ?(√) √
Continuity of care
- adequate supplies of medicines on discharge
√ √ √
- continuity of medication use on discharge
? √ ?(√)
Integration with community PBS - √ ?(√)
Pharmacy services
- clinical pharmacy ? ? ?
- drug distribution services ? √ √
- management services ? ? ?
Formulary – Drug Listing & Acquisition
- access (adequacy of formulary – range of drugs - to meet clinical needs of individual patients)
?(√)
√
√
- off-label use - X ?(X)
- hospital management of formulary - √ √
- hospital purchasing & acquisition administrative workload
?
√
√
- duplication of work ? √ √
- cost-effectiveness evaluation (value for money)
- √ √
- transparency in decision-making ? ? ?
Costs
- total cost of hospital pharmacy (level of individual hospital)
? ?(√) ?(√)
- cost of medicines (level of individual hospital)
? ?(√) ?(√)
- cost-shifting √ √ √
- ability to manage costs in hospital ? √ √
- change in funding source (shift to Commonwealth Govt.)
√ √ √
Note: √ improvement/positive impact; - no change; X deterioration/negative impact; ? not known; ?( √) potentially an improvement; ?(X) potentially a deterioration
Modelling Options for the Public Funding of Hospital Medicines in Australia
NATSEM March 2010
59
• integration with community care (and PBS), including improving continuity of medication on
discharge;
• adherence to QUM principles and improved patient safety;
• reduction in unnecessary bureaucratic processes, administrative workloads and duplication
of work;
• robust tendering processes and pricing mechanisms; and
• economic evaluation leading to value for money (cost-effectiveness)and responsible
spending.
Like all policy reform options, ‘the devil is in the detail’ and these options need further scoping. It is
not clear the degree to which individual hospitals will implement cost-control mechanisms and
incentives when funding is provided by the Commonwealth. At present, expenditure on hospital
medicines is capped through public hospital budgets but under these reform options, expenditure is
likely to become uncapped, with funding being ‘activity-based’ (similar to the PBS). Mechanisms need
to be put into place to link medicine use to health outcomes, with funding arrangements and
formularies allowing for flexibility at the level of the individual hospital to dispense medicines that
best suit the clinical needs of the patients while encouraging responsible and cost-effective spending.
A recent hospital pharmacy workforce study has shown that 47 percent of pharmacists’ time is spent
on clinical pharmacy services for individual patients, providing drug information to doctors and
nurses, and training and education; 38 percent on drug distribution services in terms of acquiring,
manufacturing and dispensing medicines; and 15 percent on management services involving
managing the medicine and personnel resources of the pharmacy service and hospital-wide
activities, such as institutional drug policy management (O’Leary and Allinson, 2009). The
introduction of an enhanced PBS-hospital formulary or a national hospital medicines formulary will
both positively impact on hospitals through streamlining at the level of the individual hospital drug-
listing, pricing, tendering and other acquisition processes. However, while there is strong support for
increasing the clinical role of pharmacists, how these reform options will impact on clinical pharmacy
services is uncertain. None of the options specifically target clinical pharmacy services which have a
major impact on the use of medicines, and consequently pharmaceutical expenditure, as well as
adverse drug events. JATAG believe that a national formulary will reduce adverse drug events
because health professionals will be able to move between hospitals but still work from the same
drug list, using the same prescribing, dispensing and evaluation procedures and policies.
An extended PBS ‘formulary’ should operate in a similar way but because of essential differences
between medicines used in the community and hospital-based medicines, this may not be the case.
The range of drugs differs and in hospital settings, there are different patterns of use including off-
label use and trialling medications for short periods of time. A possible problem with both formulary
options is the limitation in off-label use (e.g. non-PBS indications or non-registered indications), and
use of ‘investigational’ medicines. Applying a PBS type funding mechanism to hospital medicines
further raises the question as to whether or not patient copayments would apply to current PBS-
listed medicines prescribed in hospital and to maintain consistency would copayments be introduced
for ‘hospital-only’ medicines.
Modelling Options for the Public Funding of Hospital Medicines in Australia
NATSEM March 2010
60
The impact of these reform options on the total cost of hospital pharmacy and more specifically on
the cost of medicines is uncertain because of the possible incentives for hospitals to use more
medicines under uncapped funding systems versus the efficiencies and savings that the
Commonwealth could achieve as sole funder. With the Commonwealth Government becoming the
single funder of hospital medicines and especially if it became the sole ‘purchaser’ through the
operation of an extended PBS or national hospital formulary, it is likely that it would exert
monopsony purchasing power. It could bring economies of scale and dictate terms to the
pharmaceutical companies supplying drugs. This would have major implications for the
pharmaceutical industry in Australia. Companies would have to enter robust tendering processes
with the Commonwealth and not States or individual hospitals as is the current system, and provide
cost-effective evaluations for formulary listing of their medicines – noting that direct transference of
PBS listing and pricing processes into the hospital sector is likely to be problematic given the nature
of hospital medicines e.g. for the funding of high-cost medicines where the cost per individual unit
dose is very high. Currently, the evaluation of drugs for use in hospitals focuses mainly on efficacy
and not value for money. JATAG (2008) suggest that for a national hospital formulary not all
members of a drug class need to be listed, a strategy of selecting only some members of a class of
drugs where there is not much difference between the members (me-too drugs) will improve price
competitiveness in the tendering process.
As suggested it is uncertain how such a system might play out – if hospitals introduce cost control
mechanisms and efficiency gains accrue at the Commonwealth level then there will be overall
improvements in expenditure. However, in their submission to the NHHRC, Pfizer paints an
alternative picture with higher prices and jeopardised drug supply being the outcomes:
‘To take a hypothetical example: if three manufacturers currently supply Medicine X in Australia, and if the
Commonwealth placed only one of these brands on a national medicines formulary, the other two
companies would quickly cease to supply Medicine X in Australia. Without competition, there would no
longer be any reason for the sole supplying manufacturer to keep its prices low—and the Commonwealth
would no longer have a mechanism to contain aggressive cost increases. And the Commonwealth would
have no alternative sources of supply’ (Pfizer, 2008, p8).
With a fully functional system dynamics model it would be possible to evaluate the impact of
different Industry behaviours in response to other system changes on costs and drug supply.
The possible outcomes for the three reform options have been modelled for public hospitals. The
extension of the PBS (SHPA Option 2) would offer public patients a similar level of access as private
patients (recalling that about one third of their medicines use in private hospitals is already being
funded through the PBS). Also JATAG suggest that there is no reason why private hospitals could not
base their drug acquisition decisions on a national hospital formulary, although it by no means mean
that the Commonwealth Government would assume the extra cost burden of funding all private
hospital medicine use.
Modelling Options for the Public Funding of Hospital Medicines in Australia
NATSEM March 2010
61
7 CONCLUSIONS
This Report addresses the issues that influence the development of public hospital formularies in
Australia. Clinical need drives most inclusions with representation of new items primarily coming
from the clinicians themselves, as Industry mostly is not able to directly influence the inclusion of
their products. Tender processes enable Directors of Pharmacy in collaboration with their Health
Departments to select items that have been listed through a competitive process. There is no
obligation in most cases to only purchase from the tender with the exception of Queensland Health.
Directors of Pharmacy can directly negotiate with Industry to achieve an outcome that addresses
their hospital’s needs. Bundling of products (i.e. purchasing a range of products at a negotiated
reduced price) and creative payment options can be an attractive option for some hospitals to spread
payments across financial periods particularly during high throughput periods.
The PBS can influence the items listed on a formulary but in general restrictions apply to the range of
items listed by selection of key items within therapeutic groups based on evidence-based
recommendations. Organisations such as the National Prescribing Service and the Council of
Australian Therapeutic Advisory Groups assist Drug Committees in all public hospitals to rationalise
the size of their formularies but address therapeutic need in the most cost effective way. The
challenge the Drug Committees face in rationalisation of therapies is limited access to usable
pharmacoeconomic data such as that provided to the PBAC for product listing on the PBS. In
addition, there is little access to qualified pharmacoeconomists to interpret data at a hospital level.
Currently most Directors of Pharmacies in Australian public hospitals feel they have systems that
work adequately for them to address patient need. They do identify the increase in high cost drugs
and the possibility of across the board use of the PBS for hospital discharges as a challenge for the
future both in cost, continuity of care, infrastructure requirements and junior prescriber education.
Various reform options have been put forward in the public domain by stakeholders to improve key
outcomes in Australia’s hospital medicines system. Although a number of submissions were made to
the National Health and Hospitals Reform Commission, no direct recommendations were made by
the Commission concerning the public funding of hospital medicines. However, as shown, the
broader issues raised by the Commission have relevance and overlap changes proposed or identified
by the Society of Hospital Pharmacists of Australia, the Joint Australian Therapeutics Advisory Groups
and Pfizer. The NHHRC, SHPA, JATAG and Pfizer all call for improvements in quality and safety,
improved access and continuity of care, appropriate economic evaluation and funding models,
removing incentives for cost-shifting, transparency and accountability in decision-making, and
enhancing the role of health professionals (hospital pharmacists) through shared responsibilities,
flexibility and multi-disciplinary clinical teams.
It was not be possible to develop a fully functional system dynamics model within the timeframe and
budget of the current project, largely because of the significant limitations in the publicly available
data. However, understanding how the hospital medicines system works – whether this be the
current system or one of the alternative funding options – and the way in which key outcomes might
change at an aggregate or descriptive level because of changes to the system elements and
processes is a good first step in advocating and evaluating policy change.
Modelling Options for the Public Funding of Hospital Medicines in Australia
NATSEM March 2010
62
The initial development of the model through the causal loop diagram provided a means to enhance
our understanding of the systemic causes of hospital medicine use and costs in Australia. It could be
used in a qualitative manner to hypothesize the likely impacts of the three reform options studied.
Further work to quantify and operationalise the model will allow the policy levers and reform options
identified in the reform proposals discussed, or alternative formulations, to be more thoroughly and
rigorously tested on the simulation and the results evaluated for their improvement to the system
outcomes. The usefulness of the model ultimately will depend on how well it represents the real
world. This in turn depends on the underlying assumptions, the construction of the causal
relationships and feedback loops, whether the appropriate concepts, processes, relationships and
interactions are captured and the quality of the input data.
However, in undertaking this review of the issues and challenges in hospital pharmacy and the
funding of hospital medicines in Australia, and in scoping the development of the system dynamics
model, it has become clear that action needs to be taken by Government sooner than later. Models
are a cost-efficient way of testing ‘what-if’ policy scenarios that address real world issues.
Expenditure on pharmaceuticals vary greatly between hospitals and patients have different access to
medicines depending on where and what type of hospital they are admitted to. One in every 100
separations from Australian public and private hospitals involves an adverse drug event that was
sufficiently severe that it was reported on the patient’s medical file and coded into official hospital
statistics. It is timely given the release of the NHHRC’s final report on reforming Australia’s health
care system that the reform of public funding of hospital medicines is also addressed. The three
proposals examined in this Report would all provide benefits. These and other possible alternatives
should be studied in much greater detail to provide the Commonwealth Government with the
necessary platform to introduce policy change to the public funding of medicines in Australian
hospitals.
Modelling Options for the Public Funding of Hospital Medicines in Australia
NATSEM March 2010
63
REFERENCES
Aldous, D. and Petrie, A. (2008). State-wide drug availability. WATAG meeting 2008. Slides available
from: http://www.watag.org.au/watag/docs/Formulary_Petrie.pdf Accessed on 09 February 2009.
Australian Council on Health Care Standards (2008). Australasian Clinical Indicator Report 2001–
2007: Determining the Potential to Improve Quality of Care, 9th Ed., Sydney.
Australian Bureau of Statistics (2009). Causes of Death, Australia, 2007. Cat No. 3303.0, ABS,
Canberra.
Australian Bureau of Statistics (2008). Private Hospitals, 2006-07. Cat No. 4390.0, ABS, Canberra.
Australian Government Department of Health and Ageing (2009). website
http://www.health.gov.au/ accessed June 2009.
Australian Government Department of Health and Ageing (2009a). The State of our Public Hospitals,
June 2009 Report, Commonwealth of Australia, Canberra.
Australian Institute of Health and Welfare (2009). Australian Hospital Statistics 2007-08, Health
Services Series no. 33, Cat. no. HSE 71, Canberra.
Bonabeau, E., (2002). Agent-based modeling: Methods and techniques for simulating human
systems, PNAS vol. 99 suppl 3 pp. 7280–7287.
Bradley, C. and Harrison, J. (2008). Hospital separations due to injury and poisoning, Australia 2004–
05. Injury Research and Statistics Series Number 47. (Cat. no. INJCAT 117) Adelaide: AIHW
Braae, R., McNee, W. and Moore, D. (1999). Managing Pharmaceutical Expenditure While Increasing
Access. The Pharmaceutical Management Agency (PHARMAC) Experience. PharmacoEconomics
16(6), 649-60.
Burgess, C.L., Holman, C.D’A. J. and Satti, A.G. (2005). Adverse drug reactions in older Australians,
1981-2002. MJA, 182(6), 267-270.
Coyle, G. (2000). ‘Qualitative and quantitative modelling in system dynamics: some research
questions’, System Dynamics Review vol. 16, no. 3 pp. 225-244.
Coyle, G. (1996). System Dynamics Modelling: A Practical Approach, Chapman and Hall, London.
Denaro, C. (2008). Joint Australian Therapeutics Advisory Groups Submission to the NHHRC,
Submission No. 44, August 2008.
Gray, L., Broe, G. Duckett, S., Gibson, D., Travers, C. and McDonnell, G. (2006). Developing a policy
simulator at the acute–aged care interface, Australian Health Review vol. 30 no. 4, pp. 450-457
Heffernan, M., Martin, P., and McDonnell, G. (2004). National Medicines Use Dynamics: Influencing
Health Policy with System Dynamics, www.anysim.com, Accessed 13 June 2009.
Modelling Options for the Public Funding of Hospital Medicines in Australia
NATSEM March 2010
64
Homer, J.B. and Hirsch, G.B. (2006). System dynamics modelling for public health: Background and
opportunities. American Journal of Public Health, 96 (3), 452-458.
Huskamp, H.A., Epstein, A.M. and Blumenthal, D. (2003). The Impact of a National Prescription Drug
Formulary on Prices, Market Share, and Spending: Lessons for Medicare? Health Affairs (Millwood),
22(3), 149-58.
Kirkwood, C.W. (1998). System Dynamics Methods : A Quick Introduction. College of Business,
Arizona State University.
Lyell, D., Sadsad, R. and Georgiou, A. (2008). Health systems simulation. In Wickramasinghe, N, and
Geisler, E. (Eds). Encyclopedia of Healthcare Information Systems, Vol II, 646-654.
McDonnell, G. and Heffernan, M. (2005). The dynamics of hospital medication errors: a systems
simulator testbed for patient safety interventions, www.anysim.com, Accessed 13 June 2009.
Mant, A., Rotem, W. and Kejoe, L. (2000). Continuity of Care in Therapeutics from Hospital to
Community. Final report to the Pharmaceutical Health and Rational Use of medicines Committee,
Sydney, South East Health.
Mant, A., Rotem, W., Kehoe, L. and Kaye, K/ (2001). Compliance with guidelines for continuity of care
in therapeutics from hospital to community. MJA, 174(6), 277-80.
Morgan, S., Hanley, G., McMahon, M., Barer, M. (2007). Influencing drug prices through formulary-
based policies: Lessons from New Zealand. Healthcare policy, 3(1), 1-20.
National Health and Hospitals Reform Commission (2008). Beyond the blame game: Accountability
and performance benchmarks for the next Australian Health Care Agreements. A Report from the
National Health and Hospitals Reform Commission, April 2008
National Health and Hospitals Reform Commission (2009). A Healthier Future For All Australians –
Final Report of the National Health and Hospitals Reform Commission – June 2009. ISBN: 1-74186-
940-4, Publications Number: P3 -5499, Commonwealth of Australia, Canberra.
National Medicines Safety and Quality Scoping Study Steering Committee (2009). National Medicines
Safety and Quality Scoping Study Report. Report to the Australian Commission on Safety and Quality
in Health Care.
National Prescribing Service (2009). Review finds errors occurring at all stages of medication process.
Media Release, 4 June 2009.
Pfizer Australia, 2008, ‘A Submission to the National Healthcare and Hospitals Reform Commission:
Funding for Hospital Medicines’, June 2008.
O’Leary, K., and Allinson, Y.M. (2009). Snapshot of the Australian Public Hospital Pharmacy
Workforce in 2007. Journal of Pharmacy Practice and Research, 39(1), 28-33.
Productivity Commission (2009). Public and Private Hospitals, Research Report, Canberra.
Modelling Options for the Public Funding of Hospital Medicines in Australia
NATSEM March 2010
65
Productivity Commission (2009a). Performance of Public and Private Hospital Systems, Productivity
Commission Issues Paper, Productivity Commission, Canberra.
Roughead, E.E and Bedford, G. (2008). Medication Safety – will adverse drug events be reduced? 27-
36. Australian Commission on Safety and Quality in Health Care
Roughead, E.E and Semple, S. (2009). Medication safety in acute care in Australia: where are we
now? Part 1: a review of the extent and causes of medication problems 2002-2008. Australia and
New Zealand Health Policy, 6(1), 18.
Roughead, E.E and Semple, S. (2008). Literature Review: Medication Safety in Acute Care in Australia.
Report to Australian Commission on Safety and Quality in Healthcare.
Runciman, W.B. (2006). Shared meanings: preferred terms and definitions for safety and quality
concepts. MJA, 184 (10), S41-S43.
Runciman, W.B., Roughead, E.E., Semple, S.J. and Adams, R.J. (2003). Adverse drug events and
medication errors in Australia. International Journal for Quality in Health Care,15, 149-159.
Society of Hospital Pharmacists of Australia (2008). ‘Submission to the National Health and Hospitals
Reform Commission’, May 2008.
Society of Hospital Pharmacists of Australia (2004). Moving Forward – the Fundingof Medicines in
Australia’s Hospitals. Discussion Paper, SHPA, Melbourne, Vic.
Victorian Department of Human Services (2005). Preventing Adverse Drug Events – Toolkit. Victorian
Department of Human Services, Melbourne.
Queensland Health (2009).‘Standard Drug List for Queensland Hospitals (1 February 2009)’, available
at http://www.health.qld.gov.au/qhcss/mapsu/, accessed June 2009.
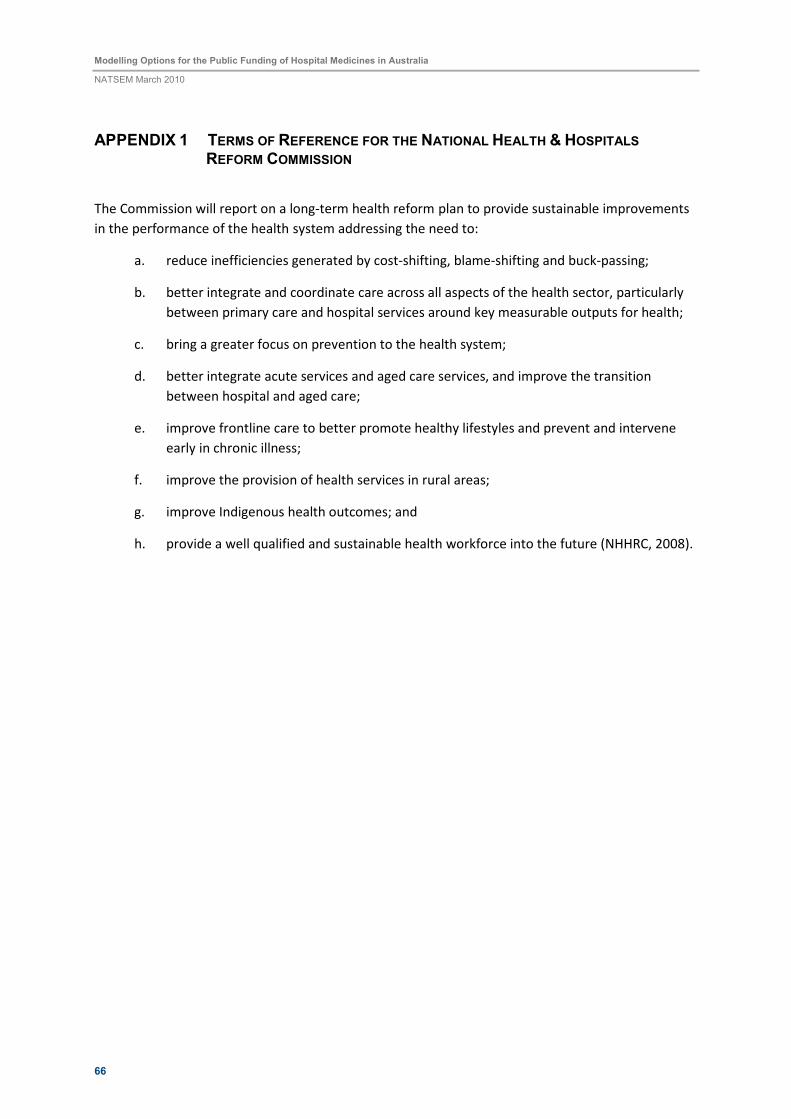
Modelling Options for the Public Funding of Hospital Medicines in Australia
NATSEM March 2010
66
APPENDIX 1 TERMS OF REFERENCE FOR THE NATIONAL HEALTH & HOSPITALS
REFORM COMMISSION
The Commission will report on a long-term health reform plan to provide sustainable improvements
in the performance of the health system addressing the need to:
a. reduce inefficiencies generated by cost-shifting, blame-shifting and buck-passing;
b. better integrate and coordinate care across all aspects of the health sector, particularly
between primary care and hospital services around key measurable outputs for health;
c. bring a greater focus on prevention to the health system;
d. better integrate acute services and aged care services, and improve the transition
between hospital and aged care;
e. improve frontline care to better promote healthy lifestyles and prevent and intervene
early in chronic illness;
f. improve the provision of health services in rural areas;
g. improve Indigenous health outcomes; and
h. provide a well qualified and sustainable health workforce into the future (NHHRC, 2008).
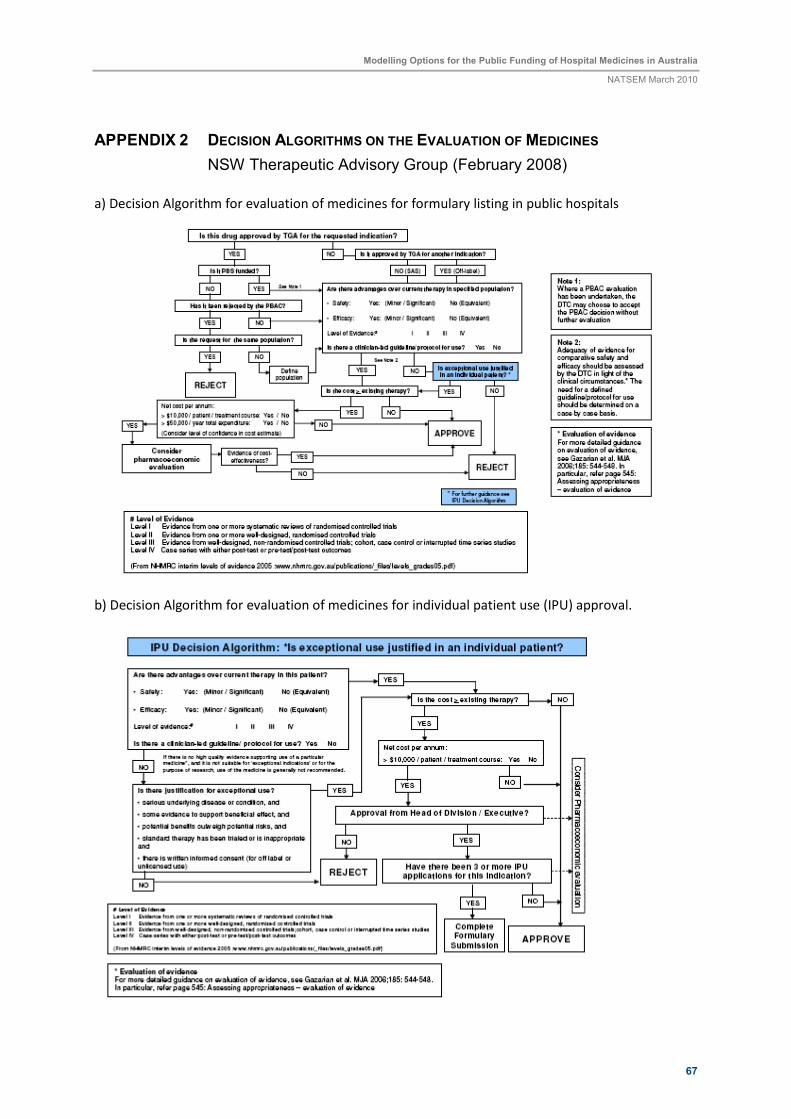
Modelling Options for the Public Funding of Hospital Medicines in Australia
NATSEM March 2010
67
APPENDIX 2 DECISION ALGORITHMS ON THE EVALUATION OF MEDICINES
NSW Therapeutic Advisory Group (February 2008)
a) Decision Algorithm for evaluation of medicines for formulary listing in public hospitals
b) Decision Algorithm for evaluation of medicines for individual patient use (IPU) approval.
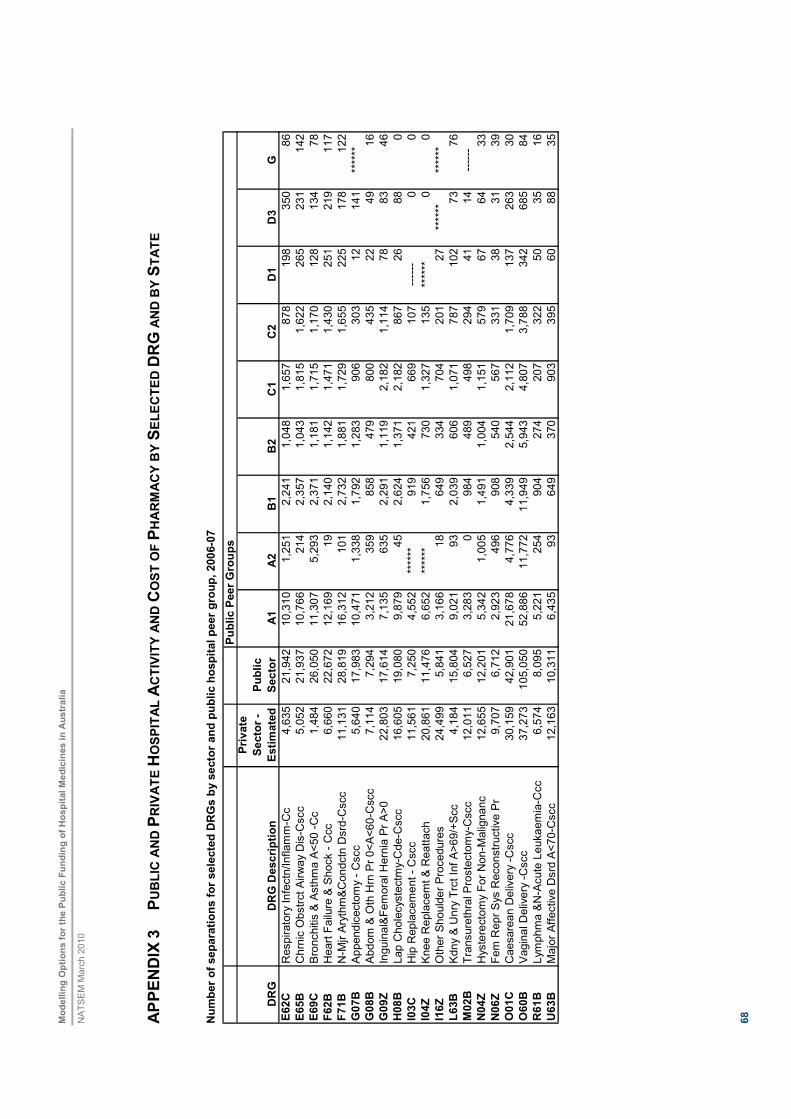
Modellin
g O
ptions for
the P
ublic F
undin
g o
f H
ospital M
edic
ines in A
ustr
alia
NATSEM March 2010
68
AP
PE
ND
IX 3
P
UB
LIC
AN
D P
RIV
ATE
HO
SP
ITA
L A
CTIV
ITY
AN
D C
OS
T O
F P
HA
RM
AC
Y B
Y S
ELE
CTE
D D
RG
AN
D B
Y S
TA
TE
Num
ber
of separa
tions for
sele
cte
d D
RG
s b
y s
ecto
r and p
ublic h
ospital peer
gro
up, 2006-0
7
Public P
eer
Gro
ups
DR
GD
RG
Descri
ption
Pri
vate
Secto
r -
Estim
ate
d
Public
Secto
rA
1A
2B
1B
2C
1C
2D
1D
3G
E62C
Respiratory Infectn/Inflamm-Cc
4,635
21,942
10,310
1,251
2,241
1,048
1,657
878
198
350
86
E65B
Chrnic Obstrct Airway Dis-Cscc
5,052
21,937
10,766
214
2,357
1,043
1,815
1,622
265
231
142
E69C
Bronchitis & Asthma A<50 -Cc
1,484
26,050
11,307
5,293
2,371
1,181
1,715
1,170
128
134
78
F62B
Heart Failure & Shock - Ccc
6,660
22,672
12,169
19
2,140
1,142
1,471
1,430
251
219
117
F71B
N-Mjr Arythm&Condctn Dsrd-Cscc
11,131
28,819
16,312
101
2,732
1,881
1,729
1,655
225
178
122
G07B
Appendicectomy - Cscc
5,640
17,983
10,471
1,338
1,792
1,283
906
303
12
141
******
G08B
Abdom & Oth Hrn Pr 0<A<60-Cscc
7,114
7,294
3,212
359
858
479
800
435
22
49
16
G09Z
Inguinal&Femoral Hernia Pr A>0
22,803
17,614
7,135
635
2,291
1,119
2,182
1,114
78
83
46
H08B
Lap Cholecystectmy-Cde-Cscc
16,605
19,080
9,879
45
2,624
1,371
2,182
867
26
88
0
I03C
Hip Replacement - Cscc
11,561
7,250
4,552
******
919
421
669
107
------
00
I04Z
Knee Replacemt & Reattach
20,861
11,476
6,652
******
1,756
730
1,327
135
******
00
I16Z
Other Shoulder Procedures
24,499
5,841
3,166
18
649
334
704
201
27
******
******
L63B
Kdny & Unry Trct Inf A>69/+Scc
4,184
15,804
9,021
93
2,039
606
1,071
787
102
73
76
M02B
Transurethral Prostectomy-Cscc
12,011
6,527
3,283
0984
489
498
294
41
14
------
N04Z
Hysterectomy For Non-Malignanc
12,655
12,201
5,342
1,005
1,491
1,004
1,151
579
67
64
33
N06Z
Fem Repr Sys Reconstructive Pr
9,707
6,712
2,923
496
908
540
567
331
38
31
39
O01C
Caesarean Delivery -Cscc
30,159
42,901
21,678
4,776
4,339
2,544
2,112
1,709
137
263
30
O60B
Vaginal Delivery -Cscc
37,273
105,050
52,886
11,772
11,949
5,943
4,807
3,788
342
685
84
R61B
Lymphma &N-Acute Leukaemia-Ccc
6,574
8,095
5,221
254
904
274
207
322
50
35
16
U63B
Major Affective Dsrd A<70-Cscc
12,163
10,311
6,435
93
649
370
903
395
60
88
35
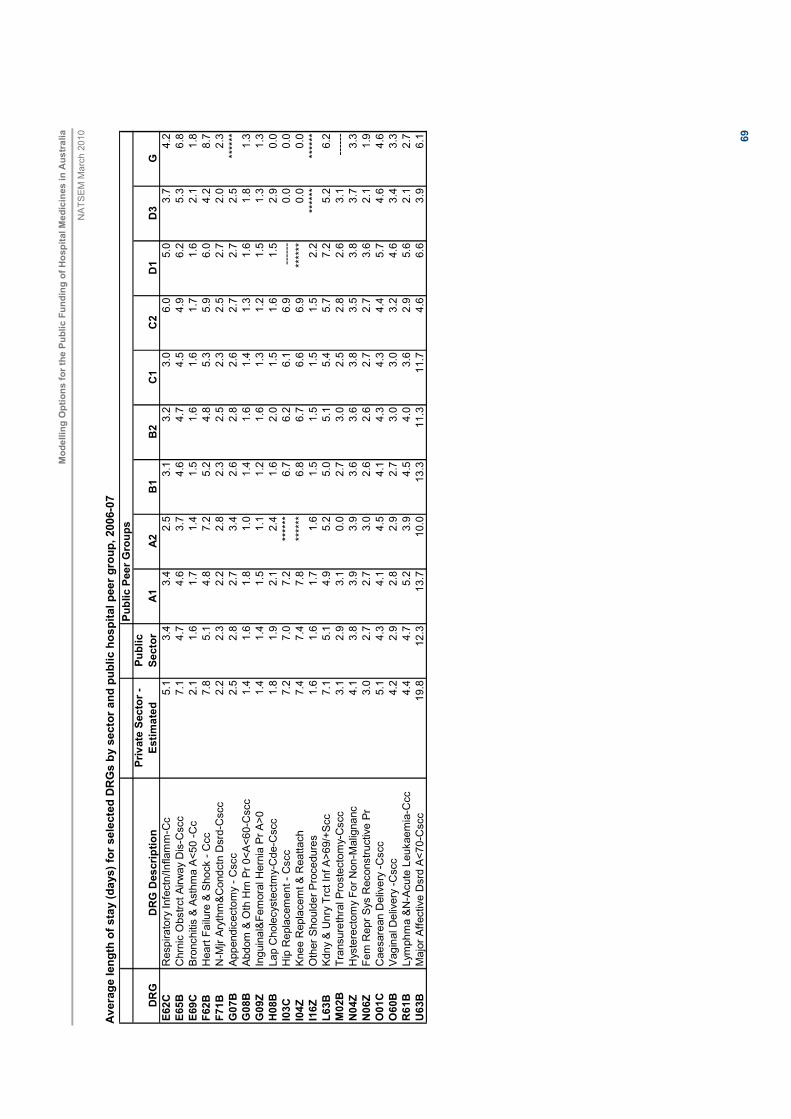
Modellin
g O
ptions for
the P
ublic F
undin
g o
f H
ospital M
edic
ines in A
ustr
alia
NATSEM March 2010
69
Avera
ge length
of sta
y (days) fo
r sele
cte
d D
RG
s b
y s
ecto
r and p
ublic h
ospital peer
gro
up, 2006-0
7
Public P
eer
Gro
ups
DR
GD
RG
Descri
ption
Private
Secto
r -
Estim
ate
d
Public
Secto
rA
1A
2B
1B
2C
1C
2D
1D
3G
E62C
Respiratory Infectn/Inflamm-Cc
5.1
3.4
3.4
2.5
3.1
3.2
3.0
6.0
5.0
3.7
4.2
E65B
Chrnic Obstrct Airway Dis-Cscc
7.1
4.7
4.6
3.7
4.6
4.7
4.5
4.9
6.2
5.3
6.8
E69C
Bronchitis & Asthma A<50 -Cc
2.1
1.6
1.7
1.4
1.5
1.6
1.6
1.7
1.6
2.1
1.8
F62B
Heart Failure & Shock - Ccc
7.8
5.1
4.8
7.2
5.2
4.8
5.3
5.9
6.0
4.2
8.7
F71B
N-Mjr Arythm&Condctn Dsrd-Cscc
2.2
2.3
2.2
2.8
2.3
2.5
2.3
2.5
2.7
2.0
2.3
G07B
Appendicectomy - Cscc
2.5
2.8
2.7
3.4
2.6
2.8
2.6
2.7
2.7
2.5
******
G08B
Abdom & Oth Hrn Pr 0<A<60-Cscc
1.4
1.6
1.8
1.0
1.4
1.6
1.4
1.3
1.6
1.8
1.3
G09Z
Inguinal&Femoral Hernia Pr A>0
1.4
1.4
1.5
1.1
1.2
1.6
1.3
1.2
1.5
1.3
1.3
H08B
Lap Cholecystectmy-Cde-Cscc
1.8
1.9
2.1
2.4
1.6
2.0
1.5
1.6
1.5
2.9
0.0
I03C
Hip Replacement - Cscc
7.2
7.0
7.2
******
6.7
6.2
6.1
6.9
------
0.0
0.0
I04Z
Knee Replacemt & Reattach
7.4
7.4
7.8
******
6.8
6.7
6.6
6.9
******
0.0
0.0
I16Z
Other Shoulder Procedures
1.6
1.6
1.7
1.6
1.5
1.5
1.5
1.5
2.2
******
******
L63B
Kdny & Unry Trct Inf A>69/+Scc
7.1
5.1
4.9
5.2
5.0
5.1
5.4
5.7
7.2
5.2
6.2
M02B
Transurethral Prostectomy-Cscc
3.1
2.9
3.1
0.0
2.7
3.0
2.5
2.8
2.6
3.1
------
N04Z
Hysterectomy For Non-Malignanc
4.1
3.8
3.9
3.9
3.6
3.6
3.8
3.5
3.8
3.7
3.3
N06Z
Fem Repr Sys Reconstructive Pr
3.0
2.7
2.7
3.0
2.6
2.6
2.7
2.7
3.6
2.1
1.9
O01C
Caesarean Delivery -Cscc
5.1
4.3
4.1
4.5
4.1
4.3
4.3
4.4
5.7
4.6
4.6
O60B
Vaginal Delivery -Cscc
4.2
2.9
2.8
2.9
2.7
3.0
3.0
3.2
4.6
3.4
3.3
R61B
Lymphma &N-Acute Leukaemia-Ccc
4.4
4.7
5.2
3.9
4.5
4.0
3.6
2.9
5.6
2.1
2.7
U63B
Major Affective Dsrd A<70-Cscc
19.8
12.3
13.7
10.0
13.3
11.3
11.7
4.6
6.6
3.9
6.1
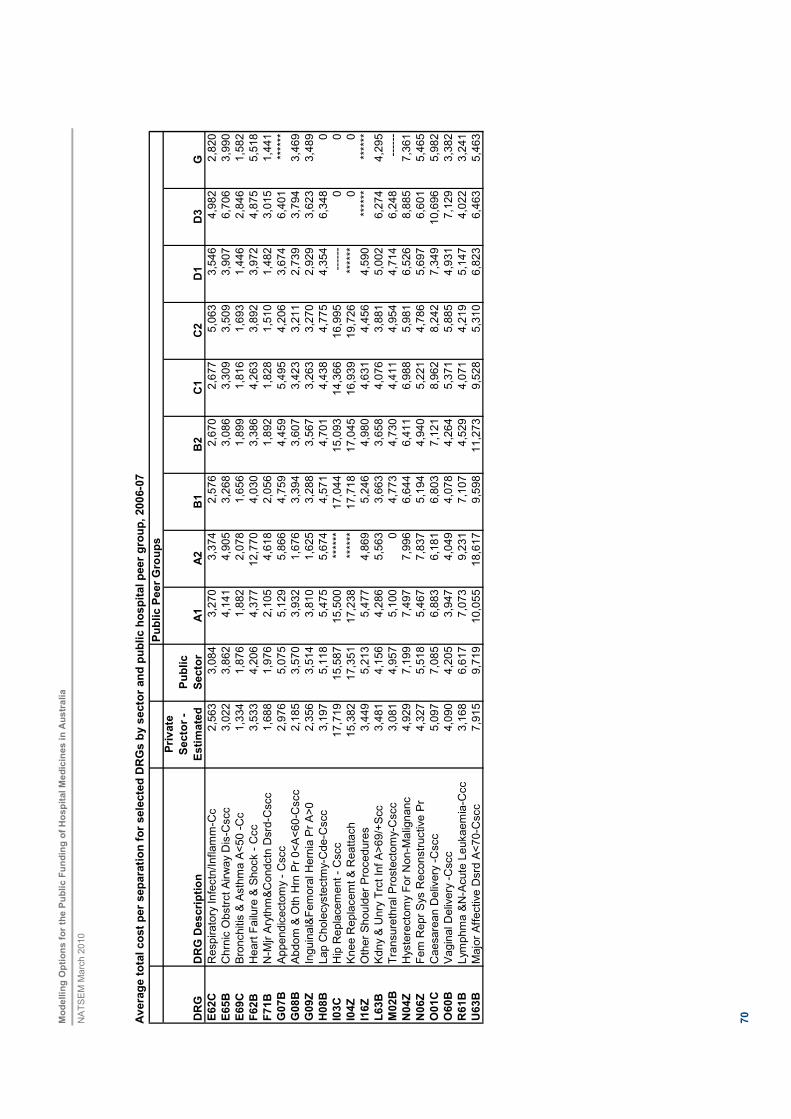
Modellin
g O
ptions for
the P
ublic F
undin
g o
f H
ospital M
edic
ines in A
ustr
alia
NATSEM March 2010
70
Avera
ge tota
l cost per
separa
tion for
sele
cte
d D
RG
s b
y s
ecto
r and p
ublic h
ospital peer
gro
up, 2006-0
7
Public P
eer G
roups
DR
GD
RG
Descri
ption
Pri
vate
Secto
r -
Estim
ate
d
Public
Secto
rA
1A
2B
1B
2C
1C
2D
1D
3G
E62C
Respiratory Infectn/Inflamm-Cc
2,563
3,084
3,270
3,374
2,576
2,670
2,677
5,063
3,546
4,982
2,820
E65B
Chrnic Obstrct Airway Dis-Cscc
3,022
3,862
4,141
4,905
3,268
3,086
3,309
3,509
3,907
6,706
3,990
E69C
Bronchitis & Asthma A<50 -Cc
1,334
1,876
1,882
2,078
1,656
1,899
1,816
1,693
1,446
2,846
1,582
F62B
Heart Failure & Shock - Ccc
3,533
4,206
4,377
12,770
4,030
3,386
4,263
3,892
3,972
4,875
5,518
F71B
N-Mjr Arythm&Condctn Dsrd-Cscc
1,688
1,976
2,105
4,618
2,056
1,892
1,828
1,510
1,482
3,015
1,441
G07B
Appendicectomy - Cscc
2,976
5,075
5,129
5,866
4,759
4,459
5,495
4,206
3,674
6,401
******
G08B
Abdom & Oth Hrn Pr 0<A<60-Cscc
2,185
3,570
3,932
1,676
3,394
3,607
3,423
3,211
2,739
3,794
3,469
G09Z
Inguinal&Femoral Hernia Pr A>0
2,356
3,514
3,810
1,625
3,288
3,567
3,263
3,270
2,929
3,623
3,489
H08B
Lap Cholecystectmy-Cde-Cscc
3,197
5,118
5,475
5,674
4,571
4,701
4,438
4,775
4,354
6,348
0
I03C
Hip Replacement - Cscc
17,719
15,587
15,500
******
17,044
15,093
14,366
16,995
------
00
I04Z
Knee Replacemt & Reattach
15,382
17,351
17,238
******
17,718
17,045
16,939
19,726
******
00
I16Z
Other Shoulder Procedures
3,449
5,213
5,477
4,869
5,246
4,980
4,631
4,456
4,590
******
******
L63B
Kdny & Unry Trct Inf A>69/+Scc
3,481
4,156
4,286
5,563
3,663
3,658
4,076
3,881
5,002
6,274
4,295
M02B
Transurethral Prostectomy-Cscc
3,081
4,957
5,100
04,773
4,730
4,411
4,954
4,714
6,248
------
N04Z
Hysterectomy For Non-Malignanc
4,929
7,199
7,497
7,996
6,644
6,411
6,988
5,981
6,526
8,885
7,361
N06Z
Fem Repr Sys Reconstructive Pr
4,327
5,518
5,467
7,837
5,194
4,940
5,221
4,786
5,697
6,601
5,465
O01C
Caesarean Delivery -Cscc
5,097
7,085
6,883
6,181
6,803
7,121
8,962
8,242
7,349
10,696
5,982
O60B
Vaginal Delivery -Cscc
4,090
4,205
3,947
4,049
4,078
4,264
5,371
5,885
4,931
7,129
3,382
R61B
Lymphma &N-Acute Leukaemia-Ccc
3,168
6,617
7,073
9,231
7,107
4,529
4,071
4,219
5,147
4,022
3,241
U63B
Major Affective Dsrd A<70-Cscc
7,915
9,719
10,055
18,617
9,598
11,273
9,528
5,310
6,823
6,463
5,463
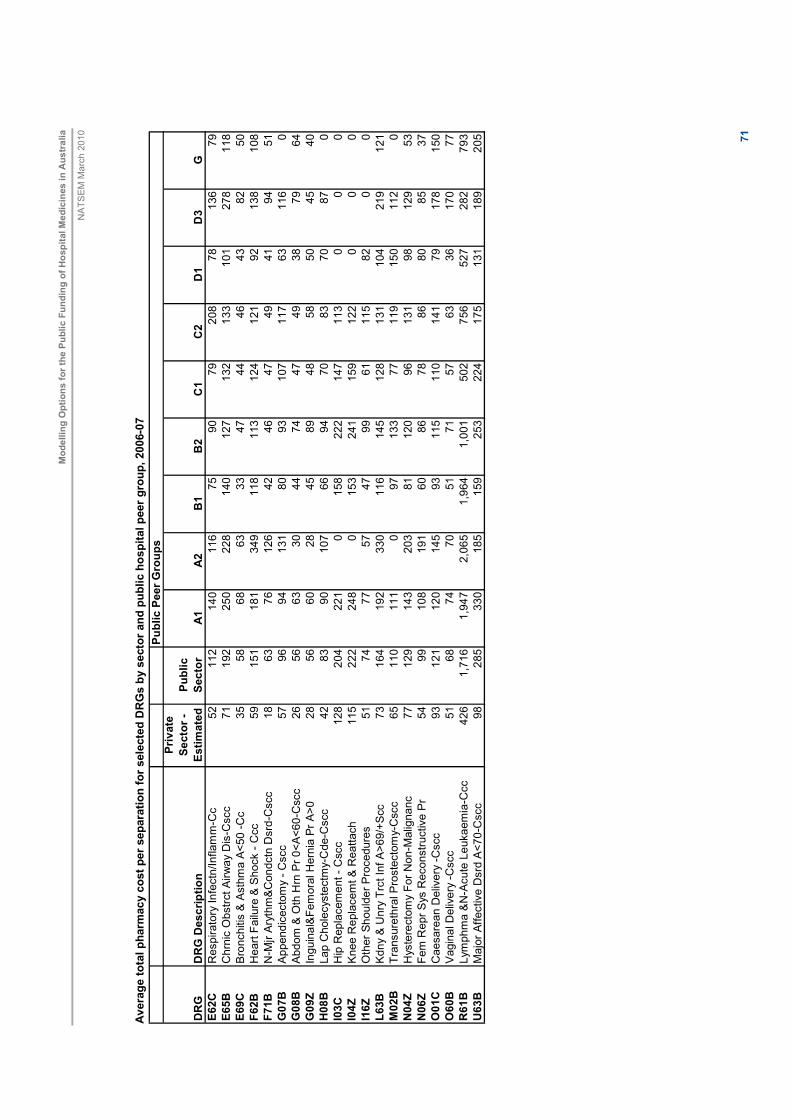
Modellin
g O
ptions for
the P
ublic F
undin
g o
f H
ospital M
edic
ines in A
ustr
alia
NATSEM March 2010
71
Avera
ge tota
l pharm
acy c
ost per
separa
tion for
sele
cte
d D
RG
s b
y s
ecto
r and p
ublic h
ospital peer
gro
up, 2006-0
7
Public P
eer
Gro
ups
DR
GD
RG
Description
Pri
vate
Secto
r -
Estim
ate
d
Public
Secto
rA
1A
2B
1B
2C
1C
2D
1D
3G
E62C
Respiratory Infectn/Inflamm-Cc
52
112
140
116
75
90
79
208
78
136
79
E65B
Chrnic Obstrct Airway Dis-Cscc
71
192
250
228
140
127
132
133
101
278
118
E69C
Bronchitis & Asthma A<50 -Cc
35
58
68
63
33
47
44
46
43
82
50
F62B
Heart Failure & Shock - Ccc
59
151
181
349
118
113
124
121
92
138
108
F71B
N-Mjr Arythm&Condctn Dsrd-Cscc
18
63
76
126
42
46
47
49
41
94
51
G07B
Appendicectomy - Cscc
57
96
94
131
80
93
107
117
63
116
0
G08B
Abdom & Oth Hrn Pr 0<A<60-Cscc
26
56
63
30
44
74
47
49
38
79
64
G09Z
Inguinal&Femoral Hernia Pr A>0
28
56
60
28
45
89
48
58
50
45
40
H08B
Lap Cholecystectmy-Cde-Cscc
42
83
90
107
66
94
70
83
70
87
0
I03C
Hip Replacement - Cscc
128
204
221
0158
222
147
113
00
0
I04Z
Knee Replacemt & Reattach
115
222
248
0153
241
159
122
00
0
I16Z
Other Shoulder Procedures
51
74
77
57
47
99
61
115
82
00
L63B
Kdny & Unry Trct Inf A>69/+Scc
73
164
192
330
116
145
128
131
104
219
121
M02B
Transurethral Prostectomy-Cscc
65
110
111
097
133
77
119
150
112
0
N04Z
Hysterectomy For Non-Malignanc
77
129
143
203
81
120
96
131
98
129
53
N06Z
Fem Repr Sys Reconstructive Pr
54
99
108
191
60
86
78
86
80
85
37
O01C
Caesarean Delivery -Cscc
93
121
120
145
93
115
110
141
79
178
150
O60B
Vaginal Delivery -Cscc
51
68
74
70
51
71
57
63
36
170
77
R61B
Lymphma &N-Acute Leukaemia-Ccc
426
1,716
1,947
2,065
1,964
1,001
502
756
527
282
793
U63B
Major Affective Dsrd A<70-Cscc
98
285
330
185
159
253
224
175
131
189
205
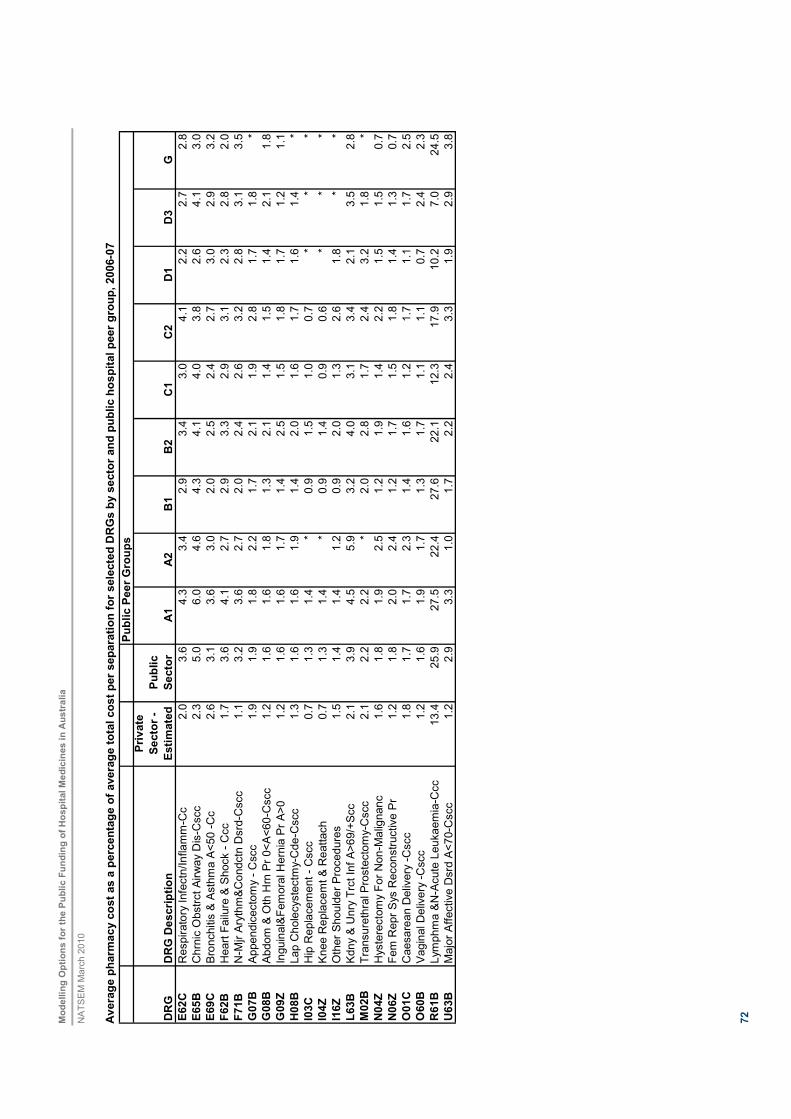
Modellin
g O
ptions for
the P
ublic F
undin
g o
f H
ospital M
edic
ines in A
ustr
alia
NATSEM March 2010
72
Avera
ge p
harm
acy c
ost as a
perc
enta
ge o
f avera
ge tota
l cost per
separa
tion for
sele
cte
d D
RG
s b
y s
ecto
r and p
ublic h
ospital peer
gro
up, 2006-0
7
Public P
eer G
roups
DR
GD
RG
Description
Private
Secto
r -
Estim
ate
d
Public
Secto
rA
1A
2B
1B
2C
1C
2D
1D
3G
E62C
Respiratory Infectn/Inflamm-Cc
2.0
3.6
4.3
3.4
2.9
3.4
3.0
4.1
2.2
2.7
2.8
E65B
Chrnic Obstrct Airway Dis-Cscc
2.3
5.0
6.0
4.6
4.3
4.1
4.0
3.8
2.6
4.1
3.0
E69C
Bronchitis & Asthma A<50 -Cc
2.6
3.1
3.6
3.0
2.0
2.5
2.4
2.7
3.0
2.9
3.2
F62B
Heart Failure & Shock - Ccc
1.7
3.6
4.1
2.7
2.9
3.3
2.9
3.1
2.3
2.8
2.0
F71B
N-Mjr Arythm&Condctn Dsrd-Cscc
1.1
3.2
3.6
2.7
2.0
2.4
2.6
3.2
2.8
3.1
3.5
G07B
Appendicectomy - Cscc
1.9
1.9
1.8
2.2
1.7
2.1
1.9
2.8
1.7
1.8
*
G08B
Abdom & Oth Hrn Pr 0<A<60-Cscc
1.2
1.6
1.6
1.8
1.3
2.1
1.4
1.5
1.4
2.1
1.8
G09Z
Inguinal&Femoral Hernia Pr A>0
1.2
1.6
1.6
1.7
1.4
2.5
1.5
1.8
1.7
1.2
1.1
H08B
Lap Cholecystectmy-Cde-Cscc
1.3
1.6
1.6
1.9
1.4
2.0
1.6
1.7
1.6
1.4
*
I03C
Hip Replacement - Cscc
0.7
1.3
1.4
*0.9
1.5
1.0
0.7
**
*
I04Z
Knee Replacemt & Reattach
0.7
1.3
1.4
*0.9
1.4
0.9
0.6
**
*
I16Z
Other Shoulder Procedures
1.5
1.4
1.4
1.2
0.9
2.0
1.3
2.6
1.8
**
L63B
Kdny & Unry Trct Inf A>69/+Scc
2.1
3.9
4.5
5.9
3.2
4.0
3.1
3.4
2.1
3.5
2.8
M02B
Transurethral Prostectomy-Cscc
2.1
2.2
2.2
*2.0
2.8
1.7
2.4
3.2
1.8
*
N04Z
Hysterectomy For Non-Malignanc
1.6
1.8
1.9
2.5
1.2
1.9
1.4
2.2
1.5
1.5
0.7
N06Z
Fem Repr Sys Reconstructive Pr
1.2
1.8
2.0
2.4
1.2
1.7
1.5
1.8
1.4
1.3
0.7
O01C
Caesarean Delivery -Cscc
1.8
1.7
1.7
2.3
1.4
1.6
1.2
1.7
1.1
1.7
2.5
O60B
Vaginal Delivery -Cscc
1.2
1.6
1.9
1.7
1.3
1.7
1.1
1.1
0.7
2.4
2.3
R61B
Lymphma &N-Acute Leukaemia-Ccc
13.4
25.9
27.5
22.4
27.6
22.1
12.3
17.9
10.2
7.0
24.5
U63B
Major Affective Dsrd A<70-Cscc
1.2
2.9
3.3
1.0
1.7
2.2
2.4
3.3
1.9
2.9
3.8
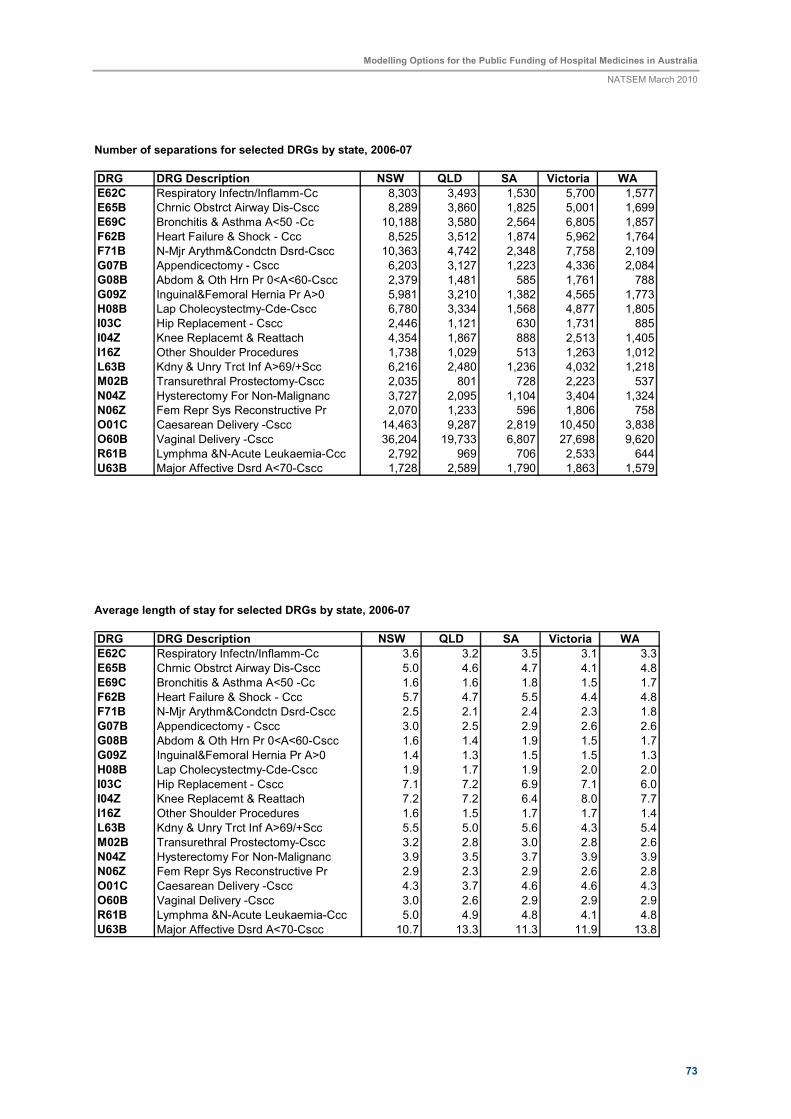
Modelling Options for the Public Funding of Hospital Medicines in Australia
NATSEM March 2010
73
Number of separations for selected DRGs by state, 2006-07
DRG DRG Description NSW QLD SA Victoria WA
E62C Respiratory Infectn/Inflamm-Cc 8,303 3,493 1,530 5,700 1,577
E65B Chrnic Obstrct Airway Dis-Cscc 8,289 3,860 1,825 5,001 1,699
E69C Bronchitis & Asthma A<50 -Cc 10,188 3,580 2,564 6,805 1,857
F62B Heart Failure & Shock - Ccc 8,525 3,512 1,874 5,962 1,764
F71B N-Mjr Arythm&Condctn Dsrd-Cscc 10,363 4,742 2,348 7,758 2,109
G07B Appendicectomy - Cscc 6,203 3,127 1,223 4,336 2,084
G08B Abdom & Oth Hrn Pr 0<A<60-Cscc 2,379 1,481 585 1,761 788
G09Z Inguinal&Femoral Hernia Pr A>0 5,981 3,210 1,382 4,565 1,773
H08B Lap Cholecystectmy-Cde-Cscc 6,780 3,334 1,568 4,877 1,805
I03C Hip Replacement - Cscc 2,446 1,121 630 1,731 885
I04Z Knee Replacemt & Reattach 4,354 1,867 888 2,513 1,405
I16Z Other Shoulder Procedures 1,738 1,029 513 1,263 1,012
L63B Kdny & Unry Trct Inf A>69/+Scc 6,216 2,480 1,236 4,032 1,218
M02B Transurethral Prostectomy-Cscc 2,035 801 728 2,223 537
N04Z Hysterectomy For Non-Malignanc 3,727 2,095 1,104 3,404 1,324
N06Z Fem Repr Sys Reconstructive Pr 2,070 1,233 596 1,806 758
O01C Caesarean Delivery -Cscc 14,463 9,287 2,819 10,450 3,838
O60B Vaginal Delivery -Cscc 36,204 19,733 6,807 27,698 9,620
R61B Lymphma &N-Acute Leukaemia-Ccc 2,792 969 706 2,533 644
U63B Major Affective Dsrd A<70-Cscc 1,728 2,589 1,790 1,863 1,579
Average length of stay for selected DRGs by state, 2006-07
DRG DRG Description NSW QLD SA Victoria WA
E62C Respiratory Infectn/Inflamm-Cc 3.6 3.2 3.5 3.1 3.3
E65B Chrnic Obstrct Airway Dis-Cscc 5.0 4.6 4.7 4.1 4.8
E69C Bronchitis & Asthma A<50 -Cc 1.6 1.6 1.8 1.5 1.7
F62B Heart Failure & Shock - Ccc 5.7 4.7 5.5 4.4 4.8
F71B N-Mjr Arythm&Condctn Dsrd-Cscc 2.5 2.1 2.4 2.3 1.8
G07B Appendicectomy - Cscc 3.0 2.5 2.9 2.6 2.6
G08B Abdom & Oth Hrn Pr 0<A<60-Cscc 1.6 1.4 1.9 1.5 1.7
G09Z Inguinal&Femoral Hernia Pr A>0 1.4 1.3 1.5 1.5 1.3
H08B Lap Cholecystectmy-Cde-Cscc 1.9 1.7 1.9 2.0 2.0
I03C Hip Replacement - Cscc 7.1 7.2 6.9 7.1 6.0
I04Z Knee Replacemt & Reattach 7.2 7.2 6.4 8.0 7.7
I16Z Other Shoulder Procedures 1.6 1.5 1.7 1.7 1.4
L63B Kdny & Unry Trct Inf A>69/+Scc 5.5 5.0 5.6 4.3 5.4
M02B Transurethral Prostectomy-Cscc 3.2 2.8 3.0 2.8 2.6
N04Z Hysterectomy For Non-Malignanc 3.9 3.5 3.7 3.9 3.9
N06Z Fem Repr Sys Reconstructive Pr 2.9 2.3 2.9 2.6 2.8
O01C Caesarean Delivery -Cscc 4.3 3.7 4.6 4.6 4.3
O60B Vaginal Delivery -Cscc 3.0 2.6 2.9 2.9 2.9
R61B Lymphma &N-Acute Leukaemia-Ccc 5.0 4.9 4.8 4.1 4.8
U63B Major Affective Dsrd A<70-Cscc 10.7 13.3 11.3 11.9 13.8
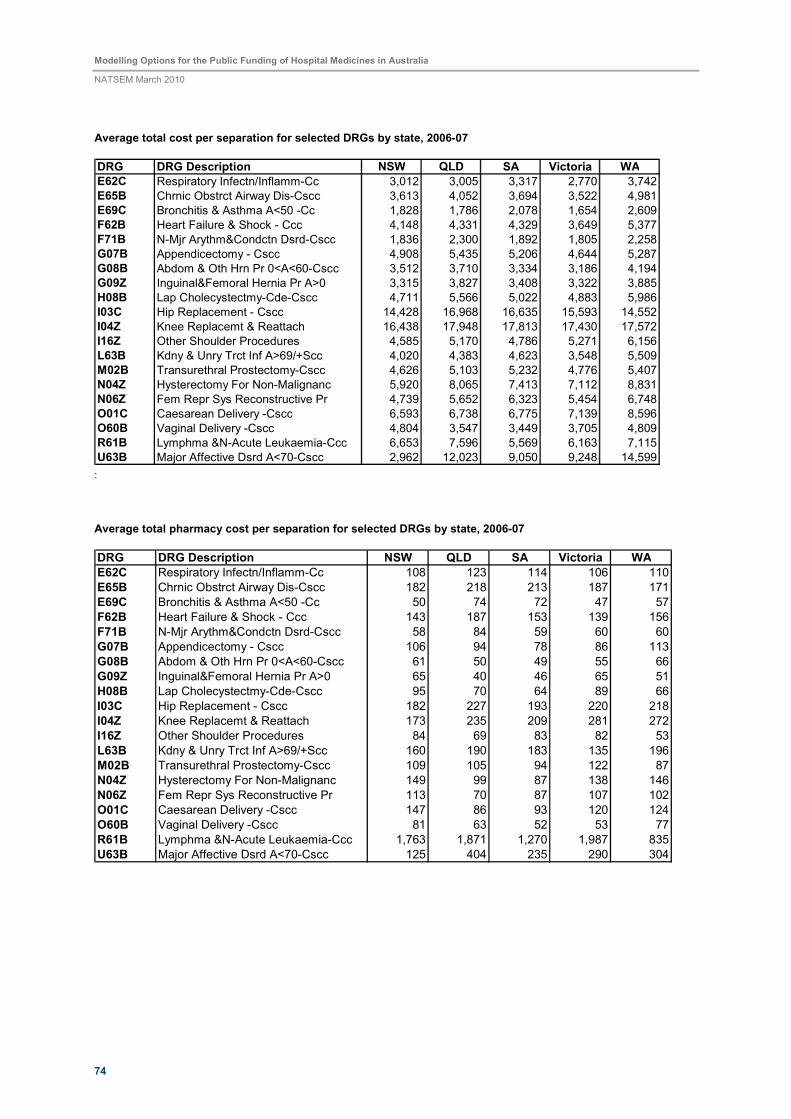
Modelling Options for the Public Funding of Hospital Medicines in Australia
NATSEM March 2010
74
Average total cost per separation for selected DRGs by state, 2006-07
DRG DRG Description NSW QLD SA Victoria WA
E62C Respiratory Infectn/Inflamm-Cc 3,012 3,005 3,317 2,770 3,742
E65B Chrnic Obstrct Airway Dis-Cscc 3,613 4,052 3,694 3,522 4,981
E69C Bronchitis & Asthma A<50 -Cc 1,828 1,786 2,078 1,654 2,609
F62B Heart Failure & Shock - Ccc 4,148 4,331 4,329 3,649 5,377
F71B N-Mjr Arythm&Condctn Dsrd-Cscc 1,836 2,300 1,892 1,805 2,258
G07B Appendicectomy - Cscc 4,908 5,435 5,206 4,644 5,287
G08B Abdom & Oth Hrn Pr 0<A<60-Cscc 3,512 3,710 3,334 3,186 4,194
G09Z Inguinal&Femoral Hernia Pr A>0 3,315 3,827 3,408 3,322 3,885
H08B Lap Cholecystectmy-Cde-Cscc 4,711 5,566 5,022 4,883 5,986
I03C Hip Replacement - Cscc 14,428 16,968 16,635 15,593 14,552
I04Z Knee Replacemt & Reattach 16,438 17,948 17,813 17,430 17,572
I16Z Other Shoulder Procedures 4,585 5,170 4,786 5,271 6,156
L63B Kdny & Unry Trct Inf A>69/+Scc 4,020 4,383 4,623 3,548 5,509
M02B Transurethral Prostectomy-Cscc 4,626 5,103 5,232 4,776 5,407
N04Z Hysterectomy For Non-Malignanc 5,920 8,065 7,413 7,112 8,831
N06Z Fem Repr Sys Reconstructive Pr 4,739 5,652 6,323 5,454 6,748
O01C Caesarean Delivery -Cscc 6,593 6,738 6,775 7,139 8,596
O60B Vaginal Delivery -Cscc 4,804 3,547 3,449 3,705 4,809
R61B Lymphma &N-Acute Leukaemia-Ccc 6,653 7,596 5,569 6,163 7,115
U63B Major Affective Dsrd A<70-Cscc 2,962 12,023 9,050 9,248 14,599 :
Average total pharmacy cost per separation for selected DRGs by state, 2006-07
DRG DRG Description NSW QLD SA Victoria WA
E62C Respiratory Infectn/Inflamm-Cc 108 123 114 106 110
E65B Chrnic Obstrct Airway Dis-Cscc 182 218 213 187 171
E69C Bronchitis & Asthma A<50 -Cc 50 74 72 47 57
F62B Heart Failure & Shock - Ccc 143 187 153 139 156
F71B N-Mjr Arythm&Condctn Dsrd-Cscc 58 84 59 60 60
G07B Appendicectomy - Cscc 106 94 78 86 113
G08B Abdom & Oth Hrn Pr 0<A<60-Cscc 61 50 49 55 66
G09Z Inguinal&Femoral Hernia Pr A>0 65 40 46 65 51
H08B Lap Cholecystectmy-Cde-Cscc 95 70 64 89 66
I03C Hip Replacement - Cscc 182 227 193 220 218
I04Z Knee Replacemt & Reattach 173 235 209 281 272
I16Z Other Shoulder Procedures 84 69 83 82 53
L63B Kdny & Unry Trct Inf A>69/+Scc 160 190 183 135 196
M02B Transurethral Prostectomy-Cscc 109 105 94 122 87
N04Z Hysterectomy For Non-Malignanc 149 99 87 138 146
N06Z Fem Repr Sys Reconstructive Pr 113 70 87 107 102
O01C Caesarean Delivery -Cscc 147 86 93 120 124
O60B Vaginal Delivery -Cscc 81 63 52 53 77
R61B Lymphma &N-Acute Leukaemia-Ccc 1,763 1,871 1,270 1,987 835
U63B Major Affective Dsrd A<70-Cscc 125 404 235 290 304
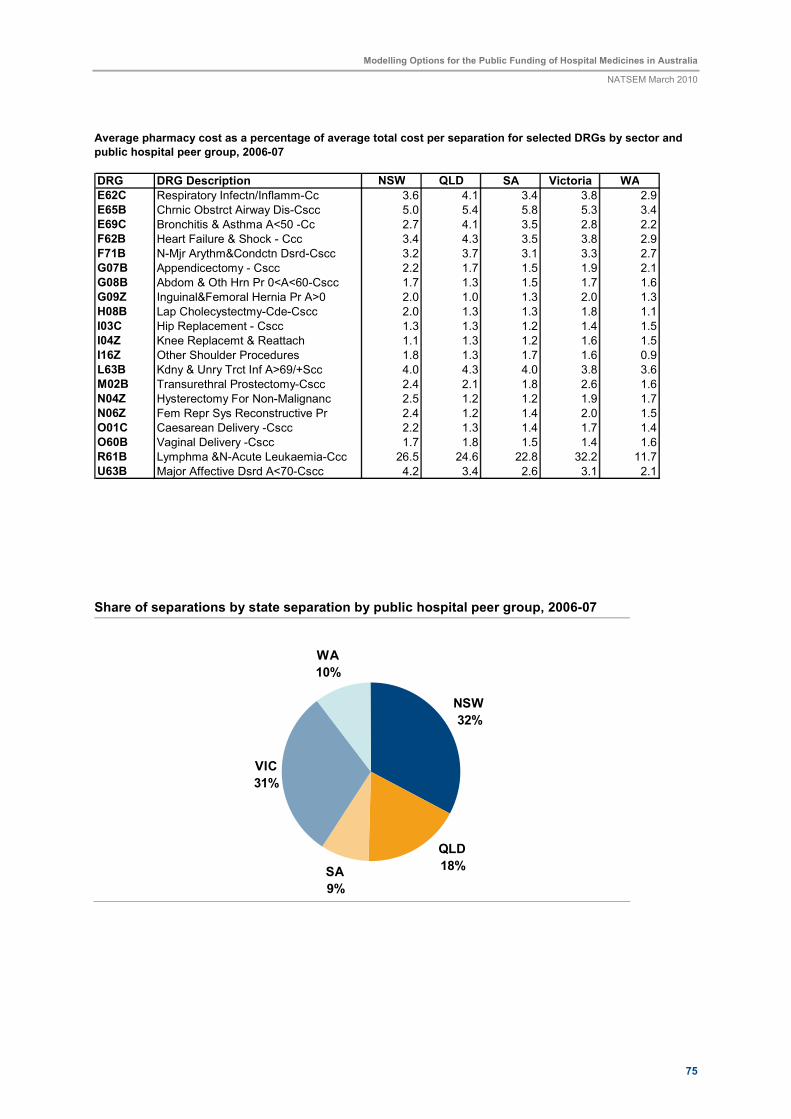
Modelling Options for the Public Funding of Hospital Medicines in Australia
NATSEM March 2010
75
Average pharmacy cost as a percentage of average total cost per separation for selected DRGs by sector and
public hospital peer group, 2006-07
DRG DRG Description NSW QLD SA Victoria WA
E62C Respiratory Infectn/Inflamm-Cc 3.6 4.1 3.4 3.8 2.9
E65B Chrnic Obstrct Airway Dis-Cscc 5.0 5.4 5.8 5.3 3.4
E69C Bronchitis & Asthma A<50 -Cc 2.7 4.1 3.5 2.8 2.2
F62B Heart Failure & Shock - Ccc 3.4 4.3 3.5 3.8 2.9
F71B N-Mjr Arythm&Condctn Dsrd-Cscc 3.2 3.7 3.1 3.3 2.7
G07B Appendicectomy - Cscc 2.2 1.7 1.5 1.9 2.1
G08B Abdom & Oth Hrn Pr 0<A<60-Cscc 1.7 1.3 1.5 1.7 1.6
G09Z Inguinal&Femoral Hernia Pr A>0 2.0 1.0 1.3 2.0 1.3
H08B Lap Cholecystectmy-Cde-Cscc 2.0 1.3 1.3 1.8 1.1
I03C Hip Replacement - Cscc 1.3 1.3 1.2 1.4 1.5
I04Z Knee Replacemt & Reattach 1.1 1.3 1.2 1.6 1.5
I16Z Other Shoulder Procedures 1.8 1.3 1.7 1.6 0.9
L63B Kdny & Unry Trct Inf A>69/+Scc 4.0 4.3 4.0 3.8 3.6
M02B Transurethral Prostectomy-Cscc 2.4 2.1 1.8 2.6 1.6
N04Z Hysterectomy For Non-Malignanc 2.5 1.2 1.2 1.9 1.7
N06Z Fem Repr Sys Reconstructive Pr 2.4 1.2 1.4 2.0 1.5
O01C Caesarean Delivery -Cscc 2.2 1.3 1.4 1.7 1.4
O60B Vaginal Delivery -Cscc 1.7 1.8 1.5 1.4 1.6
R61B Lymphma &N-Acute Leukaemia-Ccc 26.5 24.6 22.8 32.2 11.7
U63B Major Affective Dsrd A<70-Cscc 4.2 3.4 2.6 3.1 2.1
Share of separations by state separation by public hospital peer group, 2006-07
NSW
32%
SA
9%
VIC
31%
WA
10%
QLD
18%
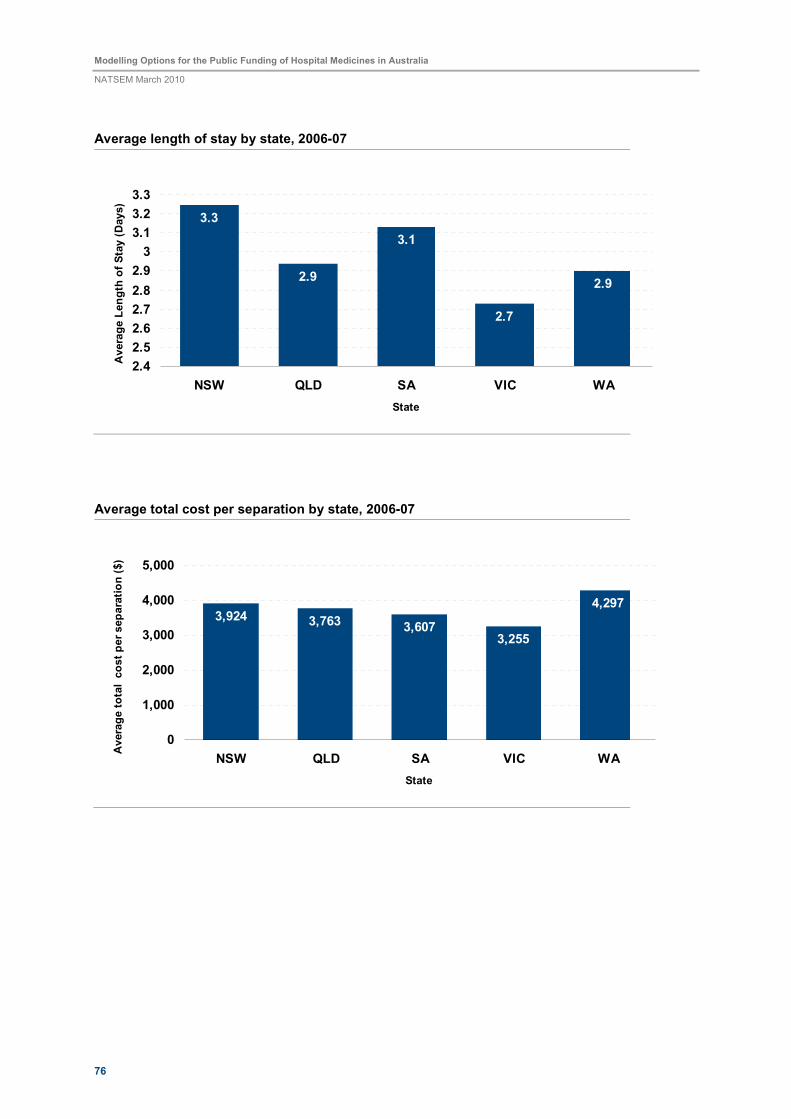
Modelling Options for the Public Funding of Hospital Medicines in Australia
NATSEM March 2010
76
Average length of stay by state, 2006-07
3.3
2.9
3.1
2.7
2.9
2.4
2.5
2.6
2.7
2.8
2.9
3
3.1
3.2
3.3
NSW QLD SA VIC WA
State
Avera
ge L
ength
of Sta
y (D
ays)
Average total cost per separation by state, 2006-07
3,924 3,763 3,6073,255
4,297
0
1,000
2,000
3,000
4,000
5,000
NSW QLD SA VIC WA
State
Avera
ge tota
l c
ost per separa
tion ($)
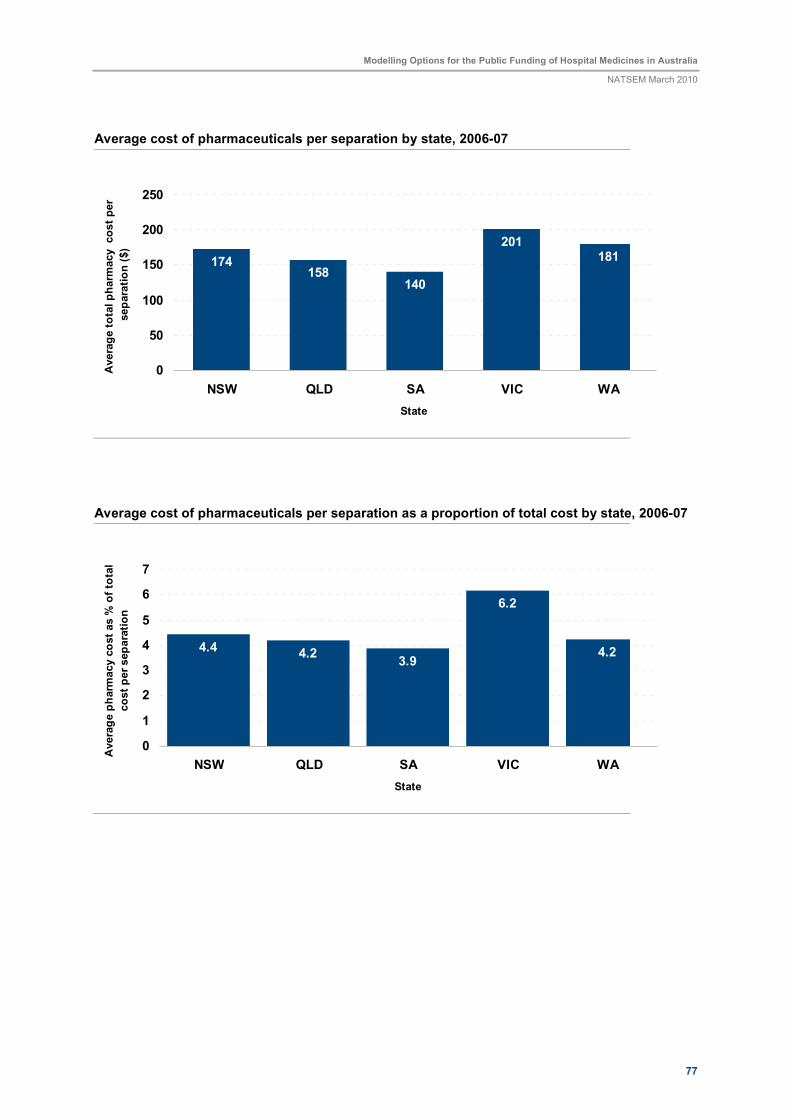
Modelling Options for the Public Funding of Hospital Medicines in Australia
NATSEM March 2010
77
Average cost of pharmaceuticals per separation by state, 2006-07
174158
140
201181
0
50
100
150
200
250
NSW QLD SA VIC WA
State
Avera
ge tota
l pharm
acy cost per
separa
tion ($)
Average cost of pharmaceuticals per separation as a proportion of total cost by state, 2006-07
4.4 4.23.9
6.2
4.2
0
1
2
3
4
5
6
7
NSW QLD SA VIC WA
State
Avera
ge p
harm
acy c
ost as %
of to
tal
cost per separa
tion

Modelling Options for the Public Funding of Hospital Medicines in Australia
NATSEM March 2010
78