Embed Size (px)
Citation preview
Modelling past and present geographical distribution ofthe marine gastropod Patella rustica as a tool forexploring responses to environmental change
F E R N A N D O P. L I M A *wz, P E D R O A . R I B E I R O wz, N U N O Q U E I R O Z wz, R A Q U E L X AV I E R w ,
P E D R O T A R R O S O w , S T E P H E N J . H AW K I N S z§ and A N T O N I O M . S A N T O S *w*Departamento de Zoologia-Antropologia, Faculdade de Ciencias da Universidade do Porto, 4099-002 Porto, Portugal, wCIBIO,
Centro de Investigacao em Biodiversidade e Recursos Geneticos, Campus Agrario de Vairao, 4485-661 Vairao, Portugal, zMarine
Biological Association of the United Kingdom, Plymouth, UK, §School of Oceanographic Sciences, University of Wales, Bangor,
Menai Bridge, Anglesey, UK
Abstract
A climate envelope approach was used to model the distributions of the intertidal
gastropod Patella rustica, to test the robustness of forecast responses to climate change.
The model incorporated variables that were likely to determine the abundance and the
northern range limit of this species in the NE Atlantic. The model was built using
classification and regression tree analysis (CART) trained with historical distribution
data from the mid 1950s and a set of corresponding climatic and oceanographic variables.
Results indicated air and sea temperature, in particular during the reproductive and
settlement periods, as the main determinants of the Atlantic distribution of P. rustica.
The model was subsequently fed with contemporary climatic data and its output was
compared with the current distribution and abundance of P. rustica, assessed during
a 2002–2003 survey. The model correctly hindcasted the recent collapse of a distributional
gap in northern Portugal, as well as an increase in abundance at locations within its
range. The predicted northward expansion of the northern range limit did not occur
because the absence of the species was confirmed in a survey encompassing the whole
Atlantic French coast up to Brest. Stretches of unsuitable habitat too long to be overcome
by dispersal are the likely mechanism controlling the northern limit of the distribution
of this intertidal species.
Keywords: biogeography, classification and regression trees (CART), climate change, intertidal, marine
gastropod, modelling, Patella rustica
Received 16 March 2007; revised version received 8 June 2007 and accepted 4 May 2007
Introduction
The application of species distribution models has con-
siderably increased in the last two decades, mainly
driven by the need to predict the potential impacts of
climate change on the distribution of organisms (Guisan
& Thuiller, 2005). From the vast array of methods
currently available, single-species bioclimatic envelope
models (BEMs) have been widely used (Heikkinen et al.,
2006). These models use the current geographic distri-
bution of a species to infer its environmental require-
ments, and then to predict its geographic distribution
for the current, or for past or future climates (Hijmans
& Graham, 2006). Yet, given their correlative nature, the
validity of such approaches has been progressively
questioned (see Araujo & Guisan, 2006). The problem
is twofold. First, BEMs seldom account for the effects
of biotic interactions, adaptive change and dispersal
(Pearson & Dawson, 2003). This results in highly biased
models that tend to produce inaccurate scenarios
(Davies et al., 1998; Hampe, 2004). Second, independent
validation of models is often not possible, because the
events being predicted have not yet occurred or are
poorly known (Araujo & Guisan, 2006). Nonindepen-
dent validation (resubstitution, data splitting) usually
ends up in unrealistically optimistic estimates of their
predictive ability (Araujo et al., 2005).
Correspondence: Present address: Fernando Padua Silva e Lima,
School of Biological Sciences, University of South Carolina, SC
29208, USA, tel. 11 803 777 3936, fax 11 803 777 4002,
e-mail: [email protected]
Global Change Biology (2007) 13, 2065–2077, doi: 10.1111/j.1365-2486.2007.01424.x
r 2007 The AuthorsJournal compilation r 2007 Blackwell Publishing Ltd 2065

Despite being highly deterministic, BEMs have some
advantages over the more complex rule-based mechan-
istic models (see Guisan & Zimmermann, 2000), pro-
vided that they are used in the appropriate context
(Araujo et al., 2005), that the choice of the model is well
grounded (Hijmans & Graham, 2006) and that results
are interpreted with caution (Hodkinson, 1999). BEMs
can present a fast and useful tool for the identification of
key relationships between species and the factors con-
trolling their distribution (Huntley et al., 2004), espe-
cially at large scales (e.g. continental and global) where
the importance of climatic forcing is thought to be
higher (Pearson et al., 2002; Pearson & Dawson, 2003).
When range-limiting physiological factors for a given
species are poorly known, these methods may represent
the best possible approach (Crumpacker et al., 2001).
In the marine environment, BEMs have been sparsely
applied to model species distributions (but see De’ath
& Fabricius, 2000; Clark et al., 2003; Friedlaender et al.,
2006; Kaschner et al., 2006). This is unfortunate because
there are many well-documented cases of recent
changes (either expansions or retractions) of species’
ranges which are thought to be a direct consequence of
global warming (for a review see Helmuth et al., 2006b).
Rocky intertidal communities, in particular, are well
suited for studying climate-driven community changes
(Herbert et al., 2003; Simkanin et al., 2005) because their
ecologies are well-known (Southward et al., 1995) from
decades of experimental studying of recruitment
dynamics and biological interactions (see Raffaelli
& Hawkins, 1996; Bertness et al., 2001 for reviews).
Moreover, their inhabitants are often exposed to tem-
perature and weather extremes, living close to their
thermal tolerance (Wolcott, 1973; Tomanek & Helmuth,
2002). Also, intertidal organisms can be easily surveyed
because they are generally conspicuous, slow moving
or sedentary, and their ranges are roughly one-dimen-
sional, conveniently defined by the coastal end points
(Sagarin & Gaines, 2002). Thus, the seashore provides
both a trackable testing ground for scientific debate on
the utility and applicability of BEMs to model and
predict species distributions under climate change and
a wealth of insight into the probable complexity of the
phenomena being modelled (see Helmuth et al., 2006b).
In this work, a single-species bioclimatic envelope
approach was used to gain further insights into the
factors driving the distribution of a marine gastropod,
Patella rustica Linnaeus 1758, in the northeast Atlantic.
In a recent paper, Lima et al. (2006) described the
collapse of an historical distributional gap, in northern
Portugal, which occurred in the late 1990s and coin-
cided with a combination of unusual climatic and
hydrographic events that were particularly pronounced
between 1997 and 1999. In this period, a significant
warming of sea-surface temperature (SST) during au-
tumn/early winter was observed in addition to the
general increase in average SST off the Portuguese coast
(Lemos & Pires, 2004; Peliz et al., 2005; Lemos & Sanso,
2006). This, combined with strong river runoff and
weak upwelling (Dong et al., 2000; Santos et al., 2004),
may have facilitated the bridging of the gap.
The present work focused only on the northern part
of P. rustica distribution in the Atlantic, mainly because
empirical evidence showed that recent changes have
already occurred in this area, and a northwards expan-
sion was expected. P. rustica ranges from the Mediter-
ranean to the Atlantic coast of the Iberian Peninsula and
Northern Africa, including the Macaronesian Islands,
except the Azores (Ridgway et al., 1998). In the Atlantic,
its southern limit is speculated to occur further south
than Mauritania (Christiaens, 1973). However, apart
from this reference, no reliable data exist that could
have been used for modelling purposes. Thanks to the
exhaustive work of Fischer-Piette and colleagues (Crisp
& Fischer-Piette, 1959; Fischer-Piette & Gaillard, 1959)
the distribution of P. rustica along the Atlantic European
coast is well-known for the late 1950s. These data were
used together with several climatic and oceanographic
variables to build a BEM. The model was subsequently
evaluated by feeding it with climatic and oceanographic
data from the 1990s, when the distributional gap was
bridged, hindcasting the present day distribution of the
species. The output was then compared with the extant
distribution of P. rustica surveyed in 2002–2003. Thus,
the model was implemented to ‘understand’ the likely
mechanisms governing the distribution of this limpet
rather than to ‘predict’ its future distribution and model
evaluation was used to assess the ‘robustness’ of in-
ferred mechanisms rather than to estimate its predictive
accuracy (Araujo & Guisan, 2006). More importantly,
evaluation was done with an independent data set
(apart from spatial and temporal autocorrelation),
which is highly recommended but rarely used in BEMs
(Araujo et al., 2005).
Materials and methods
Biological data
Data on the distribution and abundance of P. rustica
along the European coastline (from the English
Channel to Morocco) were gathered for the 1950s from
the comprehensive works of Fischer-Piette (1953, 1955,
1958, 1963), Crisp & Southward (1958), Crisp & Fischer-
Piette (1959) and Fischer-Piette & Gaillard (1959). Be-
cause in each work, density of limpets was expressed by
different abundance scales, the number of abundance
categories was reduced to three: absent, rare and
2066 F. P. L I M A et al.
r 2007 The AuthorsJournal compilation r 2007 Blackwell Publishing Ltd, Global Change Biology, 13, 2065–2077

abundant. This caused some information loss (in some
cases true densities were available), but avoided wrong
categorization and provided comparable data for the
Atlantic range of P. rustica. Contemporary abundances
were recorded by thoroughly resurveying historical
localities between 2002 and 2003 and from Biarritz
towards the north in 2006 (see Fig. 1). Density of limpets
was estimated using several randomly placed
50� 50 cm2 quadrats, and then converted to the three-
class abundance scale.
Environmental data
Two climatic data sets were assembled and used in the
model. Because climatic and oceanographic factors such
as temperature and salinity are highly variable over the
years (Levitus et al., 2000), a time window large enough
to encompass a significant amount of variability but
simultaneously representative of the sampling years
and correlated with changes in distribution of P. rustica
was selected (Lima et al., 2006). The first set included
data from the 1950s (January 1950–December 1959) and
the second one incorporated data from the decade of
1990 (January 1991–December 2000). The environmental
conditions were described using six main climatic and
oceanographic variables: near surface air temperature
(NSAT), cloud cover (CC), precipitation (PP), SST, sea
surface salinity (SSS) and wave action (WA).
NSAT, CC and PP monthly averaged data covering
European land surface at a 10 min resolution were
obtained from the CRU TS 1.2 dataset, available from
the Tyndall Centre for Climate Change Research and
Climate Research Unit (http://www.cru.uea.ac.uk/,
Mitchell et al., 2002, 2004). These were imported into
GRASS Geographical Information System (GRASS De-
velopment Team, 2006) as raster maps. SST along the
north-eastern Atlantic coast, was derived from in situ
raw data obtained from the International Comprehen-
sive Ocean – Atmosphere Data Set (ICOADS, http://
icoads.noaa.gov/, Woodruff et al., 1988). To avoid bias
due to different daytime measurements, only data from
12 : 00 GMT were used. Point data were imported into
GRASS GIS and transformed into monthly raster maps
with a spatial resolution of 4 km using a surface inter-
polation method. Each cell was derived from the 12
nearest data points using the distance squared weight-
ing algorithm (Jarvis & Stuart, 2001). The variables
NSAT, CC, PP and SST are thought to be a surrogate
not only for the air and sea temperature to which
limpets are exposed, but also for other climatic factors
that potentially affect the heat budget of intertidal
organisms during low tide, like the amount of solar
irradiance and the evaporation rate (see Denny &
Harley, 2006). Sea salinity is another environmental
factor potentially important for the physiology and
fitness of limpets (Fischer-Piette, 1948). Monthly aver-
aged SSS data, with an average resolution of 0.51
latitude� 0.51 longitude cells, were extracted from
SODA-POP v1.2 model data set, available at the National
Virtual Ocean Data System live server webpage (http://
ferret.pmel.noaa.gov/NVODS/servlets/dataset) and im-
ported into GRASS GIS as raster maps. Because data were
only available from January 1958 onwards, the computed
average for the decade of 1950s was based solely on
2 years.
The resulting set of 240 (20 years� 12 months) SST,
NSAT, CC, PP and 164 SSS maps was stored in GRASS GIS
as monthly layers and sampled along the studied coast-
line in the locations visited by D. J. Crisp, E. Fisher-
Piette and J. Gaillard during the 1950s (Fischer-Piette,
1955, 1958, 1963; Crisp & Southward, 1958; Crisp &
Fischer-Piette, 1959; Fischer-Piette & Gaillard, 1959).
Sampled data for each parameter were combined to
build a table with each row denoting a geographical
location and each column a month/year combination.
For SST and NSAT, the general 10-year mean and the
average value of winter, summer and reproductive
seasons were computed, as well as the mean value of
the coldest and hottest month during those seasons.
Reproductive season was assumed to be from Septem-
ber to November (according to Ibanez et al., 1986, P. A.
Ribeiro, unpublished data). For CC and PP, the 10-year
average and the values of the percentiles 25, 50 and 75
were calculated. For SSS, only the long-term average
value during each studied period was considered.
An overview of the climatic variables can be found in
Table 1.
On the Atlantic coasts of Europe and North Africa the
presence of P. rustica is generally associated with steep
surfaces found in the upper eulittoral of exposed rocky
shores (Fischer-Piette & Gaillard, 1959; Lima et al.,
2006). Thus, a quantitative measure of sea exposure
was included in the model. Average wave power was
used as surrogate for the exposure of sampled locations
to the effects of wave action (WA). The EXposure
estimates for fragmented Archipelagos (EXA) proce-
dure as described by Ekebom et al. (2003) was generally
followed, apart from the need to obtain wave climatol-
ogy parameters from prevailing winds because they
were directly incorporated in the exposure model.
Hence, that computational step was skipped. Wave
climate data were downloaded from the European
Environmental Agency database (http://www.eea.
europa.eu). Data were only available for regularly
spaced offshore locations 50–100 km away from the
coastline (Fig. 1). Therefore, in every coastal location
the wave parameters of the nearest offshore point were
used. The fetch length was measured for each direction
M O D E L L I N G C H A N G E S I N P. R U S T I C A D I S T R I B U T I O N 2067
r 2007 The AuthorsJournal compilation r 2007 Blackwell Publishing Ltd, Global Change Biology, 13, 2065–2077

1
5101520
25
3035
40
45
50
55606570
75808590
95
100
105
110
115
120
125
132
Spain
France
Bay of Biscay
English Channel
Strait ofGibraltar
MediterraneanSea
Portugal
Morocco 100 km
Atlantic ocean
Lisbon
Porto
Coruña
Biarritz
Nantes
Brest
Bordeaux
Santander
Tangier
Fig. 1 Study area. Circles represent rocky shore locations and squares represent seawall constructions. Offshore points represent the
sites for which wave climatology data were available. 1 – Cap de la Hague, 2 – Cap de Carteret, 3 – Granville, 4 – Carolles, 5 – Pte. Grouin,
6 – Rotheneuf, 7 – Dinard, 8 – Cap Frehel, 9 – Cap d’Erquy, 10 – Pte. Pleneuf, 11 – Pte. Roselier, 12 – Pte. Pordic, 13 – St. Quay – Portri, 14 –
Trestrignel, 15 – Pte. Bihit, 16 – Pte. Locquirec, 17 – Pte. Primel, 18 – Pte. Bloscon, 19 – Greve Poulfoen, 20 – Pontusval, 21 – Guisseny, 22 –
Greve Vougot, 23 – Greve Lilia, 24 – Tremazan, 25 – Melon, 26 – Le Conquet, 27 – Camaret, 28 – Pte. Raz, 29 – Pte. Lervily, 30 – St. Guenole,
31 – Trevignon, 32 – Pte. Pen Men, 33 – Port-Louis, 34 – Quiberon, 35 – Pte. Kerbihan, 36 – Pte. Croisie, 37 – St. Michel Chef Chef, 38 – Pte.
St. Gildas, 39 – Yeu, Pte. But, 40 – Yeu, Pte. Tranche, 41 – Croix de Vie, 42 – Les Sables d’Olone, 43 – Phare Balenes, 44 – Phare Chassiron,
45 – Royan, 46 – Courdouan, 47 – L’Amelie, 48 – Montalivet, 49 – Lancanau, 50 – Arcachon, 51 – Mimizan, 52 – Contis, 53 – Vieux-Boucau,
54 – Capbreton, 55 – Boucau, 56 – Biarritz, 57 – Cabo Higuer, 58 – San Sebastian, 59 – Zarauz, 60 – Zumaya, 61 – Deba, 62 – Bermeo, 63 –
Barrica, 64 – Urdiales, 65 – Santona, 66 – Noja, 67 – Santander, 68 – Cabo Menor, 69 – Ubiarco, 70 – San Vicente de la Barquera, 71 – Llanes,
72 – Ribadesella, 73 – Luces, 74 – Perlora, 75 – Candas, 76 – Salinas, 77 – San Juan, 78 – Luarca, 79 – Navia, 80 – Cangas de Foz, 81 –
Ribadeo, 82 – San Ciprian, 83 – Vivero, 84 – Espasante, 85 – Cobas, 86 – Carnoedo, 87 – La Coruna, 88 – Sta. Cristina, 89 – Arteijo, 90 –
Malpica, 91 – Lage, 92 – Mugia, 93 – Finisterre, 94 – Muro, 95 – Corrubedo, 96 – Grove, 97 – Punta Corbeiro dos Castros, 98 – San Miguel
de Oia, 99 – Bayona, 100 – Cabo Sillero, 101 – La Guardia, 102 – VP Ancora, 103 – Montedor, 104 – Viana Castelo, 105 – Vila do Conde, 106
– Leixoes, 107 – Aguda, 108 – Espinho, 109 – Aveiro, 110 – Cabo Mondego, 111 – Buarcos, 112 – Leirosa, 113 – Nazare, 114 – S. Martinho
Porto, 115 – Cabo Carvoeiro, 116 – Peniche, 117 – Azenhas do Mar, 118 – Cascais, 119 – Cabo Espichel, 120 – Sesimbra, 121 – Sines, 122 –
VN Milfontes, 123 – Odeceixe, 124 – Sagres, 125 – Lagos, 126 – Armacao de Pera, 127 – Rota, 128 – Trafalgar, 129 – Punta Paloma, 130 –
Punta Malabata, 131 – Tanger, 132 – Cap Spartel, 133 – Arcila.
2068 F. P. L I M A et al.
r 2007 The AuthorsJournal compilation r 2007 Blackwell Publishing Ltd, Global Change Biology, 13, 2065–2077

by a group of lines radiating from each coastal point
with a 7.51 bearing step between them. Lines were
trimmed when reaching the coastline. For each one of
the remaining lines, wave parameters from the corre-
sponding directional sector were selected and used
to estimate the wave power observed in coastal
location over that specific direction. Wave power (P)
in kW was defined as P 5 nE1.56T where n 5 0.5,
T 5 mean significant wave period (in seconds) and
E (energy in Joules) 5 1/16 r g H where r5 seawater
density (1020 kg m�3) g 5 acceleration due to gravity
(9.8 m s�1) and H 5 mean significant wave height in
metres. For each coastal location, total wave power
was computed as the sum of all converging partial
estimates from the different directions, weighted by
the percentage of time waves were observed in each
direction. The online wave data were only available for
the period between 1985 and 2001 and records were
summarized in statistics relative to that 16-year period
without the possibility to extract specific years or
months, which forced the use of the whole data set.
As a consequence, the parameter WA was considered
static (i.e. not varying from the 1950s to 1990s), which
may not be entirely true (see Davies & Johnson, 2006).
Modelling approach
Classification and Regression Trees (CART) (Breiman
et al., 1984) are one of the currently available climate
envelope approaches. Traditionally applied to fields
such as medical diagnosis, meteorology, plant physiol-
ogy, soil sciences and wildlife management, they have
recently been used to successfully model terrestrial (e.g.
Vayssieres et al., 2000; Edwards et al., 2006; Fronzek
et al., 2006) and marine species distributions (De’ath &
Fabricius, 2000; DeVantier et al., 2006; Friedlaender et al.,
2006).
For the purposes of the current study CART models
were selected primarily because they are relatively
immune to multicollinearity (Breiman et al., 1984;
Jackson & Bartolome, 2002; Karels et al., 2004), and the
data set incorporated 20 potentially correlated predictor
variables. Other advantages included the possibility of
output response variables with more than two levels,
the robustness regarding possible outliers and nonnor-
mal distributions of variables (Breiman et al., 1984) and
the capacity to determine complex interactions among
explanatory variables without the need to specify them
a priori (Vayssieres et al., 2000; Rouget et al., 2001).
Additionally, these analyses are easy to interpret
(De’ath & Fabricius, 2000) because they provide a
hierarchical view of the relationships between species
and environmental variables, allowing the identifica-
tion of those which are the most correlated with the
presence of species (Vayssieres et al., 2000).
Homogeneity of groups was assessed by the Gini
purity index (Breiman et al., 1984). Because the maximal
tree is usually overfitted to training data, a computa-
tional step to constrain the tree to its best size
is required to avoid the problem of overfitting (Araujo
& Guisan, 2006). Overfitted models tend to perform
exceptionally well on the training data because they fit
Table 1 Summary of the independent variables used in the CART modelling of Patella rustica distribution
Environmental variables Acronym
Unit
of
measurement
Considered
periods Statistics
Temporal
resolution
Spatial
resolution
(raw data)
Sea surface
temperature
SST 1C 1950–1959
1991–2000
Mean, minimum and
maximum during
winter, summer, and
reproduction
Monthly 4 km
Near surface
air temperature
NSAT 1C 1950–1959
1991–2000
Mean, minimum and
maximum during
winter, summer, and
reproduction
Monthly 10 min
Cloud cover CC % 1950–1959
1991–2000
Percentile 25, 50, 75 Monthly 10 min
Precipitation PP % 1950–1959
1991–2000
Percentile 25, 50, 75 Monthly 10 min
Sea surface
salinity
SSS % 1958–1959
1991–2000
Percentile 25, 50, 75 Monthly 10 min
Wave power WP kW 1985–2001 Mean – Approximately
100 km
M O D E L L I N G C H A N G E S I N P. R U S T I C A D I S T R I B U T I O N 2069
r 2007 The AuthorsJournal compilation r 2007 Blackwell Publishing Ltd, Global Change Biology, 13, 2065–2077

the idiosyncrasies and noise in the data set used to build
the model, in addition to the generic relationships
between independent and response variables. Thus, a
balanced model including sufficient complexity to un-
cover subtle effects and interactions but not compro-
mising predictive power should be chosen. A common
approach in tree-based techniques is to freely allow the
maximum growing process and then prune the over-
branched tips of the tree (Breiman et al., 1984; De’ath &
Fabricius, 2000; Questier et al., 2005). The initial tree was
allowed to attain the maximum size and then pruned
using the mode of 50 repeated 10-fold cross-validations
(see Breiman et al., 1984; De’ath & Fabricius, 2000 for
details). For the cross-validation, the data set was
divided in 10 parts and each subset was removed in
turn, being used as a test sample against predictions
based on the remaining 90% of data. This technique is
similar but more robust than jack-knifing, as it gives a
better reflection of its performance on new data (Field-
ing & Bell, 1997). The average error rate was plotted in
relation to the tree size and the best size for the tree was
chosen as the smallest having an error rate within one
SE of the minimum (De’ath & Fabricius, 2000).
The predictive power of the model was evaluated
using the area under curve (AUC) obtained from the
receiver operator characteristic (ROC) plot. AUC is
a reliable measure of model performance because it
is largely unaffected by the data prevalence, (i.e. the
proportion of study sites naturally occupied by the
species (Manel et al., 2001; McPherson et al., 2004;
Vaughan & Ormerod, 2005). Because the output of
CART is categorical, ROC curves were derived by
recursive partitioning (Cook & Goldman, 1984; Rauber-
tas et al., 1994). Even though it has been traditionally
used to measure the degree to which a classifier can
discriminate between two classes, its extension to
a multiclass classification may be done by computing
a series of binary AUCs for each class vs. all the others
(called one- vs. -all approach or OVA). Thus, each one of
these binary comparisons has its own AUC, measuring
how well each class is identified by the model (Patel &
Markey, 2005).
The model was evaluated by feeding it with climatic
and oceanographic data from the 1990s, when the
distributional gap was bridged, to hindcast the contem-
porary distribution of P. rustica along the NE Atlantic
coast. The output was subsequently compared with the
real distribution and abundance of P. rustica assessed in
the 2002–2003 and 2006 surveys.
Results
A total of 122 locations for which data were available
from the 1950s were revisited during the 2002–2003
survey, enabling abundance and distribution to be
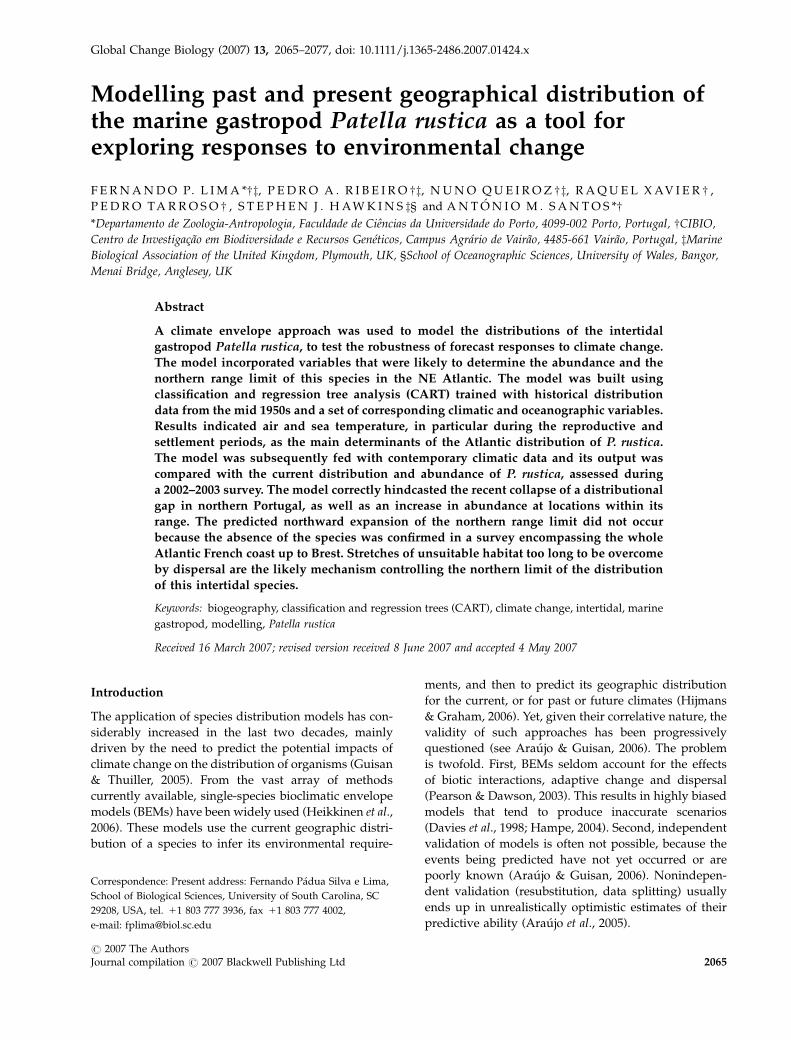
mapped (Fig. 2a and c). In the 40-year period between
the two surveys, the most remarkable changes were: (i)
the bridging of the distributional gap in northern Por-
tugal (Lima et al., 2006); (ii) a global increase in abun-
dance in NW Iberia (Galicia) and on some southern
Portuguese shores; and (iii) no extension of the northern
boundary of the range at Capbreton, although an in-
crease in abundance was also observed in this region.
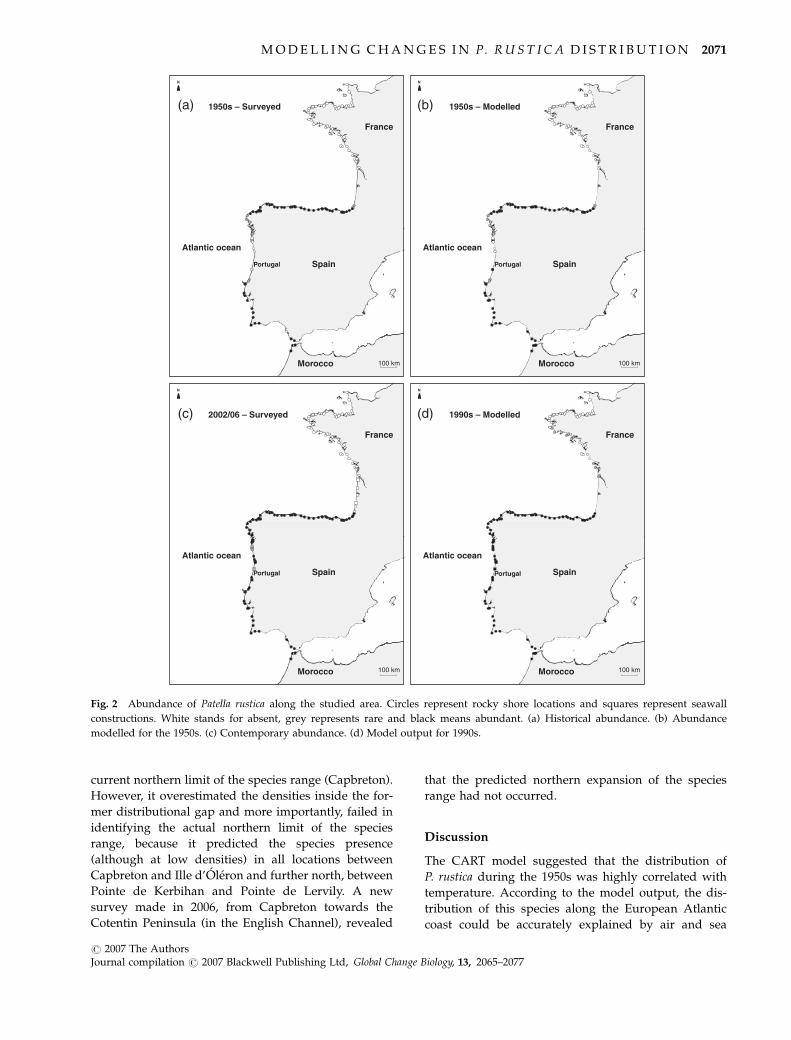
The final model, selected and pruned after cross-
validation, could be represented as a five leaf tree
explaining 94% of data variance for the distribution
during the 1950s (Fig. 3). Scores of the AUC obtained
from ROC plots for test data were 0.93 for category class
0 (absent), 0.99 for category 1 (rare) and 0.92 for cate-
gory 2 (abundant), which according to Swets (1988) and
Zweig & Campbell (1993) indicates excellent classifica-
tion accuracy. From the variety of climate data fed into
the model, SST and NSAT were selected as determinant
factors of the distribution of P. rustica. The first data
partition, based solely in the observed value of the
average NSAT of the coldest month during the repro-
ductive period, explained nearly 38% of data variation
and was responsible for identifying the break, which
corresponds to the northern boundary of the distribu-
tion. The remaining cases were generally explained by
the average SST of the coldest winter month, average
NSAT and average SST. Nearly half of misclassifications
occurred within the distributional gap in Northern
Portugal. In this area, the model erroneously predicted
the presence of P. rustica at two locations where the
species had not been observed (Cabo Mondego and
Buarcos). It also predicted the existence of limpets at
high densities at Vila do Conde, a location where
Fischer-Piette & Gaillard (1959) reported only a single
individual during their 1950s survey. In addition, the
model overestimated the abundance in three locations
in the southern part of the studied distribution (Sesim-
bra, Rota and Tangier). In one locality in northern Spain
(Santander) the predicted abundance was misclassified
as rare, while in reality it was abundant (Fischer-Piette
& Gaillard, 1959). Nevertheless, globally the model
performed quite well, because the main distributional
features such as the northern range limit, the existence
of a distributional gap in northern Portugal and the
region of low abundance in north-western Iberia were
correctly modelled (Fig. 2b).
When the model was fed with environmental data
from the 1991–2000 period, scores of the AUC were 0.78
for category class 0 (absent), 0.45 for category 1 (rare)
and 0.95 for category 2 (abundant). In particular, the
model correctly hindcasted the bridging of the historical
gap in Northern Portugal and also the observed in-
crease in densities at Galicia (NW Iberia) and at the
2070 F. P. L I M A et al.
r 2007 The AuthorsJournal compilation r 2007 Blackwell Publishing Ltd, Global Change Biology, 13, 2065–2077
current northern limit of the species range (Capbreton).
However, it overestimated the densities inside the for-
mer distributional gap and more importantly, failed in
identifying the actual northern limit of the species
range, because it predicted the species presence
(although at low densities) in all locations between
Capbreton and Ille d’Oleron and further north, between
Pointe de Kerbihan and Pointe de Lervily. A new
survey made in 2006, from Capbreton towards the
Cotentin Peninsula (in the English Channel), revealed
that the predicted northern expansion of the species
range had not occurred.
Discussion
The CART model suggested that the distribution of
P. rustica during the 1950s was highly correlated with
temperature. According to the model output, the dis-
tribution of this species along the European Atlantic
coast could be accurately explained by air and sea
Spain
France
Morocco
(a) (b)
(c) (d)
Atlantic ocean
1950s – Surveyed
Spain
France
Morocco
Atlantic ocean
1950s – Modelled
Spain
France
Morocco
Atlantic ocean
2002/06 – Surveyed
Spain
France
Morocco
Atlantic ocean
1990s – Modelled
Fig. 2 Abundance of Patella rustica along the studied area. Circles represent rocky shore locations and squares represent seawall
constructions. White stands for absent, grey represents rare and black means abundant. (a) Historical abundance. (b) Abundance
modelled for the 1950s. (c) Contemporary abundance. (d) Model output for 1990s.
M O D E L L I N G C H A N G E S I N P. R U S T I C A D I S T R I B U T I O N 2071
r 2007 The AuthorsJournal compilation r 2007 Blackwell Publishing Ltd, Global Change Biology, 13, 2065–2077
temperature patterns, especially during the reproduc-
tive (autumn) and initial growth (winter) periods. The
model correctly excluded P. rustica from locations where
temperature was too low, such as most of the French
Atlantic coast and in the historical distributional gap in
Northern Portugal, where upwelling has a dominant
cooling effect on the sea temperature, at least during
some periods of the year (Peliz et al., 2002, 2005). On the
other hand, regions characterized by a warmer climate
such as the Southern Portuguese coast and the Bay of
Biscay were correctly modelled as having high densities
of P. rustica.
The use of the climate envelope with contemporary
environmental conditions correctly predicted the brid-
ging of the gap and the increase in densities in Northern
Spain. This suggests that some of the factors used in the
model do determine, to some extent, the distribution of
P. rustica, at least in this section of the range. Both events
are probably connected, constituting an ongoing expan-
sionary episode whose onset was already noticed by
Fischer-Piette & Gaillard (1959). Yearly abundance re-
assessments made from 2003 to 2006 clearly showed
that the number of individuals from the new popula-
tions in this area is still increasing (F. P. Lima, unpub-
lished data). The recent expansion of P. rustica observed
in Northern Portugal, which led to the collapse of
a long-term distributional gap in the late 1990s, was
coincident with sea surface anomalies recorded over the
last decade off the Portuguese coast (Lima et al., 2006).
The current patterns observed off the Portuguese coast
Terminal node 1Class = 0Min rep NSAT ≤ 9.49Class n %0 46 100.01 0 0.02 0 0.0
Node 2
Min rep NSAT > 9.49Class n %0 10 13.21 13 17.12 53 69.7
Terminal node 5Class = 2Min wint SST > 12.66Class n %0 3 6.51 0 0.02 43 93.5
Node 3
Min wint SST ≤ 12.66Class n %0 7 23.31 13 43.32 10 33.3
Terminal node 4Class = 2Avg NSAT > 16.54Class n %0 3 25.01 0 0.02 9 75.0
Node 4
Avg NSAT ≤ 16.54Class n %0 4 22.21 13 72.22 1 5.6
Terminal node 3Class = 1Avg SST > 13.45Class n %0 0 0.01 13 92.82 1 7.2
Termonal node 2Class = 0 Avg SST ≤ 13.45Class n %0 4 100.01 0 0.02 0 0.0
Node 1
Class n %0 56 45.91 13 10.72 53 43.4
Fig. 3 Decision tree of the CART model built using historical (1950s) survey data. At each partition, the value of the splitting variable is
shown. Information featured in the nodes includes the node identification, the level of the predicted response and the value of the split
variable associated with that node. Finally, the number and percentage of cases for each level of the predicted response is also displayed.
0 stands for absent, 1 for rare and 2 for abundant. Climatic variables refer to the period of 1950–1959. Min rep NSAT, mean NSAT value of
the coldest month during reproductive season; min wint SST – mean SST value of the coldest month during winter; avg NSAT – mean
NSAT value during the 10-year period; avg SST – mean SST value during the 10-year period.
2072 F. P. L I M A et al.
r 2007 The AuthorsJournal compilation r 2007 Blackwell Publishing Ltd, Global Change Biology, 13, 2065–2077

in the autumn/winter are part of a wider and well-
known system called ‘Navidad’ which affects the Atlan-
tic European continental slope (Pingree & Le Cann,
1992). During winter, a warm water stream flows north-
ward along the east coast of Portugal and Spain. It then
splits into two streams, one flowing directly to northern
France and the British Isles, and the other moving
eastward, following the Spanish coastline, and turning
north along the French coast. This stream is tightly
correlated with the North Atlantic Oscillation Index
(NAO). An extremely negative winter NAO Index
was observed during 1996 and 1998, enhancing pole-
ward flow and an anomalous winter warming along the
coast of the Bay of Biscay (Pingree & Le Cann, 1992;
Garcia-Soto, 2004). Therefore, because the observed
changes in the distribution of P. rustica are likely to be
related with increases in temperature (either from air or
sea), a similar expansion was anticipated in Southern
France, where an analogous warming trend was ob-
served (Koutsikopoulos et al., 1998). Hence, it was
interesting to notice the absence of such a phenomenon.
The only evidence of a tendency for expansion in the
northern portion of the range was the huge increase in
densities observed in the two northernmost locations
(Boucau and Capbreton) when compared with the data
from Fischer-Piette & Gaillard (1959). However, this
evidence is fairly weak, because in these locations the
building of coastal defences largely expanded the area
of suitable habitat, thus confounding the effect of any
other factor, such as environmental changes due to sea
or air temperature increase.
The model failed to predict the correct northern range
boundary on the Western French coast (Capbreton),
extending the ‘suitable habitat’ for P. rustica as far north
as Pointe de Lervily. This probably indicates that
although both air and sea temperatures could be nowa-
days favourable to the presence of the species, some
other factor, or even a combination of factors are ham-
pering the expansion. It is possible that P. rustica is
already present in locations north of Capbreton, but at
densities which hindered its detection even by experi-
enced observers. This is very unlikely considering the
effort of the fieldwork, with more than 50 locations
visited between Capbreton and Royan. In addition to
the few rocky shores, all artificial coastal defences were
also surveyed. It is also possible that certain variables
not accounted in the model have a strong limiting
influence on survival and/or expansion of this species.
For example, recent work suggests that marine popu-
lations may be less open than originally thought
(Bohonak, 1999; Cowen et al., 2000; Levin, 2006) and
that sea currents can potentially constitute insurmoun-
table barriers to species with a dispersive larval stage,
constraining their ranges even when there is suitable
habitat beyond those barriers (Gaylord & Gaines, 2000).
The situation becomes even more complicated when
effects of dispersal barriers are confounded with effects
of physiological limitations imposed by steep clines in
climatic factors such as sea temperature, because they
usually co-occur in space (Zacherl et al., 2003). The
ocean circulation in the Bay of Biscay has been studied
by numerous authors (Koutsikopoulos et al., 1998;
Bardey et al., 1999; Puillat et al., 2004; Planque et al.,
2006), who pointed out several hydrographical fronts,
upwellings, eddies and low salinity plumes from the
rivers Loire and Gironde as being responsible for strong
discontinuities in oceanic and coastal waters. Thus,
these factors may represent considerable dispersal
barriers for P. rustica.
Another hypothesis could be related with the limited
larval dispersal potential of P. rustica. Even assuming
that oceanographic barriers are not obstructing larval
transport, a limited dispersal ability coupled with the
lack of suitable habitat may pose a serious problem to
expansion, as reported previously by Crisp (1958) for
the barnacle Elminius modestus. The 200 km of coastline
between Capbreton and Royan are mainly sandy and,
therefore, do not allow larval settlement. The ability to
traverse such a gap depends on the existence of a
sufficiently long larval stage, able to survive during
the transport towards the north, and even so, favour-
able currents must exist during larval drift. In the Bay of
Biscay, the current flow over the continental slope was
determined as having a characteristic northward velo-
city of 5 cm s�1 during the winter, and probably rever-
sing during the summer (Aken, 2002). Spawning is
thought to happen during the autumn (Ibanez et al.,
1986) but unfortunately very little is known regarding
ocean circulation in this region during that season.
However, and considering an average travelling speed
of 5 cm s�1, larvae would need more that 45 days
to traverse the sandy coastline, a prohibitive period
for a species whose planktonic stage lasts approxi-
mately 6 days (P. A. Ribeiro, unpublished data). If this
is the main factor limiting the species expansion, why
has it not prevented the recent colonisation of several
locations in Northern Portugal, leading to the collapse
of the historical 280 km gap? Coastal currents off the
Portuguese coast display a stronger northward compo-
nent during the reproductive period of P. rustica, with
mean velocities of 15.1 � 4.4 cm s�1 (Martins et al.,
2002). In 6 days, this current may transport larvae for
distances of up to 100 km, which is enough to cover the
largest sandy stretch of coastline.
Additionally, the construction of a high number of
artificial sea defences to protect both the sandy shores
and the main city harbours from wave action has most
likely increased population connectivity of rocky shore
M O D E L L I N G C H A N G E S I N P. R U S T I C A D I S T R I B U T I O N 2073
r 2007 The AuthorsJournal compilation r 2007 Blackwell Publishing Ltd, Global Change Biology, 13, 2065–2077

species on the Portuguese coast. In fact, most sea
defences are massive structures hosting typical rocky
shore communities (F. P. Lima, unpublished data),
where for example it is possible to find intertidal algae
(Porphyra spp., Fucus spiralis), polychaetes (Sabellaria
alveolata) crustaceans (Pachygrapsus marmoratus, Polli-
cipes pollicipes, Chtamalus montagui and Chtamalus stella-
tus) and molluscs (Mytilus galloprovincialis, Littorina
neritoides, Littorina saxatilis, Patella depressa, Patella
vulgata and P. rustica). These artificial reefs have shor-
tened the largest sandy stretches to approximately
50 km, allowing a much easier expansion. On the con-
trary, along the 200 km rocky hiatus of the French coast,
the construction of sea defences was done in a much
more subtle way. With the exception of the two seawalls
at Boucau and Capbreton, all constructions are small in
height and length, unable to accommodate more than a
few ephemeral green algae (genus Ulva and Enteromorpha),
a few mussels (Mytilus sp.), oysters, and in some rare
occasions, a handful of P. depressa. These structures clearly
lack the typical habitat of exposed vertical walls required
by P. rustica. Similarly, Gilman (2006) found that the most
likely explanation for the determination of the northern
range limit of the intertidal limpet Collisella scabra in
California was an increase in the distance between popu-
lations at the range margin, reducing the chances of
dispersing larvae to find suitable habitat for settlement,
rather than any climatic constraint. Thus, it is possible that
the limits of many marine species can remain unchanged
even when peripheral habitat conditions become favour-
able (Crisp & Southward, 1958; Fields et al., 1993).
It has been noted that range expansions, even from
those species which eventually become successfully
established, are frequently preceded by several failures
(Sax & Brown, 2000). In addition, it was shown that
species with a similar larval duration to P. rustica may
take several years to become completely established
over an area similar to the one for which the present
expansion was anticipated (see Shanks et al., 2003;
Siegel et al., 2003, for a review). Therefore, even with
present favourable climatic conditions and assuming
that some extraordinary events such as storm-strength-
ened anomalous currents allowed the species to over-
pass the sandy barrier, the elapsed time for such a large
expansion to occur may still be insufficient. In this
perspective, the hindcasted northern range expansion
is not completely wrong (see Araujo et al., 2005), and
might become visible in future years, as long as the sea
and air warming phase of the last decades is main-
tained.
In the light of current results, the hypothesis pro-
posed by Lima et al. (2006) that the changes in the
geographical distribution of P. rustica observed in NW
Iberia were largely related to a joint effect of increasing
temperature and alteration in oceanic circulation pat-
terns is reinforced. Therefore, the conceptual model
here proposed has the ability to simultaneously explain
several spatially independent phenomena, giving it
a higher degree of confidence. Nonetheless, because
other valid explanations could be advanced, future
investigations are still needed in this area. Several
recent studies indicate that some organisms have the
ability to adapt to different conditions at diverse parts
of their range (Sagarin et al., 2006), and also that
environmental variables might not be physiologically
limiting at all range edges (Helmuth et al., 2006b).
Hence, it is even possible that the factors which were
until recently limiting the expansion in northern Portu-
gal could be distinct from those currently governing the
northern boundary. Nonetheless, the existence of bar-
riers to dispersal, resulting in limited or no connectivity
remains the most parsimonious and, thus the most
probable scenario. This hypothesis can be tested using
a bioclimatic approach coupled with a dispersal simu-
lation model, encompassing information about oceanic
currents and habitat availability. This approach would
help to definitely solve the question of the relative
importance of temperature or transport in establishing
limits in the distribution of P. rustica. The use of auto-
correlation and/or contagion indexes could also be a
way to gain some insights on the strength and extension
of larval dispersal.
This study also reinforces the idea that intertidal
organisms are clearly influenced by both air and water
temperature. Although it has already been shown that
various aspects of both terrestrial and aquatic climate
drive the physiological performance of these species
(Helmuth et al., 2006a), the use of a nonlinear modelling
technique showed that these factors frequently alternate
with one another and with nonclimate-related factors, in
determining distributional limits (Helmuth et al., 2006b).
Although the present results partially support previous
suggestions that BEMs may be inadequate for making
projections of future events, they also suggest that this
approach can be of great utility in gaining further insights
into the nature of the relationship between the distribu-
tion of the species and the environment (Araujo et al.,
2005). Therefore, although sometimes bioclimatic envel-
opes may appear too limited or deterministic, they cer-
tainly still have an important role in ecology by helping to
effectively work on some explanatory hypothesis, which
can subsequently be tested.
Acknowledgements
Authors are grateful to Dr T. D. Mitchell from the Tyndall Centreof Climate Research for the climatic data provided. The ICOADSdata were provided by the Data Support Section of the Scientific
2074 F. P. L I M A et al.
r 2007 The AuthorsJournal compilation r 2007 Blackwell Publishing Ltd, Global Change Biology, 13, 2065–2077

Computing Division at the National Center for Atmospheric Re-search (NCAR). NCAR is supported by grants from the NationalScience Foundation. F. P. Lima and P. A. Ribeiro were funded byFCT grants refs. SFRH/BD/8730/2002 and SFRH/BD/8232/2002,respectively. S. J. Hawkins was funded by NERC grant in aid to theMBA and the Marclim funding consortium (English Nature, Scot-tish Natural Heritage, Countryside Council for Wales, EnvironmentAgency, Scottish Executive, Defra, WWF, Crown Estate). We alsothank the suggestions of two anonymous referees which contrib-uted to the improvement of the manuscript.
References
Aken HMv (2002) Surface currents in the Bay of Biscay as
observed with drifters between 1995 and 1999. Deep Sea
Research Part I. Oceanographic Research Papers, 49, 1071–1086.
Araujo MB, Guisan A (2006) Five (or so) challenges for species
distribution modelling. Journal of Biogeography, 33, 1677–1688.
Araujo MB, Pearson RG, Thuiller W, Erhard M (2005) Validation
of species-climate impact models under climate change. Global
Change Biology, 11, 1504–1513.
Bardey P, Garnesson P, Moussu G, Wald L (1999) Joint analysis of
temperature and ocean colour satellite images for mesoscale
activities in the Gulf of Biscay. International Journal of Remote
Sensing, 20, 1329–1341.
Bertness MD, Gaines SD, Hay M (eds) (2001) Marine Community
Ecology. Sinauer Associates, Sunderland, MA.
Bohonak AJ (1999) Dispersal, gene flow, and population struc-
ture. The Quarterly Review of Biology, 74, 21–25.
Breiman L, Friedman JH, Olshen RA, Stone CJ (1984) Classifica-
tion and Regression Trees. Wadsworth, Belmont.
Christiaens J (1973) Revision du genre Patella (Mollusca, Gastro-
poda). Bulletin du Museum National d’Histoire Naturelle, Paris,
182, 1305–1392.
Clark RA, Fox CJ, Viner D, Livermore M (2003) North Sea cod
and climate change – modelling the effects of temperature on
population dynamics. Global Change Biology, 9, 1669–1680.
Cook EF, Goldman L (1984) Empiric comparison of multivariate
analytic techniques: advantages and disadvantages of recur-
sive partitioning analysis. Journal of Chronic Diseases, 37, 721–
731.
Cowen RK, Lwiza KMM, Sponaugle S, Paris CB, Olson DB (2000)
Connectivity of marine population: open or closed? Science,
287, 857–859.
Crisp DJ (1958) The spread of Elminius modestus Darwin in North
West Europe. Journal of the Marine Biological Association of the
UK, 37, 483–520.
Crisp DJ, Fischer-Piette E (1959) Repartition des principales
especes intercotidales de la cote atlantique Francaise en
1954–1955. Annales de l’ Institut Oceanographique, Paris, 36,
275–388.
Crisp DJ, Southward AJ (1958) The distribution of intertidal
organisms along the coasts of the English Channel. Journal of
the Marine Biological Association of the UK, 37, 157–208.
Crumpacker DW, Box EO, Hardin ED (2001) Implications of
climatic warming for conservation of native trees and shrubs
in Florida. Conservation Biology, 15, 1008–1020.
Davies AJ, Jenkinson LS, Lawton JH, Shorrocks B, Wood S (1998)
Making mistakes when predicting shifts in species range in
response to global warming. Nature, 391, 783–786.
Davies AJ, Johnson MP (2006) Coastline configuration disrupts
the effects of large-scale climatic forcing, leading to divergent
temporal trends in wave exposure. Estuarine, Coastal and Shelf
Science, 69, 643–648.
De’ath G, Fabricius KE (2000) Classification and regression trees:
a powerful yet simple technique for ecological data analysis.
Ecology, 81, 3178–3192.
Denny MW, Harley CDG (2006) Hot limpets: predicting body
temperature in a conductance-mediated thermal system. The
Journal of Experimental Biology, 209, 2409–2419.
DeVantier LM, De’ath G, Turak E, Done TJ, Fabricius KE (2006)
Species richness and community structure of reef-building corals
on the nearshore Great Barrier Reef. Coral Reefs, 25, 329–340.
Dong BW, Sutton RT, Jewson SP, O’Neill A, Slingo JM (2000)
Predictable winter climate in the North Atlantic Sector during
1997–1999 ENSO cycle. Geophysical Research Letters, 27, 985–988.
Edwards JTC, Cutler DR, Zimmermann NE, Geiser L, Moisen
GG (2006) Effects of sample survey design on the accuracy of
classification tree models in species distribution models. Eco-
logical Modelling, 199, 132–141.
Ekebom J, Laihonen P, Suominen T (2003) A GIS-based step-wise
procedure for assessing physical exposure in fragmented
archipelagos. Estuarine, Coastal and Shelf Science, 57, 887–898.
Fielding AH, Bell JF (1997) A review of methods for the assess-
ment of prediction errors in conservation presence/absence
models. Environmental Conservation, 24, 38–49.
Fields PA, Graham JN, Rosenblatt RH, Somero GN (1993) Effects
of expected global climate change on marine faunas. Trends in
Ecology and Evolution, 8, 361–367.
Fischer-Piette E (1948) Sur les elements de prosperite des Patelles
et sur leur specificite. Journal de Conchyliologie, 88, 45–96.
Fischer-Piette E (1953) Repartition de quelques mollusques inter-
cotidaux communs le long des cotes septentrionales de
l’Espagne. Journal of Conchology, 93, 39–73.
Fischer-Piette E (1955) Repartition le long des cotes septentrio-
nales de l’Espagne, des principales especes peuplant les
rochers intercotidaux. Annales de l’Institut Oceanographique
Paris, 31, 37–124.
Fischer-Piette E (1958) Sur l’ecologie intercotidal Ouest – iber-
ique. Comptes Rendus de l’Academie des Sciences (Paris), 246,
1301–1303.
Fischer-Piette E (1963) La distribution des principaux organisms
nord – iberiques en 1954–55. Annales de l’Institut Oceanographi-
que Paris, 40, 165–311.
Fischer-Piette E, Gaillard J-M (1959) Les patelles au long des
cotes atlantiques Iberiques et Nord – Marocaines. Journal of
Conchology, 99, 135–200.
Friedlaender AS, Halpin PN, Qian SS, Lawson GL, Wiebe PH,
Thiele D, Read AJ (2006) Whale distribution in relation to prey
abundance and oceanographic processes in shelf waters of the
Western Antarctic Peninsula. Marine Ecology-Progress Series,
317, 297–310.
Fronzek S, Luoto M, Carter TR (2006) Potential effect of climate
change on the distribution of palsa mires in subarctic Fennos-
candia. Climate Research, 32, 1–12.
M O D E L L I N G C H A N G E S I N P. R U S T I C A D I S T R I B U T I O N 2075
r 2007 The AuthorsJournal compilation r 2007 Blackwell Publishing Ltd, Global Change Biology, 13, 2065–2077

Garcia-Soto C (2004) Prestige oil spill and Navidad flow. Journal
of the Marine Biological Association of the UK, 84, 297–300.
Gaylord B, Gaines SD (2000) Temperature or transport? Range
limits in marine species mediated solely by flow. The American
Naturalist, 155, 769–789.
Gilman SE (2006) The northern geographic range limit of the
intertidal limpet Collisella scabra: a test of performance, recruit-
ment, and temperature hypotheses. Ecography, 29, 709–720.
Grass Development Team (2006) Geographic Resources Analysis
Support System (GRASS) Software. ITC-irst, Trento, Italy.
http://grass.itc.it
Guisan A, Thuiller W (2005) Predicting species distribution: offering
more than simple habitat models. Ecology Letters, 8, 993–1009.
Guisan A, Zimmermann NE (2000) Predictive habitat distribu-
tion models in ecology. Ecological Modelling, 135, 147–186.
Hampe A (2004) Bioclimate models: what they detect and what
they hide. Global Ecology and Biogeography, 13, 469–476.
Heikkinen RK, Luoto M, Araujo MB, Virkkala R, Thuiller W,
Sykes MT (2006) Methods and uncertainties in bioclimatic
envelope modelling under climate change. Progress in Physical
Geography, 30, 751–777.
Helmuth B, Broitman BR, Blanchette CA et al. (2006a) Mosaic
patterns of thermal stress in the rocky intertidal zone: implica-
tions for climate change. Ecological Monographs, 76, 461–479.
Helmuth B, Mieszkowska N, Moore P, Hawkins SJ (2006b) Living
on the Edge of Two Changing Worlds: forecasting the responses
of rocky intertidal ecosystems to climate change. Annual Re-
view of Ecology, Evolution, and Systematics, 37, 373–404.
Herbert RJH, Hawkins SJ, Sheader M, Southward AJ (2003)
Range extension and reproduction of the barnacle Balanus
perforatus in the eastern English Channel. Journal of the Marine
Biological Association of the UK, 83, 73–82.
Hijmans RJ, Graham CH (2006) The ability of climate envelope
models to predict the effect of climate change on species
distributions. Global Change Biology, 12, 1–10.
Hodkinson ID (1999) Species response to global environmental
change or why ecophysiological models are important: a reply
to Davis et al. Journal of Animal Ecology, 68, 1259–1262.
Huntley B, Green RE, Collingham YC et al. (2004) The performance
of models relating species geographical distributions to climate
is independent of trophic level. Ecology Letters, 7, 417–426.
Ibanez M, Pena J, Feliu J (1986) Reproduction of Patella spp. on
the Basque coast of Spain. Hydrobiologia, 142, 327.
Jackson RD, Bartolome JW (2002) A state-transition approach to
understanding nonequilibrium plant community dynamics in
Californian grasslands. Plant Ecology, 162, 49–65.
Jarvis CH, Stuart N (2001) A Comparison among Strategies for
Interpolating Maximum and Minimum Daily Air Tempera-
tures. Part II: the interaction between number of guiding
variables and the type of interpolation method. Journal of
Applied Meteorology, 40, 1075–1082.
Karels TJ, Bryant AA, Hik DS (2004) Comparison of discriminant
function and classification tree analyses for age classification
of marmots. Oikos, 105, 575–587.
Kaschner K, Watson R, Trites AW, Pauly D (2006) Mapping
world-wide distributions of marine mammal species using a
relative environmental suitability (RES) model. Marine Ecology
Progress Series, 316, 285–310.
Koutsikopoulos C, Beillois P, Leroy C, Taillefer F (1998) Temporal
trends and spatial structures of the sea surface temperature in
the Bay of Biscay. Oceanologica acta, 21, 335–344.
Lemos RT, Pires HO (2004) The upwelling regime off the west
portuguese coast, 1941–2000. International Journal of Climatol-
ogy, 24, 511–524.
Lemos RT, Sanso B (2006) Spatio-temporal variability of ocean
temperature in the Portugal Current System. Journal of Geophy-
sical Research, 111, C04010, doi: 04010.01029/02005JC003051.
Levin LA (2006) Recent progress in understanding larval dis-
persal: new directions and digressions. Integrative and Com-
parative Biology, 46, 282–297.
Levitus S, Antonov JI, Boyer TP, Stephens C (2000) Warming of
the World Ocean. Science, 287, 2225–2229.
Lima FP, Queiroz N, Ribeiro PA, Hawkins SJ, Santos AM (2006)
Recent changes in the distribution of a marine gastropod,
Patella rustica Linnaeus, 1758, and their relationship to unusual
climatic events. Journal of Biogeography, 33, 812–822.
Manel S, Williams HC, Ormerod SJ (2001) Evaluating presence –
absence models in ecology: the need to account for prevalence.
Journal of Applied Ecology, 38, 921–931.
Martins CS, Hamann M, Fiuza AFG (2002) Surface circulation in
the eastern North Atlantic, from drifters and altimetry. Journal
of Geophysical Research, 107, 3217.
McPherson JM, Jetz W, Rogers DJ (2004) The effects of species’
range sizes on the accuracy of distribution model: ecological
phenomenon or statistical artefact? Journal of Applied Ecology,
41, 811–823.
Mitchell TD, Carter TR, Jones PD, Hulme M, New M (2004) A
comprehensive set of high-resolution grids of monthly climate
for Europe and the globe: the observed record (1901–2000) and
16 scenarios (2001–2100). Tyndall Working Paper, 55, 1–30.
Mitchell TD, Hulme M, New M (2002) Climate data for political
areas. Area, 34, 109–112.
Patel AC, Markey MK (2005) Comparison of three-class classification
performance metrics: a case study in breast cancer CAD. In:
Medical Imaging 2005: Image Perception, Observer Performance, and
Technology Assessment, Vol. 5749 (eds Eckstein MP, Jiang Y), pp.
581–589. SPIE, San Diego, CA.
Pearson RG, Dawson TP (2003) Predicting the impacts of climate
change on the distribution of species: are bioclimate envelope
models useful? Global Ecology and Biogeography, 12, 361–371.
Pearson RG, Dawson TP, Berry PM, Harrison PA (2002) SPECIES:
a spatial evaluation of climate impact on the envelope of
species. Ecological Modelling, 154, 289–300.
Peliz A, Dubert J, Santos AMP, Oliveira PB, Le Cann B (2005)
Winter upper ocean circulation in the Western Iberian Basin –
Fronts, Eddies and Poleward flows: an overview. Deep Sea
Research Part I. Oceanographic Research Papers, 52, 621–646.
Peliz A, Rosa TL, Santos AMP, Pissarra JL (2002) Fronts, jets, and
counter-flows in the Western Iberian upwelling system. Journal
of Marine Systems, 35, 61–77.
Pingree RD, Le Cann B (1992) Anticyclonic eddy X91 in the
southern bay of Biscay, May 1991 to February 1992. Journal of
Geophysical Research, 97, 14353–14367.
Planque B, Lazure P, Jegou A (2006) Typology of hydrological
structures modelled and observed over the Bay of Biscay shelf.
Scientia Marina, 70S1, 43–50.
2076 F. P. L I M A et al.
r 2007 The AuthorsJournal compilation r 2007 Blackwell Publishing Ltd, Global Change Biology, 13, 2065–2077

Puillat I, Lazure P, Jegou AM, Lampert L, Miller PI (2004)
Hydrographical variability on the French continental shelf in
the Bay of Biscay, during the 1990s. Continental Shelf Research,
24, 1143–1163.
Questier F, Put R, Coomans D, Walczak B, Heyden YV (2005) The
use of CART and multivariate regression trees for supervised
and unsupervised feature selection. Chemometrics and Intelli-
gent Laboratory Systems, 76, 45–54.
Raffaelli D, Hawkins SJ (1996) Intertidal Ecology. Chapman &
Hall, London.
Raubertas RF, Rodewald LE, Humiston SG, Szilagyi PG (1994)
ROC curves for classification trees. Medical Decision Making, 14,
169–174.
Ridgway SA, Reid DG, Taylor JD, Branch GM, Hodgson AN
(1998) A cladistic phylogeny of the family Patellidae (Mollus-
ca: Gastropoda). Philosophical Transactions of the Royal Society of
London B, 353, 1645–1671.
Rouget M, Richardson DM, Lavorel S, Vayreda J, Gracia C, Milton
SJ (2001) Determinants of distribution of six Pinus species in
Catalonia, Spain. Journal of Vegetation Science, 12, 491–502.
Sagarin RD, Gaines SD (2002) Geographical abundance distributions
of coastal invertebrates: using one-dimensional ranges to
test biogeographic hypotheses. Journal of Biogeography, 29,
985–997.
Sagarin RD, Gaines SD, Gaylord B (2006) Moving beyond as-
sumptions to understand abundance distributions across
the ranges of species. Trends in Ecology & Evolution, 21,
524–530.
Santos AMP, Peliz A, Dubert J, Oliveira PB, Angelico MM, Re P
(2004) Impact of a winter upwelling event on the distribution
and transport of sardine (Sardina pilchardus) eggs and larvae
off western Iberia: a retention mechanism. Continental Shelf
Research, 24, 149–165.
Sax DF, Brown JH (2000) The paradox of invasion. Global Ecology
& Biogeography, 9, 363–371.
Shanks AL, Grantham BA, Carr MH (2003) Propagule dispersal
distance and the size and spacing of marine reserves. Ecological
Applications, 13, S159–S169.
Siegel DA, Kinlan BP, Gaylord B, Gaines SD (2003) Lagrangian
descriptions of marine larval dispersion. Marine Ecology Pro-
gress Series, 260, 83–96.
Simkanin C, Power A, Myers A et al. (2005) Using historical data
to detect temporal changes in the abundances of intertidal
species on Irish shores. Journal of the Marine Biological Associa-
tion of the UK, 85, 1329–1340.
Southward AJ, Hawkins SJ, Burrows MT (1995) Seventy years’
observations of changes in distributions and abundance of
zooplankton and intertidal organisms in the Western English
Channel in relation to rising sea temperature. Journal of Ther-
mal Biology, 20, 127–155.
Swets JA (1988) Measuring the accuracy of diagnostic systems.
Science, 240, 1286–1293.
Tomanek L, Helmuth B (2002) Physiological ecology of rocky
intertidal organisms: a synergy of concepts. Integrative and
Comparative Biology, 42, 771–775.
Vaughan IP, Ormerod SJ (2005) The continuing challenges of
testing species distribution models. Journal of Applied Ecology,
42, 720–730.
Vayssieres MP, Plant RE, Allen-Diaz BH (2000) Classification
trees: an alternative non-parametric approach for predicting
species distributions. Journal of Vegetation Science, 11,
679–694.
Wolcott FG (1973) Physiological ecology and intertidal zonation
in limpets: a critical look at ‘limiting factors’. Biological Bulletin,
145, 389–422.
Woodruff SD, Diaz HF, Elms JD, Worley SJ (1988) COADS release
2 data and metadata enhancements for improvements of
marine surface flux fields. Physics and Chemistry of the Earth,
23, 517–526.
Zacherl D, Gaines SD, Lonhart SI (2003) The limits to biogeo-
graphical distributions: insights from the northward range
extension of the marine snail, Kelletia kelletii (Forbes, 1852).
Journal of Biogeography, 30, 913–924.
Zweig MH, Campbell G (1993) Receiver-operating characteristic
(ROC) plots: a fundamental evaluation tool in clinical medi-
cine. Clinical Chemistry, 39, 561–577.
M O D E L L I N G C H A N G E S I N P. R U S T I C A D I S T R I B U T I O N 2077
r 2007 The AuthorsJournal compilation r 2007 Blackwell Publishing Ltd, Global Change Biology, 13, 2065–2077