Embed Size (px)
Citation preview

Modelling Responses of Broiler Chickens
to Dietary Balanced Protein

Promotor: Prof. dr. ir. M.W.A. Verstegen
Hoogleraar Diervoeding
Wageningen Universiteit
Promotor: Prof. dr. ir. L.A. den Hartog
Hoogleraar Bedrijfsontwikkeling in de veehouderij
Wageningen Universiteit
Co-promotor: Dr. ir. R.P. Kwakkel
Universitair docent
Wageningen Universiteit
Promotiecommissie:
Prof. dr. R.M. Gous University of Natal (South Africa)
Dr. M.C. Blok Centraal Veevoederbureau, Lelystad
Prof. dr. D. van der Heide Wageningen Universiteit
Prof. dr. ir. R.B.M. Huirne Wageningen Universiteit
Dit onderzoek is uitgevoerd binnen de onderzoekschool Wageningen
Institute of Animal Sciences.

Ruud Eits
Modelling Responses of Broiler Chickens
to Dietary Balanced Protein
Proefschrift
ter verkrijging van de graad van doctor
op gezag van de rector magnificus
van Wageningen Universiteit,
prof. dr. ir. L. Speelman,
in het openbaar te verdedigen
op woensdag 2 juni 2004
des namiddags te half twee in de Aula

Eits, R.M., 2004. Modelling responses of broiler chickens to dietary
balanced protein.
Ph.D. Thesis, Wageningen University.
Nutreco R&D, PO Box 220, 5830 AE Boxmeer, The Netherlands.
ISBN: 90-8504-070-1

ABSTRACT
Protein is an important nutrient for growing broiler chickens, as it affects
broiler performance, feed cost as well as nitrogen excretion. The objective
of this dissertation was to develop a growth model for broiler chickens that
could be easily used by practical nutritionists. The model should facilitate
the selection of feeding strategies (in terms of dietary protein and energy)
that results in the desired body composition of broilers while minimizing
costs.
Two important theories that are generally used in animal growth models
were validated for broiler chickens. It was confirmed that, where protein is
limiting, protein deposition rate will not increase with additional energy
intake. The second theory, stating that the fat-free body composition is
independent from nutrition, is not a valid assumption for broiler growth
models.
It was demonstrated that broiler responses to dietary balanced protein
level (DBP) depend on previous protein nutrition. These results suggest
that DBP levels in grower and finisher diets should not be optimised
independently, but simultaneously.
A model was developed that predicts broiler responses (growth rate, feed
conversion ratio, carcass yield and breast meat yield) to DBP level. The
model makes it possible to construct tailor-made dose-response curves
without actual experimentation.
Based on the predictions by this new model and data on feed and meat
prices, the economic aspects of DBP level in broiler diets were evaluated. It
was shown that formulating diets for maximum profit instead of maximum
broiler performance may strongly increase profitability of a broiler
production enterprise. Model simulations revealed as well that DBP level
for maximum profitability depend on how the broilers are marketed; as
whole birds, carcass or cut up.


Voor Lianne
Voor Jan-Jaap, Wilmer en Marilyn
Ter herinnering aan mijn vader
VOORWOORD
Een promotieonderzoek is in de eerste plaats een leerervaring. Onderzoek
doen is immers een vak dat je kunt leren. Kiezen van de juiste doelen,
ontwerpen, uitvoeren en analyseren van proeven en desk-studies,
schrijven van wetenschappelijke artikelen, presenteren van resultaten op
congressen, etc. Daarnaast had dit promotie-project een extra dimensie:
het onderzoek is uitgevoerd voor en binnen een bedrijf. Logisch dus dat het
project kennis moest opleveren die praktisch relevant en toepasbaar is. De
voortdurende implementaties in de praktijk maakten het
onderzoeksproject extra leuk en leerzaam, maar ook extra complex.
Gelukkig heb ik het niet alleen hoeven doen. Naast dank aan God die mij
de gaven en gezondheid gaf, wil ik graag de mensen bedanken die hun
bijdrage hebben geleverd, direct of indirect.
Ik denk aan de stuurgroep die onder andere als taak had om de rode draad
en de wetenschappelijke kwaliteit van het project te bewaken. Martin
Verstegen en Rene Kwakkel waren van het begin tot het eind bij dit project
betrokken en daarmee de constante factor binnen de regelmatig van
samenstelling wisselende stuurgroep. Martin, bedankt voor je vele ideeën,
die creativiteit en diepgang in de discussies brachten. De ‘avondsessies’ bij
Rene thuis hebben mij geleerd hoe je een wetenschappelijk artikel kunt
schrijven: een vak apart. ‘Waanzinnig’ bedankt, om een favoriet woord uit
je eigen vocabulaire te gebruiken.
Manfred Hessing heeft het promotieproject opgezet en mij aangenomen.
Manfred, bedankt voor je vertrouwen in mij. Karel de Greef en Jan-Dirk
van der Klis hebben in de beginfase het project in versnelling gebracht.
Een korte vraag van Karel leverde mij doorgaans heel wat nuttig denkwerk
op. Jan-Dirk, je punctualiteit en nutritionele kennis waren voorbeeldig.
Gedurende een blauwe maandag was ook Siem Korver lid van de
stuurgroep. Siem, jij maakte mij er van bewust dat een promotie-
onderzoek meer tijd vraagt dan ‘even wat artikeltjes schrijven’. Dit inzicht
heeft mij geholpen in de rest van het project. Leo den Hartog heeft tijdens
de laatste fase van het project meegedacht. Leo, bedankt voor je
vertrouwen en luisterend oor, zeker toen ik het persoonlijk moeilijk had.
Leuk om te ervaren dat de rol van de stuurgroep tijdens het project met
mij mee veranderde en daarmee steeds een toegevoegde waarde voor mij
behield. Complimenten!

Het aantal Nutreco collega’s dat bij het project betrokken is geweest, is niet
op één hand te tellen. Ook niet op vijf, overigens. Ik denk aan de
dierverzorgers op de proefbedrijven ‘Groot Kantwijk’ en ‘Halfweg’, die de
proeven zorgvuldig uitvoerden en veel vleeskuikens hebben uitgesneden.
De mensen in het ‘lab’ die de samenstelling van de voer- en vleesmonsters
bepaalden. Dank ook aan Paul Stoutjesdijk en Imelda van de Kruys, die
voor hun MSc-project veel werk verzetten voor twee experimenten.
Leerzaam waren de vele en kritische discussies met nutritionisten,
integratie-managers, technisch-specialisten, marketing-specialisten,
vleeskuikenhouders, etc. En natuurlijk met de collega’s van het Poultry
and Rabbit Research Centre en andere R&D collega’s werkzaam op het
gebied van varkens, rundvee, vis, fokkerij, slachterij, etc. Toegang te
hebben tot zo’n grote diversiteit aan expertise maakt het werken voor
Nutreco tot een ervaring apart. Deze ervaringen hebben mij ook veel
geleerd over hoe R&D bruikbare kennis kan opleveren voor de praktijk, en
hoe niet.
Heel veel dank ben ik verschuldigd aan mijn ouders. Mama, samen met
papa heeft u met liefde veel tijd en energie geïnvesteerd in onze opvoeding.
Verdrietig dat papa er niet meer is en de promotie niet meer heeft kunnen
meemaken. Ook familie en vrienden, bedankt voor alles. Geraline, bedankt
voor het mooie omslagontwerp. Verder denk ik aan het boerenechtpaar
ome Gijs en tante Neel. Op hun boerderij heb ik vele leerzame en gezellige
uurtjes gewerkt bij de verzorging van koeien en kippen en onderhoud van
de boerderij. Dit heeft er zeker aan meegewerkt dat ik in de agrarische
sector ben ‘beland’. Enne... niet te vergeten mijn biologie-leerlingen op de
middelbare school. Zonder zich ervan bewust te zijn, leerden zij mij als
docent net zoveel als ik hun; leerervaringen waarvan ik nog steeds profijt
heb. John en Gert, leuk dat jullie zo enthousiast reageerden op mijn
verzoek om paranimf te zijn.
Lianne, zonder jouw liefde, steun en je grote aandeel in de opvoeding en
verzorging van onze kinderen had ik mijn werk niet zo kunnen uitvoeren.
Jan-Jaap, Wilmer en Marilyn realiseren zich nog niet hoeveel ze mij helpen
om het werk te relativeren...
Ruud


Contents
General Introduction 1
Chapter 1 Protein and lipid deposition rates in male broiler chickens:
separate responses to amino acids and protein-free energy 7
Chapter 2 Fat-free body composition in male broiler chickens: effects
of feed intake level and dietary protein to energy ratio 27
Chapter 3 Dietary balanced protein in broiler chickens: effects of early
life protein nutrition on later responses 45
Chapter 4 Dietary balanced protein in broiler chickens: a flexible and
practical tool to predict dose-response curves 71
Chapter 5 Dietary balanced protein in broiler chickens: an economic
analysis 101
General Discussion 121
Summary 137
Samenvatting 145
List of Publications 157
Curriculum Vitae 161


General Introduction

General Introduction
2
PROTEIN NUTRITION OF BROILER CHICKENS
The poultry meat industry in the 21st century has evolved from tens of
thousands of small farms in the post-World War II period to an industry of
relatively few large vertically integrated companies. World chicken meat
production has grown from 29 million metric tons in 1990 to an estimated
50 million metric tons in 2000 (Aho, 2002). Nowadays, at least two kg of
broiler feed is needed for each kg of chicken meat that is produced. As a
result, a 1% improvement in efficiency of feed utilization for meat
deposition in broilers would save at least 1 million metric tons of broiler
feed on a worldwide scale.
Feed utilization in broilers is improved with higher protein levels in the
diet. Dietary protein level also influences growth rate and body
composition (carcass and breast meat yield) in broilers (Smith et al., 1998).
Moreover, the amount of protein in the diet affects feed cost as well as
nitrogen excretion that may result in pollution of the environment. The
mentioned effects of dietary protein in broiler diets depend on many
interacting factors, like dietary energy level, broiler genotype and
temperature (NRC, 1994). Even if knowledge is available of all these
interactions, choosing the optimal protein level for a broiler diet remains a
complex task for nutritionists. A growth simulation model that evaluates
all the relevant interacting factors simultaneously, is needed for this aim
(Gous, 1998).
BROILER GROWTH MODELS
Several models are available to simulate the growth of broiler chickens
(Zoons et al., 1991). Growth models can be classified as empirical and
mechanistic models. Both types of models give a description of the
relationship between a dependent variable and an independent variable.
However, empirical models work as a black box whereas mechanistic
models describe underlying biological processes (Zoons et al., 1991).
For predicting the response of broilers to a certain diet, mechanistic
models are preferable to empirical models. Empirical models are only
reliable for the exact (research) conditions under which the model is
constructed. Mechanistic models have a better change to be valid for

General Introduction
3
extrapolation than empirical models, provided that the mechanisms of
growth are represented in a correct way.
An example of a mechanistic broiler growth model is the Edinburgh
Growth Model (EFG-model; Emmans, 1981; Emmans and Fisher, 1986;
Gous, 1998). The EFG-model is unique in that it is based on a relatively
clear, but at the same time rather complete growth concept, including a
description of the genetic potential of a broiler (Eits, 1996). Given the
ongoing and dramatic genetic development of broilers (Albers, 1998),
growth models that do not deal explicitly with the effect of genetic potential
will probably be outdated within several years. Another strong feature of
the EFG-model is that it takes into account the relationship between
ambient temperature and metabolism (Emmans, 1981). For those reasons,
we believe that the EFG-model is more fit as a practical tool for broiler
nutritionists than other broiler models mentioned by Zoons et al. (1991) or
published more recently (King, 2001).
A problem with the practical use of the EFG-model is that it requires data
on the protein mass in adult broilers to determine the potential growth
curve. It is hardly possible to obtain representative data on adult broilers
of a commercial breed (Zoons et al., 1991). The difficulties with
determination of the potential growth curve of a given genotype may
explain the systematic differences in protein deposition rates between
predictions by the EFG-model and unpublished data from trials in our
laboratory (Eits, 1996). The observed bias could also mean, however, that
the underlying nutritional theories are not completely valid for broiler
chickens. An important theory in the EFG-model as well as in several
growth models for pigs (Whittemore and Fawcett, 1976; Moughan and
Verstegen, 1988) is that dietary protein will be preferentially used for
protein deposition, unless dietary energy or other factors become limiting.
The key assumption is that, where protein intake is limiting, protein
deposition rate will not increase with additional energy intake.
Experimental evidence that is relevant to the testing of this theory in
broiler chickens is scarce.
According to another theory in the EFG-model (Emmans, 1981), water and
ash deposition in the body is associated with protein deposition only (Black
et al., 1986; Moughan et al., 1987). This implies that the relationships
between water and protein mass, and between ash and protein mass, are
both considered to be independent of nutrition. Opposing views exist on
whether the fat-free body composition is indeed independent of nutrition

General Introduction
4
(Kyriazakis et al., 1991; De Greef et al., 1992). Moreover, this latter theory
is hardly validated for broiler chickens.
Thus, for a successful application of models in practice, the required model
input should be easily available for the user. Moreover, the underlying
theories should be as simple as possible and sufficiently validated in order
to gain user confidence. It is concluded that existing broiler growth models
in their present form do not meet these criteria. Consequently, a practical
tool for determining optimal nutrient levels in broiler diets is not available
yet.
The objective of this dissertation was to develop a growth model for broiler
chickens that could be easily used by practical nutritionists. The model
should facilitate the selection of feeding strategies (in terms of dietary protein
and energy) that results in the desired body composition of broilers while
minimizing cost. A description of the genotype of a broiler chicken should be
an input variable for the model.
OUTLINE OF THE DISSERTATION
It was mentioned as a key assumption in many growth models that dietary
protein will be preferentially used for protein deposition, unless dietary
energy or other factors become limiting. The validity of this theory for
growing broiler chickens was tested in an experiment that is described in
Chapter 2. Data of this experiment were also used to validate the other
mentioned assumption in growth models, namely that fat-free body
composition is independent of nutrition (Chapter 3). In Chapter 4, an
experiment was described on the effects of early life protein nutrition on
responses of broiler chickens to dietary protein at later age. Data of this
latter experiment and from other experiments were used to develop a new
model. The new model predicts broiler responses (growth rate, feed
conversion ratio, carcass yield and breast meat yield) to dietary balanced
protein level (Chapter 5). Based on the predictions by this model and data
on feed and meat prices, the economic aspects of dietary protein level in
broiler diets were evaluated (Chapter 6). In the General Discussion, the
contribution of the studies in Chapters 2 to 6 to the realisation of the
general objective of this dissertation is evaluated.

General Introduction
5
REFERENCES
Aho, P. W., 2002. The World’s commercial chicken meat and egg industries. Pages 3-17 in:
Commercial chicken meat and egg production, 5th edition. D. D. Bell and W. D.
Weaver, jr., eds. Kluwer Academic Publishers, Norwell, USA.
Albers, G. A. A., 1998. Future trends in poultry breeding. Pages 16-20 in: Proceedings of the
10th European poultry conference, Jerusalem, Israel.
Black, J. L., R. G. Campbell, I. H. Williams, K. J. James and G. T. Davies, 1986. Simulation of
energy and amino acid utilisation in the pig. Res. Dev. Agric. 3:121-145.
De Greef, K. H., M. W. A. Verstegen and B. Kemp, 1992. Validation of a porcine growth model
with emphasis on the composition of the body. Livest. Prod. Sci. 32:163-180.
Eits, R. M., 1996. Energie- en eiwitparameters van het vleeskuiken die ten grondslag liggen
aan groeimodellering. M.Sc. Thesis, Wageningen University, Wageningen, The
Netherlands.
Emmans, G. C., 1981. A model of the growth and feed intake of ad libitum fed animals,
particularly poultry. Pages 103-110 in: Computers in animal production. G. M.
Hillyer, C. T. Whittemore and R.G. Gunn, eds. Occasional publication no. 5, British
Society of Animal Production.
Emmans, G. C. and C. Fisher, 1986. Problems in nutritional theory. Pages 9-39 in: Nutrient
requirements of poultry and nutritional research. C. Fisher and K. N. Boorman, eds.
Butterworths, London, UK.
Gous, R. M., 1998. Making progress in the nutrition of broilers. Poult. Sci. 77:111-117.
King, R. D., 2001. Description of a growth simulation model for predicting the effect of diet on
broiler composition and growth. Poult. Sci. 80:245-253.
Kyriazakis, I., C. Stamataris, G. C. Emmans and C. T. Whittemore, 1991. The effects of food
protein content on the performance of pigs previously given foods with low or
moderate protein contents. Anim. Prod. 52:165-173.
Moughan, P. J., W. C. Smith and G. Pearson, 1987. Description and validation of a model
simulating growth in the pig (20-90 kg live weight). N. Z. J. Agric. Res. 30:481-489.
Moughan, P. J. and M. W. A. Verstegen, 1988. The modelling of growth in the pig. Neth. J.
Agric. Sci. 36:145-166.
NRC, 1994. Nutrient requirements of poultry. Ninth revised edition, National Academy Press,
Washington, D.C., USA.
Smith, E.R., G. M. Pesti, R. I. Bakalli, G.O. Ware and J. F. M. Menten, 1998. Further studies
on the influence of genotype and dietary protein on the performance of broilers.
Poult. Sci. 77:1678-1687.
Whittemore, C. T. and R. H. Fawcett, 1976. Theoretical aspects of a flexible model to simulate
protein and lipid growth in pigs. Anim. Prod. 22:87-96.
Zoons, J., J. Buyse and E. Decuypere, 1991. Mathematical models in broiler raising. World’s
Poult. Sci. J. 47:243-255.


Chapter 1
Protein and Lipid Deposition Rates in Male Broiler
Chickens: Separate Responses to Amino Acids and
Protein-Free Energy
Paper by: R. M. Eits, R. P. Kwakkel, M. W. A. Verstegen, P. Stoutjesdijk
and K. H. De Greef, 2002. Poult. Sci. 81:472-480. Reproduced with
permission of The Poultry Science Association, Inc.

Chapter 1: Protein and lipid deposition rates
8
ABSTRACT Two experiments of similar design were conducted with
male broiler chickens over two body weight ranges, 200 to 800 g in
Experiment 1 and 800 to 1,600 g in Experiment 2. The data were used to
test the hypothesis that protein deposition rate increases (linearly) with
increasing amino acid intake, until energy intake becomes limiting for
protein deposition rate. Additional amino acid intake above this point
would be deposited less efficiently. An increase in energy intake would
increase lipid deposition rate, but should, at low amino acid intakes, not
affect protein deposition rate. Each experiment consisted of 18 treatments:
two levels of protein-free energy (energypf) intake, combined with nine
amino acid to energypf ratios. Protein was balanced for amino acid content
and lysine was the first limiting amino acid in the diet.
Protein deposition rate increased with additional amino acid intake. No
evidence was found that energypf intake limited protein deposition rate at
high amino acid intake. Extra intake of energypf increased lipid deposition
rate, which was independent of amino acid intake. Where amino acid
intake was limiting, additional intake of energypf had generally no effect on
protein deposition rate. The marginal efficiency of amino acid utilization for
protein deposition did not depend on body weight. The facts are relevant to
the modelling of the growth of broiler chickens.

Chapter 1: Protein and lipid deposition rates
9
INTRODUCTION
The rate at which broiler chickens grow, and the composition of the
growth, is determined in large part by their intakes of amino acids and
energy. The major costs of feeding are those of supplying amino acids and
energy. It follows that amino acids and energy are the most important
nutrients to be considered in the design of feeding strategies. To do this,
some way of predicting the responses of growth rate and body composition
to these nutrients is needed.
Whittemore and Fawcett (1976) proposed that dietary protein will be
preferentially used for protein deposition, unless energy availability or other
factors (genotype or environment) become limiting. Moughan and Verstegen
(1988) used the same idea in their model. The key assumption is that, where
protein intake is limiting, protein deposition rate will not increase with
additional energy intake. The idea has experimental support in pigs
(Campbell and Taverner, 1988; Bikker, 1994) but seems less valid for pre-
ruminant calves (Gerrits et al., 1996). To the authors’ knowledge, there is
hardly any experimental evidence that is relevant to the testing of the idea in
broiler chickens. The objective of this study was to investigate the separate
effects of amino acid and energy intakes on the rates of protein and lipid
deposition in the different body components of young broiler chickens. The
main purpose was to test whether, at amino acid intakes that were limiting,
energy intake would have any effect on protein deposition rate in broiler
chickens. Energy intake was kept constant on a protein-free basis in an
attempt to make energy and amino acid intakes independent of each other.
The hypotheses proposed were, that (1) for broiler chickens between 200 and
1,600 g body weight (BW), protein deposition rate would increase (linearly)
with increasing amino acid intake, until energy intake would become
limiting; (2) additional amino acid intake above this point would be deposited
less efficiently; and (3) an increase in energy intake would increase lipid
deposition rate, but would not, at limiting amino acid intakes, affect protein
deposition rate.
MATERIALS AND METHODS
Two experiments of similar design were performed with male broiler
chickens over two body weight (BW) ranges, 200 to 800 g in Experiment 1

Chapter 1: Protein and lipid deposition rates
10
(EXP1) and 800 to 1,600 g in Experiment 2 (EXP2). The 1-d-old chicks for
EXP1 and EXP2 were hatched on the same day and were housed in the
same house.
Birds and housing
One hundred forty-three 10-d-old male broiler chickens (Ross 208, Ross
breeders, New Bridge, UK) were individually housed in floor pens (1.0 by
0.36 m) on wood shavings. Temperature was gradually decreased each d
from 26 C at Day 10 to 19 C at Day 42, at which level it was then held.
Lighting was 16 h of light and 8 h of darkness.
Experimental design
The birds were assigned to 143 floor pens; three blocks of 21 pens (EXP1)
and four blocks of 20 pens (EXP2), according to a randomised block
design. Each block consisted of one replicate for each of the 18 treatments
and, in addition, three (EXP1) or two (EXP2) ad libitum fed control birds.
These control birds were used to estimate the intrinsic maximum protein
deposition rate of the birds. Within blocks, variation in initial BW was
minimized by allocation of birds based on BW. For the first 10 d of age, all
broilers were housed in groups of 20 per pen.
Both experiments had 18 controlled feeding treatments: two levels of
protein-free digestible energy supply (energypf at 1.7 and 2.1 times
estimated maintenance) combined with nine levels of amino acid supply
(3.3, 3.8, 4.3, 4.5, 4.8, 5.0, 5.3, 5.7 and 6.2 (EXP1) and 3.2, 3.6, 4.1, 4.3,
4.6, 4.8, 5.0, 5.4 and 5.9 (EXP2) g apparently digestible lysine per Mcal
energypf). The calculated nutrient levels were all based on CVB (2000). The
estimation of AME requirement for maintenance (108 kcal per kg metabolic
BW (kg 0.75) per d) came from the literature (Zoons et al., 1991). The low
and high levels of energypf supply corresponded with, respectively, about
70% and 83% of the mean energypf intake of the ad libitum fed birds, in
both experiments. On the basis of the composition of ideal protein
proposed by Baker et al. (1993), all essential amino acids were supplied at
levels of at least 115% of that of lysine. It was then assumed that the
responses to amino acid intake in this trial reflected a response to lysine
as the first limiting amino acid.
Proteins, carbohydrates and fats differ in their ATP yield per Mcal AME (see
Gerrits et al., 1996). Therefore, in order to standardize the intake of energy
available for maintenance and growth among the different amino acid

Chapter 1: Protein and lipid deposition rates
11
intake levels as much as possible, energy intake was kept constant on a
protein-free basis and the ratio between digestible carbohydrates and
digestible fats was kept constant. The energypf supply was estimated from
the intakes of apparently digestible crude fat (9.28 kcal/g) and apparently
digestible carbohydrates (4.14 kcal/g) (CVB, 2000).
Table 1. Composition of the experimental feeds
Ingredients, g/kg Energy
feed
Protein
feed Nutrients, g/kg
Energy
feed
Protein
feed
Corn 379.0 407.0 Calculated:
Peas 75.0 75.0 DE protein-free2 2544 2060
Soybean meal (490 g/kg CP) 45.1 210.6 Lysine 3 7.5 12.8
Toasted soybeans 102.2 - Methionine3 4.5 8.0
Sunflower meal 23.2 40.0 Cysteine3 1.5 2.7
Wheat middlings 68.9 59.4 Threonine3 5.4 9.5
Tapioca (650 g/kg starch) 180.0 32.4 Tryptophan3 1.3 2.5
Animal fat 65.7 62.3 Isoleucine3 5.5 9.7
Caseinate (830 g/kg CP) 11.0 75.1 Valine3 6.6 11.7
Monocalcium phosphate 9.2 3.4 Leucine3 10.3 19.2
Limestone 13.6 16.3 Arginine3 8.7 15.4
Sodium bicarbonate 5.0 1.9 Histidine3 2.9 5.6
Sodium chloride 1.0 1.0 Phenylalanine3 5.5 10.4
Premix 1 2.1 2.1 Dry matter 886 889
Choline chloride 40 g/kg 10.0 3.7 Crude protein 145 245
L-Lysine-HCl 2.16 - Crude fat 106 89
DL-methionine 2.48 3.97 Ash 56 52
L-arginine 1.21 3.46
L-isoleucine 0.78 0.31 Analysed:
L-valine 1.33 0.88 Lysine 8.8 14.1
L-threonine 1.77 1.18 Methionine 4.6 8.1
L-tryptophan 0.11 - Cysteine 2.2 3.4
Threonine 6.0 9.9
Dry matter 878 877
Crude protein 143 240
Crude fat 103 84
Ash 58 53
1 Contributed per kg of diet: 22 mg Cu as CuSO4, 15 mg Fe as FeSO4, 19 mg Zn as ZnSO4, 71 mg Mn as
MnO, 0.8 mg Co as CoSO4, 0.6 mg I as KI, 0.20 mg Se as Na2SeO3, 12,000 IU vitamin A (retinyl acetate),
2,500 IU vitamin D3, 1.12 mg vitamin B1, 5.6 mg vitamin B2, 38 mg nicotinic acid, 11 mg d-pantothenic
acid, 3.0 mg vitamin B6, 0.06 mg d-biotin, 1.0 mg folic acid, 0.012 mg vitamin B12, 30 IU vitamin E (dl-
α-tocopheryl acetate), 2.1 mg vitamin K3, 70 mg salinomycine, 50 mg zinc-bacitracine;
2 Energy in digestible carbohydrates and fats (kcal/kg) (CVB, 2000);
3 Apparently faecal digestible for poultry (CVB, 2000).

Chapter 1: Protein and lipid deposition rates
12
From Day 0 to 10, all birds received a commercial starter diet (crumble) for
ad libitum intake. Water was provided ad libitum throughout. The ad
libitum fed birds in EXP1 and EXP2 had ad libitum access to the feed with
the amino acid level of 4.6 g apparently digestible lysine per Mcal energypf.
This diet was also given ad libitum to the birds of EXP2, from Day 10 until
about 800 g BW. All restrictedly fed birds were fed twice per day.
Each of the experimental feeds was made by mixing the two basal feeds
(the ‘energy’ and ‘protein’ feed; 3 mm pellet; Table 1) in different ratios. The
two levels of energypf intake were achieved by having two levels of
allowance of each of the mixtures.
Weighing procedures
In order to calculate individual daily feed allowances, all birds were
weighed three times a week and each time, their gain was predicted on
basis of linear extrapolation for the next 2- or 3-d period. As weights
approached 800 (EXP1) or 1,600 g (EXP2), the broilers were weighed twice
daily just before feeding. They were killed when their BW exceeded 770 or
1570 g in EXP1 and EXP2, respectively. In EXP2, three (out of four) birds per
treatment group were dissected. The fourth bird was a spare one in case of
mortality.
Dissection procedures, chemical analyses and calculations
Birds were weighed, killed with an injection of 0.2 ml T61 (containing per
ml: 250 mg embutramide, 50 mg mebezoniumjodide, 5 mg
tetracainehydrochloride) in the wing vein and stored at 2 C for a maximum
period of 7 d. The birds were not bled. At dissections, each bird was
weighed, plunged into water of 60 C for 1 min, de-feathered, dried and
weighed again for calculation of the weight of feathers by difference.
Afterwards, the oesophagus, trachea, proventriculus, gizzard, intestines,
heart, liver, gall bladder, kidneys, lungs, spleen and Bursa of Fabricius
were dissected from the body. These organs were defined as the ‘organ
fraction’. The remaining body, including the abdominal fat pad, formed the
‘carcass fraction’. The gastrointestinal tract was stripped of its contents.
The carcass and organ fractions were weighed, homogenized in a blender
and frozen.
The carcass and organ fractions of each bird were analysed in duplicate for
dry matter, lipid, ash and nitrogen, according to the standards ISO 1442
(1973), 1444 (1973), 936 (1978) and 937 (1978), respectively, from the

Chapter 1: Protein and lipid deposition rates
13
International Organisation for Standardisation (Geneva, Switzerland). On
average, 98.6% (SE 0.35) of the dry matter was accounted for by the sum
of lipid, ash and N x 6.25. The small residual would be expected to be
largely glycogen. Diets were analysed for dry matter, lipid, ash and
nitrogen, according to ISO 6496 (1983), 6492 (1985), 5984 (1978) and
5983 (1979), respectively, also from the International Organisation for
Standardisation. Protein in these samples was calculated as N x 6.25.
The total deposition of protein or lipid in the three fractions, carcass, organs
and feathers, was calculated for each bird as the difference between the
amounts at the start and at slaughter. The amounts at the start were
estimated from the initial BW of the bird and the mean body composition of
the reference group. The reference group for EXP1 consisted of seven broilers
slaughtered at Day 10. The reference group for EXP2 consisted of the ad
libitum fed broilers in EXP1, slaughtered at 800 g BW. Deposition rates were
calculated as total deposition divided by the length of the experimental
period. The protein content of the feathers was taken as 43.8%, based on
Hancock et al. (1995). The increase in protein content of the feathers with age
(Hancock et al., 1995) was considered to be negligible over the range used
here. Daily lysine intake for each bird was calculated from the individual feed
consumption and total lysine content of their experimental diet.
Analysis of data
To test for the existence of a diphasic linear response in the relation
between amino acid intake and protein and lipid deposition rate, a
diphasic linear model was compared with a monophasic linear model. The
diphasic linear model was derived from Koops and Grossman (1993):
( ) ( )
−+−−+= 01.0exp1ln*01.0** 211
cXbbXbaY [1]
where: Y = protein or lipid deposition rate, a = intercept, b1 = slope of the
first linear phase, X = average daily lysine intake of individual bird, b2 =
slope of second linear phase, c = point of transition for the independent
variable. In this model there is a sharp transition from the first to the
second linear phase. The monophasic linear model was as follows:
XbaY *+= [2]
where: Y = protein or lipid deposition rate, a = intercept, b = slope and X =
average daily total lysine intake of individual bird. The significance of the
difference between models [1] and [2] was assessed by an F test. The

Chapter 1: Protein and lipid deposition rates
14
difference in sum of squares of the residuals between the two models,
divided by the difference in df of the residuals, was tested against the
residual MS of model [1].
As model [1] was never significantly better than model [2], a monophasic
linear response of protein and lipid deposition rate to amino acid intake
was assumed in further analyses. The effect of energypf and of amino acid
intakes on protein and lipid deposition rates in the different body parts
were analysed according to the following model:
( ) ( )averjkjaverjkji XXXXEBY −+−+++= ** 21 ββµ [3]
where: Y = rate of protein or lipid deposition, µ = average of Y at X = Xaver,
Bi = fixed effect of block i, Ej = fixed effect of energypf intake level j, β1 =
effect of amino acid intake level (regression coefficient), β2j = interaction
between amino acid level and energypf intake level (difference in regression
coefficients between the two energypf intake levels), Xjk = average daily
lysine intake of bird k at energypf intake level j, Xaver = average
experimental daily lysine intake (0.60 and 1.20 g/d in EXP1 and 2,
respectively), i = 1…3 (EXP1) or 1…4 (EXP2), j = 1, 2 and k = 1…27.
The effect of BW range on the linear relation between amino acid intake
and protein deposition rate was analysed according to the following model:
( ) ( )averijiaveriji XXXXBWY −+−++= ** 21 ββµ [4]
where: Y = rate of protein deposition, µ = average of Y at X = Xaver, BWi =
fixed effect of BW range i, β1 = effect of amino acid intake level (regression
coefficient), β2j = interaction between amino acid level and BW range
(difference in regression coefficients between the two BW ranges), Xij =
average daily lysine intake of bird j at BW range i, Xaver = average daily
lysine intake in EXP1 and 2 (0.90 g/d), i = 1,2 and j = 1…54.
Non-linear (Levenberg-Marquardt algorithm; Moré, 1977) and linear (GLM;
SPSS, 1999) regression procedures were used to analyse the data.
RESULTS
The data of one bird in EXP1 and of three birds in EXP2 were omitted from
the analyses due to sickness. As an indication of performance of the
restrictedly fed birds, the following data are given. Average BW at the start

Chapter 1: Protein and lipid deposition rates
15
of EXP1 (200 – 800 g BW) was 208 g. The time taken to grow from 200 to
800 g BW varied between 12.5 and 29.0 d so that growth rate varied
between 46.4 and 20.3 g/d. Feed conversion ratio varied between 1.24 and
1.98 g/g.
At the start of EXP2 (800 to 1,600 g BW), birds were either 22 or 23 d old.
They took between 10.0 and 22.5 d to grow to 1,600 g with growth rates
varying between 77.5 and 35.4 g/d. Feed conversion ratio varied between
1.47 and 2.32 g/g. In both experiments, growth rates increased and feed
conversion ratios decreased with increasing intakes of amino acids or
energy or both.
Protein deposition rate
Effects of amino acid and energypf intake Data on protein deposition rates
in the carcass are presented in Figure 1. In the carcass, but also in other
body parts (Table 2), protein deposition rate increased with increasing
amino acid intake, in both EXP1 and EXP2.
FIGURE 1. Protein deposition rate (g/d) in carcass of male broiler chicks, as a function of
amino acid intake (total lysine as reference; g/d) and energy intake (1.7 * M = 1.7 times
maintenance; 2.1 * M = 2.1 times maintenance) at two BW ranges: 200 to 800 g (Figure 1a) and
800 to 1,600 g (Figure 1b). Error bars represent standard errors; n = three replicates.
Parameter estimates for the diphasic model [1] are presented in Table 3.
Model [1] did not provide a significantly better fit to the experimental data
than did model [2], in either experiment (Table 3). There is thus no support
5
6
7
8
9
10
11
12
13
0.7 0.9 1.1 1.3 1.5 1.7
Total Lysine Intake (g/d)
Pro
tein
Deposit
ion
(g/d)
1.7*M 2.1*M 1b
2
3
4
5
6
7
8
0.3 0.5 0.7 0.9
Total Lysine Intake (g/d)
Pro
tein
Deposit
ion
(g/d)
1.7*M 2.1*M 1a

Chapter 1: Protein and lipid deposition rates
16
for the existence of a diphasic response in protein deposition rate,
including a phase with a lower efficiency of protein deposition at high
amino acid intake levels. At the high level of energypf intake in EXP1,
model [1] did not converge.
Table 2. Effect of protein-free energy intake and amino acid intake (total lysine as a reference;
g/d) on rate of protein deposition (g/d)
Effect protein-free energy intake
Effect
amino
acid
intake
Interaction 1
Low 2,3
High 2,3
SED 4 P 5 P 6 Low 2,7 High 2,7
SED 4
P 8
Experiment 1: 200 – 800 g BW
Total body 5.85 6.12 0.13 0.054 < 0.001 9.22 8.60 1.24 NS
Carcass 4.52 4.76 0.12 0.053 < 0.001 7.38 7.11 1.15 NS
Organs 0.62 0.64 0.024 NS < 0.001 0.89 0.94 0.22 NS
Feathers 0.72 0.72 0.039 NS < 0.001 0.95 0.55 0.36 NS
Experiment 2: 800 – 1,600 g BW
Total body 11.5 11.8 0.29 NS < 0.001 9.20 9.46 1.34 NS
Carcass 9.00 9.27 0.26 NS < 0.001 6.31 6.97 1.20 NS
Organs 1.02 1.03 0.068 NS < 0.001 1.31 1.04 0.31 NS
Feathers 1.55 1.50 0.082 NS < 0.001 1.58 1.45 0.38 NS
1 Interaction exists if the effect of amino acid intake (expressed as the regression coefficient of the linear
relation between amino acid intake and rate of protein deposition) differs for the low and high protein-
free energy intake levels;
2 Low and high protein-free energy intake levels are 1.7 * M and 2.1 * M, respectively (M = energy for
maintenance);
3 Values represent rates of protein deposition at the average total lysine intake (0.60 and 1.20 g/d in
Experiment 1 and 2, respectively);
4 Standard error of difference;
5 Probability for test on effect of protein-free energy intake; NS: P > 0.10;
6 Probability for test if the regression coefficient of the linear relation between amino acid intake and rate
of protein deposition, averaged over protein-free energy intake levels, equals zero;
7 Values represent regression coefficients of the linear relation between amino acid intake and rate of
protein deposition;
8 Probability for test if a significant interaction exists between amino acid intake and protein-free energy
intake; NS: P > 0.10.

Chapter 1: Protein and lipid deposition rates
17
Table 3. Parameter estimates (and asymptotic SE) for the diphasic linear relation1 between
amino acid intake (total lysine as a reference; g/d) and rate of protein deposition (g/d)
Protein
deposition
rate in:
Energy
intake2
a
b1
b2
c
R2 3
P 4
Experiment 1: 200 – 800 g BW
Low - 0.27
(0.71)
10.9
(1.40)
3.95
(5.95)
0.61
(0.07)
0.85 NS Total body
High - 5 - - - -
Low - 0.43
(0.65)
8.80
(1.28)
2.85
(5.39)
0.61
(0.07)
0.81 NS Carcass
High - - - - -
Experiment 2: 800 – 1,600 g BW
Low 0.02
(1.22)
9.76
(1.26)
7.57
(3.36)
1.15
(0.24)
0.89 NS Total body
High -1.38
(2.21)
11.2
(1.93)
5.77
(3.89)
1.33
(0.15)
0.78 NS
Low 0.89
(0.85)
6.84
(0.86)
3.73
(4.59)
1.21
(0.19)
0.85 NS Carcass
High -0.46
(1.96)
8.17
(1.70)
3.87
(4.47)
1.36
(0.20)
0.69 NS
1 Y = a + b1 * X – (b1-b2) * 0.01 * ln (1 + exp ((X-c) / 0.01)); where Y = rate of protein deposition (g/d),
a = intercept, b1 = slope of the first phase, b2 = slope of the second phase, c = point of transition for
the independent variable and X = total lysine intake (g/d);
2 Low and high = 1.7*M and 2.1*M energy intake level, respectively (M = energy for maintenance);
3 Proportion of variance explained by the model;
4 Probability for test if the diphasic linear model fits the data equally well as a monophasic linear
model; NS: P > 0.10;
5 The diphasic function did not converge for these data.
The effects of energypf and of amino acid intakes on protein deposition rate
are given in Table 2. Energypf intake level generally had no significant (P >
0.05) effect on protein deposition rate, either in total body or in carcass,
feathers or organs. Thus, at limiting amino acid intakes, protein deposition
rates were usually not increased with additional energypf intake. For total
body and carcass in EXP1, however, protein deposition rate, at limiting
amino acid intakes, tended to be higher with the higher energypf allowance
(P < 0.10). In EXP1 the difference in protein deposition rate in the total

Chapter 1: Protein and lipid deposition rates
18
body between the two levels of energypf allowance was on average 5%
(Table 2). In EXP2, this difference was numerically similar to EXP1, but
was not significant either. There was no interaction between the supplies
of amino acids and energypf on protein deposition rate in total body,
carcass, feathers or organs (Table 2). In other words, energypf intake did
not significantly influence (P > 0.05) the increase of protein deposition rate
(regression coefficient) with increasing amino acid intake.
The average daily lysine intake of the ad libitum fed birds was 0.75 g/d (SE
0.03) in EXP1 and 1.55 g/d (SE 0.04) in EXP2, with protein deposition
rates in the carcass of 6.08 g/d (SE 0.13) in EXP1 and 11.14 g/d (SE 0.49)
in EXP2. Protein deposition rates in total body were 7.85 g/d (SE 0.17) in
EXP1 and 14.3 g/d (SE 0.61) in EXP2.
Effects of body weight range Data on the protein deposition rate in total
body at the two BW ranges (EXP1 and EXP2 together) are presented in
Figure 2.
FIGURE 2. Protein deposition rate (g/d)
in total body of male broiler chicks, as a
function of amino acid intake (total lysine
as reference; g/d), at two BW ranges
(Experiment 1: 200 to 800 g; Experiment
2: 800 to 1,600 g). Error bars represent
standard errors; n = three replicates.
Data in Figure 2 shows that the relationship between protein deposition
rate and amino acid intake is highly similar for the two BW ranges. In
other words, at limiting amino acid intake, protein deposition rate seems
independent of BW and to be determined solely by amino acid intake. This
would imply that the regression coefficient (that is, the marginal efficiency
of amino acid utilization for protein deposition) and the level of protein
2
4
6
8
10
12
14
0.2 0.6 1.0 1.4 1.8
Total Lysine Intake (g/d)
Pro
tein
Deposit
ion
(g/d)
Experiment 1 Experiment 2

Chapter 1: Protein and lipid deposition rates
19
deposition rate at a given amino acid intake level, in Figure 2 are not
different between BW ranges. The marginal efficiency of protein deposition,
defined as the increase in protein deposition rate with each additional unit
of amino acid intake, was indeed not different (P > 0.10) between the two
BW ranges (9.49 vs. 9.66 g protein per gram lysine for EXP1 and 2,
respectively). The level of protein deposition rate at a given amino acid
intake was also not different (P > 0.10) between the two BW ranges.
Estimated protein deposition rates at 0.90 g lysine intake per d were 9.02
and 8.86 g/d for EXP1 and 2, respectively. If determined at amino acid
intake levels much higher or lower than 0.90 g lysine per d, the level of
protein deposition rate may be significantly different for the two BW
ranges, given the numerical difference (NS) in marginal efficiency of protein
deposition between BW ranges. Total efficiency of protein deposition,
defined as protein deposition in total body divided by total lysine intake,
was on average higher (t-test; P < 0.01) at the lower BW range than at the
higher BW range (10.43 vs 9.88 g protein per gram lysine).
Lipid deposition rate
Results on the lipid deposition rates in carcass are summarized in Figure
3. Model [1] did not converge for lipid deposition rate. Thus, there was no
evidence for the existence of a diphasic response in lipid deposition rate.
The effects of energypf and amino acid intake level on lipid deposition rate
are given in Table 4. Lipid deposition rate was independent of amino acid
intake. Level of lipid deposition rate was higher (P < 0.001) at the higher
intake of energypf: 3.29 vs 1.87 g/d (EXP1) and 8.34 vs 5.09 g/d (EXP2)
lipid deposition in carcass and organs for high and low energypf supply,
respectively (Table 4). The effects of amino acid and energyp.f supply on
lipid deposition rate were similar for carcass and organs.
Lipid deposition rates in carcass of the ad libitum fed birds were 5.56 g/d
(SE 0.18) and 11.85 g/d (SE 0.66) in EXP1 and 2, respectively. These rates
of lipid deposition are much higher than the lipid deposition rates of the
restrictedly fed birds with the higher energypf supply (Figure 3), in both
EXP1 and EXP2. In total body, lipid deposition rates of the ad libitum fed
birds were 5.88 g/d (SE 0.20) and 12.3 g/d (SE 0.65) in EXP1 and 2,
respectively.

Chapter 1: Protein and lipid deposition rates
20
Table 4. Effect of protein-free energy intake and amino acid intake (total lysine as a
reference; g/d) on rate of lipid deposition (g/d)
Effect protein-free energy intake
Effect
amino
acid
intake
Interaction 1
Low 2,3 High 2,3
SED 4 P 5 P 6 Low 2,7 High 2,7
SED 4
P 8
Experiment 1: 200 – 800 g BW
Carcass
+ organs
1.87 3.29 0.17 < 0.001 NS 0.68 0.09 1.58 NS
Carcass 1.77 3.10 0.16 < 0.001 NS 0.72 -0.06 1.5 NS
Organs 0.10 0.18 0.014 < 0.001 NS -0.04 0.15 0.13 NS
Experiment 2: 800 – 1,600 g BW
Carcass
+ organs
5.09 8.34 0.57 < 0.001 NS 0.60 0.67 2.65 NS
Carcass 4.91 7.99 0.56 < 0.001 NS 0.72 0.69 2.59 NS
Organs 0.18 0.35 0.046 0.001 NS -0.13 -0.02 0.21 NS
1 Interaction exists if the effect of amino acid intake (expressed as the regression coefficient of the linear
relation between amino acid intake and rate of lipid deposition) differs for the low and high protein-free
energy intake levels;
2 Low and high protein-free energy intake levels are 1.7 * M and 2.1 * M, respectively (M = energy for
maintenance);
3 Values represent rates of lipid deposition at the average total lysine intake (0.60 and 1.20 g/d in
Experiment 1 and 2, respectively);
4 Standard error of difference;
5 Probability for test on effect of protein-free energy intake;
6 Probability for test if the regression coefficient of the linear relation between amino acid intake and rate
of lipid deposition, averaged over protein-free energy intake levels, equals zero; NS: P > 0.10;
7 Values represent regression coefficients of the linear relation between amino acid intake and rate of
lipid deposition;
8 Probability for test if a significant interaction exists between amino acid intake and protein-free energy
intake; NS: P > 0.10.

Chapter 1: Protein and lipid deposition rates
21
FIGURE 3. Lipid deposition rate (g/d) in carcass of male broiler chicks, as a function of amino
acid intake (total lysine as reference; g/d) and energy intake (1.7 * M = 1.7 times maintenance;
2.1 * M = 2.1 times maintenance) at two BW ranges: 200 to 800 g (Figure 3a) and 800 to 1,600
g (Figure 3b). Error bars represent standard errors; n = three replicates.
DISCUSSION
Amino acid intake and protein deposition rate
Part of the hypothesis for this study was that protein deposition rate
increases (linearly) with increasing amino acid intake, until energy intake
becomes limiting for protein deposition rate. Additional amino acid intake
above this point would be deposited less efficiently. Thus, a diphasic
response in protein deposition rate was expected. In accordance with this
hypothesis, diphasic response curves were found (Table 3), estimated by
means of a diphasic model. However, the diphasic model did not fit the
data significantly better than a monophasic model. Therefore, there was no
statistical evidence that energypf intake had been limiting protein
deposition rate at high amino acid intakes.
The power of the statistical test discriminating between the diphasic and
monophasic model was low, which could have contributed to the failure to
find a significant diphasic response. First, there were only two or three
treatments (see Figure 1) above the estimated point of transition (Table 3).
1
2
3
4
5
0.3 0.5 0.7 0.9
Total Lysine Intake (g/d)
Lip
id D
eposit
ion
(g/d)
1.7*M 2.1*M 3a
3
4
5
6
7
8
9
10
11
0.7 0.9 1.1 1.3 1.5 1.7
Total Lysine Intake (g/d)
Lip
id D
eposit
ion
(g/d)
1.7*M 2.1*M 3b

Chapter 1: Protein and lipid deposition rates
22
As a consequence, the SE´s of the estimated regression coefficients of the
second phase were quite high (Table 3). Secondly, the difference in
regression coefficients between the first and second phase of the diphasic
model was relatively small. In our study, protein deposition rate did not
reach a plateau, but continued to increase with increasing protein intake,
although with a lower efficiency in the second phase than in the first
phase. In contrast, trials of similar design have been reported (e.g. Bikker,
1994) where protein deposition rates reached a maximum (a plateau) at a
certain protein intake. In such trials, the difference between the diphasic
and monophasic model is more likely to be significant than in our study.
In the study of Bikker (1994), a plateau was found in protein deposition
rate at high protein intakes, where energy intake became limiting. In his
study, total AME intake, and not energypf intake, was kept constant among
amino acid intake levels. In our study, with constant energypf intake, total
AME intake increased with increasing amino acid intake. Consequently,
protein deposition rate was less likely to become limited by energy intake.
Another possible reason exists for the absence of a significant diphasic
response in protein deposition. Lipid deposition rate was not affected by
increasing amino acid intake, at a constant energypf intake. Besides, daily
maintenance requirement for energy was, most likely, not affected either
by the increased amino acid intake, at constant energypf intake, because
average body weight during the experiment was not different between
treatments. Protein deposition rate, however, significantly increased with
increasing amino acid intake, at constant energypf intake. These findings
suggest that the energy required for additional protein deposition seems to
have been supplied completely by (the partial oxidation of) the additional
intake of amino acids. From this reasoning, it follows that energypf intake
may have not been limiting protein deposition rate at all, not even at the
highest amino acid intakes.
Even in perfectly balanced diets, some amino acid oxidation is inevitable
(Millward et al., 1990). However, in our study, amino acid oxidation was
further increased due to the deliberate imbalance in dietary protein. All
essential amino acids were supplied at levels of at least 115% of that of
lysine. It follows that the oxidation of the amino acids was probably
relatively high in our study.

Chapter 1: Protein and lipid deposition rates
23
Energypf intake and protein deposition rate
At limiting amino acid intake, additional energypf intake had generally no
effect on protein deposition rate. This latter fact is accordance with several
pig studies (e.g. Black et al., 1986; Kyriazakis and Emmans, 1992;
Susenbeth et al., 1999) in which energy intake had no effect on protein
deposition if protein intakes were limiting. In contrast, in a similar study
with preruminant calves, additional energypf intake significantly increased
protein deposition rates, although protein intake was limiting (Gerrits et
al., 1996).
With young broiler chicks (EXP1), increasing the intake of energypf, at
limiting amino acid intake, tended to increase protein deposition rate in
total body and carcass. An explanation for this could be a ‘protein-sparing’
effect of additional energypf intake. Additional intake of carbohydrates may
increase insulin levels in the blood, which may reduce amino acid
oxidation (Hourani et al., 1990), leaving more amino acids for protein
deposition. On the other hand, the data as presented in Figure 1 do not
really support the idea of a systematic effect of energypf intake on protein
deposition rate in carcass. Taking together, at limiting amino acid intakes,
additional energypf intake had generally no effect on protein deposition
rate.
Birds fed ad libitum
Protein deposition rates of the restrictedly fed birds at the highest level of
energypf and amino acid intake were in the same range as the protein
deposition rates of the ad libitum fed birds. If it is assumed that the ad
libitum fed birds grew according to their intrinsic maximum protein
deposition rate, these facts suggest that the highest protein deposition
rates of the restrictedly fed birds may have been close to their intrinsic
maximum. Lipid deposition rates of the ad libitum fed birds were higher
than the lipid deposition rates of restrictedly fed birds with similar protein
deposition rates. This difference in lipid deposition rates is probably related
to a difference in dietary protein to energy ratio.
Body weight and protein deposition rate
The partitioning of protein in the body among carcass, organs and
feathers was different between BW ranges. For example, the proportion of
total protein deposition that was deposited in organs decreased with
increasing BW (results not presented). However, the marginal efficiency (=

Chapter 1: Protein and lipid deposition rates
24
the increase in protein deposition rate with each additional unit of amino
acid intake) of protein deposition in total body was independent of BW.
Thus, the difference in growth composition between BW ranges did not
significantly modify the efficiency by which the dietary amino acids (above
maintenance) were deposited in the body.
In contrast to the marginal efficiency, total efficiency (= total protein
deposition divided by total lysine intake) of protein deposition (which
includes maintenance losses) was significantly decreased with increasing
BW. In EXP2, total efficiency of protein deposition in total body was 5%
lower than in EXP1. Similarly, Susenbeth et al. (1999) found that, at a
given intake of lysine as the first limiting nutrient, protein deposition rate
in pigs decreased with increasing BW. At 77 kg BW, protein deposition rate
was 5% lower than at 44 kg BW. The results of their and our study
indicate that, if lysine intake is first limiting, maintenance requirement for
lysine increases with BW. Absolute levels of maintenance requirement for
lysine are low. In our study, the marginal efficiency of lysine for protein
deposition was similar, or even lower, than the total efficiency. Based on
this observation, estimated maintenance requirements for lysine are close
to zero, or even negative. In the review of Susenbeth (1995), estimated
maintenance requirements for lysine in pigs were not different from zero.
In their and our study, maintenance requirements were estimated at zero
protein retention. It is recognized, however, that using zero lysine retention
as a parameter leads to much higher estimates of maintenance
requirements (Emmert and Baker, 1997). This suggests that lysine needs
for maintenance may be substantially higher than estimated by Susenbeth
(1995) and in our study. Nevertheless, the estimated differences in
maintenance requirement for lysine between BW ranges caused differences
in protein deposition, at a given amino acid intake, that can not be
ignored.
In our study, nearly all lysine intake levels in EXP2 were higher than in
EXP1 (Figure 2). The effect of BW on total, and marginal, efficiency of
amino acid utilization needs to be validated with data with more overlap in
amino acid intake levels for the different BW ranges.
Conclusions
Protein deposition rate increased with additional amino acid intake. No
evidence was found that energypf intake limited protein deposition rate at
high amino acid intake. Extra intake of energypf increased lipid deposition
rate, which was independent of amino acid intake. Where amino acid

Chapter 1: Protein and lipid deposition rates
25
intake was limiting, additional intake of energypf had generally no effect on
protein deposition rate. The marginal efficiency of amino acid utilization for
protein deposition did not depend on body weight. The facts are relevant to
the modelling of the growth of broiler chickens.
ACKNOWLEDGMENTS
We thank Gerry Emmans (SAC, Scotland), Jan Dirk van der Klis
(Wageningen-UR, The Netherlands), and several Nutreco colleagues for
their useful suggestions on this manuscript. This research was partially
supported by the Dutch Ministry of Economic Affairs.
REFERENCES
Baker, D. H., C. M. Parsons, S. Fernandez, S. Aoyagi and Y. Han, 1993. Digestible amino acid
requirements of broiler chicks based upon ideal protein considerations. Pages 22-32
in: Proceedings of the Arkansas Nutrition Conference, Fayetteville, Arkansas, USA.
Bikker, P., 1994. Protein and lipid accretion in body components of growing pigs: effects of
body weight and nutrient intake. Ph.D. Thesis, Wageningen University, Wageningen,
The Netherlands.
Black, J. L., R. G. Campbell, I. H. Williams, K. J. James and G. T. Davies, 1986. Simulation
of energy and amino acid utilisation in the pig. Res. and Dev. Agric. 3:121-145.
Campbell, R. G. and M. R. Taverner, 1988. Genotype and sex effects on the relationship
between energy intake and protein deposition in growing pigs. J. Anim. Sci. 66:676-
686.
CVB, 2000. Veevoedertabel. Centraal Veevoederbureau, Lelystad, The Netherlands.
Emmert, J. L. and D. H. Baker, 1997. Use of the ideal protein concept for precision
formulation of amino acid levels in broiler diets. J. Appl. Poultry Res. 6:462-470.
Gerrits, W. J. J., G. H. Tolman, J. W. Schrama, S. Tamminga, M. W. Bosch and M. W. A.
Verstegen, 1996. Effect of protein and protein-free energy intake on protein and fat
deposition rates in preruminant calves of 80 to 240 kg live weight. J. Anim. Sci.
74:2129-2139.
Hancock, C. E., G. D. Bradford, G. C. Emmans and R. M. Gous, 1995. The evaluation of the
growth parameters of six strains of commercial broiler chickens. Br. Poult. Sci.
36:247-264.
Hourani, H., P. Williams, J. A. Morris, M. E. May and N. N. Abumrad, 1990. Effect of insulin-
induced hypoglycemia on protein metabolism in vivo. Am. J. Physiol. 259
(Endocrinol. Metab. 22): E342-E350.
Koops, W. J. and M. Grossman, 1993. Multiphasic allometry. Growth Dev. Aging 57:183-192.
Kyriazakis, I. and G. C. Emmans, 1992. The effects of varying protein and energy intakes on
the growth and body composition of pigs. 2. The effects of varying both energy and
protein intake. Br. J. Nutr. 68:615-625.
Millward, D. J., G. M. Price, P. J. H. Pacy and D. Halliday, 1990. Maintenance protein
requirements: The need for conceptual re-evaluation. Pages 473-487 in: Proceedings
of the Nutrition Society 49, CABI Publishing, New York, USA.

Chapter 1: Protein and lipid deposition rates
26
Moré, J. J., 1977. The Levenberg-Marquardt algorithm: implementation and theory in
numerical analysis. Pages 105-116 in: Lecture Notes in Mathematics 630. G. A.
Watson, ed. Springer-Verlag, Berlin, Germany.
Moughan, P. J. and M. W. A. Verstegen, 1988. The modelling of growth in the pig. Neth. J.
Agric. Sci. 36:145-166.
SPSS, 1999. SPSS Base 9.0 for Windows. User’s Guide. SPSS Inc., Chicago, IL, USA.
Susenbeth, A., 1995. Factors affecting lysine utilization in growing pigs: An analysis of
literature data. Livest. Prod. Sci. 43:193-204.
Susenbeth, A., T. Dickel, A. Diekenhorst and D. Hoehler, 1999. The effect of energy intake,
genotype and body weight on protein retention in pigs when dietary lysine is the
first-limiting factor. J. Anim. Sci. 77:2985-2989.
Whittemore, C. T. and R.H. Fawcett, 1976. Theoretical aspects of a flexible model to simulate
protein and lipid growth in pigs. Anim. Prod. 22:87-96.
Zoons, J., J. Buyse and E. Decuypere, 1991. Mathematical models in broiler raising. World’s
Poult. Sci. J. 47:243-255.

Chapter 2
Fat-Free Body Composition in Male Broiler Chickens:
Effects of Feed Intake Level and Dietary
Protein to Energy Ratio
Paper by: R. M. Eits, R. P. Kwakkel and M. W. A. Verstegen, 2002. J. Nutr.
132: 2222-2228. Reproduced with permission of the American Society for
Nutritional Sciences.
Chapter 2: Fat-free body composition
28
ABSTRACT The independence of fat-free body composition from
nutrition is assumed in most models that simulate animal growth. This
assumption has not been extensively investigated. In this study, firstly, the
allometric relationships of water and ash with protein were investigated in
growing broiler chickens. Secondly, it was tested if the amounts of water or
ash at a given protein weight were affected by nutritional factors. Two
experiments, each of a 2 x 9 factorial design, were conducted with male
broiler chickens of two body weight ranges (200-800 g (EXP1) and 800-
1600 g (EXP2)). The treatment factors were 2 levels of feed intake and 9
dietary protein to protein-free energy ratios (PE-ratio). Protein was
balanced for amino acid content.
The allometric relationships of water and ash with protein were different
for carcass and organs. The relationship between water and protein was
not affected by nutrition, except for a 7% reduction in water weight at a
fixed protein weight in the carcass in EXP1 at the lowest PE-ratio
compared to the highest PE-ratio (P < 0.001). The relationship between ash
and protein was strongly affected by nutrition. The lowest PE-ratio
increased ash weight at a fixed protein weight in the carcass by up to 28%,
compared to the highest PE-ratio (P < 0.001). It is concluded that, at least
for modern meat-type animals, nutrition can significantly affect fat-free
body composition at a certain fat-free body weight. The nutritional effects
on fat-free body composition could be incorporated into models of the
chemical body composition of growing animals.
Chapter 2: Fat-free body composition
29
INTRODUCTION
The prediction of the responses in growth rate and body composition at a
given nutrient intake is a central problem in nutritional science. Models
that simulate growth are a useful tool to address this problem as they can
be used to integrate knowledge on nutrition and body growth and
composition. The body tissues can be seen as being composed of protein,
fat, water and ash (minerals), ignoring thereby a small amount of
carbohydrates that will be present in the fed animal. In growth simulation
models, protein and fat deposition are usually predicted from dietary
energy and protein intakes. In most models, water and ash deposition are
then associated with protein deposition only (Emmans, 1981; Black et al.,
1986; Moughan et al., 1987). This implies that the relationships between
water and protein, and between ash and protein, are both considered as
independent of nutritional factors.
The relationships between water and protein, and ash and protein, in
growing animals, have been described for several species, e.g. fattening pigs
(Kotarbinska, 1969; cited by Moughan et al., 1987), layer pullets (Kwakkel et
al., 1997) and turkeys (Emmans, 1989). However, the relationships were
usually determined with animals growing according their potential growth
curve under the conditions of ad libitum access to balanced diets. Literature
is unclear whether, at restricted nutrient intakes, the relationships between
water or ash and protein are similar to ad libitum conditions. Results for pigs
(De Greef et al., 1992) suggest that the relationship between water and
protein is independent of feed intake level (FI-level) and of dietary protein to
energy ratio (PE-ratio). On the proposed strong relationship between ash and
protein, several studies report different results (Elsley et al, 1964; Kyriazakis
and Emmans, 1992). In some cases, the relationship between ash and
protein seems independent of nutritional regime. A low PE-ratio, however,
increased the ash to protein ratio in several pig studies (Zimmerman and
Khajarern, 1973; Kyriazakis et al., 1991). In the latter studies, the
development of skeletal muscles might have been limited more by a low PE-
ratio than the development of the skeleton. In that case, an effect of PE-ratio
on the ash to protein ratio would be expected particularly in the carcass,
more than in the organs. Information on possible nutritional effects on the
relationships between water, ash and protein in body components is not

Chapter 2: Fat-free body composition
30
clear. It has implications for growth simulation models, as mentioned before,
and for other subjects, such as meat quality (Berri, 2000).
The objectives of this study were (i) to investigate the allometric relationships
of water and ash with protein in growing broiler chickens and, (ii) to analyse
if these relationships are affected by nutritional factors. The second question
was answered by testing if water and ash contents at a certain protein weight
varied between dietary treatments. The hypothesis was that the amounts of
water and ash at a certain protein weight, both in carcass and organs, are
independent of both FI-level and PE-ratio. A second alternate hypothesis was
that the amount of ash at a certain protein weight would be increased by a
low PE-ratio, but only in the carcass and not in the organs.
MATERIALS AND METHODS
Experimental design
Detailed descriptions of the design of the experiments and of the dissection
procedures have been presented elsewhere (Chapter 1). They are
summarized here. Two experiments of similar design were performed with
in total 126 individual floor pen housed male broiler chickens (Ross 208,
Ross breeders, New Bridge, UK) in two body weight ranges: from 10-d-old
(about 200 g) until 800 g (EXP1) and from 800 g until 1600 g (EXP2). Day-
old chicks for both experiments were hatched on the same d and were
housed in the same room. Each broiler chicken was assigned to either
three (EXP1) or four (EXP2) blocks of 18 pens, according to a randomised
block design. Each block consisted of one replicate for each of the 18
treatments. At d 10, seven additional birds were slaughtered and dissected
as a reference for the body composition at the start of the experiment.
Both experiments consisted of 18 dietary treatments: two levels of feed intake
combined with nine ratios of protein to energy. Protein was balanced for
amino acid content. Feed intake levels were 1.7 and 2.1 times maintenance
requirement for energy; energy was defined on a protein-free basis (see
Chapter 1). Protein-free metabolisable energy was calculated from apparently
digestible crude fat (38.83 kJ per g) and apparently digestible carbohydrates
(17.32 kJ per g) (CVB, 2000). Metabolisable energy requirement for
maintenance was estimated as 450 kJ per kg metabolic body weight (kg 0.75)
(Zoons et al., 1991). Birds were fed twice per day. Protein-free energy intake

Chapter 2: Fat-free body composition
31
with the low and high feed intake level corresponded with, respectively, about
70% and 83% of the mean protein-free energy intake of ad libitum fed birds
in the same experiments (Chapter 1; results not presented here).
Protein to energy ratios were 0.80, 0.91, 1.03, 1.08, 1.14, 1.20, 1.26, 1.37
and 1.48 (EXP1) and 0.76, 0.87, 0.98, 1.03, 1.09, 1.14, 1.19, 1.30 and 1.41
(EXP2) g apparently digestible lysine per MJ protein-free energy. The middle
one of the nine ratios was assumed to be optimal for protein deposition, at
least on ad libitum intake. Starting from ideal protein (Baker et al., 1993), all
essential amino acids were supplied at levels of at least 115% of their
requirements, relative to lysine. Therefore, the first-limiting amino acid for
protein deposition was most likely always lysine. Broilers of EXP2 had ad
libitum access to the diet with 1.09 g digestible lysine per MJ protein-free
energy during the pre-treatment period (10-d-old until 800 g body weight).
Each of the experimental feeds was made by mixing two basal feeds (an
‘energy’ and ‘protein’ feed; 3 mm pellet; see Table 1 in Chapter 1) in different
ratios. An official Dutch committee on animal care and ethics approved the
experimental protocol.
Data collection
Birds were killed with an injection of 0.2 mL T61 (see Chapter 1), not bled
and stored at 2 °C for a maximum period of 7 d. At dissections, birds were
de-feathered and the metabolic and digestive organs were dissected from
the body. The gastrointestinal tract was stripped of its contents. The, so-
called, ‘organ’ fraction consisted of oesophagus, trachea, proventriculus,
gizzard, intestines, heart, liver, bile bladder, kidneys, lungs, spleen and
Bursa of Fabricius, together. The remaining body, including abdominal fat
pad, was defined as the ‘carcass’ fraction. In EXP2, 3 (out of 4) animals per
treatment group were dissected. The fourth animal was a spare one in case
of mortality. Carcass and organ fractions of each animal as well as the
experimental diets were analysed in duplicate for dry matter, lipid, ash and
nitrogen content, as described in Chapter 1. Protein content was
calculated as 6.25 x N. Protein weight in the carcass was calculated by
multiplying protein content in the carcass by the carcass weight. Protein
weight in organs and weights of ash and water were calculated similarly.

Chapter 2: Fat-free body composition
32
Curve fitting and statistical analysis
The procedures for analysing the relationship between water and protein
weight will be described below. For ash and protein, the same procedures
were adopted.
Firstly, the relationships between water and protein weight in the different
body parts (carcass, organs and carcass+organs) of growing broiler
chickens were described. The data used were from broilers of about 200,
800 (EXP1) and 1600 (EXP2) g body weight. The data were not ideal for the
purpose, as they were not equally distributed over the domain described.
Curve fitting was performed using the allometric model of Huxley (1932),
which describes the log-log linear relationship of two body components
[ln(W) = ln(a) + b x ln(P)], in which: ln = natural logarithm, W = water
weight (kg), a = scale parameter, b = allometric slope and P = protein
weight (kg).
Secondly, the effect of the dietary treatments on the amount of water at a
certain protein weight was tested. This was tested separately for 800 g
(EXP1) and 1600 g body weight (EXP2). Water weights as measured were
recalculated to the mean protein weight at 800 g and at 1600 g (corrected
water weights). Recalculation to a mean protein weight was necessary
because birds were killed at a similar body weight and not at a similar
protein weight. The details of the calculation are in the Appendix. The effect
of dietary treatments (FI-level and PE-ratio) on the corrected water weights in
the different body parts was analysed according to the following model:
( ) ( ) ijjijicorr EP
EPFIW εββµ +
−×+
−×++= 12.112.1 21 [1]
where: Wcorr = corrected water weight, µ = mean corrected water weight at
P/E = 1.12, FIi = fixed effect of FI-level i, β1 = effect of P/E-ratio, β2i =
interaction between P/E-ratio and FI-level i, (P/E)j = PE-ratio of animal j,
1.12 = mean P/E-ratio (g digestible lysine per MJ protein-free energy), εij =
error, i = 1, 2 and j = 1…27.
All statistical analyses were performed with linear (GLM; SPSS, 1999)
regression procedures. Significance was assigned at P < 0.05; tendencies
were assigned at 0.05 < P < 0.10.

Chapter 2: Fat-free body composition
33
RESULTS
Data of one bird in EXP1 and three birds in EXP2 were omitted from
analysis due to sickness.
Allometric relationships
Relationships for water and ash weight with protein weight are presented
in Figure 1. For each line in the graph, there are data of the three weight
groups, corresponding with (from the left to the right side of the graph) the
initial slaughter group, the animals of 800 g body weight, and the animals
of 1600 g body weight. On the log-log scale, both of the relationships
between water or ash and protein are essentially linear (Figure 1). Linearity
on log-log scales is a necessary feature of an allometric relationship.
TABLE 1. Parameter estimates and goodness of fit criteria for the allometric relation between
water and protein weight, or ash and protein weight in broiler chickens fed two levels of nine
diets with different balanced protein to protein-free energy ratios1
Parameter estimates1 Goodness of fit
ln(a) SE 2 b SE P 3 R2 4 DW 5
Water and Protein
Carcass 1.17 0.015 0.939 0.008 *** 0.992 2.05
Organs 1.55 0.041 1.018 0.011 # 0.987 1.75
Carcass + organs 1.22 0.013 0.945 0.007 *** 0.993 2.03
Ash and Protein
Carcass -1.87 0.048 0.969 0.024 NS 0.931 1.88
Organs -2.42 0.069 1.075 0.018 *** 0.967 1.92
Carcass + organs -1.90 0.044 0.998 0.024 NS 0.937 1.84
1 ln(y) = ln(a) + b * ln(x); where ln = natural logarithm, y = water or ash weight (kg), a = scale parameter,
b = allometric slope and x = protein weight (kg). N=115 for each allometric relationship.
2 SE = Standard error of estimate.
3 P = Probability for test if allometric slopes (=b) are different from unity; # 0.05 ≤ P ≤ 0.10; * P < 0.05; **
P < 0.01; *** P < 0.001; NS, P > 0.10.
4 R2 = Proportion of sum of squares explained by the model.
5 DW = Durbin Watson statistic: a value around 2 indicates no autocorrelation.

Chapter 2: Fat-free body composition
34
5 10 40
protein weight (g)
10
100
200w
ater
wei
ght
(g)
0.3
1
5
ash
wei
ght
(g)Organs
20 100 300
protein weight (g)
40
100
900
wat
er w
eig
ht
(g)
3
10
100 as
h w
eig
ht
(g)
WATER ASH
Carcass
FIGURE 1. Relationships (log scale) for water and ash weight with protein weight in carcass
and in organs of broiler chickens fed two levels of nine diets with different balanced protein to
protein-free energy ratios. Values represent individual birds that were slaughtered at about
200, 800 or 1600 g body weight; n=115 for each relationship. All relationships were significant
(P < 0.001). R2 values for water and ash respectively, were 0.99 and 0.93 in carcass and 0.99
and 0.97 organs.

Chapter 2: Fat-free body composition
35
TABLE 2. Water and ash weight in different body parts of broiler chickens of 800 or 1600 g
body weight with two feed intake levels (FI-level) of nine diets with different balanced protein
to protein-free energy ratios (PE-ratio)1
FI-level PE-ratio Inter-
action
Low2 High2 SEM3 P4 Low5 High5 SE 6 P 7 P 8
water weight (g)
Experiment 19
Carcass 406 403 15 NS 390 419 13 *** NS
Organs 79.7 80.4 2.7 NS 80.5 79.7 2.8 NS NS
Carcass+organs 486 484 16 NS 471 499 14 *** NS
Experiment 29
Carcass 792 796 28 NS 789 799 28 NS NS
Organs 139 138 5.6 NS 139 138 5.6 NS NS
Carcass+organs 931 933 30 NS 927 936 30 NS NS
ash weight (g)
Experiment 19
Carcass 19.1 17.9 2.3 # 19.6 17.3 2.3 * NS
Organs 1.22 1.20 .081 NS 1.24 1.17 .084 # NS
Carcass+organs 20.3 19.1 2.3 # 20.9 18.4 2.3 * NS
Experiment 29
Carcass 38.1 35.8 5.0 # 41.5 32.4 4.4 *** **
Organs 2.10 2.09 .097 NS 2.09 2.10 .099 NS *
Carcass+organs 40.2 37.9 5.0 NS 43.7 34.3 4.4 *** **
1 Water and ash weights corrected to mean protein weight (18.1 and 31.1 g in organs and 110.6 and
225.2 g in carcass, in Exp.1 and 2, respectively).
2 Low and high FI-level are 1.7 x M and 2.1 x M, respectively (M = energy for maintenance).
3 SEM = Pooled standard error of the mean, n=54.
4 Probability for test on difference in water or ash weights between high and low FI-level; # 0.05 ≤ P ≤
0.10; * P < 0.05; ** P < 0.01; *** P < 0.001; NS, P > 0.10.
5 Low and high PE-ratio represent least squares means for water or ash weight at lowest and highest
PE-ratio in each experiment.
6 SE = Standard error of the estimate (linear regression between water or ash weight with PE-ratio),
n=54.
7 Probability for test on (linear) relation of water or ash weight with PE-ratio; # 0.05 ≤ P ≤ 0.10; * P <
0.05; ** P < 0.01; *** P < 0.001; NS, P > 0.10.
8 Probability for test on interaction between FI-level and PE-ratio; # 0.05 ≤ P ≤ 0.10; * P < 0.05; ** P <
0.01; *** P < 0.001; NS, P > 0.10.
9 Experiment 1: birds slaughtered at about 800 g body weight; Experiment 2: birds slaughtered at
about 1600 g body weight.

Chapter 2: Fat-free body composition
36
Parameter estimates for the allometric relationships of water and ash with
protein are given in Table 1. Based on the goodness-of-fit criteria, the
allometric relationship gives accurate descriptions of water or ash weight
related to the total range of protein weights (Table 1).
For water versus protein in carcass+organs, the allometric slope was below
unity (.945; Table 1). This means that, with increasing protein weights, the
amount of water per unit of protein decreases continuously. In the carcass
fraction, the allometric slope (.939) was also below unity. In the organ
fraction, however, the allometric slope (1.018) was higher than unity. For
ash in the carcass+organs, the allometric slope was very close to unity and
not significantly different to it (P > 0.10). This implies that for this range of
protein weights, the ash to protein ratio in the body did not change
systematically with protein weights. This appears to be a consequence of
an increasing ash weight per unit protein in the organs (b=1.075)
combined with a decreasing (NS; P > 0.10) ash weight per unit protein in
carcass (b=.969) as protein weight increases (Table 1).
Nutritional influences
Effects of feed intake level (FI-level) and dietary protein to energy ratio (PE-
ratio) on water and ash weights at a given protein weight are given in Table
2. For all treatments, carcass weight accounted for about 86% of the
weight of the carcass+organs fraction. Effects in the carcass+organs
fraction thus mainly reflected effects found in the carcass fraction (Table
2).
Water weight at a given protein weight was unaffected by FI-level, both in
carcass and organs, in EXP1 and EXP2. Water weight at a given protein
weight was affected by PE-ratio, but only in the carcass in EXP1 (P <
0.001); at the lowest PE-ratio, water weight in the carcass was 390 g,
which was about 7% lower compared to the highest PE-ratio (419 g; Table
2). In EXP2, this difference was only about 1% (NS).
Ash weight at a given protein weight was affected by FI-level, but only in
the carcass (P < 0.10); at the low FI-level, ash weight at a given protein
weight in carcass was about 6% higher than at the high FI-level, in both
experiments (Table 2). Ash weight at a given protein weight was also
affected by PE-ratio (P < 0.05; Table 2). In the carcass, a lower PE-ratio
increased ash weight compared to a higher one; across the range the

Chapter 2: Fat-free body composition
37
difference was 13% in EXP1 and 28% in EXP2. In the organs, a low PE-
ratio increased the ash weight by 6%, but only in EXP1 (P < 0.10). This
latter effect was the only effect of the dietary treatments in the organs.
There were significant interactions between FI-level and PE-ratio with
regard to ash weights in EXP2 (Table 2), both in carcass and organs (P <
0.05). In carcass, the difference in ash weight between low and high FI-
levels was much larger at the lowest PE-ratio (44.9 vs. 37.0 g, respectively)
than at the highest PE-ratio (29.7 vs 30.8 g, respectively). The background
of the interaction in organs was that at the low FI-level, ash weight
increased (P < 0.01) with increasing PE-ratio, whereas at the high FI-level,
ash weight decreased (P > 0.10) with increasing PE-ratio.
DISCUSSION
The present study aimed to verify the theory that the water and ash
contents in the body of growing animals only depend on the protein
content in the body, irrespective the animals’ diet. Water and ash weights
in growing broiler chickens fed different diets in different quantities were
compared. In an attempt to make comparisons at the same protein weight,
broiler chickens were slaughtered at a fixed body weight. As a result, age
at slaughter weight varied between dietary treatments, particularly
between PE-ratios. Age at slaughter weight at the lowest and the highest
PE-ratio were, respectively, 33.9 (se 1.57) and 24.8 (se 0.73) d in EXP1 and
42.1 (se 1.47) and 34.7 (se 0.49) d in EXP2. Differences in age at a body
weight reveal variation in growth curve among the dietary treatments.
Even though all animals were slaughtered at a fixed body weight, protein
weights differed systematically between dietary treatments. These
differences in protein weight mainly reflected differences in fat weights
between dietary treatments. In order to prevent that these differences in
protein weight would interfere with the analysis for possible nutritional
effects on the water to protein ratio or the ash to protein ratio, water and
ash weights were re-calculated to a common (the mean) protein weight.
This re-calculation was based on the relationship between water and
protein, and ash and protein, within treatments. In this way, bias in the
subsequent analyses for differences between treatments was prevented.

Chapter 2: Fat-free body composition
38
Water weights
The relationship between water and protein in the body of animals, at least
at maturity, seems independent of genotype (Emmans, 1988; Wang et al.,
1999). Regarding the dependency of the relationship between water and
protein on nutritional strategy, literature evidence is lacking. Kyriazakis
and Emmans (1992) assumed that, under conditions that limit the growth
of an animal, the water to protein ratio in a given component is not
changed compared to that seen in normal growth. In other words, in the
case of limited growth, deposition rates of water and protein are assumed
to decrease in line with their inherent allometric relationship. For
nutritional limitations of growth, this assumption is supported by the
study of De Greef et al. (1992) with growing pigs, in which water weight at
a certain protein weight seemed not affected by differences in FI-level and
PE-ratio.
In our study, FI-level and PE-ratio did also not affect water weight at a
certain protein weight, except in the carcass at 800 g body weight. The
reduction in water weight in the carcass at 800 g body weight due to a low
PE-ratio suggests that the assumption of Kyriazakis and Emmans (1992),
mentioned above, may not be generally valid across genotypes or degrees of
maturity of the animal. The anatomical background of the reduction in
water weight in carcass could be a disproportional reduction of the growth
of different tissues in the carcass, with different water to protein ratios, for
example, a greater reduction in the growth of muscle protein compared to
collagen protein (Ashgar et al., 1986). Data of Gerrits et al. (1998) on the
amino acid composition of pre-ruminant calves also suggested that the
growth of muscle protein would be more inhibited by a low PE-ratio than
would that of collagen protein. This proposed explanation, however, does
not clarify why in older broilers, of 1600 g body weight, the effect of PE-
ratio on water weight in carcass was not present.
Ash weights
Both in carcass and organs, a low FI-level and a low PE-ratio reduced the
rate of protein deposition, by reducing the intake of lysine, the first limiting
nutrient (Chapter 1). In the carcass, the rate of protein deposition was
reduced more than the rate of ash deposition, resulting in an increased
ash weight at a given protein weight. In organs, however, a low FI-level and
a low PE-ratio caused, in most cases, a proportional reduction in rates of

Chapter 2: Fat-free body composition
39
protein and ash deposition, resulting in similar ash weights at the mean
protein weight. A possible explanation for this difference between carcass
and organs is that in the carcass, protein and ash are physically less
related than in the organs. In the carcass fraction, ash is mainly in
skeletal tissues and protein relatively more in non-skeletal tissues,
whereas in the organ fraction, ash and protein are distributed more
equally among the different tissues. Therefore, considerable effects in
carcass on ash weight at a given protein weight most likely reflect changes
in muscle to bone ratio. In apparent contrast with this idea on differences
between carcass and organs, PE-ratio tended (P < 0.10) to affect ash weight
at a given protein weight in organs also (at 800 g body weight; Table 2). It
seems unlikely that the relationship between ash and protein in a given
organ is affected by nutrition. Probably, the effect on ash weight at a given
protein weight in the organ fraction reflects a disproportional reduction of
the growth of different organs with different ash to protein ratios. For
example, with decreasing PE-ratio, the proportion of kidneys in the organ
fraction was significantly reduced in this study (data not shown).
Opposing views exist regarding nutritional effects on the relationship
between ash and protein in the body of the animal. A low PE-ratio
increased ash to protein ratio in piglets (Zimmerman and Khajarern, 1973;
Kyriazakis et al., 1991) and in preruminant calves (Gerrits et al., 1997),
whereas a low FI-level induced similar effects in growing broiler breeders
(Yu et al., 1992; Katanbaf et al., 1989). In contrast, the studies of Wilson
(1954a; 1954b) with domestic fowl, of Elsley et al. (1964) with pigs and
lambs and of Kwakkel (1994) with layer pullets, suggest that the relation
between ash and protein, or skeleton and lean body, is independent of
nutrition.
Discrepancies in results of these studies are probably related to differences
between studies regarding animal characteristics, nutritional treatments
and type of data analysis. For example, differences in genotype, length of
the experimental period and age at the beginning of this period may
explain the difference in results with the pigs. Zimmerman and Khajarern
(1973) and Kyriazakis et al. (1991) used relatively modern pig breeds,
whereas Elsley et al. (1964) used data of pigs from before 1940. Muscle to
bone ratio, or fat-free body composition, of well-fleshed modern breeds
might respond more pronouncedly to dietary PE-ratio than might that with
more traditional breeds. Besides, in the first two pig studies, pigs were
Chapter 2: Fat-free body composition
40
grown from about 5 kg to 12 or 23 kg body weight, whereas in the latter
study, pigs were grown from 5 to about 83 kg body weight. With a
relatively long experimental period, effects at young age might be partly
compensated at a latter age. With regard to the nutritional treatments,
whether an effect of FI-level or PE-ratio is found on ash weight at a certain
protein weight may depend on which nutrient is limiting the growth. For
example, if lysine intake is limiting protein deposition, as in our study, a
low FI-level and a low PE-ratio both reduce the intake of the limiting
nutrient, and may therefore cause similar effects on body composition. In
contrast, in a case energy is the limiting nutrient for protein deposition,
PE-ratio has less effect on the intake of the limiting nutrient than FI-level,
and therefore, effects of PE-ratio and FI-level on body composition may be
different. Finally, the kind of data analysis of Kwakkel (1994) differed from
most other studies mentioned. Kwakkel (1994) analysed the development
of body components during the experimental period, while most other
studies analysed body composition only at the end of the experimental
period. In the latter approach, it becomes more critical when exactly the
experiment is finished, more than with the approach of Kwakkel (1994).
Kwakkel (1994) suggested that discrepancies between his results and
those of Yu et al. (1992), regarding ash/protein (in)dependence, can be
explained by whether feathers are or are not included in the carcass
fraction. Our results, however, with defeathered carcasses also showed an
effect of nutrition on ash weight at the mean protein weight. Thus, they do
not sustain the suggestion of Kwakkel (1994).
We suggest that in studies on the relation between nutrition and fat-free
body composition, effects of genotype (e.g. fleshiness of the animal) and
nutrient composition (e.g. the limiting nutrient) should be considered
explicitly.
Growth simulation models
The assumption in several growth models, that water and ash deposition
are determined solely by protein deposition (Emmans, 1981; Black et al.,
1986; Moughan et al., 1987) is not sustained by this study. Particularly
with diets high or low in PE-ratio, considerable differences were found in
the weights of water and ash at a given protein weight compared to diets
with a more average nutrient composition. Simulating growth of chemical
body components based on protein deposition only does not consider these

Chapter 2: Fat-free body composition
41
effects. For simulation of body weight gain based on protein deposition
only, the effects on water weight are numerically of more importance than
the effects on ash weight. The effect (6%) on water weight at 800 g body
weight denotes an effect on body weight of 3 to 4%. For ash weight, even
the large effect (27%) of PE-ratio on ash weight in carcass+organs at a
body weight of 1600 g signifies an effect of less than 0.6% on body weight,
and less than 1.2% on body weight gain between 800 and 1600 g. Thus,
simulation of body weight gain or chemical body composition solely based
on protein deposition might be accurate in case of ad libitum access to
balanced diets, but can induce systematic errors in the simulations in case
of low FI-levels or extreme PE-ratios. As the values of other variables in
models, such as maintenance, heat loss, ad libitum food intake and
physical body composition, are often related to body weight, simulation
errors in body weight may have a wide impact on the accuracy of
predictions by such models (Emmans and Kyriazakis, 1995).
Conclusions
The allometric relationships of water and ash with protein differed between
carcass and organs. The relationship between water and protein was, in
most cases, not affected by nutrition, whereas the relationship between
ash and protein was strongly affected, particularly by PE-ratio. The
extreme PE-ratios caused differences in ash weight at a given protein
weight in the carcass by up to 28%. Results suggest that the muscle to
bone ratio in carcass is dependent of nutrition. It is concluded that, at
least for modern meat-type animals, nutritional strategy can have
significant effects on fat-free body composition at a certain fat-free body
weight, at least in the short term. The nutritional effects on fat-free body
composition could be incorporated into models of the chemical body
composition of growing animals.
ACKNOWLEDGMENTS
We would like to thank Karel de Greef and Jan Dirk van der Klis
(Wageningen-UR, The Netherlands), Gerry Emmans (SAC, Scotland) and
several Nutreco colleagues for their useful suggestions on this manuscript.
We thank Wiebe Koops and Mike Grossman (Wageningen-UR, The
Netherlands) for their advice regarding the data analysis. This research
was partially supported by the Dutch Ministry of Economic Affairs.

Chapter 2: Fat-free body composition
42
REFERENCES
Ashgar, A., J-I. Morita, K. Samejima and T. Yasui, 1986. Variations of proteins in myofibrils
and connective tissue of chicken red and white skeletal muscles influenced by
undernutrition. Agric. and Biochem. Chem. 50:1941-1949.
Baker, D. H., C.M. Parsons, S. Fernandez, S. Aoyagi and Y. Han, 1993. Digestible amino acid
requirements of broiler chicks based upon ideal protein considerations. Pages 22-32
in: Proceedings of the Arkansas Nutrition Conference, Fayetteville, Arkansas, USA.
Berri, C., 2000. Variability of sensory and processing qualities of poultry meat. World’s Poult.
Sci. J. 56:209-224.
Black, J. L., R. G. Campbell, I. H. Williams, K. J. James and G. T. Davies, 1986. Simulation
of energy and amino acid utilisation in the pig. Res. and Dev. in Agric. 3:121-145.
CVB, 2000. Veevoedertabel. Centraal Veevoederbureau, Lelystad, The Netherlands.
De Greef, K. H., M. W. A. Verstegen and B. Kemp, 1992. Validation of a porcine growth model
with emphasis on the composition of the body. Livest. Prod. Sci. 32:163-180.
Elsley, F. W. H., I. McDonald and V. R. Fowler, 1964. The effect of plane of nutrition on the
carcasses of pigs and lambs when variations in fat content are excluded. Anim.
Prod. 6:141-154.
Emmans, G. C., 1981. A model of the growth and feed intake of ad libitum fed animals,
particularly poultry. Pages 103-110 in: Computers in animal production. G. M.
Hillyer, C. T. Whittemore and R.G. Gunn, eds. Occasional publication no. 5, British
Society of Animal Production.
Emmans, G. C., 1988. Genetic components of potential and actual growth. Pages 153-181 in:
Animal breeding opportunities, Occasional publication no. 12, British Society of
Animal Production.
Emmans, G. C., 1989. The growth of turkeys. Pages 135-166 in: Recent advances in turkey
science. C. Nixey and T. C. Grey, eds. Butterworths, London, UK.
Emmans, G. C. and I. Kyriazakis, 1995. A general method for predicting the weight of water
in the empty bodies of pigs. Anim. Sci. 61:103-108.
Gerrits, W. J. J., J. Dijkstra and J. France, 1997. Description of a model integrating protein
and energy metabolism in preruminant calves. J. Nutr. 127:1229-1242.
Gerrits, W. J. J., J. W. Schrama and S. Tamminga, 1998. The marginal efficiency of
utilization of all ileal digestible indispensable amino acids for protein gain is lower
than 30% in preruminant calves between 80 and 240 kg live weight. J. Nutr.
128:1774-1785.
Huxley, J. S., 1932. Problems of relative growth. Methuen & co., London, UK.
Katanbaf, M. N., E. A. Dunnington and P. B. Siegel, 1989. Restricted feeding in early and late-
feathering chickens. 3. Organ size and carcass composition. Poult. Sci. 68:359-368.
Kotarbinska, M., 1969. Badania nad przemiana energii u Rosnacych swin. Wlasne no. 238.
Institure of Zootechnology, Krakow, Wydawn.
Kwakkel, R. P., 1994. Multiphasic growth in the layer pullet. Effects of nutrient restrictions
during rearing. Ph.D. Thesis, Wageningen University, Wageningen, The Netherlands.
Kwakkel, R. P., M. W. A. Verstegen and B. J. Ducro, 1997. Diphasic allometric growth of body
components in white leghorn pullets fed ad libitum and restricted diets. Poult. Sci.
76:1020-1028.

Chapter 2: Fat-free body composition
43
Kyriazakis, I. and G. C. Emmans, 1992. The growth of mammals following a period of
nutritional limitation. J. Theor. Biol. 156:485-498.
Kyriazakis, I., C. Stamataris, G. C. Emmans and C. T. Whittemore, 1991. The effects of food
protein content on the performance of pigs previously given foods with low or
moderate protein contents. Anim. Prod. 52:165-173.
Moughan, P. J., W. C. Smith and G. Pearson, 1987. Description and validation of a model
simulating growth in the pig (20-90 kg liveweight). New Zeal. J. Agr. Res. 30:481-
489.
SPSS, 1999. SPSS Base 9.0 for Windows. User’s Guide. SPSS Inc., Chicago, IL, USA.
Wang, Z. M., P. Deurenberg, W. Wang, A. Pietrobelli, R. N. Baumgartner and S. B.
Heymsfield, 1999. Hydration of fat-free body mass: review and critique of a classic
body-composition constant. Am. J. of Clin. Nutr. 69:833-841.
Wilson, P. N., 1954a. Growth analysis of the domestic fowl II. Effect of plane of nutrition on
carcass composition. J. Agric. Sci. 44:67-85.
Wilson, P. N., 1954b. Growth analysis of the domestic fowl II. Effect of plane of nutrition on
carcass composition of cockerels and egg yields of pullets. J. Agric. Sci. 45:110-124.
Yu, M. W., F. E. Robinson and A. R. Robblee, 1992. Effect of feed allowance during rearing
and breeding on female broiler breeders. 1. Growth and carcass characteristics.
Poult. Sci. 71:1739-1749.
Zimmerman, D. R. and S. Khajarern, 1973. Starter protein nutrition and compensatory
responses in swine. J. Anim. Sci. 36:189-194.
Zoons, J., J. Buyse and E. Decuypere, 1991. Mathematical models in broiler raising. World’s
Poult. Sci. J. 47:243-255.

Chapter 2: Fat-free body composition
44
APPENDIX
Water weights as measured were corrected to the mean protein weight at
800 g (EXP1) and 1600 g body weight (EXP2). This was done by means of a
linear model (equation [i]), assuming a linear relationship between water
and protein weight for the small range of protein weights within EXP1 and
EXP2. Corrected water weights in carcass and organs of the individual
animals were calculated according to:
( )PPcWWcorr −×−= [i]
where: Wcorr = corrected water weight, W = measured individual water
weight, c = correction factor, P = measured individual protein weight and P = mean experimental protein weight. The values used for P and c (four
values each: for carcass and organs in EXP1 and EXP2) are presented
below. Values for P were 18.1 and 31.1 g in organs and 110.6 and 225.2 g
in carcass, in EXP1 and EXP2, respectively. Values for parameter c, which
is the regression coefficient between W and P at 800 (EXP1) or 1600 g body
weight (EXP2), could not be estimated over the different dietary treatments,
because values of P were systematically different for the dietary
treatments. Therefore, values for parameter c in equation [2] were
estimated based on the relation between W and P within dietary
treatments, using the following regression equation:
( ) ( )iijiij PPcWW −×=− [ii]
where: c = correction factor, Wij = water weight of animal j at dietary
treatment i, W = mean water weight at dietary treatment i, Pij = protein
weight of animal j at dietary treatment i and P = mean protein weight at
dietary treatment i, i = 1..18 and j = 1,2,3. For the correction of water
weights, estimated values for c were 3.84 and 2.91 in organs and 1.21 and
1.21 in carcass, in EXP1 and EXP2, respectively. For the correction of ash
weights, estimated values for c were 0.061 and 0.060 in organs and 0.116
and –0.141 in carcass, in EXP1 and EXP2, respectively. Corrected water
weights (Wcorr) in carcass+organs were calculated for the individual animal
as the sum of Wcorr in carcass and Wcorr in organs. For the correction of ash
weight, the same procedures were adopted as for the correction of water
weight.

Chapter 3
Dietary Balanced Protein in Broiler Chickens: Effects of
Early Life Protein Nutrition on Later Responses
Paper by: R. M. Eits, R. P. Kwakkel, M. W. A. Verstegen and C. G.
Emmans, 2003. Br. Poult. Sci. 44:398-409. Reproduced with permission of
Taylor and Francis.

Chapter 3: Carry-over effects in protein nutrition
46
ABSTRACT A study was conducted with modern broiler chicks to test the
effects of early life protein nutrition and sex on responses in growth and
body composition to dietary protein at later age. Effects on the incidence of
metabolic disorders were also evaluated. From 11 to 26 d of age (EXP1),
birds were given 8 diets varying in balanced protein to energy ratio (BPE
ratio) between 0.575 and 1.100 g digestible lysine per MJ AMEn. Birds
from two treatment groups in EXP1 (BPE ratio of 0.725 and 1.025 g/MJ,
respectively) were subsequently used in a test from 26 to 41 d of age
(EXP2). In EXP2, 8 diets were fed varying in BPE ratio between 0.500 and
1.025 g/MJ.
Responses in weight gain and feed conversion to BPE ratio in EXP2
changed considerably when BPE ratio in EXP1 was modified, irrespective
of sex. Up to 10% improvement in both weight gain and feed conversion in
EXP2 was observed if BPE ratio in EXP1 was 0.725 compared with 1.025
g/MJ. With males, however, the effect of treatment in EXP1 on weight
gain in EXP2 was present only at high BPE ratios. For the relative gain of
breast meat and abdominal fat, but not for carcass, the responses of male
broilers to BPE ratio in EXP2 were altered by the BPE ratio in EXP1. With
females, responses in composition of the gain to diet in EXP2 were
independent of BPE ratio in EXP1. The incidence of metabolic disorders
was low, irrespective of treatment in EXP1. The lower BPE ratio in EXP1
increased mortality in EXP2 from 0.8 to 3.6%.
Our findings show that broiler responses to dietary protein depend on
previous protein nutrition and sex. Effects of early life protein nutrition on
incidence of metabolic disorders were not observed. The results strongly
suggest that protein levels in grower and finisher diets should not be
optimised independently, but simultaneously.

Chapter 3: Carry-over effects in protein nutrition
47
INTRODUCTION
Determining which protein level is optimal in broiler diets, either for
maximising broiler performance or profit, requires knowledge on how
broiler performance and carcass quality are related to dietary protein level.
Such knowledge can be obtained from experiments in which different
doses of dietary protein are supplied over a given age period (for example,
Clark et al., 1982; Smith et al., 1998). Where the data come from a later
age period any effects of the protein level in the diet used previously are
usually, but not always (Pesti and Fletcher, 1984), ignored. The question
raised here is to what extent dietary history affects the responses to dietary
protein levels.
The dietary history may be particularly relevant when low protein diets are
fed during the early grower phase. Recent work on ascites in broiler
chickens showed that such a feeding strategy may improve the resistance
of broilers to metabolic disorders at later ages (Scheele et al., 1999).
Broilers given a low protein diet at early ages have been shown to
compensate in gain during the re-alimentation period (Moran, 1979; Pesti
and Fletcher, 1984). The capacity for growth compensation is probably
higher for males than for females (Plavnik and Hurwitz, 1988) and may be
less with fast growing strains than with slower growing strains (Cherry et
al., 1978). However, literature on compensatory responses with modern
broiler breeds is scarce or even not available. Subsequent feed efficiency
may be improved after an early protein restriction (Moran, 1979; Pesti and
Fletcher, 1984). This is most likely due to a lower fat content in the gain
(Gous et al., 1992). In addition, the growth curve becomes more convex
and thus, in theory, maintenance requirements will be reduced (Zubair
and Leeson, 1996). Total protein intake to reach a certain body weight may
be reduced in such a feeding strategy, as was found with turkeys by
Auckland and Morris (1971). Obviously, such a protein sparing effect has
concomitant advantages for production costs and environmental nitrogen
pollution.
In broilers, the optimal nutrient levels during the re-alimentation period
are not well-known (Zubair and Leeson, 1996). Model calculations (Plavnik
and Hurwitz, 1989) as well as some experimental data (Auckland and
Morris, 1971; Plavnik and Hurwitz, 1989) suggest that a protein level
higher than those conventionally used may be needed.
Chapter 3: Carry-over effects in protein nutrition
48
It can be hypothesised that, if a low protein level is used in the early
grower phase, the performance level in the later grower phase will be
increased. In addition, it is likely that any nutritional carry-over effects
would depend on the sex of the birds, and that modern fast and efficient
growing breeds do have limited ability to show compensatory growth. It is
also hypothesised that broiler chickens will require relatively high protein
levels in the later grower phase to enable compensatory response to be
seen.
The objective of the present study was to test for modern broilers if, during
the later grower phase, the responses in growth and body composition to
the ratio of balanced protein to energy in the diet, depend on the value of
that ratio in the diet fed during the early grower phase. Balanced protein
indicates that dietary protein was balanced for amino acid levels. The
incidence of metabolic disorders was also measured to find out whether
feeding strategy affects the incidence of such health problems.
MATERIALS AND METHODS
From 11 to 26 d of age (EXP1), birds were fed eight diets varying in
balanced protein to energy ratio (BPE ratio; g digestible lysine per MJ
AMEn). Birds from two treatment groups in EXP1 (BPE ratio of 0.725 and
1.025 g/MJ, respectively) were subsequently used during the succeeding
test period (26 to 41 d of age; EXP2) where they were fed eight different
BPE ratios. Any difference in response in EXP2 between the two groups
with a different diet in EXP1 would indicate that early life protein nutrition
affects broiler responses to dietary BPE ratio at later age. The other six
treatment groups in EXP1, apart from the treatment groups with a BPE
ratio of 0.725 and 1.025 g/MJ, respectively, were used to evaluate in EXP1
the degree of deficiency or excess in protein supply with the latter two
groups.
Sexes were penned separately. In EXP1, a total of 1632 11-d-old Hybro-G
broiler chickens (Hybro B.V., Boxmeer, the Netherlands), 816 of each sex,
were allocated to a room with 96 floor pens with 17 birds per pen. For each
treatment, there were 3 replicate pens per sex; 48 pens in total. For each of
the BPE ratios 0.725 and 1.025 g/MJ there were an additional 12 replicate
pens per sex giving an extra 48 pens in total. The high number of pens for
these two BPE ratios was needed, because the birds in these pens were to
be used in EXP2.

Chapter 3: Carry-over effects in protein nutrition
49
In EXP2, a total of 960 birds, 480 of each sex, were allocated to 96 pens
with 10 birds per pen. The 960 birds for EXP2 were randomly selected
from two treatments groups in EXP1 (BPE ratios of 0.725 and 1.025 g/MJ,
respectively), 480 birds from each group. For each of the 16 treatment
groups in EXP2 (8 BPE ratios with each of the 2 groups with a different
BPE ratio in the preceding period (EXP1)), there were 3 replicate pens per
sex.
Birds had free access to feed and water. Room temperature was gradually
decreased from 34°C at 0 d of age to 25°C at 17 d. It was then decreased
further to 20°C at 41 d. The chickens were vaccinated for Newcastle
disease at 0 and 19 d of age and for Gumboro at 14 d of age. Lighting
regime was 23 h light per day. Each pen was 1.00 m by 0.80 m and the
floor was covered with wood shavings.
Dietary treatments
The calculated balanced protein to energy ratios (BPE ratios) tested in
EXP1 were 0.575, 0.650, 0.725, 0.800, 0.875, 0.950, 1.025 and 1.100
g/MJ, expressed as g apparent faecal digestible lysine per MJ AMEn. In
EXP2, the values of that ratio were 0.500, 0.575, 0.650, 0.725, 0.800,
0.875, 0.950 and 1.025 g/MJ. Digestible lysine was kept constant at 4.8%
of the crude protein. Contents of all other essential amino acids, relative to
lysine, were in accordance with the composition of ideal protein (as
proposed by Baker and Han (1994)) or higher. Dietary energy was
calculated as AMEn for broilers (CVB, 2000). Two basal diets were made
(Table 1) that differed in protein and amino acid content. Each of the
experimental diets was obtained by mixing the two basal diets in a certain
ratio. The two basal diets were analysed for dry matter, lipid, ash, nitrogen,
and total amounts of several minerals (Ca, P, Na, K and Cl), according to
the standards ISO 6496 (1983), 6492 (1985), 5984 (1978) and 5983 (1979),
respectively, from the International Organisation for Standardisation
(Geneva, Switzerland). Crude protein in these samples was calculated as N
x 6.25. In addition, total amino acid concentrations in the basal diets were
analysed according to Llames and Fontaine (1994). All nutrient analyses
agreed well with the calculated values. From 0 to 11 d of age, all birds
received a commercial starter diet (11.5 MJ AMEn-broilers, 210 g/kg crude
protein, 10.5 g/kg digestible lysine).

Chapter 3: Carry-over effects in protein nutrition
50
Table 1. Composition of the basal diets (g/kg)
Ingredients
High
protein
diet
Low
protein
diet
Nutrients,
calculated
High
protein
diet
Low
protein
diet
Wheat 388.4 333.7 AMEn (MJ/kg) 2 12.0 12.9
Corn gluten (600 g/kg CP) 78.7 - Dry matter 891 891
Wheat bran 95.6 137.4 Crude protein 271 133
Soybean meal (490 g/kg CP) 199.2 57.8 Crude fat 102 136
Sunflower meal (340 g/kg CP) 38.8 10.0 Crude fibre 35 35
Potato protein 12.9 3.0 Ash 51 56
Peas - 130.5 Calcium 7.7 7.8
Tapioca - 149.4 Phosphorus 7.4 6.6
Fish meal 29.9 6.0 Phosphorus av.2 3.9 3.9
Meat meal (570 g/kg CP) 51.8 14.9 Sodium 1.7 1.6
Animal fat 28.9 48.8 Potassium 9.1 7.1
Soya oil 47.8 70.7 Chloride 2.1 2.1
Sodium bicarbonate 2.8 2.4
Limestone 7.6 10.5 BPE ratio 3 1.10 0.50
Monocalcium phosphate 3.3 11.5 Lysine 4 13.2 6.4
Sodium chloride - 1.7 Methionine 4 6.4 3.0
DL-Methionine 1.9 1.3 Met + Cys 4 9.9 4.8
Lysine 2.7 1.1 Threonine 4 9.3 4.5
Threonine 0.6 0.7 Tryptophan 4 2.5 1.2
Biofeed mix (60 g/kg) 4.0 4.0 Arginine 4 13.9 7.6
Vitamin / mineral premix 1 4.0 4.0 Valine 4 10.9 4.9
Choline (500 g/kg) 0.9 1.0 Isoleucine 4 9.8 4.3
Histidine 4 5.4 2.6
Leucine 4 21.1 7.7
1 Contributed (in mg per kg of diet): 22 Cu as CuSO4, 15 Fe as FeSO4, 19 Zn as ZnSO4, 71 Mn as MnO,
0.8 Co as CoSO4; 0.6 I as KI, 0.20 Se as Na2SeO3, 4.13 retinyl acetate, 0.063 cholicalciferol, 1.2
thiamine, 5.6 riboflavine, 38 nicotinic acid, 11 d-pantothenic acid, 3.0 pyridoxine, 0.061 d-biotin, 1.0
folic acid, 0.012 mg cyanocobalamin, 30 dl-α-tocopheryl acetate, 2.1 menadione, 70 salinomycine, 10
avilamycine.
2 For broiler chickens (CVB, 2000).
3 Balanced protein to energy ratio (g digestible lysine per MJ AMEn).
4 Apparent faecal digestible for broiler chickens (CVB, 2000).
Dissection procedures and calculations
Broiler weights at 11, 26 and 41 d, and feed intakes during the 11 to 26
and 26 to 41 d periods were recorded per pen. Feed conversion ratios were
calculated for the respective periods. At 26 and 41 d of age, two birds per

Chapter 3: Carry-over effects in protein nutrition
51
pen were randomly selected for dissection and killed by CO2-anaesthetic,
according to approved ethical standards. For BPE ratios 0.725 and 1.025
g/MJ at d 26, 6 pens per treatment were randomly selected for dissection,
instead of 3 pens per treatment in all other cases. Body weights and
weights of carcass, breast meat (without skin) and abdominal fat pad were
measured. The abdominal fat pad included the fat surrounding the gizzard
and was used as an indicator of total body fat. Carcass weight was defined
as the weight of the whole body, without skin, skin fat, feathers, head and
organs (digestive organs, heart and lungs). In addition, the distal parts of
the wings and legs were also removed, as is common practice in
commercial slaughterhouses. In order to have the gastro-intestinal tract of
the birds almost empty at dissection the lights were switched off during the
8 h before slaughter and dissection.
Four variables were used to measure the incidence or degree of (sub-)
clinical metabolic disorders. They were measured for each dissected animal
at 41 d. The variables measured were arterial pressure index (API) and
scores for heart fibrinogen, pericardial moisture and liver cirrhosis. API is
the ratio of the weight of the right heart ventricle wall to that of both
ventricles and the septum (Huchzermeyer and De Ruyck, 1986). The other
three measures were scored by the same experienced person for all birds
on a 4-point scale, where 0 = normal and 3 = very abnormal.
Breast meat yield was calculated by dividing breast meat weight by carcass
weight. Yields of carcass and abdominal fat pad were calculated by dividing
the weights of carcass and abdominal fat pad by body weight. Estimates of
body composition per pen were calculated as the average of the yields of
the dissected animals in that pen. Similarly, the measures of metabolic
disorders were averaged per pen before data analysis. Feed intake data
were corrected for the estimated intakes of the animals that died, on the
basis of their body weights.
Statistical analysis
Responses to dietary BPE ratio are described by the following exponential
model (Lehmann et al., 1996):
( ) ( ))575.0*(1* −−−−+= XceakaY [1]
where: Y = broiler performance variable; a = intercept (that is,
performance on the diet with BPE ratio = 0.575 g/MJ); k = maximum
response (asymptote); c = curvature steepness; 0.575 = lowest BPE ratio

Chapter 3: Carry-over effects in protein nutrition
52
that EXP1 and EXP2 had in common; X = IPE ratio (g digestible lysine per
MJ AMEn). When the exponential model did not converge, a simple linear
model (Y = a + k * (X-0.575); where k = slope and Y, a and X have the same
meaning as in model [1]) was applied.
Carry-over effects of the BPE ratio in EXP1 on the responses to BPE ratio
in EXP2 were tested. This was done by testing whether a separate dose-
response curve for the two groups with different BPE ratio in EXP1 (model
[2]) would give a significantly better fit than only one dose-response curve
(model [1]) for these two groups together. Model [2] was:
( ) ( )( ) ( )]1*[*
]1*[*)575.0*(2
2222
)575.0*(11111
−−
−−
−−+
+−−+=Xc
Xc
eakas
eakasY [2]
where: s1 and s2 are dummy variables. For the higher BPE ratio in EXP1 s1
is 1 and s2 is 0. For the lower BPE ratio in EXP1 s1 is 0 and s2 is 1. The
parameters a1 and a2, k1 and k2, and c1 and c2 correspond to the groups
fed the diets with the high and low BPE ratio in EXP1, respectively. These
variables have similar meanings as in model [1]. The significance of the
difference between model [1] and model [2] was assessed by an F-test. The
difference in the sum of squares of the residuals of model [1] and [2],
divided by the difference in degrees of freedom of the residuals, was tested
against the residual mean square of model [2].
Effects of sex, BPE ratio in EXP1 and BPE ratio in EXP2 on health
parameters and mortality were evaluated by analysis of variance. The
discontinuous score data on heart fibrinogen, pericardial moisture and
liver cirrhosis were first translated to a parameter with a normal
distribution. Each score value was replaced by a x-value form the standard
normal distribution, depending on the total percentage of animals with
that score. This was based on the assumption that the scored
characteristics have an underlying continuity with a threshold, which
imposes a discontinuity on the visible expression of the character which
was scored (Falconer, 1960). Arcsine transformation was applied to the
mortality data to normalise the data. Pen was the experimental unit for all
analyses except for the regressions. Regression models were fitted to the
treatment averages of the experimental data. Non-linear (Levenberg-
Marquardt algorithm; Moré, 1977) and linear (GLM; SPSS, 1999) regression
procedures were used to analyse the data.

Chapter 3: Carry-over effects in protein nutrition
53
RESULTS
Dose-related responses in EXP1
Broilers in EXP1 (11 to 26 d) clearly responded to increasing dietary
balanced protein to energy ratios (Figure 1). All performance
characteristics, except breast meat yield, showed a dose-response effect
from the lowest up to the highest BPE ratio in the test. Breast meat yield
showed little or no improvement when BPE ratio was increased above
0.725 g/MJ. Parameter estimates for the exponential model fitting the
responses in broiler performance in EXP1 are given in Table 2.
Two treatment groups from EXP1 (with BPE ratios of 0.725 and 1.025
g/MJ, respectively) were used to test the carry-over effect of early life
protein nutrition on broiler responses in EXP2. Broilers fed the lower
instead of the higher BPE ratio (0.725 instead of 1.025 g/MJ) had lower
body weights and carcass yields, and contained relatively more abdominal
fat at the beginning of EXP2 (Table 3). With males, the effect of BPE ratio
on the relative abdominal fat pad weight was not significant (P > 0.10).
Breast meat yield was similar for the two treatment groups. In both sexes,
feed conversion ratio was 12 to 15 points higher with the lower instead of
the higher BPE ratio in EXP1 (Table 3). Based on the estimated asymptotes
in performance in EXP1 (Table 2), final body weight, feed conversion ratio,
and carcass and breast meat yield at the higher BPE ratio in EXP1 (1.025
g/MJ) deviated less than 5% from the estimated maximum or minimum.
Relative weight of abdominal fat pad in these broilers, however, was 15%
(males) to 26% (females) higher than the estimated minimum.
Dose-related responses in EXP2
As in EXP1, the broilers in EXP2 responded markedly to increasing BPE
ratios in the diet (Figures 2 and 3). Male broilers that had been given the
high protein diet in EXP1 did not show any response in breast meat yield
with increasing BPE ratio in EXP2 and did not increase body weight gain
at BPE ratios above 0.575 g/MJ (Figure 2).
Parameter estimates for the exponential responses (model [2] only) in EXP2
and the related R2 values, are given in Table 4. The probability values of
the dose-related responses in EXP2 depending on the diet that was fed in
EXP1 are also given.

Table
2.
Pa
ram
ete
r esti
ma
tes (S
E b
etw
een
bra
ckets
) fo
r th
e e
xpon
en
tia
l1 r
espon
ses o
f bro
iler
ch
icken
s t
o d
ieta
ry B
PE
-ra
tio
2 in
EX
P1
(1
1-2
6 d
of
age)
M
ale
s
F
em
ale
s
a
k
c
R
2
a
k
c
R2
Fin
al body w
eig
ht
(B
W;
g)
1151 (11)
1372 (53)
2.6
2 (1.2
)
.97
1018 (14)
1190 (61)
2.6
9 (1.8
) .9
3
Body w
eig
ht
gain
(g
/d)
55.8
(.6
0)
69.0
(2.0
) 3.2
0 (.9
7)
.9
8
48.4
(.7
7)
60.6
(4.2
) 2.4
5 (1.5
) .9
5
Feed c
on
vers
ion
1.7
57 (.0
09)
1.3
57 (.0
15)
4.7
6 (.4
7)
.9
9
1.7
25 (.0
07)
1.4
16 (.0
11)
4.8
0 (.4
7)
.99
Carc
ass y
ield
(g
/g B
W)
.535 3
(.0
04)
.042 3
(.0
11)
-
.70
.5
13 (.0
05)
.561 (.0
09)
4.6
1 (2.2
) .9
1
Bre
ast
meat
yie
ld
(g/g c
arc
ass)
.262 (.0
08)
.284 (.0
05)
12.0
(13)
.5
3
.2
64 (.0
07)
.291 (.0
08)
5.9
0 (5.7
) .6
6
Abdom
inal fa
t pad (g/g B
W)
.043 (.0
03)
.024 (.0
04)
5.4
(3.3
)
.84
.0
40 (.0
02)
.019 (.0
09)
2.7
7 (2.1
) .9
0
1
Y =
a +
(k-a
) *
(1-e
–c *
(x – 0.5
75) ) [
model
1;
see t
ext]
; w
here
: y =
bro
iler
perf
orm
an
ce v
ari
able
; a =
in
terc
ept
(i.e
. perf
orm
an
ce o
n t
he d
iet
wit
h B
PE
-rati
o=0.5
75
g/M
J); k
= m
axim
um
respon
se (asym
pto
te); c
= c
urv
atu
re s
teepn
ess;
0.5
75 =
low
est
BPE
-rati
o t
hat
was t
este
d in
both
EX
P1 a
nd E
XP2 (26-4
1 d
of age); x
= I
PE
rati
o (g d
igesti
ble
lysin
e p
er
MJ A
ME
n).
2
Bala
nced p
rote
in t
o e
nerg
y r
ati
o (g d
igesti
ble
lysin
e p
er
MJ A
ME
n).
3
If t
he ite
rati
ve a
lgori
thm
th
at
was u
sed t
o e
sti
mate
th
e p
ara
mete
rs o
f th
e e
xpon
en
tial m
odel fa
iled t
o c
on
verg
e,
a s
imple
lin
ear
model w
as u
sed in
ste
ad
[y= a
+
k*(
x-0
.575)]; w
here
k =
slo
pe a
nd y
, a a
nd x
have t
he s
am
e m
ean
ing a
s in
th
e e
xpon
en
tial m
odel.

Table
3.
Perf
orm
an
ce o
f bro
iler
ch
icken
s a
t 2
6 d
of
age f
ed
a low
or
hig
h d
ieta
ry B
PE
-ra
tio 1
in
EX
P1
(1
1-2
6 d
of
age)
M
ale
s
F
em
ale
s
H
igh
BPE
-
rati
o
Low
BPE
-
rati
o
SE
M2
P 3
Hig
h B
PE
-
rati
o
Low
BPE
-
rati
o
SE
M2
P 3
Fin
al body w
eig
ht
(B
W;
g)
1296
1238
6.1
.0
01
1148
1087
7.0
.0
06
Feed c
on
vers
ion
(11-2
6 d
) 1.4
0
1.5
5
.005
< .
001
1.4
4
1.5
6
.005
< .
001
Carc
ass (g)
729
664
8.9
.0
01
630
578
9.8
.0
05
Carc
ass y
ield
(g
/g B
W)
.562
.534
.005
.004
.5
52
.539
.004
.075
Bre
ast
meat
(g)
210
184
4.3
.0
02
183
161
5.4
.0
16
Bre
ast
meat
yie
ld
(g/g c
arc
ass)
.287
.278
.005
NS
.291
0.2
78
.005
NS
Abdom
inal fa
t pad (g)
35.6
40.4
2.7
N
S
27.3
32.5
1.8
.0
78
Abdom
inal fa
t pad (g/g B
W)
.028
.033
.002
NS
.024
.030
.002
.026
1B
ala
nced p
rote
in t
o e
nerg
y r
ati
o (g d
igesti
ble
lysin
e p
er
MJ A
ME
n-b
roilers
).
2Poole
d s
tan
dard
err
or
of
the m
ean
; n
=6 p
er
treatm
en
t, e
xcept
for
BW
an
d f
eed c
on
vers
ion
rati
o:
n=15 p
er
treatm
en
t.
3P v
alu
e o
f diffe
ren
ce b
etw
een
hig
h a
nd low
BPE
-rati
o; N
S:
P >
0.1
0.
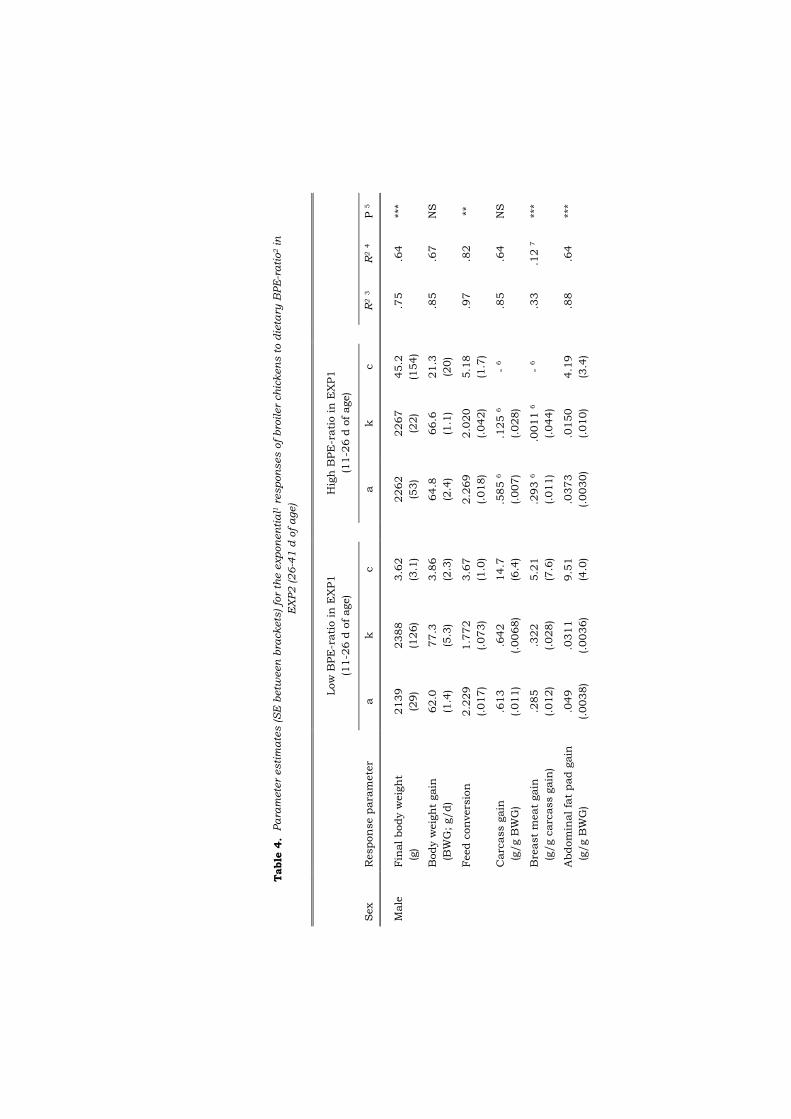
Table
4.
Pa
ram
ete
r esti
ma
tes (S
E b
etw
een
bra
ckets
) fo
r th
e e
xpon
en
tia
l1 r
espon
ses o
f bro
iler
ch
icken
s t
o d
ieta
ry B
PE
-ra
tio
2 in
EX
P2
(2
6-4
1 d
of
age)
Low
BPE
-rati
o in
EX
P1
(11-2
6 d
of
age)
H
igh
BPE
-rati
o in
EX
P1
(11-2
6 d
of
age)
Sex
Respon
se p
ara
mete
r a
k
c
a
k
c
R
2 3
R2
4
P 5
Male
F
inal body w
eig
ht
(g
)
2139
(29)
2388
(126)
3.6
2
(3.1
)
2262
(53)
2267
(22)
45.2
(154)
.7
5
.64
***
B
ody w
eig
ht
gain
(B
WG
; g/d)
62.0
(1.4
)
77.3
(5.3
)
3.8
6
(2.3
)
64.8
(2.4
)
66.6
(1.1
)
21.3
(20)
.8
5
.67
NS
F
eed c
on
vers
ion
2.2
29
(.017)
1.7
72
(.073)
3.6
7
(1.0
)
2.2
69
(.018)
2.0
20
(.042)
5.1
8
(1.7
)
.9
7
.82
**
C
arc
ass g
ain
(g
/g B
WG
)
.613
(.011)
.642
(.0068)
14.7
(6.4
)
.5
85 6
(.007)
.125 6
(.028)
- 6
.8
5
.64
NS
B
reast
meat
gain
(g
/g c
arc
ass g
ain
)
.285
(.012)
.322
(.028)
5.2
1
(7.6
)
.2
93 6
(.011)
.0011 6
(.044)
- 6
.3
3
.12 7
**
*
A
bdom
inal fa
t pad g
ain
(g
/g B
WG
)
.049
(.0038)
.0311
(.0036)
9.5
1
(4.0
)
.0
373
(.0030)
.0150
(.010)
4.1
9
(3.4
)
.8
8
.64
***

Fem
ale
F
inal body w
eig
ht
(g
)
1870
(15)
1948
(22)
6.8
9
(4.0
)
1892
(13)
2197
(744)
0.9
6
(2.8
)
.8
4
.70
***
B
ody w
eig
ht
gain
(B
WG
; g/d)
53.4
(.46)
60.1
(1.2
)
4.7
7
(1.7
)
51.7
6
(.43)
14.2
6
(1.7
)
- 6
.9
4
.79
*
F
eed c
on
vers
ion
2.1
83
(.030)
2.0
30
(.027)
9.7
5
(3.6
)
2.3
39
(.024)
2.1
03
(.063)
4.8
3
(2.4
)
.9
3
.65
***
C
arc
ass g
ain
(g
/g B
WG
)
.577
(.0091)
.636
(.019)
5.5
4
(3.5
)
.5
95
(.0092)
.651
(.018)
5.6
4
(3.6
)
.8
4
.76
NS
B
reast
meat
yie
ld
(g
/g c
arc
ass g
ain
)
.314 6
(.008)
.0885 6
(.0
31)
- 6
.3
12
(.0080)
.350
(.055)
2.8
3
(6.2
2)
.5
6
.53
NS
A
bdom
inal fa
t pad g
ain
(g
/g B
WG
)
.0603
(.0051)
.0401
(.0
046)
9.7
5
(4.6
)
.0
565
(.0040)
.0387
(.012)
4.4
9
(5.5
)
.7
9
.70
NS
1Y =
a +
(k-a
) *
(1-e
–c *
(x –
0.5
75) );
wit
h s
epara
te p
ara
mete
r esti
mate
s f
or
the g
rou
ps w
ith
a low
an
d a
hig
h B
PE
-rati
o in
EX
P1,
respecti
vely
(see m
odel [2
] in
text)
;
wh
ere
: y =
bro
iler
perf
orm
an
ce v
ari
able
; a =
in
terc
ept
(i.e
. perf
orm
an
ce o
n t
he d
iet
wit
h B
PE
-rati
o=0.5
75 g
/M
J); k
= m
axim
um
respon
se (
asym
pto
te); c
=
cu
rvatu
re s
teepn
ess; 0.5
75 =
low
est
BPE
-rati
o t
hat
was t
este
d in
both
EX
P1 a
nd E
XP2; x =
IPE
rati
o (g d
igesti
ble
lysin
e p
er
MJ A
ME
n).
2B
ala
nced p
rote
in t
o e
nerg
y r
ati
o (g d
igesti
ble
lysin
e p
er
MJ A
ME
n).
3R
2 v
alu
es in
case o
f tw
o s
epara
te d
ose-r
espon
se c
urv
es for
the t
wo g
rou
ps w
ith
diffe
ren
t die
ts in
EX
P1.
4R
2 v
alu
es in
case o
f on
e e
xpon
en
tial dose-r
espon
se c
urv
e for
the t
wo g
rou
ps w
ith
diffe
ren
t die
ts in
EX
P1 t
ogeth
er.
5Level
of
sig
nific
an
ce f
or
test
if r
espon
se c
urv
es a
re d
iffe
ren
t fo
r th
e t
wo g
rou
ps w
ith
diffe
ren
t die
ts i
n E
XP1;
NS
: P
> 0
.10;
* 0.1
0 >
P >
0.0
5;
** 0
.05 >
P >
0.0
1;
***
P <
0.0
1.
6If
th
e ite
rati
ve a
lgori
thm
th
at
was u
sed t
o e
sti
mate
th
e p
ara
mete
rs o
f th
e e
xpon
en
tial m
odel fa
iled t
o c
on
verg
e, th
en
a s
imple
lin
ear
model w
as u
sed in
ste
ad
[ y
= a
+ k
* (x-0
.575) ]; w
here
k =
slo
pe a
nd y
, a a
nd x
have t
he s
am
e m
ean
ing a
s in
th
e e
xpon
en
tial m
odel.
7U
sin
g a
lin
ear
model [y= a
+ k
*(x-0
.575)]; w
here
k =
slo
pe a
nd y
, a a
nd x
have t
he s
am
e m
ean
ing a
s in
th
e e
xpon
en
tial m
odel.
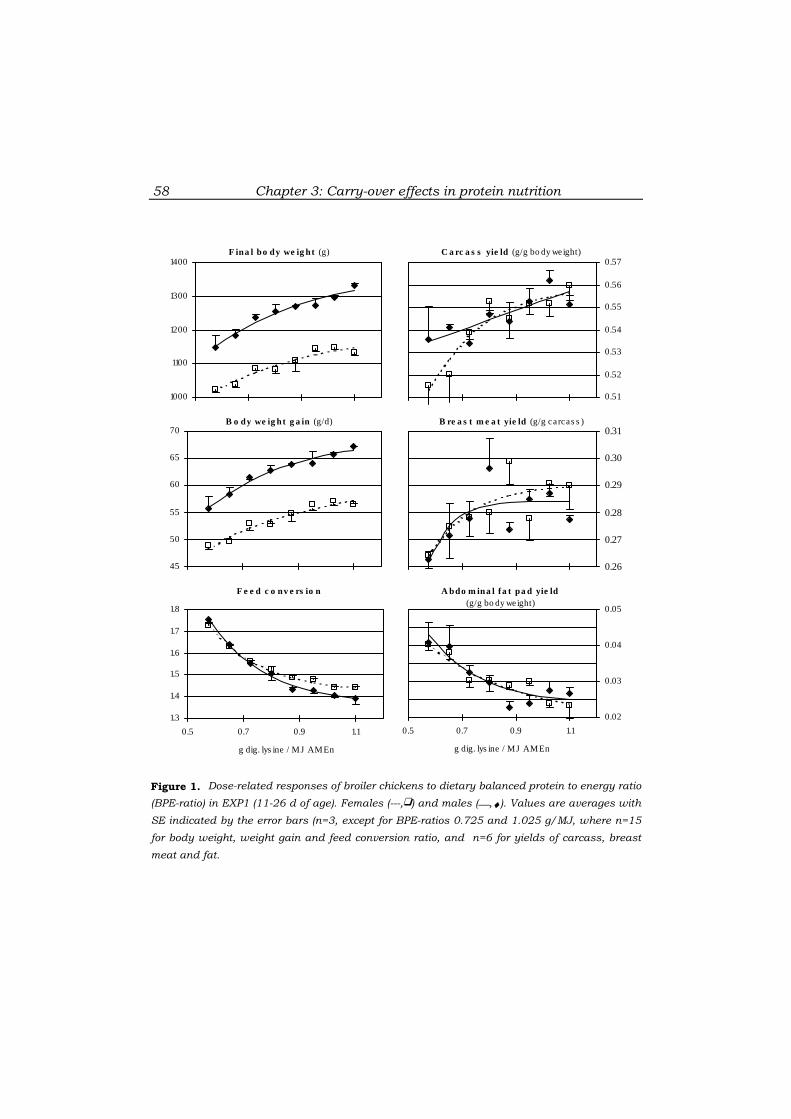
Chapter 3: Carry-over effects in protein nutrition
58
Figure 1. Dose-related responses of broiler chickens to dietary balanced protein to energy ratio
(BPE-ratio) in EXP1 (11-26 d of age). Females (---,�) and males (,♦). Values are averages with
SE indicated by the error bars (n=3, except for BPE-ratios 0.725 and 1.025 g/MJ, where n=15
for body weight, weight gain and feed conversion ratio, and n=6 for yields of carcass, breast
meat and fat.
B o dy we ig ht g a in (g/d)
45
50
55
60
65
70
C a rc a s s yie ld (g/g bo dy weight)
0.51
0.52
0.53
0.54
0.55
0.56
0.57
F e e d c o nv e rs io n
1.3
1.4
1.5
1.6
1.7
1.8
0.5 0.7 0.9 1.1
g dig. lys ine / MJ AMEn
A bdo m ina l fa t pa d yie ld (g/g bo dy weight)
0.02
0.03
0.04
0.05
0.5 0.7 0.9 1.1
g dig. lys ine / MJ AMEn
F ina l bo dy we ig ht (g)
1000
1100
1200
1300
1400
B re a s t m e a t yie ld (g/g carcas s )
0.26
0.27
0.28
0.29
0.30
0.31

Chapter 3: Carry-over effects in protein nutrition
59
Despite lower body weights at the start of EXP2, broilers fed the low
protein diet in EXP1 tended to have higher body weight gains in EXP2 than
those fed the high protein diet in EXP1 (Figures 2 and 3). This difference in
body weight gain was only significant for the females (Table 4). For the
males, differences in body weight gain were present only at high BPE ratios
in EXP2 (Figure 2). Provided that BPE ratios in EXP2 were high, male
broilers fed the low protein diet in EXP1 compensated, at least to some
extent, for their lower initial body weight (see final body weights in Figure
2). Female broilers fed a low protein diet in EXP1, however, did not fully
compensate in EXP2 for their lower initial body weight (Figure 3).
Composition of the gain in females in EXP2 was unaffected by the diet in
EXP1 (Figure 3, Table 4). With males, however, the proportion of
abdominal fat in the gain and the content of breast meat in the carcass
gain were affected by diet in EXP1. Males given a low instead of a high
protein diet in EXP1, contained relatively more abdominal fat in the gain in
EXP2 and, in spite of that, also utilised their feed in EXP2 more efficiently
(Figure 2). This latter effect of diet in EXP1 on feed efficiency in EXP2 was
also found in females (Figure 3).
Health status
Mortality averaged 0.6% in EXP1 and 2.4% in EXP2. Mortality was affected
by sex (P < 0.05) with males contributing 96% and 76% in EXP1 and
EXP2. Mortality in EXP2 was also affected by the diet that was fed in EXP1
(P < 0.05). Feeding the low instead of the high protein diet in EXP1
increased mortality in EXP2 from 0.8% (SE 0.40) to 3.6% (SE 0.77).
Interactions of diet with sex, or between diet in EXP1 and EXP2 were not
significant (P > 0.05).
Most of the metabolic variables were not affected by the experimental
treatments. Liver cirrhosis was found in only one bird. The arterial
pressure index was on average 0.192 (SD 0.018). The average heart
fibrinogen score was low at 0.048 (SD 0.17). The average pericardial
moisture score was higher at 0.44 (SD 0.39). Treatment did not affect
arterial pressure index or heart fibrinogen score (P > 0.05). The pericardial
moisture score, however, was significantly affected both by the diet in
EXP2 (P < 0.05) and by sex (P < 0.01) (higher in males), but not by the diet
that was fed in EXP1 (P > 0.05). Interactions between treatment factors
were not significant (P > 0.05).

Chapter 3: Carry-over effects in protein nutrition
60
Figure 2. Dose-related responses of male broiler chickens to dietary balanced protein to
energy ratio (BPE-ratio) in EXP2 (26-41 d of age). High (---,�) and low (,♦) BPE-ratio in EXP1
(11-26 d of age). Values are averages with E indicated by the error bars (n=3).
B o dy we ig ht g a in (g/d)
55
60
65
70
75
80
C a rc a s s g a in (g/g bo dy weight ga in)
0 .54
0 .56
0 .58
0 .60
0 .62
0 .64
0 .66
0 .68
F e e d c o nv e rs io n
1.8
1.9
2.0
2.1
2.2
2.3
2.4
2.5
0.4 0.6 0.8 1.0
g dig. lys ine / MJ AMEn
A bdo m ina l fa t pa d g a in (g/g bo dy weight ga in)
0.00
0.02
0.04
0.06
0.08
0.4 0.6 0.8 1.0
g dig. lys ine / MJ AMEn
F ina l bo dy we ig ht (g)
2000
2100
2200
2300
2400
2500
B re a s t m e a t g a in (g/g carcas s ga in)
0.22
0.25
0.28
0.31
0.34

Chapter 3: Carry-over effects in protein nutrition
61
Figure 3. Dose-related responses of female broiler chickens to dietary balanced protein to
energy ratio (BPE-ratio) in EXP2 (26-41 d of age). High (---,�) and low (,♦) BPE-ratio in EXP1
(11-26 d of age). Values are averages with SE indicated by the error bars (n=3).
B o dy we ig ht g a in (g/d)
46
50
54
58
62
A bdo m ina l fa t pa d g a in (g/g bo dy weight ga in)
0.02
0.04
0.06
0.08
0.4 0.6 0.8 1.0
g dig. lys ine / MJ AMEn
B re a s t m e a t g a in (g/g carcas s ga in)
0.27
0.30
0.33
0.36
0.39
F ina l bo dy we ig ht (g)
1750
1800
1850
1900
1950
2000
2050
F e e d c o nv e rs io n
1.8
1.9
2.0
2.1
2.2
2.3
2.4
2.5
0.4 0.6 0.8 1.0g dig. lys ine / MJ AMEn
C a rc a s s g a in (g/g bo dy weight ga in)
0.52
0.55
0.58
0.61
0.64
0.67

Chapter 3: Carry-over effects in protein nutrition
62
It was therefore possible to use linear regression to estimate the overall
effect of diet in EXP2 on pericardial moisture score. This latter analysis
revealed that, although the amount of variance explained was rather low
(R2 = 0.10), pericardial moisture score increased significantly (P < 0.01) by
0.695 (SE 0.22) for each additional gram digestible lysine per MJ AMEn in
EXP2. Over the range of BPE ratios used the pericardial moisture score
would be predicted to increase from 0.25 to 0.61.
Thus, diet composition at early ages (11 to 26 d of age) did not affect the
ascites-related metabolic variables at 41 d, but it did affect mortality
during the 26 to 41 d period.
DISCUSSION
Statistical model
The response of growing broiler chickens to protein level in the diet is
characterised by diminishing increments of response as the dietary protein
level increases, up to levels where a plateau in output is reached (for
example, Clark et al., 1982; Smith et al., 1998). The exponential model
used in this study has these properties and could be an appropriate one to
describe such responses. The model has the additional advantage that its
parameters have biological meanings. Parameters a, k, and c represent
respectively, the performance level at a fixed low BPE ratio (0.575 g/MJ),
the maximum performance level (asymptote) and the rate of increase in
performance from a to k when BPE ratio is increased above 0.575 g/MJ.
Careful interpretation is needed when the estimated asymptote for the
exponential model is much higher than the highest observed response in
the test. An extreme example concerns the females in EXP2, fed on the
high protein diet in EXP1. The estimated asymptote in body weight is 2197
g (Table 4), whereas the highest observed body weight in this treatment
group is about 1990 g (Figure 3). Consequently, the precision of the
estimated asymptote is very low (SE is 744 g; Table 4). Within the range of
protein levels tested, however, the exponential response model gives in all
cases an accurate description of the data in this experiment. This
conclusion is based on the random distribution of the data along the fitted
response curves (Figures 1 to 3). The flexibility of the model, particularly
the flexibility in curve steepness, contributed to the goodness of fit.

Chapter 3: Carry-over effects in protein nutrition
63
Feed intake
Responses in performance of broilers that have unrestricted access to diets
with varying concentrations of a given nutrient reflect a combination of two
possible effects. Changing the dietary content of a nutrient may change
feed intake per se (thus affecting the absolute intake of the nutrient).
Secondly, it can also change the metabolic efficiency by which the nutrient
is utilised (Baker, 1984). An attempt to distinguish between these two
effects is outside the scope of this paper. However, data on the average
feed intakes at different treatments groups are given (Table 5) to allow
such an analysis to be made.
Age period
The present study was designed to study the carry-over effects of feeding a
low protein diet from 11 to 26 d of age on broiler responses to protein level
in the diet during 26 to 41 d of age. Part of the interest was in nutritional
carry-over effects on metabolic disorders. Scheele et al. (1999) found that
feeding broilers a diet low in first limiting amino acids to energy ratio in
the early growing phase (14 to 21 d of age) may lower the incidence of
metabolic disorders at later age. The same age period, including a safety
margin of some additional d was therefore chosen as the restriction period
for the present study. The period of 26 to 41 d was chosen as the re-
alimentation period where d 41 was supposed to be the average slaughter
age in practice. Body composition changes in this period are relevant for
carcass quality.
Nutritional carry-over effects on growth and development
Results of our study indicate that broiler responses to dietary balanced
protein level in a later grower phase depend on the balanced protein level
in the diet that was fed previously. Such carry-over effects were found with
growth rate and feed conversion, and to a less extent with composition of
the gain. Compensatory growth and improved feed utilisation after protein
restriction, as found in the present study, have been demonstrated before
with turkeys (Auckland and Morris, 1971) and with broilers (Moran, 1979;
Pesti and Fletcher, 1984).
In studies on compensatory growth, it is common practice to compare the
performance of previous restricted animals with that of control animals
that are supposed to show unrestricted growth throughout (for example,
Plavnik and Hurwitz, 1989; Zubair, 1994). In the present study, growth

Chapter 3: Carry-over effects in protein nutrition
64
rates during the re-alimentation period were up to 25% lower than breeder
standards, for the restricted birds as well as for the control group. This
raises the question of whether the overall reduction in growth rate may
have affected the possibility for the restricted birds to show compensatory
growth, that is, to grow faster than the control birds. Marks (1978) found
that fast growing quail lines were capable of demonstrating greater
compensatory growth following a protein restriction than non-selected
control quail. Cherry et al. (1978) noted the opposite effect of genetics on
compensatory growth capacity. The slower growing broiler strains in their
study exhibited more compensatory gain than the faster grower strains.
Neither study proves, however, that the suggested correlation between
overall growth rate and capacity for growth compensation between strains
also applies for a given genotype.
No evidence was found in the present study for a nutritional carry-over
effect of previous feeding on the proportion of carcass in the gain. Similarly
Moran (1979) and Pesti and Fletcher (1984) found no effect of dietary
protein level on carcass yield, neither immediately after feeding a low
protein diet, nor after a re-alimentation period of 1 or 2 weeks,
respectively. This suggests that in their studies, as in the study reported
here, the proportion of carcass in the gain during compensation was not
affected by the early protein limitation.
Composition of the gain in the present study was not completely
independent of previous nutrition. The proportion of abdominal fat in the
gain in males, for example, was increased following the early protein
restriction. This higher gain of abdominal fat was attended by a lower feed
conversion ratio. Due to its relatively low water content and high fat
content, adipose tissue requires more energy per kg of gain than lean
tissues. The mentioned carry-over effects for abdominal fat and feed
conversion in males seem therefore contradictory. It is possible that the
response in accretion of total body fat was opposite to the response in
abdominal fat. Data published by Pesti and Fletcher (1984) indicate indeed
that, during the week that followed the period with inadequate protein
nutrition, feed conversion improved, proportion of abdominal fat in the
gain increased whereas total fat content in the gain decreased. The
abdominal fat pad is often used as an indicator for carcass fat, including
studies on compensatory growth (for example, Plavnik and Hurwitz, 1988,
1989; Zubair, 1994). However, for the latter type of studies, gain in
abdominal fat pad may be not a reliable indicator of gain in carcass fat or
total body fat.

Table
5.
Eff
ects
of
die
tary
BPE
-ra
tio1 o
n a
vera
ge d
aily f
eed
in
take (g/d
) w
ith
bro
iler
ch
icken
s in
EX
P1
an
d E
XP2
BPE
-rati
o
Experi
men
t S
ex
BPE
-rati
o
in E
XP1 3
0.5
00
0.5
75
0.6
50
0.7
25
0.8
00
0.8
75
0.9
50
1.0
25
1.1
00
P 4
EX
P1
Male
97.7
95.9
95.7
94.3
91.6
91.5
92.3
93.7
**
F
em
ale
84.2
80.7
82.6
80.5
81.5
83.2
82.4
81.4
N
S
EX
P2
Male
Low
135.6
135.8
143.4
131.9
143.7
146.0
131.4
140.3
**
Hig
h
137.2
150.4
143.4
133.4
142.7
137.8
136.4
141.1
**
F
em
ale
Low
118.6
116.3
117.7
114.4
120.3
120.7
118.6
119.8
NS
Hig
h
123.6
122.2
117.2
119.2
116.9
121.4
123.0
124.5
NS
1B
ala
nced p
rote
in t
o e
nerg
y r
ati
o (g d
igesti
ble
lysin
e p
er
MJ A
ME
n).
2E
XP1: 11-2
6 d
of age; E
XP2: 26-4
1 d
of age.
3Low
an
d h
igh
repre
sen
t 0.7
25 a
nd 1
.025 g
dig
esti
ble
lysin
e p
er
MJ A
ME
n, re
specti
vely
, in
th
e d
iet
du
rin
g E
XP1.
4Level of
sig
nific
an
ce f
or
test
if f
eed in
take is a
ffecte
d b
y B
PE
-rati
o;
NS
: P
> 0
.10;
* 0.1
0 >
P >
0.0
5;
** 0
.05 >
P >
0.0
1;
***
P <
0.0
1.

Chapter 3: Carry-over effects in protein nutrition
66
The water content of the carcass, relative to the protein content, may be
reduced in broilers chickens by inadequate protein nutrition (Chapter 2).
Possible compensation of the water content of the carcass after the period
of protein restriction is another factor that could explain the efficient feed
conversion during re-alimentation.
The abdominal fat pad is an important organ for the storage of energy in
poultry. The high relative gain in abdominal fat with the males following
the period of inadequate protein nutrition may reflect a metabolic
adaptation induced by a period of inadequate nutrition in general.
Following a quantitative feed restriction and refeeding, for example, Beane
et al. (1979) found, besides an improvement in feed efficiency, a significant
increase in the relative weight of the abdominal fat of male broilers.
Nutritional responses in growth of the abdominal fat pad may be different
between sexes. In the mentioned study of Beane et al. (1979), no effect of
feed restriction was found on abdominal fat weight after refeeding in
females. Likewise, in the present study proportion of abdominal fat pad in
the gain following feed restriction was increased in males, but not affected
in females. The hypothesis that the nutritional carry-over effects would
depend on the sex of the birds was not only confirmed for abdominal fat,
but also for body weight gain. Plavnik and Hurwitz (1988) found male
broilers to have a greater ability to exhibit compensatory growth after a
period of undernutrition than females. The same conclusion can be drawn
from our study, but only if the crude protein level in the re-alimentation
diet is above 20% (Figures 2 and 3).
Protein requirements during re-alimentation
A requirement for protein can be seen as the minimum level of protein in
the diet at which some measure of output (for example, weight gain) is
optimised. Feeding a low protein diet to growing turkeys or broilers during
a certain age period may increase the protein requirement for optimal
performance in the subsequent age period (Auckland and Morris, 1971;
Plavnik and Hurwitz, 1989). Only males were used in these two studies.
Also with the males in the present study, protein requirement to optimise
weight gain following a period of protein restriction was clearly increased
compared to unrestricted controls (Figure 2). For the females, and for the
other measures of output (for example, feed conversion ratio or breast
Chapter 3: Carry-over effects in protein nutrition
67
meat gain), differences in protein requirement due to previous protein
restriction were much less pronounced than for weight gain of the males
(Figure 2). The higher ability for compensatory growth of males compared
to females, as suggested earlier, appears to have consequences for the
protein requirement during growth compensation.
Nutritional carry-over effects on health status
Scheele et al. (1999) found that the effect of feeding strategy on metabolic
disorders occurred only in sensitive birds – the males of a pure line with
low ascites resistance. The genotype used in our experiment was less
sensitive to metabolic disorders than the sensitive strain used by Scheele
et al. (1999). The birds used by Scheele et al. (1999) were also housed
under the ascites-provoking conditions of low environmental temperature.
In our study, temperature was intended to be optimal for broiler health.
The differences in genotype and environment between Scheele et al. (1999)
and our study may explain why the incidence of metabolic disorders in our
study was not decreased by feeding a low protein diet at an early age.
Feeding a low instead of a high protein diet in EXP1 increased mortality in
EXP2. This may be related to the compensatory gain of these broilers in
EXP2. Fast growth, particularly in combination with a low feed conversion,
is known to be a risk factor for metabolic disorders (Scheele et al., 1991;
Julian, 1993). However, rapid gain like the compensatory growth observed
here, may also be a risk for non-metabolic illnesses like skeletal disorders
(Leeson et al., 1995). Such negative effects of compensatory gain on the
health status may overrule the beneficial effects of a low protein diet at
early age, particularly if the genetic strain is insensitive to metabolic
disorders. The sensitivity of a broiler strain for metabolic disorders needs
to be considered before a low protein diet for the early growing phase is
included in feeding programs intended to promote health.
Conclusions
The present study has demonstrated that responses in broiler performance
and body composition to dietary balanced protein to energy ratio (BPE
ratio) depend on previous protein nutrition and sex. Up to 10%
improvement in both weight gain and feed conversion at later age (EXP2)
were observed if BPE ratio during the early growing phase (EXP1) was
decreased. Effects of BPE ratio during EXP1 on the incidence of metabolic
disorders in EXP2 were not observed. The lower BPE ratio in EXP1
increased mortality in EXP2 from 0.8 to 3.6%. The results strongly suggest
Chapter 3: Carry-over effects in protein nutrition
68
that protein levels in grower and finisher diets should not be optimised
independently, but simultaneously.
ACKNOWLEDGMENTS
We gratefully acknowledge the critical comments of several Nutreco
colleagues regarding this manuscript. We thank I.H.C. van der Kruijs for
her valuable contribution to this experiment.
REFERENCES
Auckland, J. N. and T. R. Morris, 1971. Compensatory growth in turkeys: effect of
undernutrition on subsequent protein requirements. Br. Poult. Sci. 12:41-48.
Baker, D. H., 1984. Equalized versus ad libitum feeding. Nutr. Rev. 42:269-273.
Baker, D. H. and Y. Han, 1994. Ideal amino acid profile for chicks during the first three
weeks posthatching. Poult. Sci. 73:1441-1447.
Beane, W. L., J. A. Cherry and W. D. Weaver, Jr., 1979. Intermittent light and restricted
feeding of broiler chickens. Poult. Sci., 58:567-571.
Cherry, J. A., P. B. Siegel and W. L. Beane, 1978. Genetic-nutritional relationships in growth
and carcass characteristics of broiler chickens. Poult. Sci. 57:1482-1487.
Clark, F. A., R. M. Gous and T. R. Morris, 1982. Response of broiler chickens to well-
balanced protein mixtures. Br. Poult. Sci. 23:433-446.
CVB, 2000. Veevoedertabel. Centraal Veevoederbureau, Lelystad, The Netherlands.
Falconer, D. S., 1960. Introduction to quantitative genetics. Longman Group Limited,
London, UK.
Gous, R. M., G. C. Emmans and C. Fisher, 1992. The response of broilers to feeds differing in
protein content following a period of fattening. Poult. Sci. 71 (supplement 1):152.
Huchzermeyer, F. W. and A. M. C. De Ruyck, 1986. Pulmonary hypertension syndrome
associated with ascites in broilers. Vet. Records 119:94.
Julian, R. J., 1993. Ascites in poultry (review article). Avian Pathology 22:419-454.
Leeson, S., G. Diaz and J. D. Summers, 1995. Skeletal disorders. Pages 124-175 in: Poultry
metabolic disorders and mycotoxins, University Books, Guelph, Canada.
Lehmann, D., M. Pack and H. Jeroch, 1996. Responses of growing and finishing turkey toms
to dietary lysine. Poult. Sci. 75:711-718.
Llames, C. R. and J. Fontaine, 1994. Determination of amino acids in feeds: collaborative
study. J. of AOAC Intern. 77:1362-1402.
Marks, H. L., 1978. Compensatory growth in Japanese quail following protein restriction.
Poult. Sci. 57:1473-1477.
Moran, E. T., Jr., 1979. Carcass quality changes with the broiler chicken after dietary protein
restriction during the growing phase and finishing period compensatory growth.
Poult. Sci. 58:1257-1270.
Moré, J. J., 1977. The Levenberg-Marquardt algorithm: implementation and theory in
numerical analysis. Pages 105-116 in: G. A. Watson, ed. Lecture Notes in
Mathematics 630, Springer-Verlag, Berlin, Germany.

Chapter 3: Carry-over effects in protein nutrition
69
Pesti, G. M. and D. L. Fletcher, 1984. The response of male broiler chickens to diets with
various protein contents during the grower and finisher phases. Br. Poult. Sci.
25:415-423.
Plavnik, I. and S. Hurwitz, 1988. Early feed restriction in chicks: effect of age, duration, and
sex. Poult. Sci. 67:384-390.
Plavnik, I. and S. Hurwitz, 1989. Effect of dietary protein, energy, and feed pelleting on the
response of chicks to early feed restriction. Poult. Sci. 68:1118-1125.
Scheele, C. W., W. De Wit, M. T. Frankenhuis and P. F. G. Vereijken, 1991. Ascites in
broilers: 1. Experimental factors evoking symptoms related to ascites. Poult. Sci.
70:1069-1083.
Scheele, C. W., M. W. A. Verstegen, R. P. Kwakkel, R. A. Dekker and C. Kwakernaak, 1999.
Towards a new net energy system for poultry in the Netherlands. Pages 399-407 in:
Proceedings of the 12th European Symposium on Poultry Nutrition, Veldhoven, The
Netherlands.
Smith, E. R., G. M. Pesti, R. I. Bakalli, G. O. Ware and J. F. M. Menten, 1998. Further studies
on the influence of genotype and dietary protein on the performance of broilers.
Poult. Sci. 77:1678-1687.
SPSS, 1999. SPSS Base 9.0 for Windows. User’s Guide. SPSS Inc., Chicago, IL, USA.
Zubair, A. K., 1994. Compensatory growth in the broiler chicken. Ph.D. Thesis, University of
Guelph, Guelph, Canada.
Zubair, A. K. and S. Leeson, 1996. Compensatory growth in the broiler chicken: a review.
World’s Poult. Sci. J. 52:189-201.


Chapter 4
Dietary Balanced Protein in Broiler Chickens: a Flexible
and Practical Tool to Predict Dose-Response Curves
Paper by: R. M. Eits, R. P. Kwakkel, M. W. A. Verstegen and L A. den
Hartog. Submitted to British Poultry Science.

Chapter 4: A tool to predict dose-response curves
72
ABSTRACT An exponential dose-response model was developed that
predicts growth rate, feed conversion and carcass and breast meat yield of
broilers as a function of dietary balanced protein level (DBP). The model
was developed to serve as a tool for nutritionists. The model helps
determining the DBP that maximise profit. The model avoids practical
disadvantages of existing methods. In contrast with mechanistic models,
only data that are generally known by broiler nutritionists are required as
input. Compared to predictions derived from one or a few feeding trials, the
model predictions are probably more flexible and accurate for a wider
range of genotypes because a description of the type of broiler was
included as input for the model.
Broiler response studies from literature and the Nutreco Poultry Research
Centre (27 data sets in total) were used in the model development to select
significant variables, to quantify the parameters and to evaluate the
accuracy of the predictions. Input variables were DBP, asymptotic
performance level, age, year (indicating genetic potential) and sex. The
model, including the assumption that the shape of the dose-response
relationships to DBP is a constant gave an accurate simulation of growth
rate, feed conversion and breast meat for nearly all data sets. Accuracy
was less for carcass. In Chapter 5, the developed model is used to
evaluate how profitability of a broiler enterprise depends on DBP.

Chapter 4: A tool to predict dose-response curves
73
INTRODUCTION
Dietary protein level has a considerable impact on growth rate, feed
efficiency and body composition of broiler chickens (Skinner et al., 1991;
Smith et al., 1998), but also on the cost price of the diet. Thereby, protein
level of the diet strongly affects costs as well as revenues in broiler meat
production. The decision of what protein level is optimal in broiler diets
depends on the desired quality of the end product and is also an economic
question. Calculation of the economic optimal protein level is problematic,
particularly because an accurate quantitative description is needed on how
broiler performance, for example growth rate, feed conversion and body
composition, relates to dietary protein level.
Such dose-response relationships are often empirically quantified in a
feeding experiment (Smith et al., 1998) or sometimes predicted by means of
a mechanistic simulation model (Gous, 1998). Both approaches are of
limited value for nutritionists to determine economic optimal protein levels.
Empirically determined relationships require expensive, time-consuming
testing and are only reliable under the exact conditions (in terms of bird
characteristics, feed and environment) of the specific experiment.
Mechanistic simulation models have the disadvantage that often complex
input data are required that are unknown by most broiler nutritionists.
The objective of this study was to develop an alternative method to
generate dose-response curves for modern broiler genotypes under
commercial conditions. It predicts growth rate, feed conversion and
carcass and breast meat yield at various dietary protein levels. The new
method avoids the above-mentioned disadvantages of the existing
methods. For example, some input data are used to describe the type of
broiler in order to make the predictions flexible and accurate for a wider
range of genotypes than predictions derived from one or a few empirical
feeding trials. In addition, and in contrast to a mechanistic model, only
data that are generally known by broiler nutritionists are required as
input.
MATERIALS AND METHODS
The objective of this study was realised in two steps. First, a mathematical
model was developed that meets the imposed criteria as formulated in the

Chapter 4: A tool to predict dose-response curves
74
objective. Secondly, experimental data were applied to further develop this
model (selection of variables and quantification of parameters) and to
evaluate the accuracy.
Development of the mathematical model
Dose-response relationships obtained in different broiler studies may be
strongly dissimilar due to differences related to the bird, the feed and the
environment. Dose-response relationships to dietary protein may differ in
three aspects, as is shown in Figure 1. The three aspects are (1) the broiler
performance at a quite high protein level (indicating the asymptotic
performance level), (2) the protein level needed to obtain a given response
(horizontal position cq ‘intercept’) and (3) the rate of response to increasing
protein levels (shape of the response curve). This implies that, if a
nutritionist has information about these three sources of variation for the
broilers in his integration, dose-response relationships can be constructed
without actual experimentation.
The mathematical model for this study should represent the three sources
of variation in response curves identified above (asymptote, intercept and
shape of the curve). Secondly, it should allow for the typical shape of
response of growing broiler chickens to dietary protein, which is
characterised by diminishing increments of response as the dietary protein
level increases, up to levels where a plateau in output is reached (Clark et
al., 1982). The following exponential equation meets these criteria and was
therefore chosen as the mathematical model for the prediction of dose-
response curves:
( ) ( ))*(1* DLysCeBABGR −−−−+= [1]
where: GR = growth rate (g/d); B = broiler performance (‘intercept’) at a
fixed Lys level (D); A = asymptotic performance level; C = shape of response
to Lys level; Lys = dietary Lys level (g Lys/kg diet), used as a reference for
balanced protein level and D = fixed level of Lys. Model [1] has been used
previously to describe the responses of turkeys to dietary Lys (Lehmann et
al., 1996) and of broiler chickens to dietary balanced protein (Chapter 3).

Chapter 4: A tool to predict dose-response curves
75
Figure 1. Three sources of variation in dose-response curves: vertical position (panel a),
horizontal position (panel b) and shape (panel c). Hypothetical dose-response curves based on
model [2]: GR = 0.98*A + 0.02*A * (1-exp (-C * (Lys – D))); see text.
growth rate (g/d)
30
50
70
90
110
4 8 12 16
A = 90
A = 80
A = 70
A = 60
30
50
70
90
110
4 8 12 16
D = 10
D = 11
D = 12
D = 13
30
50
70
90
110
4 8 12 16
balanced protein level (g Lys/kg)
C = 0.3
C = 0.4
C = 0.5
C = 0.6
a
b
c

Chapter 4: A tool to predict dose-response curves
76
The asymptotic performance level is usually reasonably well-known by an
experienced nutritionist. Information about the intercept and the shape of
the response curve may be less straightforward and is discussed below.
The intercept was defined as the Lys level (D) that is required for a given
growth rate B (model [1]). Nutritionists have more knowledge about growth
rates at practical, high Lys levels than at low Lys levels. Therefore, to
maximise the reliability of the estimated intercept (D), the intercept was
defined at a relatively high Lys level; namely the Lys level at which growth
rate (B) is at 98% of the asymptote (A). This somewhat arbitrarily chosen
Lys level will be referred to as Lys requirement. Model [1] thus becomes:
( ))*(1**02.0*98.0 DLysCeAAGR −−−+= [2]
where, additionally to [1]: D represents Lys requirement (g Lys / kg diet). It
should be noted that this model predicts growth rates below 0.98*A (if Lys
< D) as well as above 0.98*A (if Lys > D).
To further improve the reliability of the estimated Lys requirement (D), a
model was developed to predict D from other variables. The variables
should represent major sources of variation in D. Moreover, in order to be
of practical relevance, only those variables should be used of which broiler
nutritionists know the actual value under field conditions. Variables that
are in accordance with those criteria are age, sex and year. Year represents
the genetic potential of the broiler (for example, 2002). Experimental data
proves that D may be affected by age and sex (Smith et al., 1998; Chapter
3) as well as year (genetic potential) (Whitehead, 1990; Leclercq and Guy,
1991; Smith et al., 1998). Assuming that D is a linear function of age, sex
and year, model [2] becomes:
( )])***[*(1**02.0*98.0 sexHyearGageFELysCeAAGR +++−−−+= [3]
where: age is the average day of the relevant age period (d) and E, F, G and
H are model parameters that relate age, year and sex to Lys requirement
(D). Values for sex are 1 (males), 0 (females) and 0.5 (as hatched). If a
nutritionist has data on Lys requirement under his field conditions that he
believes to be more accurate than the general predictions based on age,
sex and year, then he can use his own estimate for Lys requirement to
predict the dose-response curves.
The shape of the response curve (C) is difficult to quantify under field
conditions. It was assumed that C is similar for laboratory conditions and

Chapter 4: A tool to predict dose-response curves
77
field conditions. In addition, it was assumed that C is independent of
broiler characteristics (for example, age, sex, breed) and feed
characteristics (for example, dietary energy level).
For feed conversion ratio (FCR), dose response curves can be predicted
using the same method as for growth rate. An adjustment was needed,
because FCR minimises with increasing protein level whereas growth rate
maximises. Lys requirement for FCR was therefore defined as the Lys level
at which FCR is at 102% of the asymptote. Thus, in analogy to model [3],
the model for FCR becomes:
( )])***[*(1**02.0*02.1 sexHyearGageFELysCeAAFCR +++−−−−= [4]
Similar models, but without the variable year (see selection of variables),
were used to simulate dose response curves for carcass yield (g/g broiler
weight) and breast meat yield (g/g carcass):
( )])**[*(1**02.0*98.0 sexHageFELysCeAACarcass ++−−−+= [5]
Breast meat ( )])**[*(1**02.0*98.0 sexHageFELysCeAA ++−−−+= [6]
Selection of data sets
Studies on broiler responses to dietary balanced protein level, either from
literature or from the Nutreco Poultry Research Centre, were used to
further develop the model and to evaluate its accuracy. The following
selection criteria were applied to select appropriate data sets. Growing
broiler chickens of a commercial line must have been fed ad libitum with
isoenergetic diets containing varying amounts of Lys. Preferably, there
should have been at least five levels of Lys in each test in order to get a
reliable estimate of the shape of the dose-response curve (Remmenga et al.,
1997). One study with only four Lys levels (Surisdiarto and Farrell, 1991)
was accepted, however, as that study included scarce data on low Lys
levels in combination with young broilers. The minimum amounts of
essential amino acids relative to Lys should have been constant among
treatments to keep the right balance between amino acids (balanced
protein); not necessarily the same balance among all studies. As the
response of rapidly developing broiler chickens changes from day to day,
the experimental period ought to have been no longer than 21 d.
Otherwise, the response would reflect an accumulation of too much
physiological different growth phases. An overview of the studies that
satisfied the selection criteria is given in Table 1.

TA
BLE
1.
Da
ta s
ets
used
for
the m
od
el con
str
ucti
on
1
Refe
ren
ce 2
D
ata
set
Age p
eri
od
(d)
Bre
ed 3
D
eta
ils
1.
Cla
rk e
t a
l.,
1982
1
7 –
21
Hybro
A
s h
atc
hed;
EX
P1;
die
tary
en
erg
y o
n N
E-b
asis
2.
Su
risdia
rto a
nd F
arr
ell,
1991 4
1
0 –
21
See ‘deta
ils’
Male
s,
com
merc
ial str
ain
(A
ustr
alian
Pou
ltry
Ltd
)
3.
Skin
ner
et
al.,
1991
1
42 –
49
Cobb 5
00
As h
atc
hed,
avera
ge r
esu
lts o
ver
6 s
imilar
tria
ls
4.
Skin
ner
et
al.,
1992
1,
2
42 –
49
Cobb 5
00
Data
sets
1 (m
ale
s) an
d 2
(fe
male
s); L
ys 1
.08 g
/kg d
uri
ng 0
-42 d
- id
em
3,
4
42 –
49
Cobb 5
00
Data
sets
3 (m
ale
s) an
d 4
(fe
male
s); L
ys 1
.22 g
/kg d
uri
ng 0
-42 d
5.
Sm
ith
et
al , 1
998 5
1,
2
18 -
32
See ‘deta
ils’
Data
sets
1 (R
oss*R
oss 2
08) an
d 2
(Pete
rson
*Arb
or
Acre
s)
6.
Eit
s,
2001 (u
npu
blish
ed)
1,
2
14 –
35
Hybro
-MPN
D
ata
sets
1 (m
ale
s) an
d 2
(fe
male
s)
- id
em
3,
4
14 –
35
Hybro
-SK
D
ata
sets
3 (m
ale
s) an
d 4
(fe
male
s)
- id
em
5,
6
35 –
49
Hybro
-MPN
D
ata
sets
5 (m
ale
s) an
d 6
(fe
male
s)
- id
em
7,
8
35 –
49
Hybro
-SK
D
ata
sets
7 (m
ale
s) an
d 8
(fe
male
s)
7.
Eit
s e
t a
l.,
2003 6
1,
2
11 –
26
Hybro
-G
Data
sets
1 (m
ale
s) an
d 2
(fe
male
s)
- id
em
3,
4
26 –
41
Hybro
-G
Data
sets
3 (m
ale
s) an
d 4
(fe
male
s); L
ys 1
.04 g
/kg d
uri
ng 1
1-2
6 d
- id
em
5,
6
26 –
41
Hybro
-G
Data
sets
5 (m
ale
s) an
d 6
(fe
male
s); L
ys 1
.42 g
/kg d
uri
ng 1
1-2
6 d
8.
Weu
rdin
g,
2002 7
1,
2
9 -
18
Cobb 5
00
As h
atc
hed,
data
sets
1 (peas in
die
t) a
nd 2
(ta
pio
ca in
die
t)
9.
Eit
s,
2002 (u
npu
blish
ed)
1,
2
21 -
42
Hybro
-G
Data
sets
1 (m
ale
s) an
d 2
(fe
male
s)
1C
arc
ass a
nd b
reast
meat
data
were
on
ly a
vailable
fro
m r
efe
ren
ces 4
, 5, 6, 7 a
nd 9
.
2S
mit
h e
t al. (1998) u
sed c
rum
ble
s a
nd C
lark
et
al. (1982) u
sed m
ash
feed, w
here
as t
he e
xperi
men
tal die
ts in
all o
ther
stu
die
s w
ere
pellete
d.
3H
ybro
-MPN
an
d H
ybro
-SK
have s
imilar
gro
wth
rate
s a
nd feed c
on
vers
ion
, bu
t H
ybro
-SK
has a
mu
ch
hig
her
bre
ast
meat
yie
ld t
han
Hybro
-MPN
.
45 L
ys levels
at
each
of 4 ideal pro
tein
levels
were
teste
d (E
xp2). D
ata
of die
ts w
ith
th
e low
est
Lys level at
each
ideal pro
tein
level w
ere
used in
th
e p
resen
t stu
dy.
5Sm
ith e
t al. (
1998)
report
ed n
o L
ys a
nd d
igestible
Lys l
evels
for
the d
iets
. H
ow
ever,
reliable
estim
ate
s f
or
tota
l and d
igestible
Lys c
ou
ld b
e d
eri
ved f
rom
the r
aw
mate
rial
com
positio
n a
nd C
P levels
of
the d
iets
, u
sin
g t
abu
late
d v
alu
es (C
VB
, 2000), b
ecau
se c
orn
, soy b
ean m
eal and s
ynth
etic a
min
o a
cid
s w
ere
the o
nly
am
ino a
cid
sou
rces in
their
die
ts.
6A
ME
level w
as n
ot
com
ple
tely
con
sta
nt
am
on
g t
reatm
en
ts b
ut
decre
ased g
radu
ally w
ith
abou
t 6%
fro
m t
he low
est
to t
he h
igh
est
pro
tein
level.
7W
eu
rdin
g (2002) only
pu
blished d
igestible
Lys levels
, bu
t to
tal Lys levels
were
su
pplied u
pon r
equ
est.

Chapter 4: A tool to predict dose-response curves
79
Selection of variables and quantification of parameters
The collected data sets were used for the selection of significant variables
to predict Lys requirement (age, year, sex) in the model for growth rate. At
the same time, the model parameters (C, E, F, G, H; see model [3]) were
quantified. This was done by fitting model [3] to all the selected data sets
(Table 1) simultaneously, using non-linear regression (SPSS, 1999).
The selection of the variables to predict Lys requirement was done by
running the data analysis several times with the variables age, sex and
year being added one by one to the basis model. The basis model is the
model with dietary Lys level and A as the only variables (see also Table 2).
Regarding the order of adding the variables, priority was always given to
the variable that gave the largest single improvement in explained
variance. The significance of improvement of the model by inclusion of an
additional variable was evaluated by means of an F-test.
For this data analysis, variable A (asymptotic growth rate) in model [3] had
a predetermined value, which was different for each data set. This A-value
was calculated as the average growth rate at the highest two Lys levels in
that data set. Parameter C in model [3] was quantified by means of non-
linear regression, similarly as for parameters E, F, G and H. Thus,
parameter C in the model for growth rate had the same value for all data
sets. The year of publication of an experiment was taken as the value for
the variable year. Details on the statistics are given below. Lys
requirements for FCR, carcass yield and breast meat yield were modelled
in the same way as for growth rate, using models [4]-[6] instead of model
[3].
The model was constructed with total or digestible Lys as input variable. For
20 data sets (references 5, 6, 7, 8 and 9 in Table 1) out of 27 in total, Lys
digestibility figures were available. Only these 20 data sets were used for the
development of the model with digestible Lys. The range of years among these
data sets is relatively small (1998-2002). Therefore, year (=genetic potential)
was not included in the model with digestible Lys. For the same reason, year
was not included in the models for carcass and breast meat yield.
Regression models were fitted to the treatment averages of the experimental
data. Non-linear (Levenberg-Marquardt algorithm; Moré, 1977) regression
procedures (SPSS, 1999) were used to analyse the data. The significance of
improvement of a model by inclusion of an additional variable was assessed
Chapter 4: A tool to predict dose-response curves
80
by an F-test: the difference in the residual sum of squares between the model
with and the model without the additional variable, divided by the difference
in degrees of freedom of the residuals, was tested against the residual mean
square of the model with the additional variable.
Accuracy of the model
The accuracy of the model predictions was tested by plotting the
experimental data and the predicted curves together in a graph, with a
separate graph for each data set. Model predictions came from models [3]-
[6]. A good fit, that is a random distribution of the experimental data
around the predicted dose response curves, would signify a good accuracy
of the model. The goodness-of-fit should be evaluated at the lower Lys
levels in each data set. The simulation close to the asymptote is accurate
by definition, as the asymptote was defined as the average growth rate or
FCR at the highest two Lys levels in a data set.
A separate graph for each data set makes it possible to judge the
goodness-of-fit for each data set. In this way, possible deviations in the
model predictions for one or more data sets could be traced back to factors
that may explain them (for example, breed, sex or others; Table 1).
RESULTS
Selection of variables and quantification of parameters
Growth rate The models developed for growth rate and the significance of
the variables (age, year, sex) to predict Lys requirement for maximising
growth rate are presented in Table 2. The basis model, with total Lys and A
as the only variables, explained already 96.1% of the variation (model 3.1
in Table 2). Age and year were the first and second most important
variables to predict Lys requirement, and together (R2 = 97.9%) they
explained about half of the variance that was not explained by the basis
model. Sex did not give a significant improvement in the model (P > 0.10;
Table 2).
For the model with digestible Lys, the significance of the variables was
similar as for the model with total Lys (Table 2). The R2 for the best model
with digestible Lys (95.4%) was lower than for the best model with total Lys
(97.9%).

Table
2. A
n e
xpon
en
tia
l d
ose r
espon
se m
od
el1
pre
dic
tin
g g
row
th r
ate
(g/d
) of
bro
iler
ch
icken
s: S
ign
ific
an
ce o
f th
e v
ari
able
s t
o m
od
el Lys
requ
irem
en
t a
nd
esti
ma
ted
va
lues o
f th
e p
ara
mete
rs (a
sym
pto
tic S
E b
etw
een
bra
ckets
)
Lys
Vari
able
s t
o m
odel
Lys r
equ
irem
en
t 2
Late
st
added
vari
able
R2
ad
j P 3
C
E
F
G
H
Tota
l 3.1
-
-
96.1
.3
16 (.0
4)
11.2
(.5
9)
- -
-
3.2
age
Age
97.7
**
*
.438 (.0
3)
15.1
(.5
3)
-.127 (.0
12)
- -
3.3
age,
year
Y
ear
97.9
**
*
.610 (.0
5)
-173.2
(30)
-.0999 (.0
09)
.0935 (.0
15)
-
3.4
age,
year,
sex
Sex
97.9
N
S
.6
10 (.0
5)
-172.9
(30)
-.0999 (.0
09)
.0933 (.0
15)
-.024 (.1
8)
Dig
esti
ble
4
3.1
-
94.8
.7
57 (.0
8)
9.1
4 (.2
3)
- -
-
3.2
age
Age
95.4
**
*
.759 (.0
7)
10.8
(.4
5)
-.0564 (.0
13)
- -
3.5
age,
sex
Sex
95.4
N
S
.7
56 (.0
7)
10.7
(.4
7)
-.0561 (.0
14)
- .0
63 (.2
0)
1G
R =
0.9
8*A
+ 0
.02*A
*(1 -
exp (
-C*(
Lys –
[E
+ F
*age +
G*y
ear
+ H
*sex]))),
wh
ere
: G
R =
gro
wth
rate
(g/d); A
= a
sym
pto
tic g
row
th r
ate
(g/d); C
= s
hape o
f th
e d
ose-
respon
se c
urv
e;
Lys =
die
tary
Lys level (g
/kg); […
] = L
ys ‘re
qu
irem
en
t’ (die
tary
Lys level at
wh
ich
GR
= 0
.98*A
), a
s a
fu
ncti
on
of
bro
iler
age (d), y
ear
(e.g
. 2002), a
nd
sex (1= m
ale
s; 0 =
fem
ale
s; 0.5
= a
s h
atc
hed).
2V
ari
able
s t
o m
odel Lys r
equ
irem
en
t w
ere
added t
o t
he m
odel fo
r gro
wth
rate
(see footn
ote
1) on
e-b
y-o
ne.
Model 3.1
: G
R =
0.9
8*A
+ 0
.02
*A
*(1 -
exp (-C
*(Lys –
[E
]))), basis
model; for
mean
ing o
f th
e v
ari
able
s a
nd p
ara
mete
rs, see footn
ote
1.
Model 3.2
: G
R =
0.9
8*A
+ 0
.02*A
*(1 -
exp (-C
*(Lys –
[E
+ F
*age]))); fo
r m
ean
ing o
f th
e v
ari
able
s a
nd p
ara
mete
rs, see footn
ote
1.
Model 3.3
: G
R =
0.9
8*A
+ 0
.02*A
*(1 -
exp (-C
*(Lys –
[E
+ F
*age +
G*y
ear]
))); for
mean
ing o
f th
e v
ari
able
s a
nd p
ara
mete
rs, see footn
ote
1.
Model 3.4
: G
R =
0.9
8*A
+ 0
.02*A
*(1 -
exp (-C
*(Lys –
[E
+ F
*age +
G*y
ear
+ H
*sex]))); fo
r m
ean
ing o
f th
e v
ari
able
s a
nd p
ara
mete
rs, see footn
ote
1.
Model 3.5
: G
R =
0.9
8*A
+ 0
.02*A
*(1 -
exp (-C
*(Lys –
[E
+ F
*age +
H*s
ex]))); fo
r m
ean
ing o
f th
e v
ari
able
s a
nd p
ara
mete
rs, see footn
ote
1.
3S
ign
ific
an
ce o
f th
e c
on
trib
uti
on
to t
he m
odel by t
he late
st
added v
ari
able
; N
S:
P >
0.1
0;
* 0.1
0 >
P >
0.0
5;
** 0
.05 >
P >
0.0
1;
***
P <
0.0
1.
4For
the m
odel on
dig
esti
ble
Lys, a s
ele
cti
on
of 20 o
ut
of th
e 2
7 d
ata
sets
in
tota
l w
as u
sed (see t
ext)
.

Table
3.
An
expon
en
tia
l d
ose r
espon
se m
od
el1
pre
dic
tin
g f
eed
con
vers
ion
ra
tio (F
CR
) of
bro
iler
ch
icken
s: S
ign
ific
an
ce o
f th
e v
ari
able
s t
o m
od
el Lys
requ
irem
en
t a
nd
esti
ma
ted
va
lues o
f th
e p
ara
mete
rs (a
sym
pto
tic S
E b
etw
een
bra
ckets
)
Lys
Vari
able
s t
o m
odel
Lys r
equ
irem
en
t 2
Late
st
added
vari
able
R2
ad
j P 3
C
E
F
G
H
Tota
l 4.1
-
83.3
.4
13 (.0
5)
11.9
(.6
4)
- -
-
4.2
age
Age
96.4
**
*
.462 (.0
2)
15.2
(.3
6)
- .1
04 (.0
06)
- -
4.3
age,
year
Y
ear
97.0
**
*
.540 (.0
2)
-99.7
(16)
- .0
941 (.0
05)
.0572 (.0
08)
-
4.4
age,
year,
sex
Sex
97.0
N
S
.5
38 (.0
2)
-97.8
(17)
-.0936 (.0
05)
.0562 (.0
08)
.0679 (.1
3)
Dig
esti
ble
4
4.1
-
96.1
.5
39 (.0
3)
10.7
(.2
2)
- -
-
4.2
age
Age
96.9
**
*
.567 (.0
3)
12.2
(.3
3)
-.0562 (.0
09)
- -
4.5
age,
sex
Sex
97.5
**
*
.544 (.0
3)
11.7
(.3
2)
-.0467 (.0
08)
- .7
16 (.1
3)
1FC
R =
1.0
2*A
- 0
.02*A
*(1 -
exp (
-C*(
Lys –
[E
+ F
*age +
G*y
ear
+ H
*sex]))),
wh
ere
: FC
R =
feed c
on
vers
ion
rati
o;
A =
asym
pto
tic F
CR
; C
= s
hape o
f th
e d
ose-r
espon
se
cu
rve;
Lys =
die
tary
Lys l
evel
(g/kg); [
…]
= L
ys ‘re
qu
irem
en
t’ (
die
tary
Lys l
evel
at
wh
ich
FC
R =
1.0
2*A
), a
s a
fu
ncti
on
of
bro
iler
age (
d), y
ear
(e.g
. 2002), a
nd s
ex (
1=
male
s; 0 =
fem
ale
s; 0.5
= a
s h
atc
hed).
2V
ari
able
s t
o m
odel Lys r
equ
irem
en
t w
ere
added t
o t
he m
odel fo
r FC
R (see footn
ote
1) on
e-b
y-o
ne.
Model 4.1
: FC
R =
1.0
2*A
- 0
.02*A
*(1 -
exp (-C
*(Lys –
[E
]))), basis
model; for
mean
ing o
f th
e v
ari
able
s a
nd p
ara
mete
rs, see footn
ote
1.
Model 4.2
: FC
R =
1.0
2*A
- 0
.02*A
*(1 -
exp (-C
*(Lys –
[E
+ F
*age]))); fo
r m
ean
ing o
f th
e v
ari
able
s a
nd p
ara
mete
rs, see footn
ote
1.
Model 4.3
: FC
R =
1.0
2*A
- 0
.02*A
*(1 -
exp (-C
*(Lys –
[E
+ F
*age +
G*y
ear]
))); for
mean
ing o
f th
e v
ari
able
s a
nd p
ara
mete
rs, see footn
ote
1.
Model 4.4
: FC
R =
1.0
2*A
- 0
.02*A
*(1 -
exp (-C
*(Lys –
[E
+ F
*age +
G*y
ear
+ H
*sex]))); fo
r m
ean
ing o
f th
e v
ari
able
s a
nd p
ara
mete
rs, see footn
ote
1.
Model 4.5
: FC
R =
1.0
2*A
- 0
.02*A
*(1 -
exp (-C
*(Lys –
[E
+ F
*age +
H*s
ex]))); fo
r m
ean
ing o
f th
e v
ari
able
s a
nd p
ara
mete
rs, see footn
ote
1.
3S
ign
ific
an
ce o
f th
e c
on
trib
uti
on
to t
he m
odel by t
he late
st
added v
ari
able
; N
S:
P >
0.1
0;
* 0.1
0 >
P >
0.0
5;
** 0
.05 >
P >
0.0
1;
***
P <
0.0
1.
4For
the m
odel on
dig
esti
ble
Lys, a s
ele
cti
on
of 20 o
ut
of th
e 2
7 d
ata
sets
in
tota
l w
as u
sed (see t
ext)
.

Table
4.
An
expon
en
tia
l d
ose r
espon
se m
od
el1
pre
dic
tin
g c
arc
ass y
ield
(g/g b
od
y w
eig
ht)
of
bro
iler
ch
icken
s: S
ign
ific
an
ce o
f th
e v
ari
able
s t
o
mod
el Lys r
equ
irem
en
t a
nd
esti
ma
ted
va
lues o
f th
e p
ara
mete
rs (a
sym
pto
tic S
E b
etw
een
bra
ckets
)
Lys
Vari
able
s t
o m
odel
Lys r
equ
irem
en
t 2
Late
st
added
vari
able
R2
ad
j P 3
C
E
F
G
H
Tota
l 4.1
-
-
97.7
.1
37 (.1
1)
- .0
5 (7.9
) -
- -
4.2
age
Age
98.0
**
*
.406 (.1
2)
16.2
(2.3
) -.
310 (.0
99)
- -
4.3
age,
sex
Sex
98.1
**
.531 (.1
3)
15.6
(1.5
) -.
251 (.0
6)
- -1
.52 (.7
0)
Dig
esti
ble
4
4.1
-
98.2
.7
86 (.1
6)
7.1
(.2
) -
- -
4.4
sex
Sex
98.3
**
.945 (.1
8)
7.5
(.2
) -
- -.
65 (.3
1)
4.3
sex,
age
Age
98.3
**
.947 (.1
9)
9.5
(.6
) -.
061 (.0
2)
- -1
.24 (.3
8)
1C
arc
ass =
0.9
8*A
+ 0
.02*A
*(1 -
exp (
-C*(
Lys –
[E
+ F
*age +
G*y
ear
+ H
*sex]))),
wh
ere
: C
arc
ass =
carc
ass y
ield
(g
/g b
ody w
eig
ht)
; A
= a
sym
pto
tic
carc
ass y
ield
(g/g); C
= s
hape o
f th
e d
ose-r
espon
se c
urv
e;
Lys =
die
tary
Lys l
evel
(g/kg); [
…]
= L
ys ‘re
qu
irem
en
t’ (
die
tary
Lys l
evel
at
wh
ich
Carc
ass =
0.9
8*A
), a
s a
fu
ncti
on
of
bro
iler
age (d), y
ear
(e.g
. 2002), a
nd s
ex (1= m
ale
s;
0 =
fem
ale
s;
0.5
= a
s h
atc
hed).
2V
ari
able
s t
o m
odel Lys r
equ
irem
en
t w
ere
added t
o t
he m
odel fo
r carc
ass y
ield
(see f
ootn
ote
1) on
e-b
y-o
ne.
Model 4.1
: C
arc
ass =
0.9
8*A
+ 0
.02*A
*(1 -
exp (-C
*(Lys –
[E
]))),
basis
model; f
or
mean
ing o
f th
e v
ari
able
s a
nd p
ara
mete
rs,
see f
ootn
ote
1.
Model 4.2
: C
arc
ass =
0.9
8*A
+ 0
.02*A
*(1 -
exp (-C
*(Lys –
[E
+ F
*age])));
for
mean
ing o
f th
e v
ari
able
s a
nd p
ara
mete
rs,
see f
ootn
ote
1.
Model 4.3
: C
arc
ass =
0.9
8*A
+ 0
.02*A
*(1 -
exp (-C
*(Lys –
[E
+ F
*age +
H*s
ex])));
for
mean
ing o
f th
e v
ari
able
s a
nd p
ara
mete
rs,
see f
ootn
ote
1.
Model 4.4
: C
arc
ass =
0.9
8*A
+ 0
.02*A
*(1 -
exp (-C
*(Lys –
[E
+ H
*sex])));
for
mean
ing o
f th
e v
ari
able
s a
nd p
ara
mete
rs,
see f
ootn
ote
1.
3S
ign
ific
an
ce o
f th
e c
on
trib
uti
on
to t
he m
odel by t
he late
st
added v
ari
able
; N
S:
P >
0.1
0;
* 0.1
0 >
P >
0.0
5;
** 0
.05 >
P >
0.0
1;
***
P <
0.0
1.
4F
or
the m
odel on
dig
esti
ble
Lys,
a s
ele
cti
on
of
18 o
ut
of
the 2
2 d
ata
sets
in
tota
l w
as u
sed (see t
ext)
.
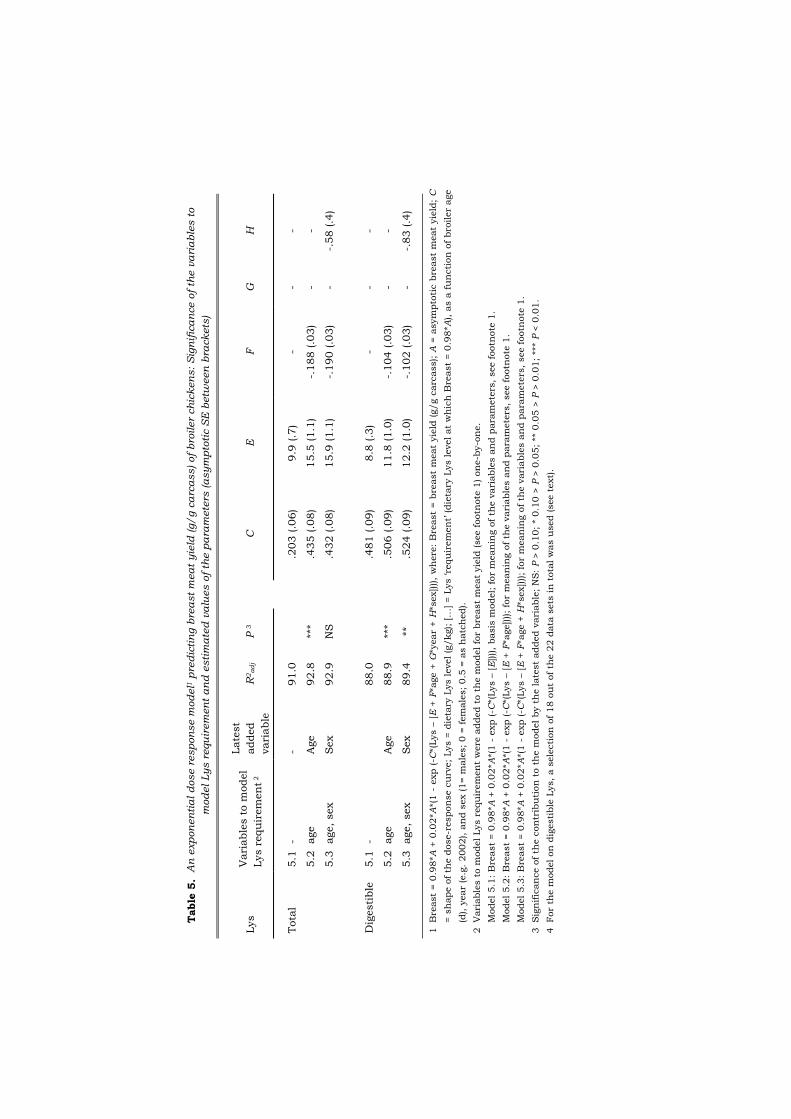
Table
5.
An
expon
en
tia
l d
ose r
espon
se m
od
el1
pre
dic
tin
g b
rea
st
mea
t yie
ld (g/g c
arc
ass) of
bro
iler
ch
icken
s: S
ign
ific
an
ce o
f th
e v
ari
able
s t
o
mod
el Lys r
equ
irem
en
t a
nd
esti
ma
ted
va
lues o
f th
e p
ara
mete
rs (a
sym
pto
tic S
E b
etw
een
bra
ckets
)
Lys
Vari
able
s t
o m
odel
Lys r
equ
irem
en
t 2
Late
st
added
vari
able
R2
ad
j P 3
C
E
F
G
H
Tota
l 5.1
-
-
91.0
.2
03 (.0
6)
9.9
(.7
) -
- -
5.2
age
Age
92.8
**
*
.435 (.0
8)
15.5
(1.1
) -.
188 (.0
3)
- -
5.3
age,
sex
Sex
92.9
N
S
.4
32 (.0
8)
15.9
(1.1
) -.
190 (.0
3)
- -.
58 (.4
)
Dig
esti
ble
5.1
-
88.0
.4
81 (.0
9)
8.8
(.3
) -
- -
5.2
age
Age
88.9
**
*
.506 (.0
9)
11.8
(1.0
) -.
104 (.0
3)
- -
5.3
age,
sex
Sex
89.4
**
.524 (.0
9)
12.2
(1.0
) -.
102 (.0
3)
- -.
83 (.4
)
1B
reast
= 0
.98*A
+ 0
.02*A
*(1 -
exp (
-C*(
Lys –
[E
+ F
*age +
G*y
ear
+ H
*sex]))),
wh
ere
: B
reast
= b
reast
meat
yie
ld (
g/g c
arc
ass); A
= a
sym
pto
tic b
reast
meat
yie
ld;
C
= s
hape o
f th
e d
ose-r
espon
se c
urv
e;
Lys =
die
tary
Lys level (g
/kg); […
] = L
ys ‘re
qu
irem
en
t’ (die
tary
Lys level at
wh
ich
Bre
ast
= 0
.98*A
), a
s a
fu
ncti
on
of bro
iler
age
(d), y
ear
(e.g
. 2002), a
nd s
ex (1= m
ale
s; 0 =
fem
ale
s; 0.5
= a
s h
atc
hed).
2V
ari
able
s t
o m
odel Lys r
equ
irem
en
t w
ere
added t
o t
he m
odel fo
r bre
ast
meat
yie
ld (see footn
ote
1) on
e-b
y-o
ne.
Model 5.1
: B
reast
= 0
.98*A
+ 0
.02*A
*(1 -
exp (-C
*(Lys –
[E
]))), basis
model; for
mean
ing o
f th
e v
ari
able
s a
nd p
ara
mete
rs, see footn
ote
1.
Model 5.2
: B
reast
= 0
.98*A
+ 0
.02*A
*(1 -
exp (-C
*(Lys –
[E
+ F
*age]))); fo
r m
ean
ing o
f th
e v
ari
able
s a
nd p
ara
mete
rs, see footn
ote
1.
Model 5.3
: B
reast
= 0
.98*A
+ 0
.02*A
*(1 -
exp (-C
*(Lys –
[E
+ F
*age +
H*s
ex]))); fo
r m
ean
ing o
f th
e v
ari
able
s a
nd p
ara
mete
rs, see footn
ote
1.
3S
ign
ific
an
ce o
f th
e c
on
trib
uti
on
to t
he m
odel by t
he late
st
added v
ari
able
; N
S:
P >
0.1
0;
* 0.1
0 >
P >
0.0
5;
** 0
.05 >
P >
0.0
1;
***
P <
0.0
1.
4For
the m
odel on
dig
esti
ble
Lys, a s
ele
cti
on
of 18 o
ut
of th
e 2
2 d
ata
sets
in
tota
l w
as u
sed (see t
ext)
.

Chapter 4: A tool to predict dose-response curves
85
Estimated parameter values for the growth rate models are given in Table
2. Parameter C varied considerably among the different models, for
example between 0.316 and 0.610 for total Lys (Table 2). In the basis
model, with Lys and A as the only variables, parameter E represents an
estimation of the balanced protein requirement over all data sets (11.2 and
9.14 g Lys/kg for total and digestible Lys, respectively). Parameter F is the
estimated decrease in balanced protein requirement for each day increase
in broiler age (for example, 0.0564 g Lys/kg diet/day for digestible Lys;
Table 2). Parameter G corresponds to the effect of year on balanced protein
requirement. The estimated value of 0.0935 (Table 2) suggests that by 10
years of genetic selection the Lys requirement for maximising growth rate
increased with almost 1 g/kg.
Feed conversion ratio The models developed for FCR and the significance of
the variables (age, year, sex) to predict Lys requirement for minimising
FCR are presented in Table 3. The basis model, with total Lys and A as the
only variables, explained 83.3% of the variation (Table 3). Age and year
were the first and second most important variables to predict Lys
requirement, and together (R2 = 97.0%) they explained 82% of the variance
that was not explained by the basis model. Sex contributed significantly to
the FCR model with digestible Lys (P < 0.01), but not to the FCR model
with total Lys (P > 0.10; Table 3).
Estimated parameter values for the FCR models are given in Table 3.
Parameter values can be compared (on a numerical basis) for the models
for growth rate and FCR. Models that are compared are the ones that
include all significant variables (Tables 2, 3). Parameters C in the models
for FCR (0.540 and 0.544 for total and digestible Lys, respectively; Table 3)
were lower than in the models for growth rate (0.610 and 0.759, for total
and digestible Lys, respectively; Table 2). This means that FCR worsens
relatively less than growth rate if Lys level becomes below the respective
requirement. The overall balanced protein requirement (parameter E in the
basis model) for FCR (11.9 and 10.7 g Lys/kg for total and digestible Lys,
respectively; Table 3) was higher than for growth rate (11.2 and 9.14 g
Lys/kg for total and digestible Lys, respectively; Table 2). The decrease in
balanced protein requirement with age (parameter F) was slightly less for
FCR (-0.0941 and -0.0467 g Lys/kg/d for total and digestible Lys,
respectively; Table 3) than for growth rate (-0.0999 and –0.0564 g
Lys/kg/d for total and digestible Lys, respectively; Table 2).

Eit
s, 2
00
1; #
4
8085
9095
100
105
110
46
810
1214
13E
its,
20
01;
# 5
8085
9095
100
105
110
46
810
1214
14E
its,
20
01;
# 6
8085
9095
100
105
110
46
810
1214
15E
its,
20
01;
# 7
8085
9095
100
105
110
46
810
1214
16
Cla
rk e
t al
., 19
81
30
50
70
90
110
46
810
1214
1S
kinn
er e
t al
., 19
91
8085
9095
100
105
110
46
810
1214
3
Sm
ith
et a
l., 1
99
8; #
1
758085
9095
100
105
110
46
810
1214
8
Sm
ith
et a
l., 1
99
8; #
2
8085
9095
100
105
110
46
810
1214
9E
its,
20
01;
# 1
8085
9095
100
105
110
46
810
1214
10E
its,
20
01;
# 2
8085
9095
100
105
110
46
810
1214
11E
its,
20
01;
# 3
8085
9095
100
105
110
46
810
121412
Sur
isd
iart
o a
nd F
arre
ll., 1
99
1
1030507090
110
46
810
1214
2S
kinn
er e
t al
., 19
92
; # 1
8085
9095
100
105
110
46
810
1214
4
Ski
nner
et
al.,
199
2; #
3
8085
9095
100
105
110
46
810
1214
6S
kinn
er e
t al
., 19
92
; # 2
8085
9095
100
105
110
46
810
1214
5S
kinn
er e
t al
., 19
92
; # 4
8085
9095
100
105
110
46
810
1214
7
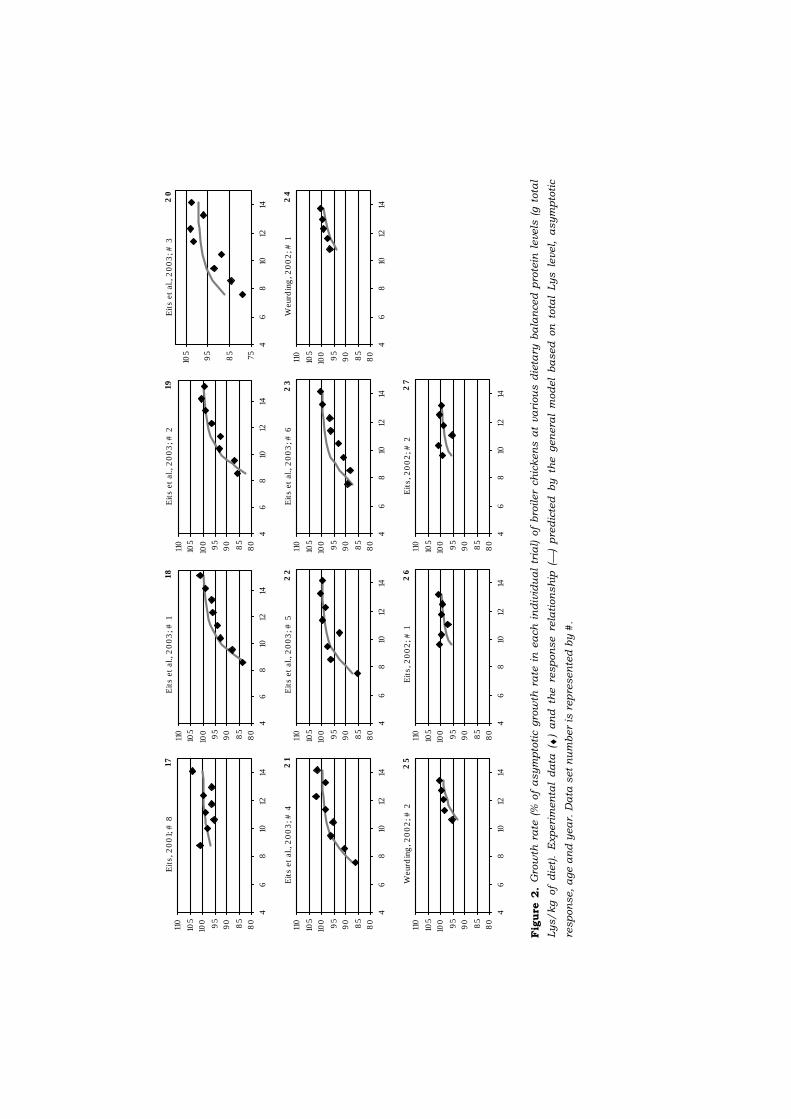
Fig
ure
2.
Gro
wth
ra
te (
% o
f a
sym
pto
tic g
row
th r
ate
in
ea
ch
in
div
idu
al
tria
l) o
f bro
iler
ch
icken
s a
t va
riou
s d
ieta
ry b
ala
nced
pro
tein
levels
(g t
ota
l
Lys/kg of
die
t).
Experi
men
tal
da
ta ( ♦
) a
nd
th
e re
spon
se re
lati
on
sh
ip (
) pre
dic
ted
by th
e gen
era
l m
od
el
ba
sed
on
to
tal
Lys le
vel, a
sym
pto
tic
respon
se, a
ge a
nd
yea
r. D
ata
set
nu
mber
is r
epre
sen
ted
by #
.
Weu
rdin
g, 2
00
2; #
1
8085
9095
100
105
110
46
810
1214
24
Weu
rdin
g, 2
00
2; #
2
8085
9095
100
105
110
46
810
1214
25
Eit
s et
al.,
20
03
; # 1
8085
9095
100
105
110
46
810
1214
18E
its
et a
l., 2
00
3; #
2
8085
9095
100
105
110
46
810
1214
19E
its
et a
l., 2
00
3; #
3
7585
95
105
46
810
1214
20
Eit
s et
al.,
20
03
; # 4
8085
9095
100
105
110
46
810
1214
21
Eit
s et
al.,
20
03
; # 5
8085
9095
100
105
110
46
810
1214
22
Eit
s et
al.,
20
03
; # 6
8085
9095
100
105
110
46
810
1214
23
Eit
s, 2
00
1; #
8
8085
9095
100
105
110
46
810
1214
17
Eit
s, 2
00
2; #
1
8085
9095
100
105
110
46
810
1214
26
Eit
s, 2
00
2; #
2
8085
9095
100
105
110
46
810
1214
27

Cla
rk e
t al
., 19
81;
# 1
90
120
150
180
210
46
810
1214
1S
kinn
er e
t al
., 19
91
90
100
110
120
130
46
810
1214
3
Sm
ith
et a
l., 1
99
8; #
1
90
100
110
120
130
46
810
1214
8
Sm
ith
et a
l., 1
99
8; #
2
90
100
110
120
130
46
810
1214
9E
its,
20
01;
# 1
90
100
110
120
130
46
810
1214
10E
its,
20
01;
# 2
90
100
110
120
130
46
810
1214
11E
its,
20
01;
# 3
90
100
110
120
130
46
810
1214
12
Eit
s, 2
00
1; #
4
90
100
110
120
130
46
810
1214
13E
its,
20
01;
# 5
90
100
110
120
130
46
810
1214
14E
its,
20
01;
# 6
90
100
110
120
130
46
810
1214
15E
its,
20
01;
# 7
90
100
110
120
130
46
810
1214
16
Sur
isd
iart
o a
nd F
arre
ll., 1
99
1
90
120
150
180
210
46
810
1214
2S
kinn
er e
t al
., 19
92
; # 1
90
100
110
120
130
46
810
1214
4
Ski
nner
et
al.,
199
2; #
3
90
100
110
120
130
46
810
1214
6S
kinn
er e
t al
., 19
92
; # 2
90
100
110
120
130
46
810
1214
5S
kinn
er e
t al
., 19
92
; # 4
90
100
110
120
130
46
810
1214
7
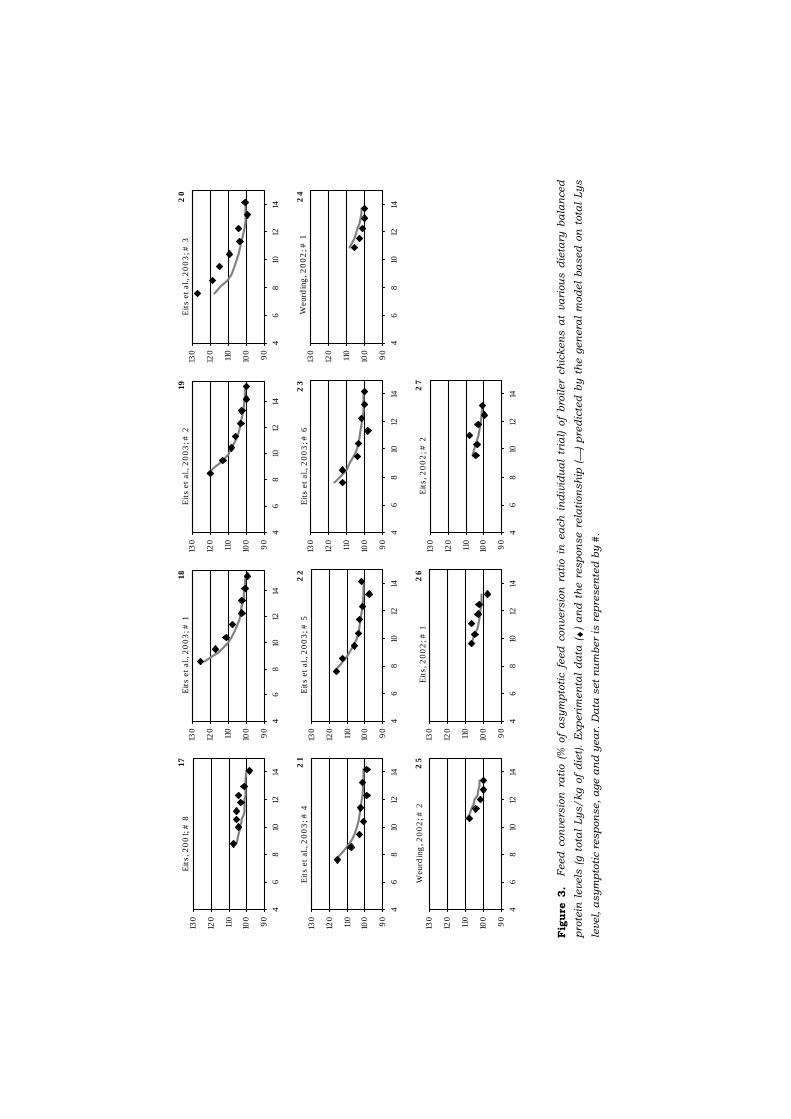
Fig
ure
3.
Feed
con
vers
ion
ra
tio (
% o
f a
sym
pto
tic f
eed
con
vers
ion
ra
tio i
n e
ach
in
div
idu
al
tria
l) o
f bro
iler
ch
icken
s a
t va
riou
s d
ieta
ry b
ala
nced
pro
tein
levels
(g t
ota
l Lys/kg o
f d
iet)
. E
xperi
men
tal
da
ta (
♦)
an
d t
he r
espon
se r
ela
tion
sh
ip (
)
pre
dic
ted
by t
he g
en
era
l m
od
el
ba
sed
on
tota
l Lys
level, a
sym
pto
tic r
espon
se, a
ge a
nd
yea
r. D
ata
set
nu
mber
is r
epre
sen
ted
by #
.
Weu
rdin
g, 2
00
2; #
1
90
100
110
120
130
46
810
1214
24
Weu
rdin
g, 2
00
2; #
2
90
100
110
120
130
46
810
1214
25
Eit
s et
al.,
20
03
; # 1
90
100
110
120
130
46
810
1214
18E
its
et a
l., 2
00
3; #
2
90
100
110
120
130
46
810
1214
19E
its
et a
l., 2
00
3; #
3
90
100
110
120
130
46
810
1214
20
Eit
s et
al.,
20
03
; # 4
90
100
110
120
130
46
810
1214
21
Eit
s et
al.,
20
03
; # 5
90
100
110
120
130
46
810
1214
22
Eit
s et
al.,
20
03
; # 6
90
100
110
120
130
46
810
1214
23
Eit
s, 2
00
1; #
8
90
100
110
120
130
46
810
1214
17
Eit
s, 2
00
2; #
1
90
100
110
120
130
46
810
1214
26
Eit
s, 2
00
2; #
2
90
100
110
120
130
46
810
1214
27

Sm
ith
et a
l., 1
99
8; #
1
85
9095
100
105
46
810
1214
5S
mit
h et
al.,
19
98
; # 2
85
9095
100
105
46
810
1214
6E
its,
20
01;
# 1
85
9095
100
105
46
810
1214
7E
its,
20
01;
# 2
85
9095
100
105
46
810
1214
8
Eit
s, 2
00
1; #
3
85
9095
100
105
46
810
1214
9E
its,
20
01;
# 4
85
9095
100
105
46
810
1214
10E
its,
20
01;
# 5
85
9095
100
105
46
810
1214
11E
its,
20
01;
# 6
85
9095
100
105
46
810
1214
12
Ski
nner
et
al.,
199
2; #
1
85
9095
100
105
46
810
1214
1S
kinn
er e
t al
., 19
92
; # 3
85
9095
100
105
46
810
1214
3S
kinn
er e
t al
., 19
92
; # 2
85
9095
100
105
46
810
1214
2S
kinn
er e
t al
., 19
92
; # 4
85
9095
100
105
46
810
1214
4
Eit
s, 2
00
1; #
7
85
9095
100
105
46
810
1214
13E
its
et a
l., 2
00
3; #
1
85
9095
100
105
46
810
1214
15E
its
et a
l., 2
00
3; #
2
85
9095
100
105
46
810
1214
16E
its,
20
01;
# 8
85
9095
100
105
46
810
1214
14

Fig
ure
4.
Ca
rca
ss y
ield
(%
of
asym
pto
tic c
arc
ass y
ield
in
ea
ch
in
div
idu
al tr
ial) o
f bro
iler
ch
icken
s a
t va
riou
s d
ieta
ry b
ala
nced
pro
tein
levels
(g t
ota
l
Lys/kg of
die
t).
Experi
men
tal
da
ta ( ♦
) a
nd
th
e re
spon
se re
lati
on
sh
ip (
) pre
dic
ted
by th
e gen
era
l m
od
el
ba
sed
on
to
tal
Lys le
vel, a
sym
pto
tic
respon
se, a
ge a
nd
sex. D
ata
set
nu
mber
is r
epre
sen
ted
by #
.
Eit
s et
al.,
20
03
; # 3
85
9095
100
105
46
810
1214
17E
its
et a
l., 2
00
3; #
4
85
9095
100
105
46
810
1214
18E
its
et a
l., 2
00
3; #
5
85
9095
100
105
46
810
1214
19E
its
et a
l., 2
00
3; #
6
85
9095
100
105
46
810
1214
20
Eit
s, 2
00
2; #
1
85
9095
100
105
46
810
1214
21
Eit
s, 2
00
2; #
2
85
9095
100
105
46
810
1214
22

Sm
ith
et a
l., 1
99
8; #
1
85
9095
100
105
110
46
810
1214
5S
mit
h et
al.,
19
98
; # 2
85
9095
100
105
110
46
810
1214
6E
its,
20
01;
# 1
85
9095
100
105
110
46
810
1214
7E
its,
20
01;
# 2
85
9095
100
105
110
46
810
1214
8
Eit
s, 2
00
1; #
3
85
9095
100
105
110
46
810
1214
9E
its,
20
01;
# 4
85
9095
100
105
110
46
810
1214
10E
its,
20
01;
# 5
85
9095
100
105
110
46
810
1214
11E
its,
20
01;
# 6
85
9095
100
105
110
46
810
1214
12
Ski
nner
et
al.,
199
2; #
1
85
9095
100
105
110
46
810
1214
1S
kinn
er e
t al
., 19
92
; # 3
85
9095
100
105
110
46
810
1214
3S
kinn
er e
t al
., 19
92
; # 2
85
9095
100
105
110
46
810
1214
2S
kinn
er e
t al
., 19
92
; # 4
85
9095
100
105
110
46
810
1214
4
Eit
s, 2
00
1; #
7
85
9095
100
105
110
46
810
1214
13E
its
et a
l., 2
00
3; #
1
85
9095
100
105
110
46
810
1214
15E
its
et a
l., 2
00
3; #
2
85
9095
100
105
110
46
810
1214
16E
its,
20
01;
# 8
85
9095
100
105
110
46
810
1214
14
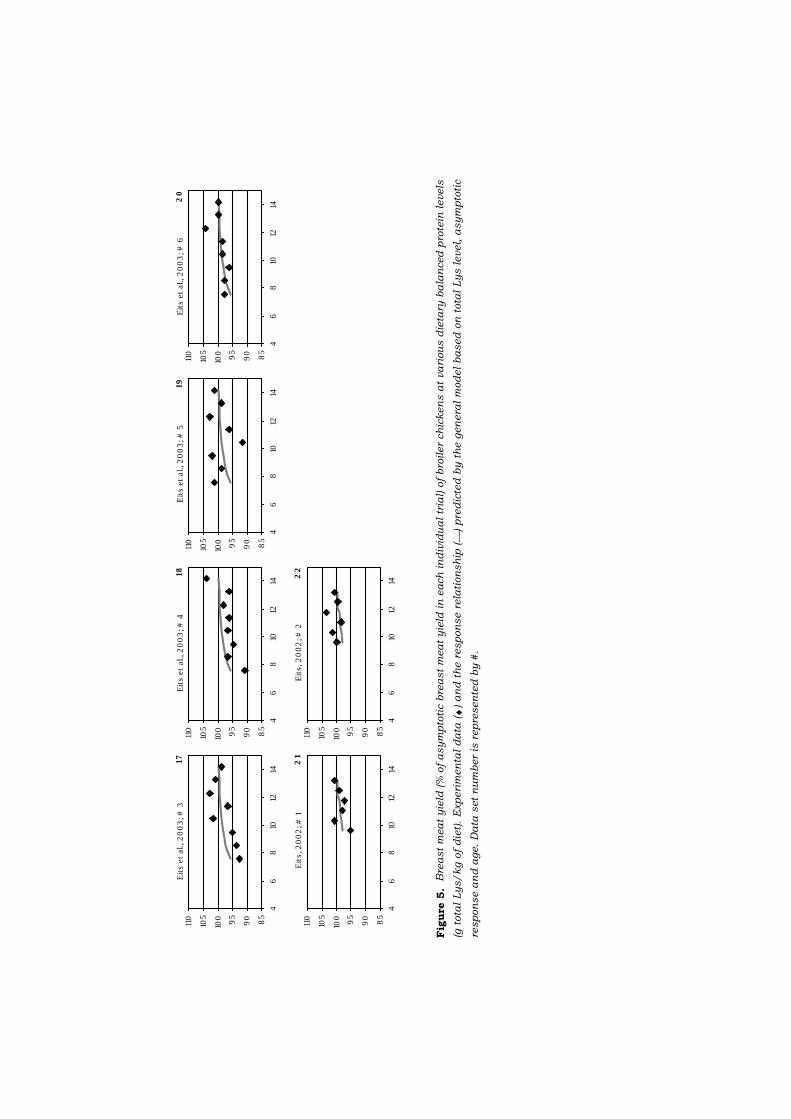
Fig
ure
5.
Bre
ast
mea
t yie
ld (%
of
asym
pto
tic b
rea
st
mea
t yie
ld in
each
in
div
idu
al tr
ial) o
f bro
iler
ch
icken
s a
t va
riou
s d
ieta
ry b
ala
nced
pro
tein
levels
(g t
ota
l Lys/kg o
f d
iet)
. E
xperi
men
tal
da
ta (
♦)
an
d t
he r
espon
se r
ela
tion
sh
ip (
) pre
dic
ted
by t
he g
en
era
l m
od
el ba
sed
on
tota
l Lys level, a
sym
pto
tic
respon
se a
nd
age. D
ata
set
nu
mber
is r
epre
sen
ted
by #
.
Eit
s et
al.,
20
03
; # 3
85
9095
100
105
110
46
810
1214
17E
its
et a
l., 2
00
3; #
4
85
9095
100
105
110
46
810
1214
18E
its
et a
l., 2
00
3; #
5
85
9095
100
105
110
46
810
1214
19E
its
et a
l., 2
00
3; #
6
85
9095
100
105
110
46
810
1214
20
Eit
s, 2
00
2; #
1
85
9095
100
105
110
46
810
1214
21
Eit
s, 2
00
2; #
2
85
9095
100
105
110
46
810
1214
22
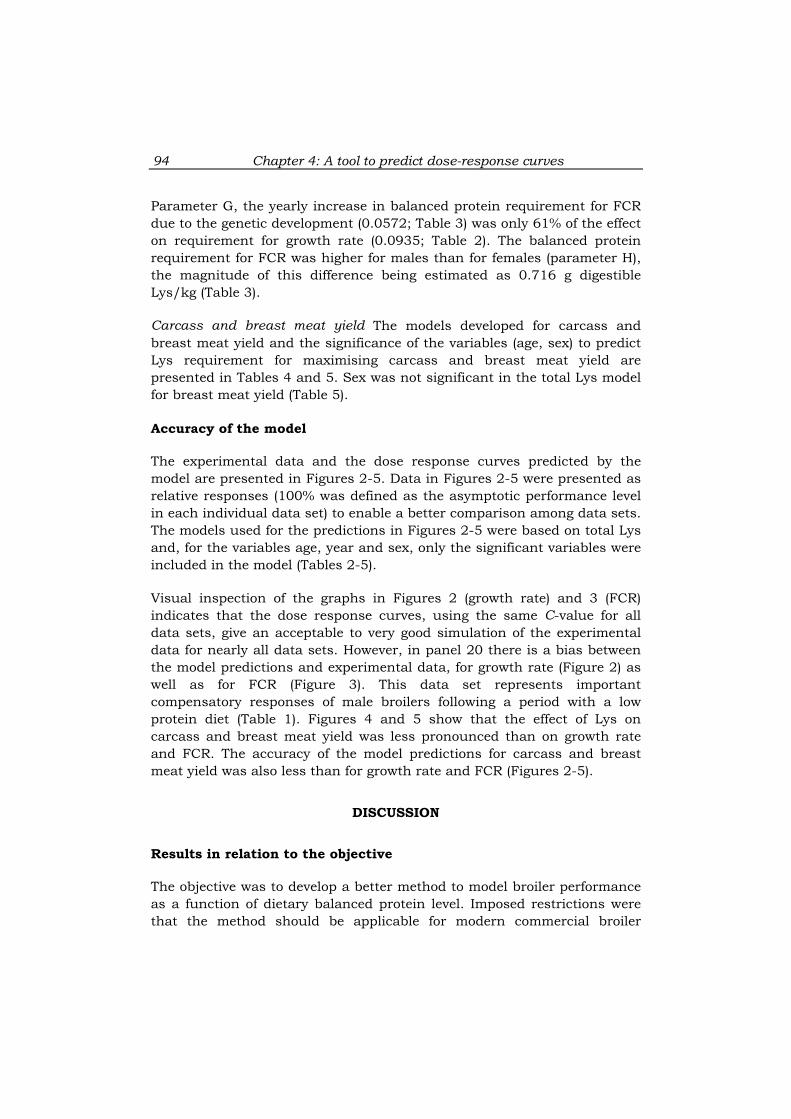
Chapter 4: A tool to predict dose-response curves
94
Parameter G, the yearly increase in balanced protein requirement for FCR
due to the genetic development (0.0572; Table 3) was only 61% of the effect
on requirement for growth rate (0.0935; Table 2). The balanced protein
requirement for FCR was higher for males than for females (parameter H),
the magnitude of this difference being estimated as 0.716 g digestible
Lys/kg (Table 3).
Carcass and breast meat yield The models developed for carcass and
breast meat yield and the significance of the variables (age, sex) to predict
Lys requirement for maximising carcass and breast meat yield are
presented in Tables 4 and 5. Sex was not significant in the total Lys model
for breast meat yield (Table 5).
Accuracy of the model
The experimental data and the dose response curves predicted by the
model are presented in Figures 2-5. Data in Figures 2-5 were presented as
relative responses (100% was defined as the asymptotic performance level
in each individual data set) to enable a better comparison among data sets.
The models used for the predictions in Figures 2-5 were based on total Lys
and, for the variables age, year and sex, only the significant variables were
included in the model (Tables 2-5).
Visual inspection of the graphs in Figures 2 (growth rate) and 3 (FCR)
indicates that the dose response curves, using the same C-value for all
data sets, give an acceptable to very good simulation of the experimental
data for nearly all data sets. However, in panel 20 there is a bias between
the model predictions and experimental data, for growth rate (Figure 2) as
well as for FCR (Figure 3). This data set represents important
compensatory responses of male broilers following a period with a low
protein diet (Table 1). Figures 4 and 5 show that the effect of Lys on
carcass and breast meat yield was less pronounced than on growth rate
and FCR. The accuracy of the model predictions for carcass and breast
meat yield was also less than for growth rate and FCR (Figures 2-5).
DISCUSSION
Results in relation to the objective
The objective was to develop a better method to model broiler performance
as a function of dietary balanced protein level. Imposed restrictions were
that the method should be applicable for modern commercial broiler

Chapter 4: A tool to predict dose-response curves
95
genotypes under field conditions, and that the method should be flexible
and practical. Based on the following arguments, it can be concluded that
the objective was realised. Firstly, the new method was based on recent
studies with commercial broilers (Table 1). Secondly, the link to field
conditions was realised by making field data on asymptotic performance
level and on balanced protein requirement input for the model. Flexibility
in type of broiler was obtained by the input variables age, year and sex.
Finally, the new method remained practical by using only input data that
are generally known by broiler nutritionists.
Results in Tables 2 and 3 together with Figures 2 and 3 showed that the
new method gave an accurate description of growth rate and FCR for
nearly all data sets that were used. It is note worthy that giving the shape
of the response curve (C) the same value for all data sets turned out to be
an acceptable simplification. The less accurate fit with compensatory
responses of males fed a low protein starter diet (panel 20 in Figures 2 and
3) may reflect an underestimation of Lys requirement (see also panel b in
Figure 1). Lys requirement may be increased in the period following a
protein restriction (Chapter 3).
The accuracy of predictions in carcass and breast meat yield was lower
than for growth rate and FCR (Figures 2-5). This may be explained by
different definitions of carcass and breast meat among the experiments
that were used for the model development. For example, the bias in the
carcass yield predictions in some of the data sets (panels 17-20 in Figure
4) may be due to the fact that in that experiment only, carcasses were
without skin and skin fat (Chapter 3). As another example, only in the
study of Smith et al. (1998), carcasses included the abdominal fat pad. In
this latter study, but not in the studies of our own laboratory, breast meat
included skin and bone. Therefore, the accuracy in the predictions of
carcass and breast meat yield responses may be improved if data sets with
standardised carcass and breast meat data become available.
The ideal way of validating the complete model would be by means of
independent data. However, this was not possible. The 27 data sets that
satisfied the selection criteria were all needed to obtain a reliable selection
of variables (age, year, sex) and estimation of parameter values (C, E, F, G
and H). However, the Lys requirement part of the model (that is, the
prediction from age, year and sex) can be validated by additional literature
data. The effect of year (indicating genetic development) on Lys
requirement is hardly or not investigated. The effects of age and sex on Lys
requirement are better documented (NRC, 1994). In Figure 6, the Lys
requirements for growth rate and FCR that were determined by the present

Chapter 4: A tool to predict dose-response curves
96
study are compared with the recommendations from NRC (1994). The
relationships between total Lys requirement and age in the present study
(Figure 6) were derived from the D- and B-parameter in model 3.3 for
growth rate (Table 2) and in model 4.3 for FCR (Table 3). The estimated Lys
requirement at a given age was up to 28% higher than according to NRC
(1994), particularly for the first three weeks of age (Figure 6). Similar
results were obtained in a study reported by CVB (1996), which is now
confirmed by the present study based on 27 data sets.
Figure 6. Balanced protein requirement of broiler chickens as affected by age. Requirements
derived from the present study (for optimising growth rate or feed conversion ratio (FCR)) and
according to NRC (1994) (♦).
Application of the new method
As an example, a nutritionist may want to determine the economic optimal
balanced protein level in the diet for broilers of a given age, sex and breed.
To do so, accurate dose-response curves in broiler performance to dietary
balanced protein level are needed. The model developed in the present
study can easily predict such dose-response curves. The nutritionist
should give input values for the two additional model variables: asymptotic
performance (A) and Lys requirement.
The A value and Lys requirement should represent the situation in the
field, averaged over all the farms that will use the same broiler diet. The A
value corresponds to the performance level of the broilers under study,
using a dietary balanced protein level that is higher than the requirement.
This A value is best estimated by the nutritionist himself, based on the
balanced protein requirement
(g total Lys/kg)
8
9
10
11
12
13
14
15
0 7 14 21 28 35 42 49 56
broiler age (d)
NRC (1994)
growth rate
FCR females
FCR males

Chapter 4: A tool to predict dose-response curves
97
actual average broiler performance, in combination with experience about
the sensitivity of broiler performance to increments in Lys level at practical
Lys levels. This expert knowledge will in most cases deliver a more correct
estimate for A than by any other means, for example a feeding trial, growth
simulation model or generalized values from the breeding company.
Dietary energy interacts with dietary protein for the effect on broiler
performance (Chapter 1). Dietary energy level was, however, not included
as a variable in the developed models for growth rate and FCR. One reason
was that the calculated energy levels varied little among the data sets used
for the model development. Typical energy levels for broiler diets were
applied in all these studies. Moreover, dietary energy levels in the various
data sets were expressed on different scales, which makes comparison over
data sets complicated. In principle, and as an alternative to using
empirical data, theoretical arguments could be used to include dietary
energy as a variable into the models. For example, the concept that poultry
tend to eat to meet their energy needs (NRC, 1994). This concept implies
that the effect of decreasing energy level could be accounted for in the
model for growth rate by a proportional reduction in Lys requirement.
However, this concept appears to be invalid for imbalanced diets. In Figure
7, it is shown that particularly at very low Lys to energy ratios, feed intake
of broilers is not only affected by energy level but by Lys level as well. The
response shown in Figure 7 is in accordance with the theory stated by NRC
(1994) on the effect of amino acids level on ad libitum feed intake Thus, a
good way of including energy level as a variable in the models of the
present study is not available yet. Therefore bias may occur with the
application of the models if the energy level of a diet substantially differs
from the average energy level in the data sets used for the present study.
The model predictions are most reliable for diets with typical energy levels,
for example 13.4 MJ MEn/kg (NRC, 1994) or 12.6 MJ MEn-broilers/kg
(CVB, 1996) for a broiler grower diet.
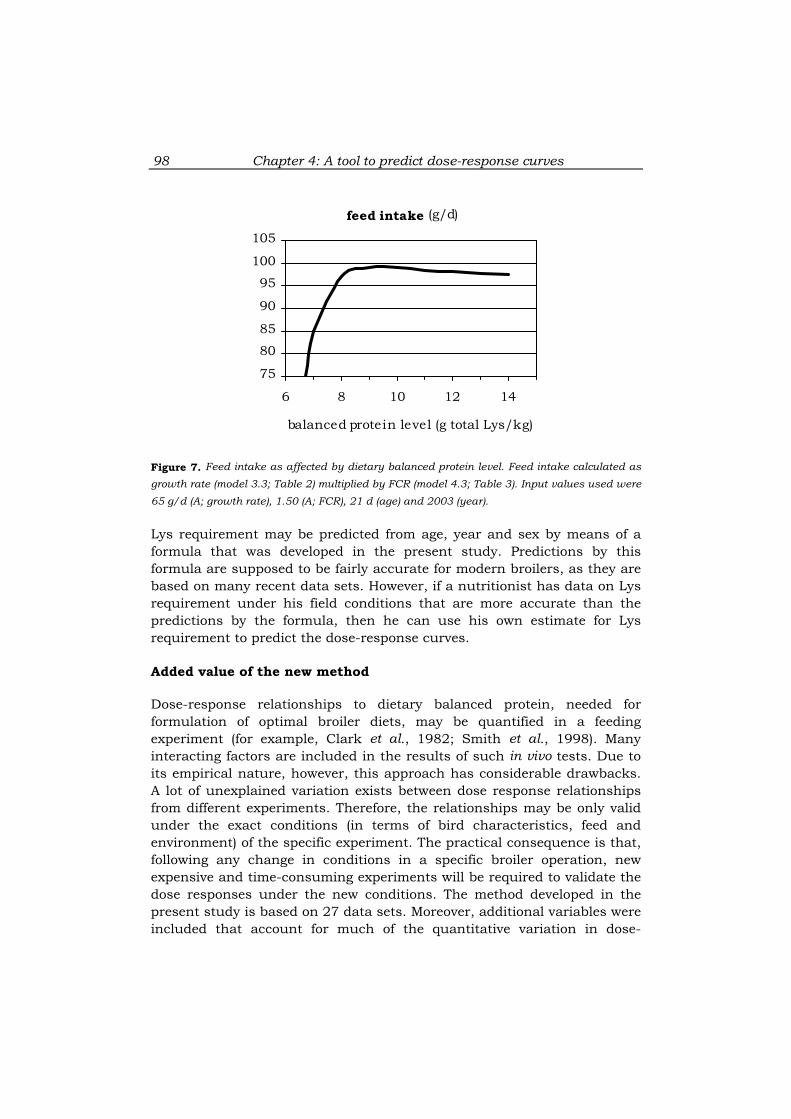
Chapter 4: A tool to predict dose-response curves
98
Figure 7. Feed intake as affected by dietary balanced protein level. Feed intake calculated as
growth rate (model 3.3; Table 2) multiplied by FCR (model 4.3; Table 3). Input values used were
65 g/d (A; growth rate), 1.50 (A; FCR), 21 d (age) and 2003 (year).
Lys requirement may be predicted from age, year and sex by means of a
formula that was developed in the present study. Predictions by this
formula are supposed to be fairly accurate for modern broilers, as they are
based on many recent data sets. However, if a nutritionist has data on Lys
requirement under his field conditions that are more accurate than the
predictions by the formula, then he can use his own estimate for Lys
requirement to predict the dose-response curves.
Added value of the new method
Dose-response relationships to dietary balanced protein, needed for
formulation of optimal broiler diets, may be quantified in a feeding
experiment (for example, Clark et al., 1982; Smith et al., 1998). Many
interacting factors are included in the results of such in vivo tests. Due to
its empirical nature, however, this approach has considerable drawbacks.
A lot of unexplained variation exists between dose response relationships
from different experiments. Therefore, the relationships may be only valid
under the exact conditions (in terms of bird characteristics, feed and
environment) of the specific experiment. The practical consequence is that,
following any change in conditions in a specific broiler operation, new
expensive and time-consuming experiments will be required to validate the
dose responses under the new conditions. The method developed in the
present study is based on 27 data sets. Moreover, additional variables were
included that account for much of the quantitative variation in dose-
feed intake (g/d)
75
80
85
90
95
100
105
6 8 10 12 14
balanced protein level (g total Lys/kg)
Chapter 4: A tool to predict dose-response curves
99
responses to dietary balanced protein between data sets. Therefore, dose-
responses predicted by the new method should be more flexible and
accurate under a wider range of conditions than predictions derived from
one or a few feeding trials.
Alternatively, dose response relationships may be predicted by a
mechanistic growth simulation model (Gous, 1998). For example the model
described by Emmans (1981) that includes a complete theory on feed
intake regulation and nutrient partitioning in the body of broiler chickens.
Scientifically, such a model is of importance to identify the most relevant
gaps in existing knowledge. Broiler nutritionists, however, are usually not
familiar with some of the required input data (for example, minimal fat to
protein ratio in the body; Emmans, 1981). Moreover, most broiler
nutritionists do not have the time to study the underlying biological
theories, which is essential to understand the model predictions. The
model developed in the present study only includes variables of which
experienced nutritionists know the actual value for their practical
conditions. Besides, the model is straightforward and thus relatively easy
to understand.
ACKNOWLEDGMENTS
We gratefully acknowledge the critical comments of several Nutreco
colleagues regarding this study.
REFERENCES
Clark, F. A., R. M. Gous and T. R. Morris, 1982. Response of broiler chickens to well-
balanced protein mixtures. Br. Poult. Sci. 23:433-446.
CVB, 1996. Aminozurenbehoefte van leghennen en vleeskuikens. CVB-documentatierapport
nr. 18. Centraal Veevoederbureau, Lelystad, The Netherlands.
CVB, 2000. Veevoedertabel. Centraal Veevoederbureau, Lelystad, The Netherlands.
Eits, R. M., R. P. Kwakkel, M. W. A. Verstegen and G. C. Emmans, 2003. Responses of broiler
chickens to dietary protein: effects of early life protein nutrition on later responses.
Br. Poult. Sci. 44:398-409.
Emmans, G. C., 1981. A model of the growth and feed intake of ad libitum fed animals,
particularly poultry. Pages 103-110 in: Computers in animal production. G. M.
Hillyer, C. T. Whittemore and R.G. Gunn, eds. Occasional publication no. 5, British
Society of Animal Production.
Gous, R. M., 1998. Making progress in the nutrition of broilers. Poult. Sci. 77:111-117.
Leclercq, B. and G. Guy, 1991. Further investigations on protein requirement of genetically
lean and fat chickens. Br. Poult. Sci. 32:789-798.
Lehmann, D., M. Pack and H. Jeroch, 1996. Responses of growing and finishing turkey toms
to dietary lysine. Poult. Sci. 75:711-718.

Chapter 4: A tool to predict dose-response curves
100
Moré, J. J., 1977. The Levenberg-Marquardt algorithm: implementation and theory in
numerical analysis. Pages 105-116 in: Lecture Notes in Mathematics 630. G. A.
Watson, ed. Springer-Verlag, Berlin, Germany.
NRC, 1994. Nutrient requirements of poultry. Ninth revised edition, National Academy Press,
Washington, D.C., USA.
Remmenga, M. D., G. A. Milliken, D. Kratzer, J. R. Schwenke and H. R. Rolka, 1997.
Estimating the maximum effective dose in a quantitative dose-response experiment.
J. Anim. Sci. 75:2174-2183.
Skinner, J. T., A. L. Izat and P. W. Waldroup, 1991. Effects of dietary amino acid levels on
performance and carcass composition of broilers 42 to 49 days of age. Poult. Sci.
70:1223-1230.
Skinner, J. T., A. L. Waldroup and P. W. Waldroup, 1992. Effects of protein and amino acid
level fed zero to forty-two days on response of broilers to protein and amino acid
levels fed forty-two to forty-nine days of age. Poult. Sci. 71:1364-1373.
Smith, E.R., G. M. Pesti, R. I. Bakalli, G.O. Ware and J. F. M. Menten, 1998. Further studies
on the influence of genotype and dietary protein on the performance of broilers.
Poult. Sci. 77:1678-1687.
SPSS, 1999. SPSS Base 9.0 for Windows. User’s Guide. SPSS Inc., Chicago, IL, USA.
Surisdiarto and D. J. Farrell, 1991. The relationship between dietary crude protein and
dietary lysine requirement by broiler chicks on diets with and without the “ideal”
amino acid balance. Poult. Sci. 70:830-836.
Weurding, R. E., 2002. Kinetics of starch digestion and performance of broiler chickens.
Ph.D. Thesis, Wageningen University, Wageningen, The Netherlands.
Whitehead, C. C., 1990. Responses of body composition, growth and food efficiency to dietary
protein in genetically lean and fat broilers up to seven weeks of age. Br. Poult. Sci.
31:163-172.

Chapter 5
Dietary Balanced Protein in Broiler Chickens: an
Economic Analysis
Paper by: R. M. Eits, G. W. J. Giesen, R. P. Kwakkel, M. W. A. Verstegen
and L. A. den Hartog. Submitted to British Poultry Science.

Chapter 5: An economic analysis
102
ABSTRACT An economic model was developed that calculates economic
optimal dietary balanced protein levels (DBP) for broiler chickens, based on
technical input and prices of meat and feed. Technical input on broiler
responses to DBP (growth rate, feed conversion, carcass yield and breast
meat yield) was obtained from the model described in Chapter 4.
Changes in broiler age, price of protein-rich raw materials and large
changes (40%) in meat prices result in economic relevant differences in
DBP for maximum profit. Effects of changes in sex or feed price on DBP for
maximum profit are negligible. Formulating diets for maximum profit
instead of maximum broiler performance can strongly increase profitability
of a broiler production enterprise. DBP for maximum profitability depend
on how the broilers are marketed; as whole birds, carcass or cut up.

Chapter 5: An economic analysis
103
INTRODUCTION
Dietary protein level in broiler diets strongly affects growth rate and meat
yield (Chapter 4) as well as feed cost and, thereby, profitability of a broiler
production enterprise. NRC (1994) therefore stated that it would be
desirable to have mathematical models available that would facilitate the
selection of the most economic nutrient levels. A technical as well as an
economic model is required for this aim. A technical model that predicts
broiler performance and meat yield responses to dietary balanced protein
has been described in Chapter 4. Just a few economic models were
published that evaluate the economics of broiler nutrition, for example by
Hurwitz et al. (1985), Gonzalez et al. (1992), Pack and Schutte (1995) and
Fisher and Gous (2000). However, these economic models as such were
inappropriate for economic evaluation of broiler responses to dietary
balanced protein level over a constant age period, as in the technical model
in Chapter 4.
Therefore, the first objective of this study was to develop an economic
model to determine economic optimal protein levels from price data and
performance data (from the technical model). The second objective was to
study the effect of broiler age and sex and of prices of feed and meat on the
economic optimal protein level.
MODEL DESCRIPTION
Concept of the model
An economic model was developed that calculates the effect of protein level
in the diet on feed costs, revenues and thereby on ‘returns over feed cost’
per broiler. Returns over feed cost were defined as gross margin.
It is common in practise that nutritional modifications do not affect the
slaughtering age. Therefore, analyses in this study were made over a
constant age period. Consequently, it is reasonable to assume that feed
costs are the only costs affected by protein level in the diet. Slaughtering
costs per broiler, for example, are more or less constant within the range of
broiler weights that a given slaughterhouse can handle.

Chapter 5: An economic analysis
104
Figure 1. Overview of input and output for the economic model “Nutri-opt II”.
Revenues depend on how the broilers are marketed: as whole broilers, as
whole carcass (slaughtered broiler) or as cut up meat parts. Cut up
broilers were defined here as consisting of two components: breast meat
and the remainder (rest carcass).
Calculations of the economic model apply to one age period, for example
the age period during which the grower or finisher diet is fed. It was
assumed that each gram difference in broiler weight (or weight of carcass,
breast meat, feed intake, etc.) at the end of an age period results in the
same difference at slaughter age.
Dietary protein was defined as protein balanced for amino acids (balanced
protein) with Lys as reference amino acid and the other essential amino
acids kept in constant and balanced proportions relative to Lys. Lys was
expressed on a digestible basis. Dietary energy and other nutrients were
assumed to be at constant and adequate levels, for example meeting NRC
(1994) specifications. An overview of input and output for the economic
model is presented in Figure 1.
An Excel spreadsheet program, called Nutri-opt II, was developed to
facilitate the calculations of Lys level on technical performance (equations
[1]-[4]) and economical performance (equations [5]-[10]). Nutri-opt II runs
the calculations of gross margin for Lys levels increasing from 6.0 up to
13.0 g/kg in steps of 0.1 g/kg (70 Lys levels in total).
Whole broilers
Output
Carcass
Cut up
Input
Nutri-opt II
Whole broiler: whole broiler price
Carcass: carcass price
Cut up: breast meat + rest carcass price
Meat prices
Other input
Initial body weight + length of age period
Feed price
Technical model (Chapter 4)
Feed price as a function of dietary balanced
protein level; see Figure 5
- Gross margin as a function of
dietary balanced protein level
- Balanced protein level for
maximum gross margin
see Figure 4
- Gross margin as a function of
dietary balanced protein level
- Balanced protein level for
maximum gross margin
- Gross margin as a function of
dietary balanced protein level
- Balanced protein level for
maximum gross margin
Effect of dietary balanced protein level on:
- growth rate
- feed conversion
- carcass yield
- breast meat yield
see Figure 2

Chapter 5: An economic analysis
105
Figure 2. Broiler responses to dietary balanced protein level. Reference situation. Carcass yield
(g/g body weight) and breast meat yield (g/g carcass).
0.68
0.69
0.70
0.71
0.72
0.73
6 8 10 12
Balanced Protein Level (g dig. Lys/kg)
Carc
ass Y
ield
0.240
0.245
0.250
0.255
0.260
0.265B
reast
Meat
Yie
ld
carcass yield breast meat yield
55
60
65
70
75
80
5 7 9 11 13
Balanced Protein Level (g dig. Lys/kg)
Gro
wth
Rate
(g/d)
1.9
2.1
2.3
2.5
2.7
2.9
Feed C
on
vers
ion
growth rate feed conversion
Chapter 5: An economic analysis
106
Model input
Technical input Models were developed to simulate growth rate (g/d), feed
conversion, carcass yield (g/g live weight) and breast meat yield (g/g
carcass) of broilers as a response to dietary balanced protein level (Lys as a
reference) (Chapter 4). From Chapter 4, those equations were selected that
include significant variables only and in which Lys was expressed on a
digestible basis:
Growth rate )1(**02.0*98.0 ])*0564.08.10[*(759.0 ageLyseAA −−−−+= [1]
Feed conversion )1(**02.0*02.1 ])*716.0*0467.07.11[(*544.0 sexageLyseAA +−−−−−= [2]
Carcass yield )1(**02.0*98.0 ])*24.1*061.05.9[(*947.0 sexageLyseAA −−−−−+= [3]
Breast meat yield )1(**02.0*98.0 ])*83.0*102.02.12[(*524.0 sexageLyseAA −−−−−+= [4]
where: A is asymptotic performance level (for example, A is growth rate at a
Lys level that is higher than the Lys requirement for maximising growth
rate), Lys is digestible Lys level in the diet (g/kg) and age is average broiler
age for the relevant age period (d). Sex is expressed as 0 for females, 1 for
males and 0.5 for as hatched. Figure 2 gives an illustration of each of the
four broiler performance models (equations [1] to [4]). It was assumed that
nutritional responses during an age period are independent of previous
nutrition.
Prices and other input Feed price (€/100 kg) was defined as cost of the raw
materials. Several years of experience in Nutreco companies showed that the
relationship between feed price and dietary balanced protein level can
accurately be described by a quadratic model:
Feed price cLysbLysa ++= ** 2 [5]
where: Lys is dietary Lys level (g/kg), which is used as the indicator of
dietary balanced protein level. A, b and c are regression coefficients that
depend on the prices and quality of the raw materials in the feed.
Prices of live broilers, carcass, breast meat and rest carcass were in €/kg.
The other input was broiler weight at the start of the relevant age period
(initial weight; kg) and length of the age period (days).

Chapter 5: An economic analysis
107
Model output
The economic model calculates the effect of dietary balanced protein level
(Lys as a reference) on revenues, feed costs and, thereby, on gross margin
(Figure 3). From these data, the economic optimal Lys level (Lys level for
maximum gross margin; Lysecon) can be determined (Figure 3).
The effect of Lys on revenues (€/broiler) is calculated from the effect that
Lys has on broiler weight, carcass yield and breast meat yield:
Revenues whole broiler = BW * whole broiler price [6]
Revenues carcass = BW * carcass yield * carcass price [7]
Revenues cut up = BW * carcass yield * [breast meat yield * breast meat price +
(1 - breast meat yield) * rest carcass price] [8]
where: carcass yield and breast meat yield are predicted using the
equations [3] and [4]. BW is broiler weight at the end of the age period (kg).
The effect of Lys on BW is calculated from the effect that Lys has on growth
rate:
BW = IBW + growth rate/1000 * days [9]
where: growth rate is predicted using equation [1]. IBW is initial broiler
weight (kg) and days refer to the length of the age period (d).
The effect of Lys on feed cost (€/broiler) is calculated from the effect that
Lys has on growth rate, feed conversion and feed price:
Feed cost = growth rate/1000 * days * feed conversion * feed price/100 [10]
where: growth rate, feed conversion and feed price are predicted using the
equations [1], [2] and [5]. Gross margin (€/broiler) is calculated as the
difference between revenues and feed cost.

Fig
ure
3.
Th
e e
ffect
of
ba
lan
ced
pro
tein
level
in a
bro
iler
die
t on
reven
ues,
feed
cost
an
d,
there
by,
on
gro
ss m
arg
in p
er
bro
iler.
Lysecon i
s b
ala
nced
pro
tein
level fo
r m
axim
um
gro
ss m
arg
in.
Gro
ss m
arg
in /
bro
iler
Reven
ues/
bro
iler
Feed c
ost
/
bro
iler
Reven
ues
Feed c
ost
Gro
ss m
arg
in
Lys econ
Lys econ
Bala
nced p
rote
in level
Bala
nced p
rote
in level

Table
1.
Asym
pto
tic p
erf
orm
an
ce level 1 in
th
e r
efe
ren
ce s
itu
ati
on
an
d in
alt
ern
ati
ve s
itu
ati
on
s w
ith
dif
fere
nt
ages o
r sex
R
efe
ren
ce
Alt
ern
ati
ve:
low
er
age
Alt
ern
ati
ve:
hig
her
age
Alt
ern
ati
ve:
sex =
male
Alt
ern
ati
ve:
sex =
fem
ale
Age (d)
21-4
2
7-2
8
35-5
6
21-4
2
21-4
2
Sex
as h
atc
hed
as h
atc
hed
as h
atc
hed
male
fe
male
Gro
wth
rate
(g/d)
78.9
55.4
76.1
87.7
70.1
Feed c
on
vers
ion
1.9
2
1.5
2
2.3
7
1.8
7
1.9
8
Carc
ass y
ield
(g/g b
ody w
eig
ht)
0.7
10
0.6
86
0.7
25
0.7
16
0.7
04
Bre
ast
meat
yie
ld (g/g c
arc
ass)
0.2
64
0.2
51
0.2
76
0.2
63
0.2
66
Init
ial body w
eig
ht
(kg)
0.8
24
0.1
65
1.9
02
0.8
51
0.7
97
1A
sym
pto
tic p
erf
orm
an
ce level: v
ari
able
A in
equ
ati
on
s [1] to
[4] (s
ee t
ext)
; data
deri
ved f
rom
Hybro
(2003).

Table
2.
Eff
ect
of
bro
iler
age a
nd
sex o
n b
ala
nced
pro
tein
level fo
r m
axim
um
gro
ss m
arg
in (Lysecon) a
nd
th
e r
ed
ucti
on
in
gro
ss m
arg
in (∆
gro
ss m
arg
in) if
ba
lan
ced
pro
tein
level is
not
ad
apte
d t
o b
roiler
age o
r sex.
WH
OLE
BR
OIL
ER
1
CA
RC
AS
S 1
C
UT U
P 1
Lys
econ
(g/kg)
∆ g
ross m
arg
in 2
(€-c
en
ts/bro
iler)
Lys
econ
(g/kg)
∆ g
ross m
arg
in 2
(€-c
en
ts/bro
iler)
Lys
econ
(g/kg)
∆ g
ross m
arg
in 2
(€-c
en
ts/bro
iler)
Age
7-2
8 d
9.6
0.3
8
10.2
0.5
6
10.6
0.6
3
21-4
2 d
(re
fere
nce)
8.9
-
9.4
-
9.8
-
35-5
6 d
8.2
0.5
0
8.8
0.4
7
9.2
0.5
2
Sex
fem
ale
8.7
0.0
4
9.5
0.0
0
9.9
0.0
2
as h
atc
hed (re
fere
nce)
8.9
-
9.4
-
9.8
-
m
ale
9.0
0.0
2
9.5
0.0
0
9.8
0.0
0
1R
esu
lts a
re p
resen
ted s
epara
tely
depen
din
g o
n h
ow
bro
ilers
are
mark
ete
d: as w
hole
bro
ilers
, as c
arc
ass (sla
ugh
tere
d b
roilers
) or
as c
ut
up m
eat
part
s;
2R
edu
cti
on
in
gro
ss m
arg
in i
f bala
nced p
rote
in l
evel
is n
ot
ch
an
ged t
o L
ys
econ
fo
r th
e a
ltern
ati
ve a
ge o
r sex,
bu
t m
ain
tain
ed a
t Lys
econ f
or
the r
efe
ren
ce
sit
uati
on
.

Chapter 5: An economic analysis
111
MODEL SIMULATIONS
Calculations
Simulations were done for a reference situation (as defined below) as well
as for situations with alternative age, sex, meat prices or feed prices. For
all situations, the Lys level for maximum gross margin (Lysecon) was
determined (Figure 3). In addition, it was calculated how much gross
margin would be reduced (∆ gross margin) if, in the alternative situation,
not the optimal Lys level (Lysecon) is fed, but the Lys level that is optimal in
the reference situation. The calculation of ∆ gross margin can be explained
from Figure 4. First, gross margin as a function of Lys level is calculated
both for the reference situation and for the alternative situation (for
example, a higher broiler price). L1 is Lysecon for the reference situation,
whereas L2 is Lysecon for the alternative situation (Figure 4). The ∆ gross
margin if Lys is not adapted to the higher broiler price (L2 instead of L1) is
the difference in gross margin (at the alternative situation) at Lys = L2
(GM2) and at Lys = L1 (GM1).
Figure 4. Example of the calculation of extra profit (GM2-GM1) that results from adapting the
balanced protein level from the level that is optimal for the reference situation (L1) to the level
that is optimal for the new scenario with increased broiler price (L2). GM1 and GM2 refer to
gross margin at the new scenario, at L1 and L2, respectively.
Gross Margin (€/broiler)
1.1
1.3
1.5
1.7
6 8 10 12
Balanced Protein Level (g Lys/kg)
reference
situation
alternative
situation
GM2
GM1
L1 L2

Fig
ure
5.
Feed
pri
ce a
s a
fu
ncti
on
of
die
tary
ba
lan
ced
pro
tein
level
in t
he r
efe
ren
ce s
itu
ati
on
an
d i
n a
ltern
ati
ve f
eed
pri
ce s
itu
ati
on
s.
Va
ria
tion
in
feed
pri
ce l
evel
(fig
ure
5a
) a
nd
va
ria
tion
in
pri
ce o
f pro
tein
-ric
h r
aw
ma
teri
als
(fi
gu
re 5
b)
Va
ria
tion
in
feed
pri
ce w
as i
mit
ate
d b
y a
n i
ncre
ase o
r
decre
ase o
f th
e f
eed
pri
ce a
t a
ll p
rote
in l
evels
by 2
0 o
r 4
0%
of
the f
eed
pri
ce a
t Lys =
6.0
g/kg.
Va
ria
tion
in
pro
tein
-ric
h r
aw
ma
teri
als
wa
s i
mit
ate
d
by a
pro
tein
level d
epen
den
t in
cre
ase in
feed
pri
ce,
va
ryin
g f
rom
no in
cre
ase a
t 6
.0 g
/kg L
ys u
p t
o 1
0 o
r 2
0%
in
cre
ase a
t 1
3.0
g/kg L
ys.
Red
ucti
on
s
in p
rice o
f pro
tein
-ric
h r
aw
ma
teri
als
were
not
eva
lua
ted
as i
t re
su
lted
in
a c
on
sta
nt
or
decre
asin
g f
eed
pri
ce f
or
Lys l
evels
betw
een
6 a
nd
8 g
/kg,
wh
ich
is u
nlikely
to h
appen
in
pra
cti
se.
Feed P
rice (€/100 k
g)
10
15
20
25
30
35
68
10
12
Bala
nced P
rote
in L
evel (g
Lys/k
g)
refe
ren
ce
feed -
/-4
0%
feed -
/-2
0%
feed +
20%
feed +
40%
Feed P
rice (€/100 k
g)
18
20
22
24
26
28
68
10
12
Bala
nced P
rote
in L
evel (g
Lys/k
g)
refe
ren
ce
pro
tein
+20%
pro
tein
+10%
ab

Chapter 5: An economic analysis
113
The reference situation was defined as as hatched broilers of 21 to 42 d.
The related performance variables are presented in Table 1 and the dose-
response relationships for the reference situation are in Figure 2. Prices of
meat and feed for the reference situation are given in Table 3 and Figure 5,
respectively, and were based on actual prices in The Netherlands
(December, 2003).
Table 3. Effect of meat prices on Lys level for maximum gross margin (Lysecon) and the
reduction in gross margin (∆ gross margin) if Lys level is not adapted to
the alternative meat price 1
Price of
Relative to
reference
price
Actual price
(€/kg)
Lysecon
(g/kg)
∆ gross margin 1
(€-cents/broiler)
Whole broiler - 40% 0.42 8.4 0.23
- 20% 0.56 8.7 0.06
reference 0.70 8.9 -
+ 20% 0.84 9.0 0.01
+ 40% 0.98 9.2 0.08
Carcass - 40% 0.90 9.0 0.19
- 20% 1.20 9.2 0.03
reference 1.50 9.4 -
+ 20% 1.80 9.6 0.05
+ 40% 2.10 9.7 0.17
Cut up - 40% 2.10 / 0.78 2 9.4 0.22
- 20% 2.80 / 1.04 2 9.6 0.04
reference 3.50 / 1.30 2 9.8 -
+ 20% 4.20 / 1.56 2 10.0 0.07
+ 40% 4.90 / 1.82 2 10.2 0.22
1 Reduction in gross margin if Lys level is not changed to Lysecon for the alternative meat price, but
maintained at Lysecon for the reference meat price;
2 Prices of breast meat and rest carcass, respectively.

Chapter 5: An economic analysis
114
Details of the alternative age and sex situations are given in Table 1. In the
alternative meat price situations, meat prices were 20 or 40% higher or
lower than in the reference situation (Table 3). Two alternative feed price
scenarios were studied: variation in feed price level (Figure 5a) and
variation in price of the protein-rich raw materials, for example soy bean
meal and synthetic amino acids (Figure 5b).
Results
In the reference situation, Lys levels for maximum gross margin (Lysecon)
are 8.9 g/kg for whole broilers, 9.4 g/kg for carcass and 9.8 g/kg for cut
up.
Feeding broilers that will be sold as cut up with the optimal grower diet
(21-42 d) for whole broilers (Lys = 8.9 g/kg) instead of the optimal grower
diet for cut up (Lys = 9.8 g/kg) would decrease gross margin over the
grower period with 1.45 €-cents per broiler. Similarly, feeding broilers that
will be sold as whole broilers with the optimal grower diet for cut up (Lys =
9.8 g/kg) instead of the optimal grower diet for whole broilers (Lys = 8.9
g/kg) would decrease gross margin over the grower period with 0.85 €-
cents per broiler. These data show that economic relevant differences exist
in Lysecon for broilers marketed as whole broilers, carcass or cut up,
respectively.
Table 2 shows the effect of broiler age on Lysecon, and the reduction in
gross margin (∆ gross margin) if Lys level is not adapted to broiler age. For
young broilers (age = 7-28 d), Lysecon was higher than for the reference
situation (age = 21-42 d). For example for ‘whole broilers’, Lysecon for young
broilers was 9.6 g/kg compared to 8.9 g/kg for the reference situation
(Table 2). If, instead of the optimal diet (Lys = 9.6 g/kg), the reference diet
(Lys = 8.9 g/kg) is used for young broilers, gross margin would be reduced
by 0.38 €-cents/broiler (∆ gross margin for ‘whole broilers’; Table 2). For
carcass and cut-up, ∆ gross margins were 0.56 and 0.63 €-cents/broiler,
respectively. For older broilers (age = 35-56 d), Lysecon was lower than for
the reference situation and ∆ gross margins were between 0.47 and 0.52 €-
cents/broiler (Table 2).
The differences in Lysecon for males and females were 0.3 g/kg or less
(Table 2). Consequently, the effects of sex on ∆ gross margin were
negligible. The effects of age on Lysecon were 5 to 10 times the effects of sex
on Lysecon. Effects of age and sex on Lysecon and ∆ gross margin were
independent of how the broilers are marketed (Table 2).

Chapter 5: An economic analysis
115
The effects of meat prices on Lysecon and ∆ gross margin are given in Table
3. A 20% increase or decrease in meat prices resulted in minor effects on
Lysecon; Lysecon levels differed 0.1 or 0.2 g/kg from the Lysecon levels at the
reference situation (Table 3). As a result, effects on ∆ gross margin were
only 0.07 €-cents/broiler or less. The effect of a 40% increase (or decrease)
in meat prices on ∆ gross margin was more than three times the effect of a
20% increase (or decrease) in meat prices (Table 3). In other words:
although meat price affects Lysecon about proportionally, meat price affects
∆ gross margin more than proportionally. This disproportionality is a
consequence of the ‘parabolic’ relationship between gross margin and Lys
level (Figure 3).
Feed price level had negligible effects on Lysecon and ∆ gross margin (Table
4). That feed price level has negligible effects on Lysecon can be explained
from Figure 3. Lysecon is the Lys level at which the difference between
revenues and feed cost is maximal (Figure 3). Feed cost is calculated as
feed intake multiplied by feed price. Feed intake, which is calculated from
growth rate and feed conversion, is about constant in the range of Lys
levels in which Lysecon is always determined in the present study (between
8 and 11 g/kg) (Chapter 4). Therefore, in this range of Lys levels where
feed intake is about constant, an increase in feed price increases feed cost
with a fixed amount, independent of Lys level. Consequently, in this range
of Lys levels, the Lys level at which the difference between revenues and
feed costs is maximal (=Lysecon) is not affected by feed price level.
An increase in price of protein-rich raw materials decreased Lysecon
strongly and about proportionally (Table 4). The effect was independent of
how the broilers are marketed (whole broilers, carcass or cut up). This Lys
level dependent increase in feed price (Figure 5b) results in a Lys level
dependent increase in feed cost. Revenues are not affected by price of
protein-rich raw materials. Consequently, the Lys level at which the
difference between revenues and feed cost is maximal (=Lysecon ) becomes
lower than for the reference situation.
In summary, the model calculations revealed that broiler age and price of
protein-rich raw materials (+ 20%) have the largest effects on Lysecon (> 0.6
g/kg) and on ∆ gross margin (> 0.38 €-cents/broiler). A large change (40%)
in meat price and a 10% price increase of protein-rich raw materials have
only small effects on Lysecon (> 0.3 g/kg) and on ∆ gross margin. Effects of
sex, feed price level and small changes in meat price (20%) on Lysecon and ∆
gross margin were negligible.

Table
4.
Eff
ect
of
feed
pri
ce level a
nd
of
pri
ces o
f pro
tein
-ric
h r
aw
ma
teri
als
on
ba
lan
ced
pro
tein
level fo
r m
axim
um
gro
ss m
arg
in (Lys
econ)
an
d t
he r
ed
ucti
on
in
gro
ss m
arg
in (∆
gro
ss m
arg
in) if
th
e b
ala
nced
pro
tein
level is
not
ad
apte
d t
o t
he a
ltern
ati
ve f
eed
pri
ce s
cen
ari
o.
WH
OLE
BR
OIL
ER
1
CA
RC
AS
S 1
C
UT U
P 1
Lys
econ
(g/kg)
∆ g
ross m
arg
in 2
(€-c
en
ts/bro
iler)
Lys
econ
(g/kg)
∆ g
ross m
arg
in 2
(€-c
en
ts/bro
iler)
Lys
econ
(g/kg)
∆ g
ross m
arg
in 2
(€-c
en
ts/bro
iler)
Feed p
rice level
3
-/-
40%
8.8
0.0
3
9.4
0.0
0
9.8
0.0
0
-/
- 20%
8.8
0.0
1
9.4
0.0
0
9.8
0.0
0
re
fere
nce
8.9
-
9.4
-
9.8
-
+ 2
0%
8.9
0.0
0
9.5
0.0
1
9.9
0.0
1
+ 4
0%
9.0
0.0
0
9.5
0.0
1
9.9
0.0
2
Pri
ce o
f pro
tein
-ric
h
refe
ren
ce
8.9
-
9.4
-
9.8
-
raw
mate
rials
3
+ 1
0%
8.4
0.3
4
9.1
0.1
8
9.5
0.1
6
+ 2
0%
8.0
1.1
6
8.7
0.7
5
9.2
0.7
0
1
Resu
lts a
re p
resen
ted s
epara
tely
depen
din
g o
n h
ow
bro
ilers
are
mark
ete
d: as w
hole
bro
ilers
, as c
arc
ass (sla
ugh
tere
d b
roilers
) or
as c
ut
up m
eat
part
s;
2
Redu
cti
on
in
gro
ss m
arg
in i
f bala
nced p
rote
in l
evel
is n
ot
ch
an
ged t
o L
ys
econ
fo
r th
e a
ltern
ati
ve f
eed p
rice s
cen
ari
o,
bu
t m
ain
tain
ed a
t Lys
econ f
or
the
refe
ren
ce s
itu
ati
on
. Feed p
rice (€/100kg) in
th
e r
efe
ren
ce s
itu
ati
on
= 0
.1034*L
ys
2 –
1.0
513 *
Lys +
20.8
3;
3
For
descri
pti
on
of sit
uati
on
s w
ith
alt
ern
ati
ve feed p
rice level or
alt
ern
ati
ve p
rice o
f pro
tein
-ric
h r
aw
mate
rials
: see F
igu
re 5
.

Chapter 5: An economic analysis
117
DISCUSSION
The economic model
Most research in broiler nutrition concentrates on maximising broiler
performance while economic factors are often ignored. The strength of the
model developed in the present study is that it enables calculation of the
economic optimal protein levels. This can help nutritionists in formulating
diets for maximum profit or, at least, enables calculation of the extra
investment that is made by formulating diets for maximum broiler
performance instead of maximum profit (see below). Another strength is
that the model considers how broilers are marketed; as whole broilers,
carcass or cut up. The model has a weak point in that it assumes that
each gram difference in broiler weight (or weight of carcass, breast meat,
feed intake, etc.) at the end of an age period results in the same difference
at slaughter age. More data are needed to investigate the validity of this
assumption. It should be noted, however, that not making this assumption
would make the model much more complex as the model should then
consider the issue of compensatory performance. Another weak point of
the model may be that it does not consider the (environmental) cost of
nitrogen excretion. The relevancy of this subject depends on local
conditions, for example density of animal production or local regulations.
The present model was developed for more general application and did
therefore not consider this subject.
Just a few other models were published that evaluate the economics of
broiler nutrition, for example by Hurwitz et al. (1985), Gonzalez et al.
(1992), Pack and Schutte (1995) and Fisher and Gous (2000). Pack and
Schutte (1995) developed a model to calculate economic optimal Met + Cys
levels from broiler response data in feed conversion and breast meat yield.
Pack and Schutte (1995) concluded that for selling cut up broilers, higher
Met + Cys levels are needed to maximise profitability than for selling whole
broilers. They also stated that prices of feed and breast meat affect the
economic optimal Met + Cys levels only slightly. The conclusions of Pack
and Schutte (1995) about the economics of Met + Cys levels are similar to
the conclusions of the present study about the economics of balanced
protein level.
Lysecon versus Lysperf
The economic model enables calculation of the balanced protein level at
which gross margin is maximal (Lysecon). However, it is common practise

Chapter 5: An economic analysis
118
among nutritionists to formulate diets that contain higher levels of
balanced protein in order to maximise broiler performance (Lysperf). Lysperf
for a grower diet (21-42 d) in the reference situation was 10.6 g/kg,
calculated as Lys requirement for feed conversion (Chapter 4). Lysecon for
the grower diet in the reference situation was 8.9 g/kg for whole broilers.
In this situation, feeding for maximum broiler performance (Lysperf = 10.6
g/kg) instead of maximum profit (Lysecon = 8.9 g/kg) decreases gross
margin over the grower period by 2.65 €-cents per broiler. At higher prices
of protein-rich raw materials (+20%), feeding for maximum broiler
performance instead of maximum profit (Lysecon = 8.0 g/kg; Table 3) would
decrease profitability over the grower period even more (7.59 €-cents per
broiler). For a typical broiler enterprise slaughtering 1 million broilers per
week, each €-cent difference per broiler increases gross margin by 10.000
€ per week. Thus, formulating diets for maximum profit instead of
maximum broiler performance can result in considerable increases in
profitability, particularly if the difference between Lysperf and Lysecon is more
than 1.0 g/kg.
Implications
The results of this study imply that formulating diets either for maximum
profit or for maximum performance results in different diets. Moreover,
feeding for maximum profit instead of maximum broiler performance can
strongly increase profitability of a broiler production enterprise. Once diets
are formulated for maximum profit, only changes in age period, price of
protein-rich raw materials and large changes in meat prices necessitate
adaptation of the dietary balanced protein levels to maintain maximum
profitability. Finally, the model simulations showed that for maximum
profitability, dietary balanced protein level should depend on how the
broilers are marketed; as whole birds, carcass or cut-up.
ACKNOWLEDGMENTS
We gratefully acknowledge the critical comments of several Nutreco
colleagues regarding this study.
REFERENCES
Fisher, C. and R. M. Gous, 2000. Optimising nutrient density in broiler feeds. Proceedings of
the XXI World’s Poultry Congres, Montreal, digital version.
Gonzalez, M. J., G. M. Pesti and J. H. Dorfman, 1992. Formulating feed for minimum cost
versus maximum profits. Pages 87-99 in: Proceedings of the 1992 Georgia nutrition
conference for the feed industry, Atlanta, USA.

Chapter 5: An economic analysis
119
Hurwitz, S., H. Talpaz and P. E. Waibel, 1985. The use of simulation in the evaluation of
economics and management of turkey production: dietary nutrient density,
marketing age and environmental temperature. Poult. Sci. 64:1415-1423.
Hybro, 2003. Hybro G+ broiler performance. Edition 04.2003, Hybro B.V., Boxmeer, The
Netherlands.
NRC, 1994. Nutrient requirements of poultry. Ninth revised edition, National Academy Press,
Washington, D.C., USA.
Pack, M. and J. B. Schutte, 1995. Sulfur amino acid requirement of broiler chicks from
fourteen to thirty-eight days of age. 2. Economic evaluation. Poult. Sci. 74:488-493.


General Discussion
Physiologists are quite good at inventing reasons why some number is
what it is observed to be, but considerably less good at predicting what it
will be in the next case.
G.C. Emmans
General Discussion
122
The results of the studies described in the present thesis were discussed
extensively in the discussion sections of each Chapter, and related to the
objective in each Chapter. The contribution of each study to the overall
objective of the dissertation was not yet reviewed. Therefore, the aim of this
General Discussion is to evaluate to what extent the overall objective of this
thesis is accomplished. Firstly, the contribution of the results of the first
experiment, as described in Chapters 1 and 2, to existing broiler growth
models is evaluated. It is then argued why existing growth models are less
appropriate to realise the dissertation objective than was thought at the
beginning of this study. Subsequently, it is discussed how the new
developed growth model is better fit to fulfil the aim of the dissertation. An
example is also given on how this model can be applied in practice. Finally,
an overview is presented of the conclusions, implications and suggestions
for further research.
The overall objective of this thesis was to develop a growth model for broiler
chickens that could be easily used by practical nutritionists. The model
should facilitate the selection of feeding strategies (in terms of dietary protein
and energy) that results in the desired body composition of broilers while
minimizing cost. A description of the genotype of a broiler chicken should be
an input variable for the model.
CONTRIBUTION TO EXISTING BROILER GROWTH MODELS
The studies described in Chapters 1 and 2 were designed to validate two
crucial theories that are commonly applied in growth simulation models.
The first tested theory states that, at limiting protein intakes, protein
deposition rate is independent of energy intake (Chapter 1). According to
the other theory, fat-free body composition is independent of nutrition
(Chapter 2).
Protein deposition rate
Several growth simulation models for pigs are based on the assumption
that dietary protein (or amino acids) is preferentially used for protein
deposition, unless energy availability or other factors (genotype or
environment) become limiting (Whittemore and Fawcett, 1976; Moughan
and Verstegen, 1988). It is postulated that, where protein intake is
limiting, additional energy intake will not enhance protein deposition rate.
The same hypothesis is used in growth simulation models for broilers (for
General Discussion
123
example in the EFG-model; Emmans, 1981), although it is hardly validated
for this species.
The experiment described in Chapter 1 demonstrates indeed that, at
limiting protein intake, additional energy intake has generally no effect on
protein deposition rate in broilers. In this way, the experiment gives a more
scientific basis to an important theory included in a broiler growth
simulation model of about two decades ago (Emmans, 1981). In addition,
the experiment in Chapter 1 supplies data on efficiency of protein
utilization for protein deposition in two body weight ranges. Moreover, the
experiment provides quantitative information on the use of energy for
protein and lipid deposition in the carcass and organs fractions. These
data on protein and energy utilization can be used to improve the accuracy
of the protein and energy parameters in a broiler growth model.
Fat-free body composition
It is assumed in several growth models, that the relationships between
water and protein, and between ash and protein, in the body of growing
broiler chickens are independent of nutrition (Emmans, 1981; Black et al.,
1986). This theory was not supported by the study described in Chapter 2.
It was concluded that simulation of chemical body composition in broilers
solely based on protein deposition might be accurate in case of ad libitum
access to balanced diets, but can induce systematic errors in the
simulations in case of low feed intake levels or sub-optimal protein to
energy ratios in the diet. Thus, for growth simulation under limiting
nutritional conditions an alternative theory on water and ash growth in
broilers should be developed. It should be noted, however, that any
alternative theory would probably miss the attractive simplicity of the basic
theory that fat-free body composition is independent of nutrition.
The study described in Chapter 2 delivered also estimates of the allometric
relationships between water and protein, and between ash and protein, in
the body of broiler chickens. It was shown, for example, that ash is at
constant proportion of 15% of protein. The model of Emmans (1981)
calculates ash as 16% of protein. The allometric relationship between
water and protein in our study also differed from the one used by Emmans
(1981). Thus, estimates of the allometric relationships by the present study
can be used to update parameters in broiler growth models that include
such allometric relationships.
During the present project, and for reasons discussed below, it was
decided that mechanistic growth models in general are less appropriate to
accomplish the dissertation objective. Therefore, the modifications that

General Discussion
124
should be made in the EFG-model (Emmans, 1981) or other mechanistic
growth models for broiler chickens (for example, King, 2001), given the
results of the experiments in Chapters 1 and 2, are not specified further.
Protein-free energy
An additional remark should be made on the definition of dietary energy in
the experiments described in Chapters 1 and 2. In these experiment,
dietary energy was defined as protein-free energy, which is energy coming
from carbohydrates and fats only (Gerrits et al, 1996). This would make
the two experimental variables (daily intakes of dietary energy and protein)
independent of each other. Strictly speaking, this measure was effective
since protein-free energy and protein are independent nutritional variables.
However, it was not effective in solving the more important nutritional
problem of dietary protein being unavoidably confounded with dietary
energy available for maintenance and growth. As discussed in Chapter 1,
part of the dietary protein is inevitably oxidised, thereby increasing the
amount of energy available for maintenance and growth. Another
disadvantage of defining energy as protein-free energy is that it is an
uncommon energy scale in nutritional science in general and in poultry
nutrition in particular. Consequently, the interpretation of the experiment
(in terms of validation of nutritional theory) and the application to the
practice of poultry nutrition is more complicated than if dietary energy
would have been defined in a more common way, for example as AMEn. It
can be concluded, therefore, that the advantages of defining dietary energy
as protein-free energy instead of AMEn are less important than the
disadvantages. The study described in Chapters 1 and 2 could have been
done well with energy defined as AME instead of protein-free energy, like
was done in studies of similar design with pigs (De Greef, 1992; Bikker,
1994).
LIMITATIONS OF EXISTING MECHANISTIC MODELS
The aim of our investigations was to develop a growth model for broiler
chickens that could be easily used by practical nutritionists. In the
General Introduction, it was argued that this model should be a
mechanistic model. Mechanistic models have the advantage that these are
more generally valid than empirical models (Black, 1995). Mechanistic
models have a better change to be valid for extrapolation than empirical
models, provided that the mechanisms of growth are represented in a
correct way. In addition, mechanistic models can also include a theory on
how broiler genotype affects nutritional responses (Emmans, 1981), which
was a condition in the objective of this dissertation. However, during this

General Discussion
125
project we became more convinced that, if the final objective of the model
is to serve as a tool for broiler nutritionists, existing mechanistic models do
have two major limitations.
The first limitation concerns the type of body composition that is predicted.
Mechanistic growth models until now generally predict the chemical body
composition, defined in terms of protein, lipid, ash and water content of
the body. Validated theories are available to predict the total chemical body
composition from nutritional inputs (Chapters 1 and 2). For the practice of
broiler meat production, however, it is not the chemical body composition
but particularly the physical body composition (yields of carcass and
breast meat, for example) that is of importance. In several modelling
studies the partitioning of nutrients over physical body constituents was
investigated (Bikker, 1994; Weis et al., 2004; Chapters 1 and 2). However,
there are no mechanistic theories available yet that predicts physical body
composition from chemical body composition or directly from nutritional
inputs (De Greef, 1995). Moreover, development of such a theory would be
more complex than for chemical body composition. For chemical body
composition, deposition of protein and energy (in protein and lipid) in the
body can be predicted from protein and energy in the diet. Thus, input and
output for such a theory can be stated on the same scales. This is not the
case for a theory that predicts physical body composition from nutrition.
The second limitation concerns the prediction of feed intake. Mechanistic
models often predict animal performance from daily nutrient intakes
(Moughan et al., 1987; Zoons et al., 1991) and not directly from nutrient
concentrations in the diet. This means that to apply such models for ad
libitum fed animals (like broilers usually are in practice) an additional
model would be needed to predict feed intake. The problem is that feed
intake is difficult to predict accurately (Emmans, 1995), whereas the
accuracy of model predictions is influenced largely by the accuracy of feed
intake estimates (Black and De Lange, 1995). The EFG-model is a
mechanistic model that predicts feed intake (Emmans, 1981). However,
although the theory on feed intake in this model has some experimental
support (Emmans, 1987), it has not been extensively tested for broiler
chickens.
Thus, given the objective to develop a relevant tool for broiler nutritionists
(physical body composition and appropriate for ad libitum feeding), existing
mechanistic models are less fit to be used. On the other hand, models that
are fully empirical are not appropriate as well, given the limited validity of
this type of models (Black, 1995). Therefore, an intermediate type of model
was developed in this study (Chapter 4). It is discussed below how this new

General Discussion
126
model, to some extent, combines the advantages of mechanistic and
empirical models whereas it avoids some of the disadvantages of both
types of models.
THE NEW MODEL IN RELATION TO THE DISSERTATION AIM
As mentioned before, there is no mechanistic theory available to predict
the physical body composition of broilers from feed intake and diet
composition. Therefore, the new model directly links physical body
composition (carcass and breast meat yield) to dietary protein level. In this
respect, the new model is empirical and not mechanistic. At the same time,
and for two reasons, the new model is more generally valid than fully
empirical models, like for example a dose-response curve obtained in a
feeding trial (Chapter 3). Firstly, the absolute level of broiler performance is
input instead of output of the new model. The relative responses that are
predicted by the model appeared to be independent of the absolute
performance level. Thus, the model predictions seem valid for a range of
broiler performance levels. Secondly, the model is made more generally
valid than fully empirical models by including additional variables: age, sex
and year (Chapter 4).
Apart from the difficulties regarding physical body composition, most
mechanistic models have the problem of accurately predicting ad libitum
feed intake. Although the new model is developed specifically to simulate
ad libitum feeding conditions, it does not directly predict feed intake. The
new model predicts responses of ad libitum fed broilers to dietary protein
level in terms of growth rate and feed conversion, but not for feed intake.
Obviously, the response in feed intake can be calculated backwards from
the predicted responses in growth rate and feed conversion. The advantage
of this approach is that predicting dose-responses in growth rate and feed
conversion to dietary protein is less complicated than predicting the same
responses in feed intake. The mentioned responses in growth rate and feed
conversion have a relatively simple exponential shape, whereas the shape
of response in feed intake is much more complicated to describe
mathematically (Figure 1).

General Discussion
127
Figure 1. Shape of broiler responses to dietary balanced protein level, derived from the model
on digestible Lys (Chapter 4). Responses in growth rate and feed conversion have a relatively
simple exponential shape, wheras the shape of the response in feed intake is much more
complicated to describe mathematically.
55
60
65
70
75
80
5 7 9 11 13
Balanced Protein Level (g dig. Lys/kg)
Gro
wth
Rate
(g/d)
1.9
2.1
2.3
2.5
2.7
2.9
Feed C
on
vers
ion
growth rate feed conversion
130
135
140
145
150
155
160
5 7 9 11 13
Balanced Protein Level (g dig. Lys/kg)
Feed In
take (g/d)
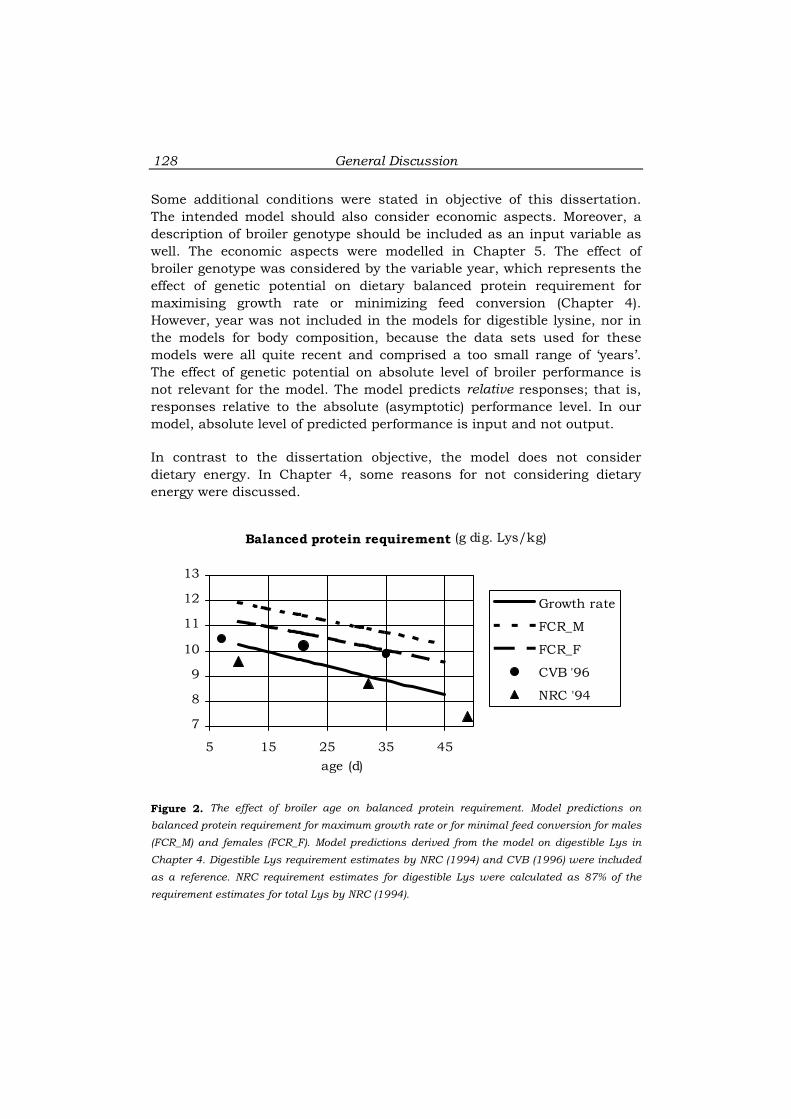
General Discussion
128
Some additional conditions were stated in objective of this dissertation.
The intended model should also consider economic aspects. Moreover, a
description of broiler genotype should be included as an input variable as
well. The economic aspects were modelled in Chapter 5. The effect of
broiler genotype was considered by the variable year, which represents the
effect of genetic potential on dietary balanced protein requirement for
maximising growth rate or minimizing feed conversion (Chapter 4).
However, year was not included in the models for digestible lysine, nor in
the models for body composition, because the data sets used for these
models were all quite recent and comprised a too small range of ‘years’.
The effect of genetic potential on absolute level of broiler performance is
not relevant for the model. The model predicts relative responses; that is,
responses relative to the absolute (asymptotic) performance level. In our
model, absolute level of predicted performance is input and not output.
In contrast to the dissertation objective, the model does not consider
dietary energy. In Chapter 4, some reasons for not considering dietary
energy were discussed.
Figure 2. The effect of broiler age on balanced protein requirement. Model predictions on
balanced protein requirement for maximum growth rate or for minimal feed conversion for males
(FCR_M) and females (FCR_F). Model predictions derived from the model on digestible Lys in
Chapter 4. Digestible Lys requirement estimates by NRC (1994) and CVB (1996) were included
as a reference. NRC requirement estimates for digestible Lys were calculated as 87% of the
requirement estimates for total Lys by NRC (1994).
Balanced protein requirement (g dig. Lys/kg)
7
8
9
10
11
12
13
5 15 25 35 45
age (d)
Growth rate
FCR_M
FCR_F
CVB '96
NRC '94
General Discussion
129
EXAMPLE OF APPLYING THE MODEL IN PRACTICE
The model described in Chapter 4 predicts broiler responses to Dietary
Balanced Protein level (DBP). According to this model, broiler responses to
DBP can be seen as consisting of three parts: (i) the asymptotic
performance level, (ii) the DBP requirement for maximum performance and
(iii) the shape of the dose-response curve (that is, the rate of decrease in
broiler performance if DBP is decreased below the DBP requirement).
Asymptotic performance level is input for the model. It is taken from
knowledge of maximum performance in practice. DBP requirement and the
shape of the dose-response curve are predicted by the model. The model
predictions on DBP requirement (g dig. Lys/kg) for growth rate and feed
conversion are presented in Figure 2. As a reference, recommendations on
Lys requirement by NRC (1994) and CVB (1996) are also included in Figure
2. The shape of the dose response curves for growth rate and feed
conversion ratio, according to the model, are presented in Figure 3.
The dose-response relationships predicted by the model were used to
analyse the economic aspects of DBP in broilers (Chapter 5). In addition,
the model can be easily used by nutritionists to predict what would
happen to broiler performance if modifications were made to the DBP level.
This can explained most easily by means of an example:
Example
A nutritionist considers decreasing the DBP level in the broiler diets, for
example due to high prices of soy bean meal. Currently, the nutritionist is
feeding male broilers a grower diet (21-42 days of age) with a DBP level of 10 g
dig. Lys/ kg. He knows that the feed conversion over the grower period, using the
present diet, is on average 1.90. The nutritionist plans to decrease DBP level to
8.5 g dig. Lys/kg. He wants to know what feed conversion he can expect with
this new diet. The model predictions, as summarized in Figures 2 and 3, can
easily solve the problem of the nutritionist.
Broiler age: The average broiler age is ((21+42)/2) = 31.5 days of age.
DBP requirement: DBP requirement for minimising feed conversion of male
broilers of 31.5 days of age is about 10.9 g Lys/kg (Figure 2).
Present diet: The present diet contains 10.0 g Lys/kg, which is 0.9 g Lys/kg
(10.9 -/- 10.0) below the requirement (RQ). The relative feed conversion at RQ–/-
0.9 is about 103.3% (Figure 3).

General Discussion
130
New diet: The new diet contains 8.5 g Lys/kg, which is 2.4 g Lys/kg (10.9 -/-
8.5) below the requirement (RQ). The relative feed conversion at RQ–/-2.4 is
about 107.5% (Figure 3). The expected feed conversion at the new diet can now
be calculated as 1.90 * (107.5/103.3) = 1.98.
Figure 3. Broiler responses in growth rate and feed conversion (relative the asymptotic
performance level (=100%)) to dieary balanced protein level (relative to the balanced protein
requirement (RQ) for maximum growth rate or minimal feed conversion). These graphs are
derived from the model on digestible Lys in Chapter 4 (model parameter C).
The problem in this example concerns a basic nutrition-related question,
which cannot be answered by, for example, NRC (1994) and CVB (1996)
recommendations. NRC and CVB recommendations (Figure 2) supply no
information about differences in Lys requirement between sexes, or about
differences in Lys requirement for optimising growth rate, feed conversion,
carcass yield and breast meat yield, respectively. In addition, CVB (1996)
recommendations, which are already higher than NRC (1994)
recommendations (Figure 2), seems too low for modern broilers (Wijtten et
Broiler performance
relative to maximum performance level (=100%)
85
90
95
100
105
110
+1.0+0.5RQ-/-0.5-/-1.0-/-1.5-/-2.0-/-2.5
Balanced Protein Level (g dig. Lys/kg)
(relative to balanced protein requirement (RQ))
growth rate feed conversion

General Discussion
131
al., 2001; Lemme et al., 2003). Another limitation is that NRC (1994)
supplies no information on what happens to broiler performance if DBP is
decreased below the requirement (= shape of the dose response curve).
CVB (1996) presents information on the shape of dose response curves,
but only for single amino acids and not for DBP levels.
In conclusion, the model gives an update on DBP requirements for modern
broilers. This knowledge on DBP requirements is more detailed than NRC
(1994) and CVB (1996) recommendations. In addition, the model supplies
quantitative information on broiler performance at DBP levels below the
DBP requirement. To our knowledge, it is the first time that this latter
information is based on more than one experiment.
CONCLUSIONS AND IMPLICATIONS
The following main conclusions and implications follow from the research
described in this dissertation:
• At limiting protein intake, additional energy intake has generally no
effect on protein deposition rate in the body of broilers (Chapter 1).
The related theory, which was initially developed for pigs, can thus
be applied in broiler growth models as well.
• Fat-free body composition at a certain fat-free body weight is
affected by feed intake level and by the protein to energy ratio in
the diet (Chapter 2). This means that the independence of fat-free
body composition from nutrition is not a valid assumption for
broiler growth models.
• In broilers, ash weight is at a constant proportion of 15% of protein
weight. With increasing protein weights, the amount of water per
unit of protein decreases continuously; the allometric coefficient
being 0.945 (Chapter 2). These facts are relevant to calibrate growth
model parameters for modern broiler breeds.
• Broiler responses to dietary balanced protein (DBP) level depend on
previous protein nutrition (Chapter 3). This suggests that DBP
levels in grower and finisher diets should not be optimised
independently, but simultaneously.
• The shape of dose-response curves describing broiler performance
at varying DBP levels seems independent of the absolute level of
broiler performance and of broiler age, sex and genetic potential

General Discussion
132
(Chapter 4). This constant shape of response, in combination with
data on the DBP requirement (predicted by the model) and on the
absolute level of performance (estimated by the model user himself)
makes it possible to construct tailor-made dose-response curves
without actual experimentation.
• DBP requirement for minimising feed conversion is 10 to 20%
higher than for maximising growth rate or breast meat yield, and
more than 30% higher than for maximising carcass yield (Chapter
4). DBP requirement for minimising feed conversion is higher than
the Lys levels recommended by NRC (1994) and CVB (1996)
(General Discussion). Thus, if the aim is to maximise broiler
performance, higher amino acid levels are needed than suggested
by NRC (1994) and CVB (1996).
• The shape of the dose-response curves in growth rate and feed
conversion to DBP level is mathematically less complicated than
the shape of the dose-response in feed intake to DBP level (General
Discussion). This implies that it is easier to calculate the responses
in feed intake from the responses in growth rate and feed
conversion, than to model the responses in feed intake to DBP level
directly.
• Formulating diets for either maximum profit or maximum broiler
performance results in different DBP levels (Chapter 5).
Formulating for maximum profit instead of maximum broiler
performance may increase the profitability of a broiler production
enterprise.
• The economic optimal DBP level for slaughtered broilers (not cut
up) is lower than for cut up broilers, but higher than for live
broilers (Chapter 5). This implies that for maximising profitability,
DBP level should depend on how the broilers are marketed.
RECOMMENDATIONS FOR FURTHER RESEARCH
It can be concluded that the research described in this thesis realised the
general objective to a large extent. Nevertheless, further research would be
useful to validate the new model by means of independent dose-response
studies; that is, dose-response studies not used for the development of the
model. In Figure 4, simulations by the new model are compared with
independent data from an experiment with male Hybro-G broilers
(unpublished data from Nutreco Poultry & Rabbit Research Centre).

General Discussion
133
Figure 4. Broiler responses to dietary balanced protein level. Simulations by the new model
compared with independent data (♦) from an experiment with male Hybro-G broilers. Growth
rate and feed conversion responses during 21 to 35 days of age. Carcass yield (g/g body
weight) and breast meat yield (g/g carcass) responses during 21 to 49 days of age.
The experimental data show variation among treatments that cannot be
explained by the DBP level, particularly for the carcass and breast meat
yield responses (Figure 4). This illustrates that it is difficult to obtain a
reliable estimate of the shape of dose-response curves by means of just one
or very few data sets. Consequently, it is impossible to validate the new
model, which was based on 27 data sets from nine independent studies, by
one experiment. Validation of the new model requires a set of dose-
response experiments, including a wide range of DBP levels, with broilers
varying in age, sex and genetic potential. Such experiments would also
make it possible to include year as a variable in the models for digestible
lysine as well as in the models for body composition.
Further research to investigate important assumptions in the model would
be valuable as well. For example, on the hypothesis that difference in
broiler weight at the end of an age period is maintained until slaughter
age. The assumption that nutritional responses during an age period are
Gro wth ra te (g/d)
87
88
89
90
91
92
93
8 9 10 11
Balanced P ro te in Leve l (g dig. Lys /kg)
F e e d c o nv e rs io n
1.56
1.60
1.64
1.68
1.72
8 9 10 11
Balanced P ro te in Leve l (g dig. Lys /kg)
C a rc a s s yie ld
84.5
85.0
85.5
86.0
8.0 8.5 9.0 9.5 10.0
Balanced P ro te in Leve l (g dig. Lys /kg)
B re a s t m e a t yie ld
21.0
21.5
22.0
22.5
23.0
8.0 8.5 9.0 9.5 10.0
Balanced P ro te in Leve l (g dig. Lys /kg)

General Discussion
134
independent of previous nutrition is possibly an oversimplification
(Chapter 3). Another aspect that deserves further attention is the possible
difference in DBP requirement among commercial broiler breeds. One of
our experiments showed, for example, that DBP requirement might be
positively correlated with genetic potential for meat yield (Eits, 2001, Table
1 in Chapter 4).
Where models are intended to be used as a practical tool for nutritionists,
one should be aware that further development of a model would not
automatically make the model better fit for its aim. Any extensions to the
model would make the model probably more complex, thereby running the
serious risk that the model will not be applied in practice at all (Hilhorst,
1992). Moreover, any possible improvements in the model would require
additional research time and money without giving the final answer, since
the model would remain, by definition, a simplification of the nutritional
reality. For those reasons, it is believed that tackling potential problems
during implementation of the model predictions is of higher practical
importance than further developing the model itself.
REFERENCES
Bikker, P., 1994. Protein and lipid accretion in body components of growing pigs: effects of
body weight and nutrient intake. Ph.D. Thesis, Wageningen University, Wageningen,
The Netherlands.
Black, J.L., 1995. Approaches to modelling. Pages 11-22 in: Modelling growth in the pig. P. J.
Moughan, M. W. A. Verstegen and M. I. Visser-Reyneveld, eds. Wageningen Press,
Wageningen, The Netherlands.
Black, J. L., R. G. Campbell, I. H. Williams, K. J. James and G. T. Davies, 1986. Simulation of
energy and amino acid utilisation in the pig. Res. Dev. Agric. 3:121-145.
Black, J. L. and C. F. M. De Lange, 1995. Introduction to the principles of nutrient
partitioning for growth. Pages 33-45 in: Modelling growth in the pig. P. J. Moughan,
M. W. A. Verstegen and M. I. Visser-Reyneveld, eds. Wageningen Press, Wageningen,
The Netherlands.
CVB, 1996. Aminozurenbehoefte van leghennen en vleeskuikens. CVB-documentatierapport
nr. 18. Centraal Veevoederbureau, Lelystad, The Netherlands.
De Greef, K. H., 1992. Prediction of production. Nutrition induced tissue partitioning in
growing pigs. Ph.D. Thesis, Wageningen University, Wageningen, The Netherlands.
De Greef, K. H., 1995. Prediction of growth and carcass parameters. Pages 151-163 in:
Modelling growth in the pig. P. J. Moughan, M. W. A. Verstegen and M. I. Visser-
Reyneveld, eds. Wageningen Press, Wageningen, The Netherlands.
Emmans, G. C., 1981. A model of the growth and feed intake of ad libitum fed animals,
particularly poultry. Pages 103-110 in: Computers in animal production. G. M.
Hillyer, C. T. Whittemore and R.G. Gunn, eds. Occasional publication no. 5, British
Society of Animal Production.
Emmans, G. C., 1987. Growth, body composition and feed intake. World’s Poult. Sci. J.
43:208-227.

General Discussion
135
Emmans, G. C., 1995. Energy systems and the prediction of energy and feed intakes. Pages
115-122 in: Modelling growth in the pig. P. J. Moughan, M. W. A. Verstegen and M.
I. Visser-Reyneveld, eds. Wageningen Press, Wageningen, The Netherlands.
Gerrits, W. J. J., G. H. Tolman, J. W. Schrama, S. Tamminga, M. W. Bosch and M. W. A.
Verstegen, 1996. Effect of protein and protein-free energy intake on protein and fat
deposition rates in pre-ruminant calves of 80 to 240 kg live weight. J. Anim. Sci.
74:2129-2139.
Hilhorst, R. A., 1992. Kennissystemen in de agrarische sector. 44 p. QR Agrimathica, The
Netherlands.
King, R. D., 2001. Description of a growth simulation model for predicting the effect of diet on
broiler composition and growth. Poult. Sci. 80:245-253.
Lemme, A., S. Mack, P. J. A. Wijtten, D. J. Langhout, G. G. Irish and A. Petri, 2003. Effects of
increasing levels of dietary “ideal protein” on broiler performance. Pages 58-61 in:
Proceedings of the Australian Poultry Science Symposium 2003, Australia.
Moughan, P. J., W. C. Smith and G. Pearson, 1987. Description and validation of a model
simulating growth in the pig (20-90 kg live weight). N. Z. J. Agric. Res. 30:481-489.
Moughan, P. J. and M. W. A. Verstegen, 1988. The modelling of growth in the pig. Neth. J.
Agric. Sci. 36:145-166.
NRC, 1994. Nutrient requirements of poultry. Ninth revised edition, National Academy Press,
Washington, D.C., USA.
Weis, R. N., S. H. Birkett, P. C. H. Morel and C. F. M. De Lange, 2004. Effects of energy intake
and body weight on physical and chemical body composition in growing entire male
pigs. J. of Anim. Sci. 82:109-121.
Whittemore, C. T. and R. H. Fawcett, 1976. Theoretical aspects of a flexible model to simulate
protein and lipid growth in pigs. Anim. Prod. 22:87-96.
Wijten, P. J. A., R. Prak, D. J. Langhout, M. Pack and D. Hoehler, 2001. The effect of
enhanced dietary “ideal” amino acid levels in maize- and wheat-based diets on
performance of male and female broilers. Pages 41-42 in: Proceedings of the 13th
European symposium on poultry nutrition, Blankenberge, Belgium.
Zoons, J., J. Buyse and E. Decuypere, 1991. Mathematical models in broiler raising. World’s
Poult. Sci. J. 47:243-255.


Summary

Summary
138
INTRODUCTION
Protein is an important nutrient for growing broiler chickens, as it affects
broiler performance, feed cost as well as nitrogen excretion. The effects of
dietary protein in broiler diets depend on many interacting factors, like
dietary energy level, broiler genotype and temperature. Consequently,
choosing the optimal protein level for a broiler diet is a complex decision. A
growth simulation model that evaluates these interacting factors
simultaneously would be a useful tool in that respect. Several broiler
growth models are available, which can be classified as empirical and
mechanistic models. Empirical models work as a black box whereas
mechanistic models describe underlying biological processes. An earlier
study in our laboratory revealed that existing broiler growth models were
inappropriate for being used as a practical tool for formulating broiler
diets. Existing models were either too simple (empirical models) or too
complex and inaccurate (mechanistic models).
Therefore, the objective of this dissertation was to develop a growth model
for broiler chickens that could be easily used by practical nutritionists. The
model should facilitate the selection of feeding strategies (in terms of dietary
protein and energy) that results in the desired body composition of broilers
while minimizing cost. A description of the genotype of a broiler chicken
should be an input variable for the model.
Two important theories that are generally used in growth models were
validated for broiler chickens (Chapters 1 and 2). Another general problem
in growth models, namely the possible effects of early life nutrition on
responses at later age, was investigated for protein nutrition in broilers
(Chapter 3). A new model was developed that describes broiler responses to
dietary balanced protein level (Chapter 4). Based on the predictions by this
new model and data on feed and meat prices, the economic aspects of
dietary balanced protein level in broiler diets were evaluated (Chapter 5).
PROTEIN DEPOSITION RATES IN BROILERS (CHAPTER 1)
It is an important assumption in several growth simulation models for pigs
that dietary protein is preferentially used for protein deposition, unless
energy availability or other factors (genotype or environment) become
limiting. The key assumption here is that, where protein is limiting, protein
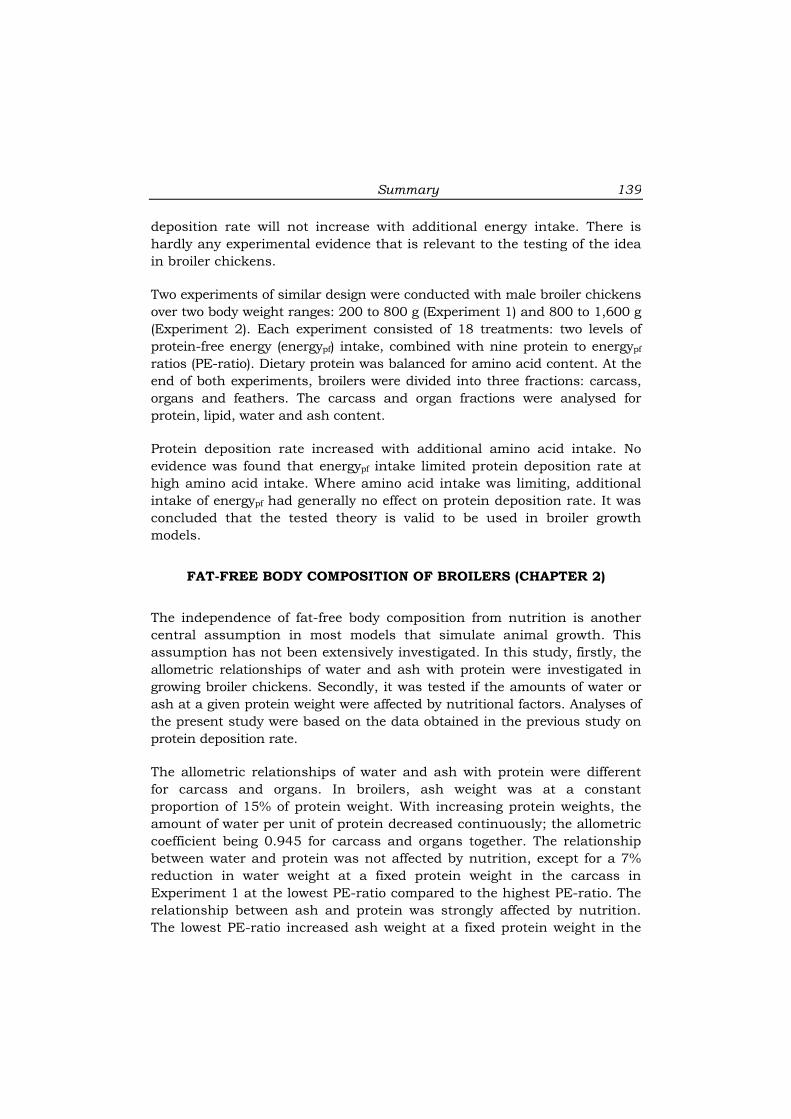
Summary
139
deposition rate will not increase with additional energy intake. There is
hardly any experimental evidence that is relevant to the testing of the idea
in broiler chickens.
Two experiments of similar design were conducted with male broiler chickens
over two body weight ranges: 200 to 800 g (Experiment 1) and 800 to 1,600 g
(Experiment 2). Each experiment consisted of 18 treatments: two levels of
protein-free energy (energypf) intake, combined with nine protein to energypf
ratios (PE-ratio). Dietary protein was balanced for amino acid content. At the
end of both experiments, broilers were divided into three fractions: carcass,
organs and feathers. The carcass and organ fractions were analysed for
protein, lipid, water and ash content.
Protein deposition rate increased with additional amino acid intake. No
evidence was found that energypf intake limited protein deposition rate at
high amino acid intake. Where amino acid intake was limiting, additional
intake of energypf had generally no effect on protein deposition rate. It was
concluded that the tested theory is valid to be used in broiler growth
models.
FAT-FREE BODY COMPOSITION OF BROILERS (CHAPTER 2)
The independence of fat-free body composition from nutrition is another
central assumption in most models that simulate animal growth. This
assumption has not been extensively investigated. In this study, firstly, the
allometric relationships of water and ash with protein were investigated in
growing broiler chickens. Secondly, it was tested if the amounts of water or
ash at a given protein weight were affected by nutritional factors. Analyses of
the present study were based on the data obtained in the previous study on
protein deposition rate.
The allometric relationships of water and ash with protein were different
for carcass and organs. In broilers, ash weight was at a constant
proportion of 15% of protein weight. With increasing protein weights, the
amount of water per unit of protein decreased continuously; the allometric
coefficient being 0.945 for carcass and organs together. The relationship
between water and protein was not affected by nutrition, except for a 7%
reduction in water weight at a fixed protein weight in the carcass in
Experiment 1 at the lowest PE-ratio compared to the highest PE-ratio. The
relationship between ash and protein was strongly affected by nutrition.
The lowest PE-ratio increased ash weight at a fixed protein weight in the

Summary
140
carcass by up to 28%, compared to the highest PE-ratio. It was concluded
that independence of fat-free body composition from nutrition is not a valid
assumption for broiler growth models.
EFFECTS OF EARLY-LIFE PROTEIN NUTRITION ON LATER
RESPONSES (CHAPTER 3)
If a model predicts responses of broiler chickens of a given age, the
question arises to what extent the broilers responses depend on what has
happened to the broiler at earlier age. A study was conducted with broiler
chicks to test the effects of early life protein nutrition and sex on responses
in growth and body composition to dietary balanced protein at later age.
Effects on the incidence of metabolic disorders were also evaluated. From
11 to 26 d of age (EXP1), birds were fed eight diets varying in balanced
protein to energy ratio (BPE-ratio) between 0.575 and 1.100 g digestible
lysine per MJ AMEn. Birds from two treatment groups in EXP1 (BPE-ratio
of 0.725 and 1.025 g/MJ, respectively) were subsequently used in a test
from 26 to 41 d of age (EXP2). In EXP2, eight diets were fed varying in
BPE-ratio between 0.500 and 1.025 g/MJ.
Responses in weight gain and feed conversion to BPE-ratio in EXP2
changed considerably when BPE-ratio in EXP1 was modified, irrespective
of sex. Up to 10% improvement in both weight gain and feed conversion in
EXP2 was observed if BPE-ratio in EXP1 was 0.725 compared to 1.025
g/MJ. With males, however, the effect of treatment in EXP1 on weight
gain in EXP2 was present only at high BPE-ratios. For the relative gain of
breast meat and abdominal fat, but not for carcass, the responses of male
broilers to BPE-ratio in EXP2 were altered by the BPE-ratio in EXP1. With
females, responses in composition of the gain to diet in EXP2 were
independent of BPE-ratio in EXP1. The incidence of metabolic disorders
was low, irrespective of treatment in EXP1. The lower BPE-ratio in EXP1
increased mortality in EXP2 from 0.8 to 3.6%. It was concluded that
broiler responses to dietary balanced protein depend on previous protein
nutrition and sex. Effects of early life protein nutrition on incidence of
metabolic disorders were not observed. The results suggest that balanced
protein levels in grower and finisher diets should not be optimised
independently, but simultaneously.

Summary
141
A NEW MODEL ON BROILER RESPONSES TO DIETARY BALANCED
PROTEIN (CHAPTER 4)
The ultimate aim of the present PhD-project was to develop a broiler
growth model that should be fit to serve as a practical tool for nutritionists.
During this project, we became aware that improving existing mechanistic
broiler models would not be a feasible approach for this aim, because this
type of models seems to be unfit to deal with physical body composition
(for example, carcass, breast meat, abdominal fat) and to simulate ad
libitum feed intake with acceptable accuracy and precision. Therefore, a
new model was developed.
Figure 1. Hypothetical dose-response curve, describing broiler responses in growth rate to
dietary balanced protein level (DBP). Dose-response curves can be seen as consisting of three
parts: (1) maximum (asymptotic) performance level, (2) DBP requirement for maximum
performance and (3) shape of the dose-response curve.
This model predicts broiler responses (growth rate, feed conversion ratio,
carcass yield and breast meat yield) to dietary balanced protein (DBP) level.
The model makes it possible to construct tailor-made dose-response curves
without actual experimentation. In this new approach, dose-response
curves are defined as consisting of three parts (Figure 1): the maximum
(asymptotic) performance level, the DBP requirement (minimal DBP level to
realise almost the asymptotic performance level) and the shape of the dose-
response curves (rate of decrease in performance if DBP level is decreased
below the DBP requirement). Asymptotic performance is input for the
Growth rate (g/d)
40
45
50
55
60
65
5 7 9 11 13
Balanced Protein Level (g dig. Lys/kg)
maximum
growth rate
shape DBP requirement

Summary
142
model. The model predicts DBP requirement from broiler age, sex and year.
Year indicates genetic potential. The shape of the dose-responses was
shown to be constant, independent of asymptotic performance level, age,
sex and year.
Broiler response studies from literature and the Nutreco Poultry Research
Centre (27 data sets in total) were used in the model development to select
significant variables, to quantify the parameters and to evaluate the
accuracy of the predictions. Input variables were DBP level, asymptotic
performance level, age, year (indicating genetic potential) and sex. The new
model gave an accurate simulation of growth rate, feed conversion and
breast meat for nearly all data sets. Accuracy was less for carcass. The
new model is useful, among others, to evaluate the economic aspects of
DBP in broilers.
THE ECONOMICS OF DIETARY BALANCED PROTEIN IN BROILERS
(CHAPTER 5)
An economic model was developed that calculates economic optimal
dietary balanced protein (DBP) levels for broiler chickens, based on
technical input and prices of meat and feed (Figure 2).
Figure 2. Overview of input and output for the economic model.
Whole broilers
Output
Carcass
Cut up
Input
Nutri-opt II
Whole broiler: whole broiler price
Carcass: carcass price
Cut up: breast meat + rest carcass price
Meat prices
Other input
Initial body weight + length of age period
Feed price
Technical model (Chapter 4)
Feed price as a function of dietary balanced
protein level
- Gross margin as a function of
dietary balanced protein level
- Balanced protein level for
maximum gross margin
- Gross margin as a function of
dietary balanced protein level
- Balanced protein level for
maximum gross margin
- Gross margin as a function of
dietary balanced protein level
- Balanced protein level for
maximum gross margin
Effect of dietary balanced protein level on:
- growth rate
- feed conversion
- carcass yield
- breast meat yield
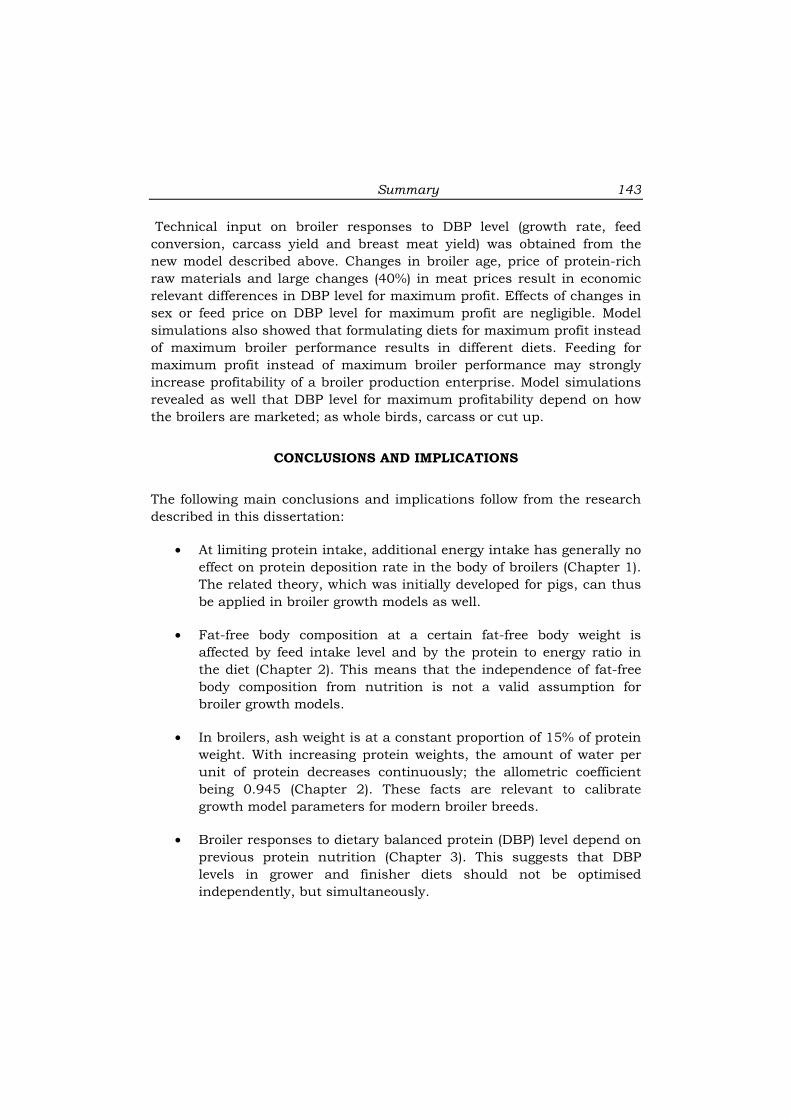
Summary
143
Technical input on broiler responses to DBP level (growth rate, feed
conversion, carcass yield and breast meat yield) was obtained from the
new model described above. Changes in broiler age, price of protein-rich
raw materials and large changes (40%) in meat prices result in economic
relevant differences in DBP level for maximum profit. Effects of changes in
sex or feed price on DBP level for maximum profit are negligible. Model
simulations also showed that formulating diets for maximum profit instead
of maximum broiler performance results in different diets. Feeding for
maximum profit instead of maximum broiler performance may strongly
increase profitability of a broiler production enterprise. Model simulations
revealed as well that DBP level for maximum profitability depend on how
the broilers are marketed; as whole birds, carcass or cut up.
CONCLUSIONS AND IMPLICATIONS
The following main conclusions and implications follow from the research
described in this dissertation:
• At limiting protein intake, additional energy intake has generally no
effect on protein deposition rate in the body of broilers (Chapter 1).
The related theory, which was initially developed for pigs, can thus
be applied in broiler growth models as well.
• Fat-free body composition at a certain fat-free body weight is
affected by feed intake level and by the protein to energy ratio in
the diet (Chapter 2). This means that the independence of fat-free
body composition from nutrition is not a valid assumption for
broiler growth models.
• In broilers, ash weight is at a constant proportion of 15% of protein
weight. With increasing protein weights, the amount of water per
unit of protein decreases continuously; the allometric coefficient
being 0.945 (Chapter 2). These facts are relevant to calibrate
growth model parameters for modern broiler breeds.
• Broiler responses to dietary balanced protein (DBP) level depend on
previous protein nutrition (Chapter 3). This suggests that DBP
levels in grower and finisher diets should not be optimised
independently, but simultaneously.

Summary
144
• The shape of dose-response curves describing broiler performance
at varying DBP levels seems independent of the absolute level of
broiler performance and of broiler age, sex and genetic potential
(Chapter 4). This constant shape of response, in combination with
data on the DBP requirement (predicted by the model) and on the
absolute level of performance (estimated by the model user himself)
makes it possible to construct tailor-made dose-response curves
without actual experimentation.
• DBP requirement for minimising feed conversion is 10 to 20%
higher than for maximising growth rate or breast meat yield, and
more than 30% higher than for maximising carcass yield (Chapter
4). DBP requirement for minimising feed conversion is higher than
the Lys levels recommended by NRC (1994) and CVB (1996)
(General Discussion). Thus, if the aim is to maximise broiler
performance, higher amino acid levels are needed than suggested
by NRC (1994) and CVB (1996).
• The shape of the dose-response curves in growth rate and feed
conversion to DBP level is mathematically less complicated than
the shape of the dose-response in feed intake to DBP level (General
Discussion). This implies that it is easier to calculate the responses
in feed intake from the responses in growth rate and feed
conversion, than to model the responses in feed intake to DBP level
directly.
• Formulating diets for either maximum profit or maximum broiler
performance results in different DBP levels (Chapter 5).
Formulating for maximum profit instead of maximum broiler
performance may increase the profitability of a broiler production
enterprise.
• The economic optimal DBP level for broilers to be sold as carcass
(not cut up) is lower than for broilers to be sold as cut up, but
higher than for broilers to be sold as live broilers (Chapter 5). This
implies that for maximising profitability, DBP level should depend
on how the broilers are marketed.

Samenvatting

Samenvatting
146
INLEIDING
Eiwit is een belangrijke voedingstof voor vleeskuikens. Vleeskuikens
hebben vooral eiwit nodig om te kunnen groeien. Daarnaast is eiwit nodig
om gezond te blijven, bijvoorbeeld voor een goede afweer tegen ziekten. De
kwaliteit van een voer voor vleeskuikens hangt daarom sterk af van de
hoeveelheid eiwit in het voer en van de kwaliteit van dit eiwit. De kwaliteit
van het eiwit is goed als het goed verteerbaar is door het kuiken.
Daarnaast dienen de verschillende eiwitbestanddelen (aminozuren) in de
juiste verhouding aanwezig te zijn. Eiwit met de juiste verhouding aan
aminozuren wordt vaak ‘ideaal eiwit’ of ‘gebalanceerd eiwit’ (balanced
protein) genoemd.
Over de gewenste eiwitkwaliteit is al veel kennis beschikbaar.
Ingewikkelder is de keuze van de juiste hoeveelheid (gebalanceerd) eiwit.
De hoeveelheid voedereiwit heeft namelijk veel verschillende effecten. Zo
beïnvloedt het bijvoorbeeld de groeisnelheid van vleeskuikens en ook de
voederconversie. Voederconversie is de hoeveelheid voer die nodig is om
een kuiken 1 kg te laten groeien. Ook de hoeveelheid vet in het kuiken en
de bevleesdheid, bijvoorbeeld het aandeel borstvlees (kipfilet), hangen af
van de hoeveelheid eiwit in het voer. Daarbij komt dat al deze effecten van
voedereiwit moeilijk zijn te voorspellen, omdat ze afhangen van het
vleeskuikenras, de staltemperatuur, de hoeveelheid energie in het voer, en
vele andere factoren. Dit probleem is niet op te lossen door veiligheidshalve
voeders te maken met een extra hoog eiwitgehalte. Voer met veel eiwit erin
is duur. Bovendien, de overmaat aan eiwit in het voer wordt uitgescheiden
en belast zo het milieu.
In de praktijk zijn het de nutritionisten die de grondstofsamenstelling van
vleeskuikenvoeders bepalen, en daarmee ook het eiwitgehalte van het voer.
Om een keuze van het eiwitgehalte te kunnen maken, dient het hierboven
geschetste, ingewikkelde probleem te worden versimpeld. Anders gezegd, er
moet een model gemaakt worden. In de literatuur zijn verschillende
modellen voor vleeskuikenvoeding beschreven. Probleem met deze
bestaande modellen is dat ze te ingewikkeld, of juist te simpel zijn, om te
dienen als hulpmiddel voor nutritionisten. Ingewikkelde modellen hebben
vaak als probleem dat voor de berekeningen gegevens nodig zijn die een

Samenvatting
147
nutritionist in de praktijk niet beschikbaar heeft. Het model dient ook weer
niet te simpel te zijn. Het model moet het mogelijk maken om betere
beslissingen te nemen dan op basis van bestaande kennis.
Het doel van dit proefschrift was om een eenvoudig model te maken
waarmee nutritionisten een betere beslissing kunnen nemen over de
hoeveelheid eiwit in vleeskuikenvoeders. Het model moest rekening houden
met de erfelijke eigenschappen van het kuiken. Ook diende het model de
economische consequenties te berekenen, bijvoorbeeld hoe de voerkosten en
de winst per vleeskuiken afhangen van het eiwitgehalte in het voer.
Als eerste is voor twee belangrijke theorieën over diervoeding die in veel
modellen worden toegepast, onderzocht in hoeverre deze geldig zijn voor
vleeskuikens (Hoofdstukken 1 en 2). Vervolgens is onderzocht hoe de
eiwithoeveelheid in het voer voor jonge kuikens van invloed is op de reactie
van kuikens op het eiwitgehalte in het voer op latere leeftijd (Hoofdstuk 3).
In Hoofdstuk 4 is het technische model beschreven, dat voorspelt hoe
vleeskuikens presteren op voeders met verschillende eiwitgehaltes.
Tenslotte is het economische model ontwikkeld waarmee de economische
consequenties van het eiwitgehalte in vleeskuikenvoer berekend kunnen
worden (Hoofdstuk 5).
DAGELIJKSE EIWITAANZET IN VLEESKUIKENS BIJ VERSCHILLENDE
VOEDERS (HOOFDSTUK 1)
Chemisch gezien bestaat een kuiken uit vier bestanddelen: eiwit, vet, water
en as. Zo bekeken, betekent groei dus dat het dier extra eiwit, vet, water en
as aanzet in het lichaam. Wanneer we de dagelijkse aanzet van deze vier
bestanddelen kunnen voorspellen, hebben we daarmee een manier (model)
om de groeisnelheid van het dier te voorspellen. Verschillende
groeimodellen voor dieren zijn gebaseerd op deze theorie over chemische
lichaamssamenstelling.
Een belangrijke aanname in dergelijke groeimodellen is dat voedereiwit met
name wordt gebruikt voor de groei van eiwit in het lichaam, en veel minder
wordt gebruikt als energiebron. Als de dagelijks opgenomen hoeveelheid
voedereiwit onvoldoende is, zal het dier minder eiwit in het lichaam
aanzetten. Deze modellen gaan er vanuit dat in dit laatste geval de

Samenvatting
148
dagelijkse eiwitaanzet niet kan worden verhoogd door extra voederenergie
(koolhydraten en vetten) te verstrekken. Deze theorie blijkt te kloppen voor
varkens, maar niet voor kalveren. Voor vleeskuikens was onvoldoende
bekend of deze theorie klopt.
Om de genoemde theorie te toetsen voor vleeskuikens, zijn twee proeven
uitgevoerd met vleeskuikenhanen, voor twee gewichtstrajecten: van 200 tot
800 gram (proef 1) en van 800 tot 1600 gram (proef 2). Elke proef bestond
uit 18 verschillende behandelingen: negen verschillende voeders (die
verschilden in de verhouding tussen het eiwit- en energiegehalte) in twee
verschillende dagelijkse hoeveelheden. Aan het einde van elke proef werden
de kuikens geslacht en opgedeeld in drie delen: karkas, organen en veren.
Van karkas en organen werd de chemische samenstelling bepaald: eiwit,
vet, water en as.
De dagelijkse aanzet van eiwit in het lichaam bleek inderdaad toe te nemen
als de kuikens meer voedereiwit kregen. In geval de opname aan voedereiwit
de dagelijkse aanzet van eiwit beperkte, kon de eiwitaanzet niet worden
verhoogd door extra voederenergie te verstrekken. Kortom, de kuikens deden
wat we verwachtten. Op basis van deze resultaten is daarom de conclusie
getrokken dat de geteste theorie inderdaad gebruikt kan worden in
groeimodellen voor vleeskuikens.
WATER EN AS IN RELATIE TOT EIWIT IN HET LICHAAM VAN
VLEESKUIKENS (HOOFDSTUK 2)
Zoals hierboven al genoemd, heeft voer grote invloed op de aanzet van eiwit
in het lichaam. Ook de aanzet van vet hangt sterk af van het voer.
Groeimodellen gaan er vaak vanuit dat de aanzet van de overige twee
lichaamsbestanddelen, water en as, niet direct afhangt van het voer. Deze
theorie stelt dat de hoeveelheid water en as alleen afhangt van de
hoeveelheid eiwit in het lichaam, onafhankelijk welk voer de dieren krijgen.
Ook deze theorie, die voor vleeskuikens nauwelijks is onderzocht, is
getoetst met de gegevens van de proef uit Hoofdstuk 1.
Als eerst is berekend hoeveel water en as aanwezig was in het lichaam van
vleeskuikens, en dit is vergeleken met de hoeveelheid eiwit in het lichaam.
Het bleek dat de hoeveelheid as altijd 15% was van de hoeveelheid eiwit.

Samenvatting
149
Voor water lag dit wat ingewikkelder. Hoe groter de hoeveelheid eiwit in het
lichaam, hoe minder water er, relatief ten opzichte van eiwit, in het
lichaam was. Anders gezegd, hoe zwaarder de kuikens, hoe ‘droger’de
groei.
Als tweede is nagegaan of deze relatie tussen as en eiwit, en tussen water
en eiwit, inderdaad niet afhing van het voer dat de kuikens kregen. De
relatie tussen water en eiwit was inderdaad meestal niet afhankelijk van
het voer. Alleen in proef 1 was er een effect van voer op deze relatie. De
relatie tussen as en eiwit was, in beide proeven, sterk afhankelijk van het
voer. Bij een bepaalde hoeveelheid eiwit kon de hoeveelheid as wel 28%
verschillen, afhankelijk van welk voer de kuikens kregen. De conclusie is
daarom getrokken dat de hoeveelheid water en as in het lichaam van
vleeskuikens niet alleen afhangen van de hoeveelheid eiwit in het lichaam,
maar ook afhangen van het voer.
VOEDEREIWIT OP JONGE LEEFTIJD: GEVOLGEN OP LATERE
LEEFTIJD (HOOFDSTUK 3)
Met een model is het mogelijk te voorspellen wat het effect van voeding is
op de prestaties van vleeskuikens van een bepaalde leeftijd. De vraag is
dan wel in welke mate deze prestaties afhangen van de voeding op jongere
leeftijd. Om deze vraag te beantwoorden voor wat betreft het eiwitgehalte in
het voer is een proef uitgevoerd met vleeskuikens. In deze proef zijn zowel
hanen als hennen gebruikt. Kuikens van 26 tot 41 dagen leeftijd kregen
één van de in totaal acht verschillende voeders. De voeders verschilden in
de verhouding tussen het eiwit- en het energiegehalte. De kuikens hadden
tijdens de voorafgaande leeftijdsfase (11 tot 26 dagen) een eiwitrijk voer, of
juist een eiwitarm voer gehad. Gemeten is in hoeverre de reacties van de
kuikens op het voer in de tweede leeftijdsfase afhingen van het voer in de
voorafgaande leeftijdsfase. Ook is onderzocht of de voeding op jonge leeftijd
invloed had op de gezondheid (afwezigheid van metabole stoornissen) op
latere leeftijd.
Als het eiwitgehalte van het voer op jonge leeftijd laag was, presteerden de
kuikens op latere leeftijd beter. Dit gold zowel voor hanen als voor hennen.
In geval van een eiwitarm voer op jonge leeftijd, waren de groeisnelheid en
de voederconversie op latere leeftijd tot 10% beter dan wanneer op jonge

Samenvatting
150
leeftijd een eiwitrijk voer was verstrekt. De hanen vertoonden deze
compensatie in groei alleen indien het eiwitgehalte in het voer op latere
leeftijd relatief hoog was. De samenstelling van de groei (bijvoorbeeld het
aandeel karkas, borstvlees en buikvet) van hennen op latere leeftijd was
niet afhankelijk van het voer op jonge leeftijd. Bij hanen had het voer op
jonge leeftijd wel effect op de samenstelling van de groei op latere leeftijd,
maar alleen voor wat betreft borstvlees en buikvet. Metabole stoornissen
waren in alle proefgroepen nagenoeg afwezig. Er konden daarom geen
conclusies worden getrokken over het effect van voer op het vóórkomen (en
voorkómen) van metabole stoornissen. De kuikensterfte op latere leeftijd
nam af van 3.6% tot 0.8%, indien op jonge leeftijd een eiwitrijk voer in
plaats van een eiwitarm voer werd verstrekt. De resultaten van deze proef
suggereren dat het eiwitgehalte van de voeders voor respectievelijk jongere
en oudere kuikens, niet los van elkaar gezien kunnen worden.
EEN NIEUW MODEL VOOR EIWIT IN VLEESKUIKENVOER
(HOOFDSTUK 4)
Het uiteindelijke doel van dit promotieonderzoek was om een model te
maken dat geschikt was om te dienen als praktisch hulpmiddel voor
nutritionisten. Tijdens dit onderzoek bleek dat aanpassing van bestaande
modellen geen goede manier was om deze doelstelling te realiseren, en wel
om twee redenen. Ten eerste voorspellen de bestaande modellen vaak de
chemische lichaamssamenstelling van kuikens (eiwit, vet, water en as)
terwijl in de praktijk juist de anatomische lichaamssamenstelling
(bijvoorbeeld, het aandeel karkas, borstvlees en buikvet) van belang is. Ten
tweede is bij bestaande modellen een betrouwbare voorspelling van de
voeropname essentieel; iets wat nog niet goed mogelijk is. Om deze
redenen is een nieuw model ontwikkeld.
Het nieuwe model voorspelt het effect van het eiwitgehalte in het voer op de
prestaties van vleeskuikens (groeisnelheid, voederconversie en het aandeel
karkas en borstvlees in het lichaam). De relatie tussen bijvoorbeeld
groeisnelheid en het eiwitgehalte kan in een grafiek worden weergegeven
(Figuur 1). Een dergelijke relatie wordt wel dosis-respons curve genoemd.
Eerst is een wiskundige formule opgesteld die de dosis-respons curve
opdeelt in drie fasen (Figuur 1): (1) de maximale groeisnelheid (de
asymptoot), (2) de eiwitbehoefte (dat is het eiwitgehalte dat minimaal nodig

Samenvatting
151
is om de maximale groeisnelheid te realiseren) en (3) de vorm van de curve
(de mate waarmee de groeisnelheid afneemt wanneer het eiwitgehalte
wordt verlaagd beneden de eiwitbehoefte).
Figuur 1. Voorbeeld van een dosis-respons curve die de relatie beschrijft tussen groeisnelheid
bvan vleeskuikens en het (gebalanceerde) eiwitgehalte in het voer. De dosis-respons curve kan
worden opgedeeld in drie delen: (1) de maximale groeisnelheid, (2) de eiwitbehoefte voor
maximale groeisnelheid en (3) de vorm van de dosis-respons curve.
Bovenstaande betekent dat de nutritionist met gegevens over de maximale
groeisnelheid, de eiwitbehoefte en de vorm van de curve, de totale dosis-
respons curve kan beschrijven. De dosis-respons curve maakt het
vervolgens mogelijk om te voorspellen hoeveel de groeisnelheid zal wijzigen
bij een verandering in het eiwitgehalte. Het eerstgenoemde, de maximale
groeisnelheid, is doorgaans goed bekend bij nutritionisten. Zo niet, dan
kan deze worden ingeschat op basis van gegevens van de
fokkerijorganisatie. Het tweede, de eiwitbehoefte, hangt af van onder
andere de leeftijd en sekse van de kuikens, alsook van de erfelijke
eigenschappen. Daarom is een formule ontwikkeld die de eiwitbehoefte
voorspelt op basis van leeftijd, sekse en erfelijke eigenschappen. Het derde,
de vorm van de curve, bleek onafhankelijk van het absolute niveau van de
kuikenprestaties. Anders gezegd, de relatieve afname in prestaties van de
kuikens bij verlaging van het eiwitgehalte bleek hetzelfde voor bijvoorbeeld
jonge en oudere kuikens.
Groeisnelheid (g/d)
40
45
50
55
60
65
5 7 9 11 13
Eiwitgehalte in het voer (g vert. Lys/kg)
maximum
groeisnelheid
vorm eiwitbehoefte

Samenvatting
152
Het model is ontwikkeld op basis van resultaten van proeven uit de
literatuur en van proeven op het pluimveeonderzoekscentrum van Nutreco.
Dit model, in combinatie met een economisch model, maakt het mogelijk
om de economische gevolgen van verschillende eiwitgehaltes in
vleeskuikenvoeders door te rekenen.
ECONOMISCHE ASPECTEN VAN EIWIT IN VLEESKUIKENVOER
(HOOFDSTUK 5)
Tenslotte is een economisch model ontwikkeld: ‘Nutri-opt II’. Dit model
berekent hoe de voerkosten, opbrengsten en winstgevendheid per
vleeskuiken afhangen van het eiwitgehalte in het voer. Middels Nutri-opt II
kan dus bijvoorbeeld worden uitgerekend bij welk eiwitgehalte de
winstgevendheid maximaal is. Voor deze berekeningen heeft het model
verschillende invoergegevens nodig (Figuur 2).
Figuur 2. Overzicht van het economische model “Nutri-opt II”: invoergegevens en
modelvoorspellingen.
Ten eerste zijn berekeningen nodig van het model uit Hoofdstuk 4 om te
kwantificeren hoe de vleeskuikenprestaties (groeisnelheid, voederconversie
Levend kuiken
Resultaten
Geslacht kuiken
Opgedeeld kuiken
Invoer
Nutri-opt II
Levend kuiken: prijs van levend kuiken
Geslacht kuiken: prijs van karkas
Opgedeeld kuiken: prijzen van borstvlees
. en de rest
Vleesprijzen
Overige invoer
Startgewicht + lengte van de leeftijdsfase
Voerprijs
Technisch model (Hoofdstuk 4)
Effect van gebalanceerd eiwitgehalte op de
voerprijs
- Effect van gebalanceerd eiwitgehalte
op winstgevendheid
- Gebalanceerd eiwitgehalte voor
maximale winst
- Effect van gebalanceerd
eiwitgehalte op winstgevendheid
- Gebalanceerd eiwitgehalte voor
maximale winst
- Effect van gebalanceerd eiwitgehalte
op winstgevendheid
- Gebalanceerd eiwitgehalte voor
maximale winst
Effect van gebalanceerd eiwitgehalte in het voer
op:
- Groeisnelheid
- Voederconversie
- Aandeel karkas
- Aandeel borstvlees

Samenvatting
153
en het aandeel karkas en borstvlees) afhangen van het eiwitgehalte in het
voer. Daarnaast zijn gegevens nodig over vleesprijzen en voerprijzen. De
gegevens over voerprijs betreft informatie over de relatie tussen voerprijs
en het eiwitgehalte in het voer.
Simulaties met het economische model toonden aan dat veranderingen in
leeftijd van de kuikens of in prijs van de eiwitrijke voedergrondstoffen, of
grote veranderingen in vleesprijzen (40%) resulteren in economisch
relevante verschillen in het eiwitgehalte voor maximale winstgevendheid.
Effecten van sexe en algemeen prijsniveau van het voer waren in dat
opzicht verwaarloosbaar. Modelsimulaties lieten verder zien dat het
eiwitgehalte sterk kan verschillen, afhankelijk of de voeders worden
geformuleerd voor maximale winst of juist voor maximale
vleeskuikenprestaties. Formuleren van de voeders voor maximale winst in
plaats van voor maximale vleeskuikenprestaties kan de winstgevendheid
beduidend verbeteren. Tenslotte maakten de modelsimulaties duidelijk dat
het eiwitgehalte voor maximale winst afhangt van hoe de vleeskuikens
worden verkocht; als levend kuiken, geslacht kuiken of opgedeeld kuiken
(borstvlees en overige delen).
CONCLUSIES EN PRAKTISCHE IMPLICATIES
De volgende conclusies en praktische implicaties volgen uit dit
promotieonderzoek:
• Wanneer de eiwitopname beperkend is, heeft extra energieopname
geen effect op de dagelijkse eiwitaanzet in het lichaam van
vleeskuikens (Hoofdstuk 1). De hieraan gerelateerde theorie, die
oorspronkelijk was ontwikkeld voor varkens, kan dus ook worden
toegepast in groeimodellen voor vleeskuikens.
• De relatie tussen water en as enerzijds en eiwit anderzijds in het
lichaam van vleeskuikens hangt af het voer (Hoofdstuk 2). Dit
betekent dat de desbetreffende theorie over de vetvrije
lichaamssamenstelling niet geldig is voor vleeskuikens.
• Daar waar de hoeveelheid eiwit in het lichaam van vleeskuikens
toeneemt tijdens de groei, blijft de hoeveelheid as constant op 15%

Samenvatting
154
van de hoeveelheid eiwit, terwijl de hoeveelheid water per eenheid
eiwit continue afneemt (Hoofdstuk 2). Middels deze en andere
gegevens uit Hoofdstuk 2 kan een groeimodel voor vleeskuikens
worden aangepast aan de moderne vleeskuikenrassen.
• Het effect van het eiwitgehalte in het voer op de prestaties van
vleeskuikens hangt af van het eiwitgehalte in het voer gedurende de
voorafgaande leeftijdsfase (Hoofdstuk 3). Dit suggereert dat de
eiwitgehaltes in voeders voor respectievelijk jonge en oudere
kuikens, niet los van elkaar gezien kunnen worden.
• De vorm van de dosis-respons curve, die de relatie beschrijft tussen
vleeskuikenprestaties en het eiwitgehalte in het voer, lijkt
onafhankelijk van het absolute niveau van de vleeskuikenprestaties
(Hoofdstuk 4). Deze constante vorm, in combinatie met gegevens
over de eiwitbehoefte (voorspeld door het model) en het absolute
prestatieniveau (ingeschat door de nutritionist), maakt het mogelijk
voor een nutritionist om de te voorspellen hoe de
vleeskuikenprestaties afhangen van het eiwitgehalte in het voer,
zonder dat daarvoor proeven nodig zijn.
• De eiwitbehoefte om de beste voederconversie te realiseren is 10 tot
20% hoger dan voor de maximale groeisnelheid of het hoogste
aandeel borstvlees, en meer dan 30% hoger dan nodig is voor het
hoogste aandeel karkas (Hoofdstuk 4). De eiwitbehoefte voor de
beste voederconversie is hoger dan de behoefte aan aminozuren
zoals geadviseerd door het NRC (1994) en het CVB (1996) (General
Discussion). Wanneer het doel is om maximale
vleeskuikenprestaties te realiseren, lijken derhalve hogere
aminozuurgehaltes in het voer nodig dan volgens het NRC (1994)
en het CVB (1996).
• Voor wat betreft de reacties van het kuiken op het eiwitgehalte van
het voer geldt, dat de vorm van de dosis-respons curven voor
groeisnelheid en voederconversie, wiskundig gezien, minder
gecompliceerd is dan de vorm van de dosis-respons curve voor
voeropname (General Discussion). Dit impliceert dat het
gemakkelijker is om de curve voor voeropname te berekenen uit de

Samenvatting
155
curven voor groeisnelheid en voederconversie, dan om de curve voor
voeropname direct te modelleren.
• Het eiwitgehalte in vleeskuikenvoeders kan sterk verschillen,
afhankelijk of de voeders worden geformuleerd voor maximale winst
of voor maximale vleeskuikenprestaties (Hoofdstuk 5). Formuleren
van de voeders voor maximale winst in plaats van voor maximale
vleeskuikenprestaties kan de winstgevendheid beduidend
verbeteren.
• Het economisch optimale eiwitgehalte in het voer voor kuikens te
verkopen als karkas (niet opgedeeld) is lager dan voor kuikens te
verkopen als opgedeeld kuiken (opgedeeld in borstvlees en overige
vleessoorten), maar hoger dan voor kuikens die levend worden
verkocht (Hoofdstuk 5). Dit impliceert dat het eiwitgehalte voor
maximale winstgevendheid afhangt van hoe de vleeskuikens
worden vermarkt.


List of Publications
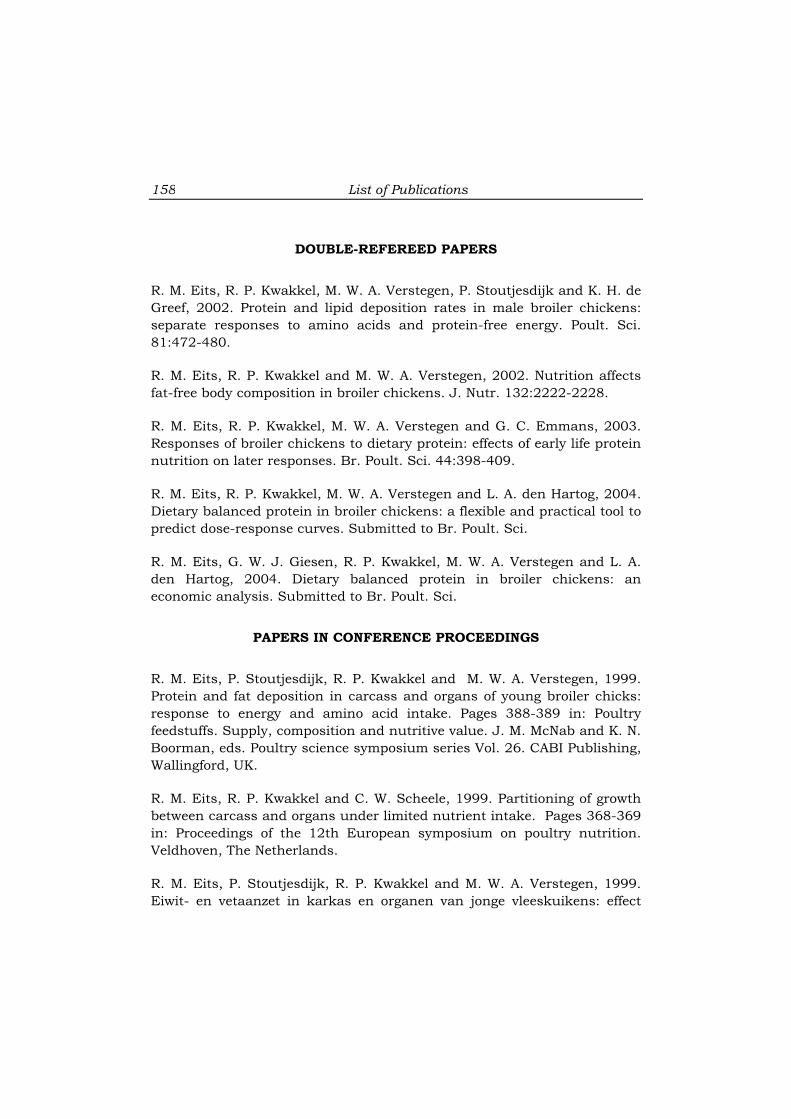
List of Publications
158
DOUBLE-REFEREED PAPERS
R. M. Eits, R. P. Kwakkel, M. W. A. Verstegen, P. Stoutjesdijk and K. H. de
Greef, 2002. Protein and lipid deposition rates in male broiler chickens:
separate responses to amino acids and protein-free energy. Poult. Sci.
81:472-480.
R. M. Eits, R. P. Kwakkel and M. W. A. Verstegen, 2002. Nutrition affects
fat-free body composition in broiler chickens. J. Nutr. 132:2222-2228.
R. M. Eits, R. P. Kwakkel, M. W. A. Verstegen and G. C. Emmans, 2003.
Responses of broiler chickens to dietary protein: effects of early life protein
nutrition on later responses. Br. Poult. Sci. 44:398-409.
R. M. Eits, R. P. Kwakkel, M. W. A. Verstegen and L. A. den Hartog, 2004.
Dietary balanced protein in broiler chickens: a flexible and practical tool to
predict dose-response curves. Submitted to Br. Poult. Sci.
R. M. Eits, G. W. J. Giesen, R. P. Kwakkel, M. W. A. Verstegen and L. A.
den Hartog, 2004. Dietary balanced protein in broiler chickens: an
economic analysis. Submitted to Br. Poult. Sci.
PAPERS IN CONFERENCE PROCEEDINGS
R. M. Eits, P. Stoutjesdijk, R. P. Kwakkel and M. W. A. Verstegen, 1999.
Protein and fat deposition in carcass and organs of young broiler chicks:
response to energy and amino acid intake. Pages 388-389 in: Poultry
feedstuffs. Supply, composition and nutritive value. J. M. McNab and K. N.
Boorman, eds. Poultry science symposium series Vol. 26. CABI Publishing,
Wallingford, UK.
R. M. Eits, R. P. Kwakkel and C. W. Scheele, 1999. Partitioning of growth
between carcass and organs under limited nutrient intake. Pages 368-369
in: Proceedings of the 12th European symposium on poultry nutrition.
Veldhoven, The Netherlands.
R. M. Eits, P. Stoutjesdijk, R. P. Kwakkel and M. W. A. Verstegen, 1999.
Eiwit- en vetaanzet in karkas en organen van jonge vleeskuikens: effect

List of Publications
159
van de opname van energie en aminozuren. In: 24e studiedag van
Nederlandstalige voedingsonderzoekers. Gent, Belgium.
R. M. Eits, R. P. Kwakkel and M. W. A. Verstegen, 2001. Vet-vrije
lichaamssamenstelling van vleeskuikens is afhankelijk van voerstrategie.
Pages 18-19 in: 26e studiedag Nederlandstalige voedingsonderzoekers.
Gent, Belgium.
R. M. Eits, I. H. C. van de Kruijs and R. P. Kwakkel, 2001. Compensatory
growth and efficiency of broiler meat production. Pages 27-28 in:
Proceedings of the 13th European symposium on poultry nutrition.
Blankenberge, Belgium.
R. M. Eits, R. P. Kwakkel and M. W. A. Verstegen, 2001. Nutrition affects
fat-free body composition in broiler chickens. Pages 37-38 in: Proceedings
of the 13th European symposium on poultry nutrition. Blankenberge,
Belgium.
R. M. Eits, R. P. Kwakkel, G. W. J. Giesen, M. W. A. Verstegen and L. A.
den Hartog, 2004. Broiler responses to dietary balanced protein: a
technical model and an economic model. Accepted by the XXII World’s
Poultry Congres, Istanbul, Turkey.


Curriculum Vitae

Curriculum Vitae
162
Ruud Eits (doopnaam: Rudolf Maurits Eits) is op 6 mei 1975 geboren te
Zeist. Zijn VWO diploma behaalde hij in 1993 aan het Van Lodenstein
College te Amersfoort. In 1993 begon hij de studie Zoötechniek –
specialisatie veevoeding - aan de Universiteit van Wageningen. In 1997 liep
hij drie maanden stage aan het Scottish Agricultural College in Edinburgh.
Tijdens deze stage participeerde hij in een project voor modellering van de
melkgift bij koeien. Ook was hij tijdens zijn studie in Wageningen twee jaar
parttime werkzaam als biologiedocent aan een middelbare school. De
studie in Wageningen sloot hij in 1997 cum laude af met als
afstudeervakken veevoeding en onderwijskunde. Op dat moment was hij
reeds werkzaam bij UTD mengvoeder te Maarssen als nutritionist en
onderzoeker pluimvee. Sinds de overname van UTD mengvoeder door
Nutreco in 1998 werkt hij als onderzoeker voor het Nutreco Poultry and
Rabbit Research Centre nabij Madrid. Sinds 1997 heeft hij, naast andere
R&D projecten, gewerkt aan het promotieonderzoek. Hij zal zijn
werkzaamheden in de huidige functie voorzetten.

Curriculum Vitae
163
Ruud Eits (Christian name: Rudolf Maurits Eits) was born on the 6th of
May in 1975 in Zeist, The Netherlands. In 1993 he graduated from
secondary education. In the same year he started the study Animal
Science at Wageningen University. In 1997 he went for 3 months to
Scotland for his practical training at the Scottish Agricultural College in
Edinburgh. For this training, he participated in a dairy cow-modelling
project. During his study in Wageningen, he was part-time employed as
Biology teacher at a secondary school. In 1997, he graduated cum laude for
his masters after MSc research in Animal Nutrition and in Didactics. At
that time, he was already working as poultry nutritionist and researcher
for UTD mengvoeder, a Dutch animal nutrition company. Since the
acquisition of UTD by Nutreco in 1998, he has been working as a
researcher at the Nutreco Poultry and Rabbit Research Centre near
Madrid, Spain. Since 1997 he has been working on the PhD-project and
other R&D projects. He will continue his work in the present job.

164
Omslagontwerp
Geraline Eits-Den Ouden en ArtworX, Maartensdijk
Drukker
Grafisch bedrijf Ponsen & Looijen, Wageningen
Financiering
Dit onderzoek is financieel mogelijk gemaakt door:
• Nutreco, Boxmeer
• Ministerie van Economische Zaken