Embed Size (px)
Citation preview
Modelling social identification and helping in evacuation
simulation
I. von Siversa,b,, A. Templetonc, F. Kunznerb, G. Kostera, J. Druryc, A.Philippidesc, T. Neckelb, H.-J. Bungartzb
aMunich University of Applied Sciences, Lothstr. 64, 80335 Munich, GermanybTechnische Universitat Munchen, Boltzmannstr. 3, 85747 Garching, Germany
cUniversity of Sussex, Falmer, Brighton, BN1 9QH, United Kingdom
Abstract
Social scientists have criticised computer models of pedestrian streams fortheir treatment of psychological crowds as mere aggregations of individu-als. Indeed most models for evacuation dynamics use analogies from physicswhere pedestrians are considered as particles. Although this ensures thatthe results of the simulation match important physical phenomena, such asthe deceleration of the crowd with increasing density, social phenomena suchas group processes are ignored. In particular, people in a crowd have socialidentities and share those social identities with the others in the crowd. Theprocess of self categorisation determines norms within the crowd and influ-ences how people will behave in evacuation situations. We formulate the ap-plication of social identity in pedestrian simulation algorithmically. The goalis to examine whether it is possible to carry over the psychological model tocomputer models of pedestrian motion so that simulation results correspondto observations from crowd psychology. That is, we quantify and formaliseempirical research on and verbal descriptions of the effect of group iden-tity on behaviour. We use uncertainty quantification to analyse the model’sbehaviour when we vary crucial model parameters. In this first approachwe restrict ourselves to a specific scenario that was thoroughly investigatedby crowd psychologists and where some quantitative data is available: thebombing and subsequent evacuation of a London underground tube carriageon July 7th 2005.
Keywords: pedestrian dynamics, evacuation simulation, social identity,helping behaviour, uncertainty quantification
Preprint submitted to Safety Science April 14, 2016

1. Introduction
The importance of evacuation simulations for pedestrians is generally ac-cepted for designing buildings and for ensuring safety at mass events. Mul-tiple models for pedestrian simulation were developed in the past decades.Popular among them are force based models (Helbing and Molnar, 1995;Langston et al., 2006), cellular automata (Gipps and Marksjo, 1985; Blueet al., 1997; Schadschneider, 2001; Kirik et al., 2007), and variations ofReynold’s behavioural and steering models (Reynolds, 1987, 1999; Karamouzaset al., 2009). Sveral alternatives have been added to the portfolio in morerecent years (Dijkstra et al., 2006; Sud et al., 2008; Seitz and Koster, 2012).
While having a realistic locomotion model is an important basis for simu-lating pedestrian evacuations, many crucial aspects of social behaviour havebeen neglected. In particular, the emergence and effects of group behaviourhave been examined extensively in empirical research by social psychologistsbut are often missing in computer models (Templeton et al., 2015).
On the other hand, there are a number of publications on pedestrianmotion models which incorporate social and psychological behaviour (Panet al., 2007; Chu et al., 2011; Tsai et al., 2011; Chu and Law, 2013). Yet, thesepublications mostly describe computer frameworks designed to incorporatemany possible but as yet unspecified behavioural models. That is, their focusis on the implementation of the framework. Notably, they do not attemptto emulate empirical findings from psychology. Furthermore, informationon how the behaviours they implemented are modelled in detail is missingin most cases. Another problem is the large number of parameters usedto control the interworking between the software modules that instantiatethe supposed behavioural models. These three aspects – the distance of themodels to the underlying theories, the lack of detailed modelling information,and the number of parameters to calibrate – make it nearly impossible toreplicate the models and to check the models against observations. From asafety scientist’s point of view, this is a severe drawback.
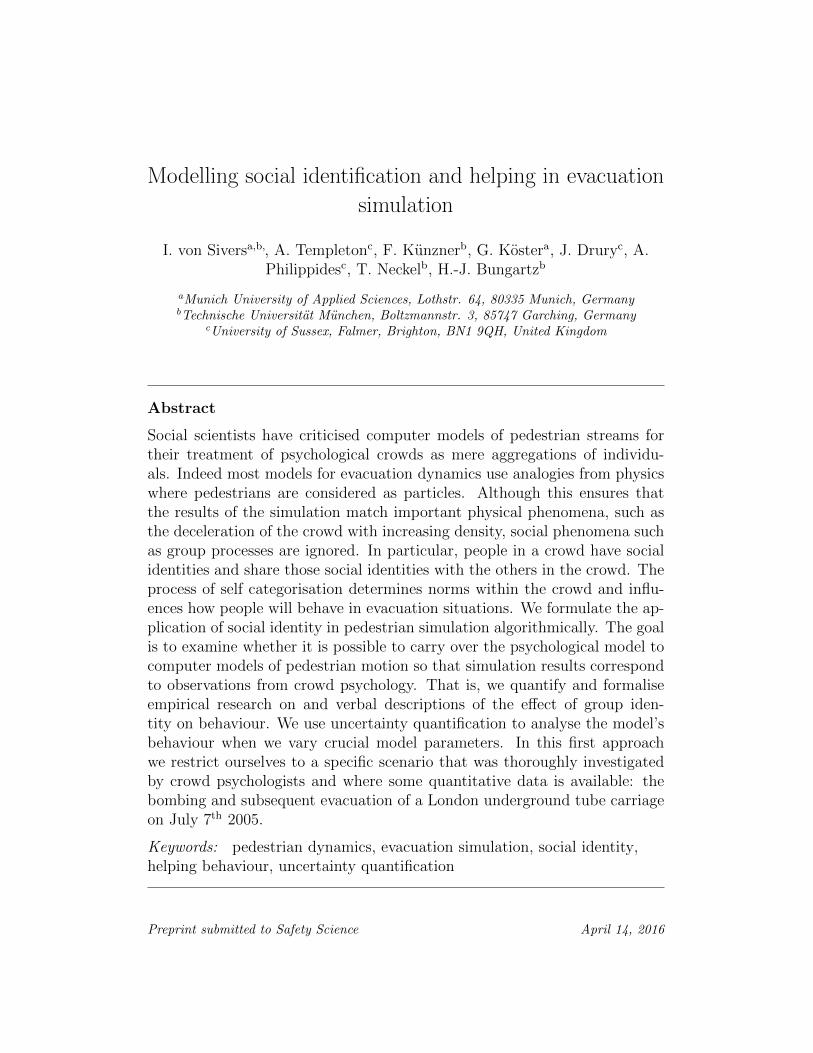
This is the gap that we attempt to close. With the Social Identity ModelApplication (SIMA) for pedestrian simulation, we present a step towardscombining research from psychology and computer science. We focus onone pivotal behaviour that was observed in several evacuations: helping oth-ers (see Figure 1). In modelling, we directly follow the ideas of the self-categorisation theory (SCT) (Turner et al., 1987) and the social identity the-ory (SIT) (Tajfel and Turner, 1979) which are both part of the social identity
2
helpevacuate
Figure 1: In an evacuation people have to decide whether to evacuate as quickly as possibleor to help others. We explain psychological mechanisms behind these decisions, formalisethem in a computer model and show which model parameters are decisive for safety science.
approach. We describe how to algorithmically formulate helping behaviourin an evacuation and how to choose the parameters so that other scientistscan replicate, validate, and use the model. We keep the model independentof the locomotion level, and the parameter space small.
2. Materials and methods
2.1. Social identity theory and self-categorisation theory
2.1.1. Incorporating evidence from crowd psychology
Our model is based upon extensive empirical research on collective be-haviour by social psychologists. There are numerous real life examples ofcollective behaviour where people act together as a group: for example or-chestras, football fans, and sports teams. Two prominent theories whichprovide insight in to how this group behaviour emerges are social identitytheory (Tajfel and Turner, 1979) and self-categorisation theory (Turner et al.,1987). According to social identity theory, people have multiple social identi-ties which are distinct from the identity of a person as an individual becausethey refer to ones identity as part of a social group, such as a fan of a cer-tain sports team. Self-categorization theory refers to the process wherebyone categorises oneself as an individual or a group member. It suggests thatcollective behaviour occurs through the process of depersonalisation, where
3

individuals self-stereotype themselves in line with their group. This occursthrough a transformation of one’s identity from the personal self to the col-lective self. It is this self-categorisation as a group member which makescollective behaviour possible. It can therefore explain the behavioural differ-ences between a physical crowd of individuals (who are simply in the samelocation together) and a psychological crowd (where people in a crowd acttogether).
The effect of social identities on peoples behaviour is crucial to understandfor crowd modellers who aim to simulate psychological crowds. Research hasshown that a shared social identity amongst crowd members increases theprevalence of supportive behaviours among people in emergency evacuations(Drury et al., 2009c). For example, when they share a social identity peopleevacuating may be more likely to coordinate their walking behaviours withothers and by letting them move first rather than competing for the same exit.Research on emergency mass decontamination has also demonstrated thatsocial identity is key to understanding the coordination of queuing behaviour,showing that that members of the public are more likely to participate inqueuing if they identify with the person organising the situation (Carteret al., 2014).
An example of collective behaviour in an emergency evacuation comesfrom the July 7th London bombings (Drury et al., 2009b). In this paper, wewill focus upon on this event which has been analysed by social psychologists.
2.1.2. The event: the London bombings, 7th July 2005
At 8.50am, during the peak rush hour in central London, three bombswere set off simultaneously in the London underground. The bombs werecoordinated so that they detonated on three separate tube lines when thetube trains were between busy stations. The passengers in the tube trainswere plunged into darkness and could not know if there were going to befurther explosions, with no information when help would arrive. Emergencyservices did not reach them for some time. Over 700 people were injuredin the attacks and 52 people were killed. In this emergency situation, thesurvivors of the bombings came together to tend to the injured and find away of evacuating safely. In contrast to portrayals of crowds as panicking andacting selfishly to evacuate, research has shown that the opposite occurred.In the aftermath of the disaster, 140 of the survivors reported seeing helpingbehaviour and mutual aid, such as offering water to others, providing firstaid, and applying makeshift bandages. Only three of the survivors reported
4

witnessing selfish behaviour. This was replicated in internet sources andthe public enquiry; first-hand accounts showed that 42 people out of 127described seeing help and only 11 described seeing people act selfishly.
Crucially, Drury et al. (2009b) found that survivors reported feeling partof a group with the other survivors. Many participants gave accounts ofwhere people cooperated and coordinated to help the group to escape. Infact, most survivors claimed the crowd behaved calmly and orderly, ratherthan describing panicking behaviour. There was evidence of orderly queuingand people allowing others to go first, which in turn helped people overallby making the evacuation more safe. Other examples of reported behaviourinclude leaving in a calm manner rather than rushing or pushing past eachother which could have caused hindrance to the evacuation of the groupoverall.
Drury et al. (2009b) demonstrate how survivors emotionally supportedone another, allowed others to evacuate first, and stayed behind with peo-ple (who were previously strangers) at a personal risk to themselves. Thisbehaviour was relatively common across the survivors, and when combinedwith the reports of feeling as part of a group it is in line with the ideathat the commuters shared a social identity which was invoked through thecommon fate of the emergency situation. Although there are numerous ex-amples of this collective mutual aid in emergency situations, in this paperwe will focus on one key helping behaviour that was documented in the Lon-don bombings: assisting injured people to evacuate safely. We argue that inorder to adequately simulate collective behaviour in emergency and disasterevents, modellers should heed the research conducted by social psychologists.Specifically, modellers should focus on the role of a shared group identity andincidents of ingroup helping by incorporating aspects of self-categorisationtheory into their simulations. As such, we use the London bombings sce-nario to propose a realistic model of collective behaviour which combines thecomprehensively validated Optimal Steps Model for locomotion with princi-ples from the well-established social identity theory and self-categorisationtheory.
2.1.3. Collecting empirical evidence
The helping behaviour that is modelled in SIMA is taken from accountsgiven by survivors of the July 7th 2005 London bombings and the behaviourof the crowd in the aftermath as researched by Drury et al. (2009b). Theycollated and analysed the survivor’s perceptions of people’s behaviour and
5
the feelings that they experienced during the event. This was conducted bycollecting one hundred and forty one accounts in contemporaneous newspa-per material, in addition to personal archives and accounts from eighty onesurvivors which were recorded on the day or in the immediate aftermathof the bombings. Crucially, from this sample of survivors, they were askedabout the level of danger that they felt they were in, how the others in thecrowd behaved, whether people performed helping behaviour or acted self-ishly, and whether their perception towards others changed throughout thecourse of the event. Notably, support for these findings can be seen in Druryet al. (2009a) which examines the accounts of crowd behaviour given by 21survivors of 11 emergencies.
2.2. The underlying pedestrian motion model
For the locomotion level of our simulation, we use the Optimal StepsModel (OSM) (Seitz and Koster, 2012; von Sivers and Koster, 2015). As inmany models, pedestrians are represented by circles, with radius 20 cm, thatrepresent the solid body. The model deviates from older approaches in itstreatment of motion: As in reality, pedestrians make steps to move forward.They do not glide along smooth trajectories that resemble imaginary rails asin force-based models or hop from cell to cell as in cellular automata. Forthis, each agent searches for the possible next position within a disk of whichthe radius is the agent’s maximum stride length. The maximum stride lengthis determined individually according to empirical findings that link the stridelength to free-flow speed (Grieve and Gear, 1966; Kirtley et al., 1985; Jelicet al., 2012; Seitz and Koster, 2012). The free-flow speed, that is, the speedan agent is supposed to prefer when walking uninhibited on a flat surface, isa standard input parameter in pedestrian simulations.
The search for the next position constitutes a two-dimensional optimisa-tion problem on the step disk. The objective function is a superposition ofdedicated utility functions that express closeness to the target, or rather ashort travel time to the target (Koster and Zonnchen, 2014), sufficient in-terpersonal distance to other pedestrians and sufficient distance to obstacles(von Sivers and Koster, 2015; Seitz et al., 2015). The shorter the remain-ing travel time to the target the higher the utility becomes. The correcttravel time, while skirting obstacles that hide the target from direct view,is expressed through the solution of a mathematical equation: the eikonalequation (Kretz, 2009; Kretz et al., 2010; Hartmann, 2010). Originally, theeikonal equation describes the arrival time of a wave front that spreads out
6
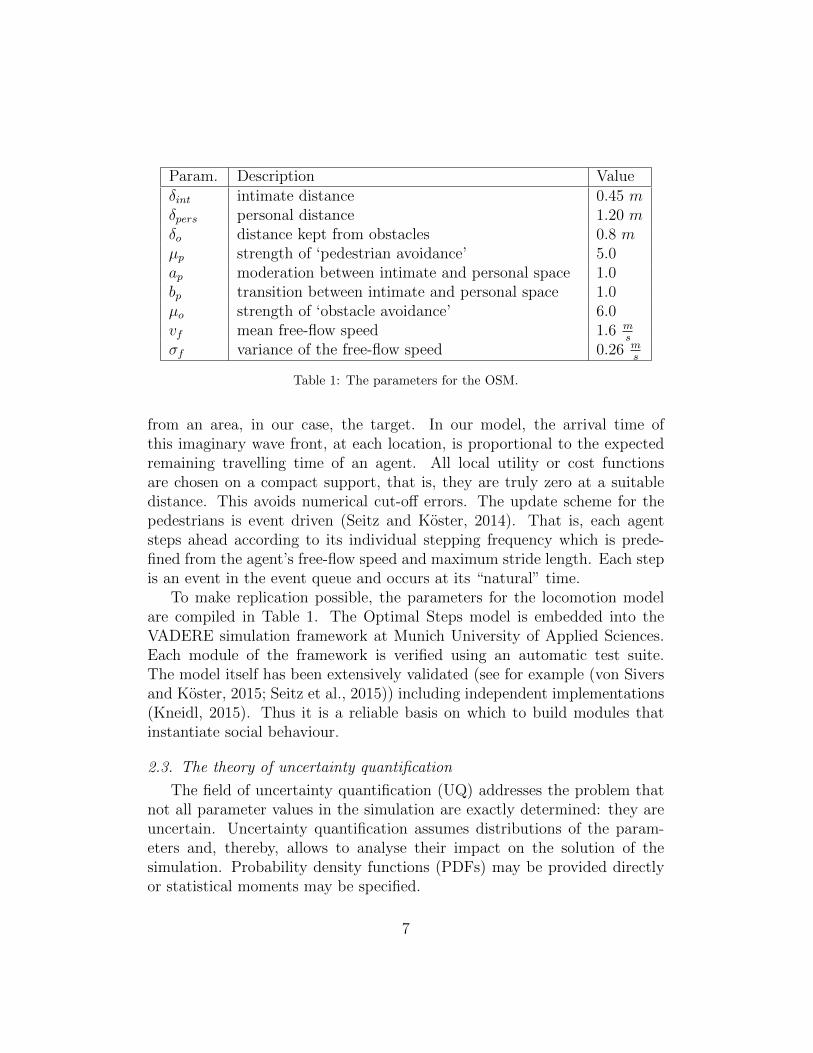
Param. Description Valueδint intimate distance 0.45 mδpers personal distance 1.20 mδo distance kept from obstacles 0.8 mµp strength of ‘pedestrian avoidance’ 5.0ap moderation between intimate and personal space 1.0bp transition between intimate and personal space 1.0µo strength of ‘obstacle avoidance’ 6.0vf mean free-flow speed 1.6 m
s
σf variance of the free-flow speed 0.26 ms
Table 1: The parameters for the OSM.
from an area, in our case, the target. In our model, the arrival time ofthis imaginary wave front, at each location, is proportional to the expectedremaining travelling time of an agent. All local utility or cost functionsare chosen on a compact support, that is, they are truly zero at a suitabledistance. This avoids numerical cut-off errors. The update scheme for thepedestrians is event driven (Seitz and Koster, 2014). That is, each agentsteps ahead according to its individual stepping frequency which is prede-fined from the agent’s free-flow speed and maximum stride length. Each stepis an event in the event queue and occurs at its “natural” time.
To make replication possible, the parameters for the locomotion modelare compiled in Table 1. The Optimal Steps model is embedded into theVADERE simulation framework at Munich University of Applied Sciences.Each module of the framework is verified using an automatic test suite.The model itself has been extensively validated (see for example (von Siversand Koster, 2015; Seitz et al., 2015)) including independent implementations(Kneidl, 2015). Thus it is a reliable basis on which to build modules thatinstantiate social behaviour.
2.3. The theory of uncertainty quantification
The field of uncertainty quantification (UQ) addresses the problem thatnot all parameter values in the simulation are exactly determined: they areuncertain. Uncertainty quantification assumes distributions of the param-eters and, thereby, allows to analyse their impact on the solution of thesimulation. Probability density functions (PDFs) may be provided directlyor statistical moments may be specified.
7
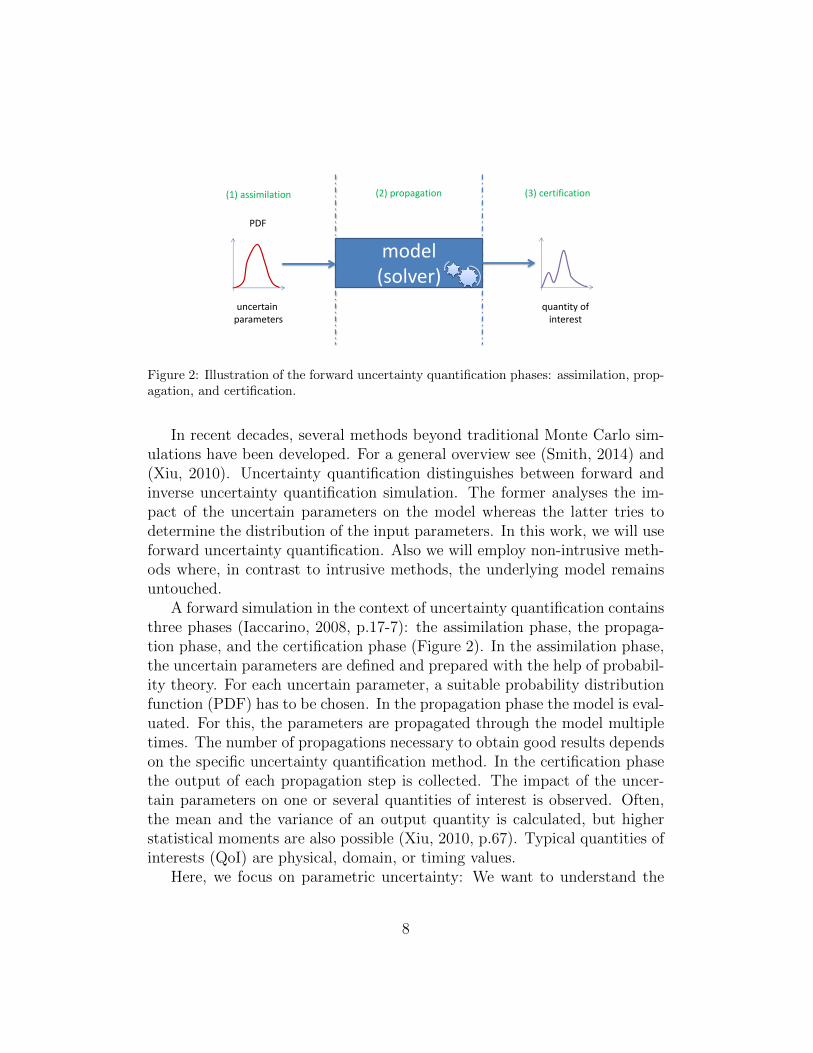
model (solver)
(1) assimilation (2) propagation (3) certification
uncertain parameters
quantity of interest
Figure 2: Illustration of the forward uncertainty quantification phases: assimilation, prop-agation, and certification.
In recent decades, several methods beyond traditional Monte Carlo sim-ulations have been developed. For a general overview see (Smith, 2014) and(Xiu, 2010). Uncertainty quantification distinguishes between forward andinverse uncertainty quantification simulation. The former analyses the im-pact of the uncertain parameters on the model whereas the latter tries todetermine the distribution of the input parameters. In this work, we will useforward uncertainty quantification. Also we will employ non-intrusive meth-ods where, in contrast to intrusive methods, the underlying model remainsuntouched.
A forward simulation in the context of uncertainty quantification containsthree phases (Iaccarino, 2008, p.17-7): the assimilation phase, the propaga-tion phase, and the certification phase (Figure 2). In the assimilation phase,the uncertain parameters are defined and prepared with the help of probabil-ity theory. For each uncertain parameter, a suitable probability distributionfunction (PDF) has to be chosen. In the propagation phase the model is eval-uated. For this, the parameters are propagated through the model multipletimes. The number of propagations necessary to obtain good results dependson the specific uncertainty quantification method. In the certification phasethe output of each propagation step is collected. The impact of the uncer-tain parameters on one or several quantities of interest is observed. Often,the mean and the variance of an output quantity is calculated, but higherstatistical moments are also possible (Xiu, 2010, p.67). Typical quantities ofinterests (QoI) are physical, domain, or timing values.
Here, we focus on parametric uncertainty: We want to understand the
8

impact of uncertain parameters, such as the number of injured persons, onthe simulation results. We choose stochastic collocation (SC) with the pseu-dospectral approach (Xiu, 2007) as uncertainty quantification method. Thisfits our requirements because the method is non-intrusive, suitable for theanalysis of models with few parameters, and needs less computational effortthan other methods (Xiu, 2009).
Stochastic collocation with the pseudospectral approach (SC-GPC) isbased on the generalised polynomial chaos (GPC) (Xiu, 2010, p.57-67) ex-pansion. The idea is to separate the spatio-temporal part of a random pro-cess U(x, t, ζ) from the purely random part (see (Smith, 2014, p.209)). Inour case, U(x, t, ζ) is the theoretical ‘analytical’ solution of the consideredpedestrian evacuation scenario.
The generalised polynomial chaos expansion for U(x, t, ζ) is defined as(Xiu and Karniadakis, 2003, p.143)
U(x, t, ζ) =∞∑j=0
cj(x, t)︸ ︷︷ ︸spatio-
temporal
·Φj(ζ)︸ ︷︷ ︸random
, (1)
which depends on space x, time t, and the vector of random parametersζ = (ζ1, . . . , ζM) with M independent random variables. cj(x, t) are thecoefficients of the expansion representing the spatio-temporal part and aredenoted by cj for the sake of simplicity in the following. Their computationdepends on the specific generalised polynomial chaos method (Smith, 2014,p.209) one uses. The functions Φj are orthogonal polynomial basis functionsthat correspond to the distributions of the random variables. To evaluateEquation (1) numerically, the expansion is truncated after N terms.
In the stochastic collocation with the pseudospectral approach, the modelis evaluated on so-called collocation points. The coefficients cj of the gener-alised polynomial chaos expansion are approximated by applying a projectionwith an integration rule: Once the uncertain parameters are chosen, the col-location points (Xiu, 2007, p.299) zi and weights wi (i = 1, . . . , Q) for theintegration rule can be generated (assimilation). To propagate the uncer-tainty through the model and to calculate the coefficients cj, the model u(zi)(i.e. our pedestrian simulation) and the orthogonal basis functions Φj(zi)have to be evaluated at the generated collocation points zi.
Finally, the quantities of interest are extracted (certification). In ourexample, we have one quantity of interest: the number of pedestrians that
9
have not yet reached safety in an evacuation scenario resembling the Londonbombings in 2005. To extract the mean µuN
and the variance σ2 of thedesired quantity of interest, we can directly use the coefficients cj. For themean, one has to evaluate (Xiu, 2010, p. 67)
µuN≈
Q∑i=1
u(zi)Φ0(zi)wi︸ ︷︷ ︸c0
= c0,(2)
and for the variance σ2 (Xiu, 2010, p. 67)
σ2 ≈N∑j=1
(
Q∑i=1
u(zi)Φj(zi)wi︸ ︷︷ ︸cj
)2 =N∑j=1
c2j , (3)
with σ being the standard deviation.We implemented a Python program using the chaospy library (Feinberg
and Langtangen, 2015) to realise the stochastic collocation with the pseu-dospectral approach (for results, see Section 4.2.2). Since we are going touse uniform distributions for the computations (see Section 4.2.1), Legendrepolynomials are used as orthogonal basis functions Φ (according to (Xiu andKarniadakis, 2002, p.626)). We choose the Gauss quadrature as integrationrule, and the order of the polynomial chaos expansion is fixed to N = 6.The number of required simulation runs depends on the number of colloca-tion points and the number of uncertain parameters. In our example, weuse Q = 21 collocation points for each uncertain parameter. Hence, for thesettings with one uncertain parameter, 21 simulation runs are required, andfor the setting with three uncertain parameters 9126 (= 213).
3. Results: Formalisation of social identity and helping
Self-categorisation theory suggests that, when people categorise them-selves as being in the same group, they are more likely to support each other(Levine et al., 2005). For the simulation of emergency evacuations, this ba-sic idea is essential. Other parts of the self-categorisation theory that areimportant to social psychologists – for example a changing degree of socialidentity during the evacuation – have to be postponed until there is data tosubstantiate the mechanisms of the change.
10

3.1. Social Identity Model Application
We want to enable independent researchers to use the new social model,the Social Identity Model Application (SIMA) with any locomotionmodel and in any simulation framework. The Optimal Steps Model and theVADERE simulation framework of this contribution are merely examplesamong several well validated choices. We achieve our goal by defining aninterface that exclusively consists of the target and the velocity of the pedes-trians, the two typical input parameters for a locomotion step. The SocialIdentity Model Application is called before the execution of the locomotionmodule in every time step of the simulation. The outcomes of the SIMA callare adjusted targets and velocities of the agents.
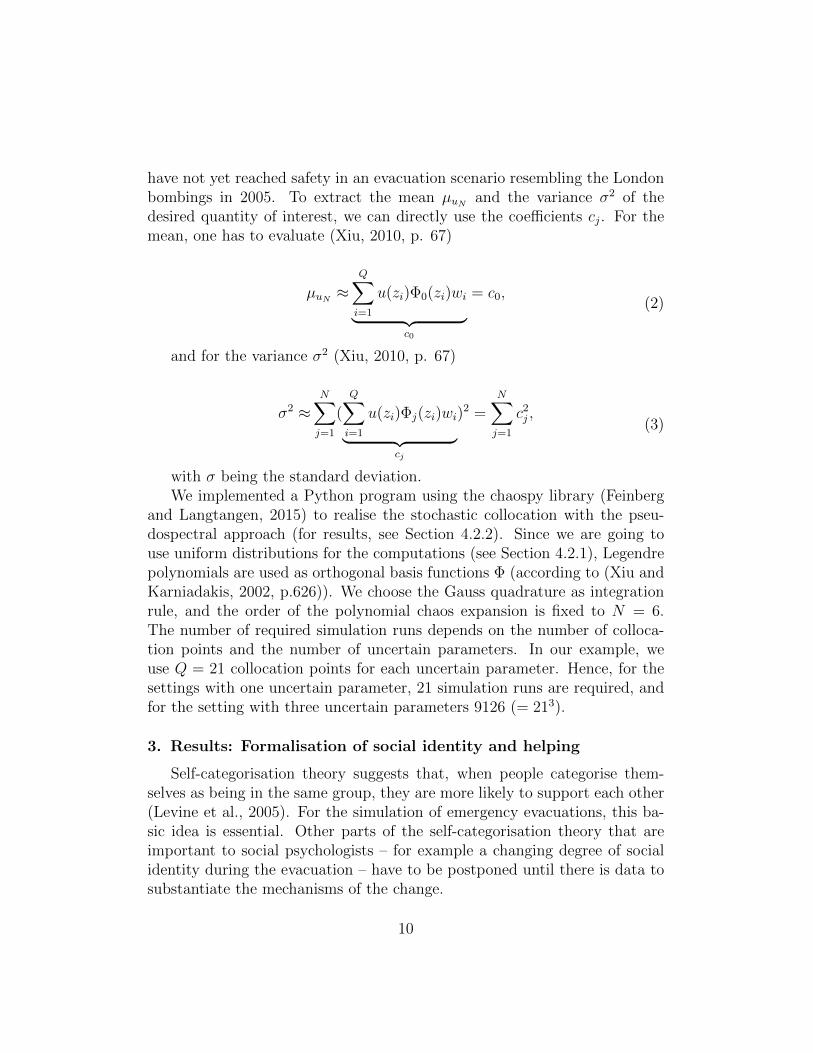
The Social Identity Model Application consists of two main components:the social identity component (Establishing Social Identity) describedin Section 3.2 and the helping behaviour component (Helping Behaviour)described in Section 3.4. Figure 3 shows the main loop of the Social IdentityModel Application with these two key components. A new type of agents,badly injured pedestrians, is introduced (see Sec. 3.3).
The Establishing Social Identity component is called the first timea pedestrian recognises the emergency. This follows findings from socialpsychological research that people categorise themselves as ingroup memberswhen faced with the common fate of an emergency. The component HelpingBehaviour is relevant during the whole duration of the simulation. It iscalled for pedestrians who share a social identity. Pedestrians who do notshare a social identity head straight for safety, that is, they evacuate withoutcaring for others. With its two states, beeing an ingroup member or not,and the resulting helping behaviour, the SIMA has similarities to finite-statemachines (Kielar et al., 2014) and discrete choice models (Antonini et al.,2006).
3.2. Establishing social identity
The first step in the model is to establish the social identity. However,not every pedestrian in an emergency shares a social identity (Drury et al.,2009a). Thus, we define a parameter percsharingSI . Pedestrians are randomlyselected to share a social identity or not according to percsharingSI . Theprocedure for one pedestrian in the scenario is visualised in Figure 4.
11
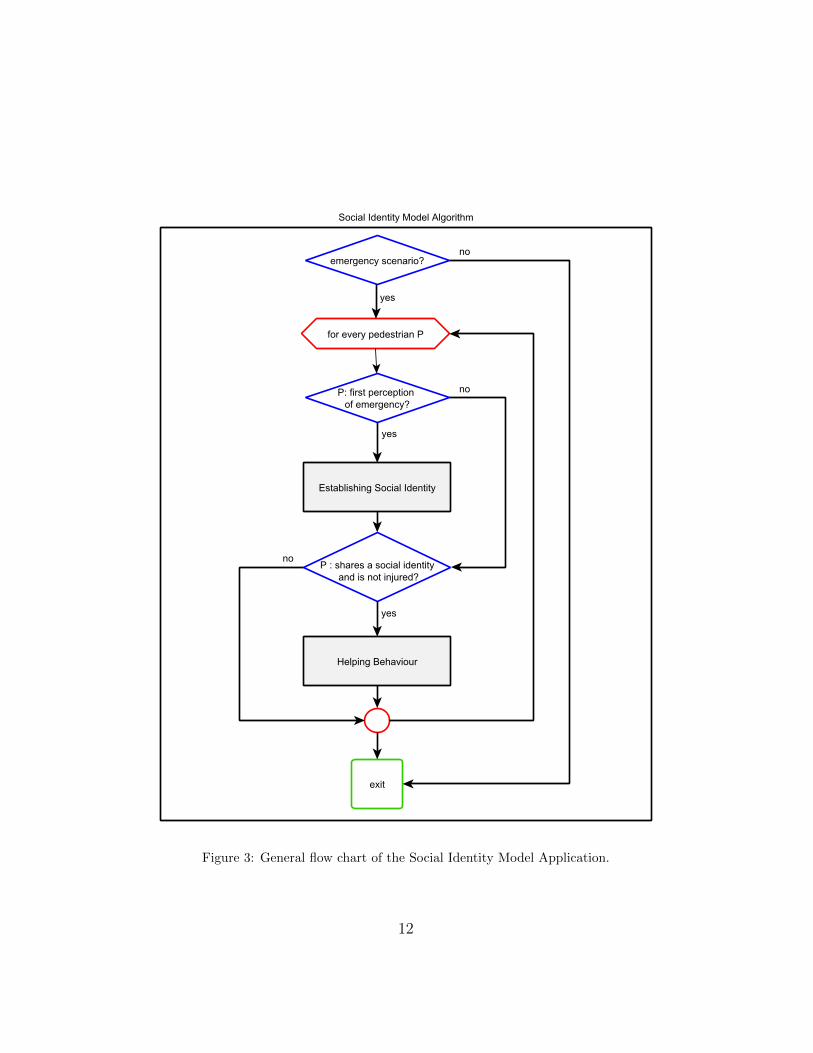
Figure 3: General flow chart of the Social Identity Model Application.
12

Figure 4: Flow chart of how the social identity for pedestrian P is established at thebeginning of the simulation. The percentage of pedestrians sharing a social identity ispercsharingSI .
3.3. Badly injured pedestrians
To model helping behaviour, we first need to introduce another type ofagent: a badly injured pedestrian. In emergencies in general, people can gethurt by fire, bombs, plunging building parts or for other reasons. Althoughin the London bombings there were some pedestrians who suffered minorinjuries we neglect them here. Their behaviour could be easily modelled byreducing their speed. Instead, we focus on badly injured pedestrians whoare still able to move with the assistance of others. Dead or deadly woundedpassengers could be considered as obstacles in a model. Further, they mighthinder the progress of survivors who try to assess the situation and to help.We think that we do not have enough data to formalize this in a meaningfulway and thus chose to also neglect completely disabling injuries, accepting itas a limitation of the model.
A pivotal element in evacuation models is the target that each agentmoves towards. Usually this is a ‘safe area’. We model the immobility ofbadly injured pedestrians by fixing their target at their current position.Thus they remain stationary. They cannot evacuate without assistance fromunharmed pedestrians. As soon as such an aide arrives we turn the aideinto the injured agent’s target. By doing this, the injured agent becomesdependent on the aide. The aide’s target is set to the ‘safe area’ and the pair
13

Figure 5: Flow chart of the helping behaviour for pedestrian P during the emergency; pui
is the abbreviation for unaided and injured pedestrian.
evacuate at a reduced speed vinj. This helping behaviour matches reports bysurvivors (Baker et al., 2002; Johnson, 2005; Tucker et al., 2007).
3.4. Helping behaviour
Reports on help between strangers and survivors in evacuations usuallylack a description of what exactly people do to help. However, one canimagine the typical steps that must be taken. Initially, an injured pedestrianneeds to be detected by an aide. Subsequently, this aide must approachthe injured pedestrian to finally physically support the injured person whileevacuating together. These assumptions are what we implement as helpingbehaviour (see Figure 5).
We assume the pedestrians choose the nearest injured and unaided pedes-trian as the person to assist. The sub-component Seek Injured Pedestrianrealises this searching behaviour. Each pedestrian has a range of perceptionthat, in reality, depends on the scenario or on the pedestrian’s abilities.In our simulations, we simplify these dependencies by assuming that each
14
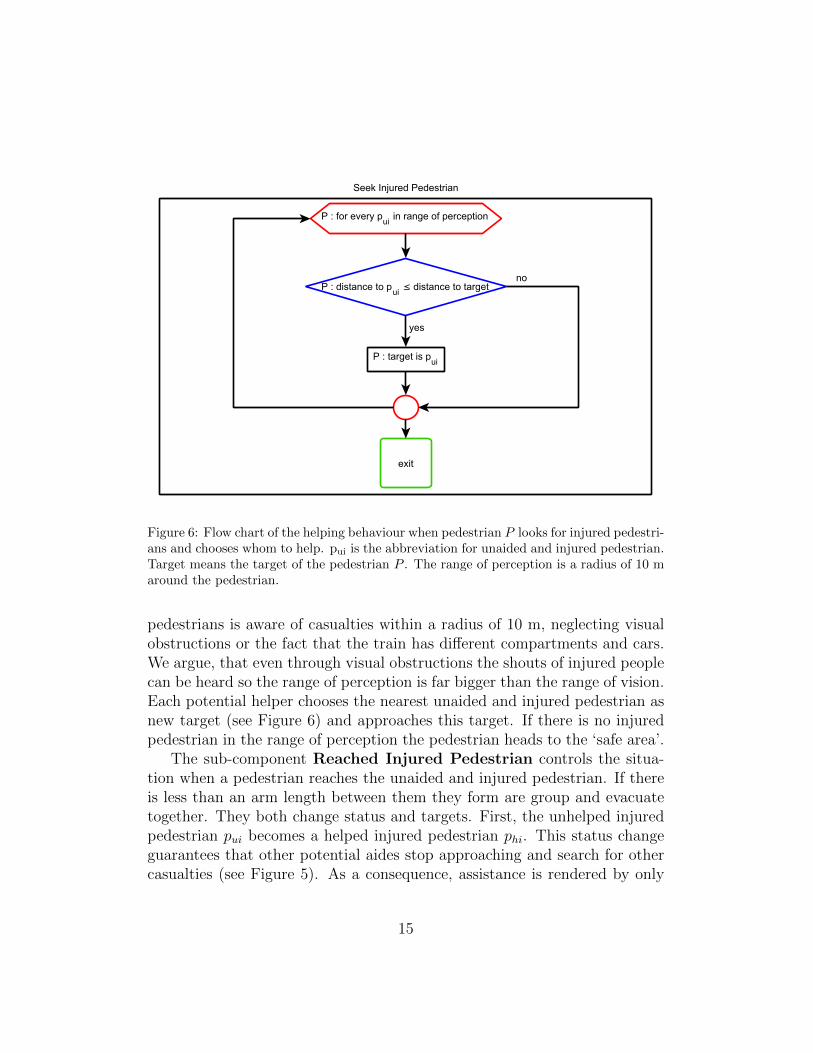
Figure 6: Flow chart of the helping behaviour when pedestrian P looks for injured pedestri-ans and chooses whom to help. pui is the abbreviation for unaided and injured pedestrian.Target means the target of the pedestrian P . The range of perception is a radius of 10 maround the pedestrian.
pedestrians is aware of casualties within a radius of 10 m, neglecting visualobstructions or the fact that the train has different compartments and cars.We argue, that even through visual obstructions the shouts of injured peoplecan be heard so the range of perception is far bigger than the range of vision.Each potential helper chooses the nearest unaided and injured pedestrian asnew target (see Figure 6) and approaches this target. If there is no injuredpedestrian in the range of perception the pedestrian heads to the ‘safe area’.
The sub-component Reached Injured Pedestrian controls the situa-tion when a pedestrian reaches the unaided and injured pedestrian. If thereis less than an arm length between them they form are group and evacuatetogether. They both change status and targets. First, the unhelped injuredpedestrian pui becomes a helped injured pedestrian phi. This status changeguarantees that other potential aides stop approaching and search for othercasualties (see Figure 5). As a consequence, assistance is rendered by only
15
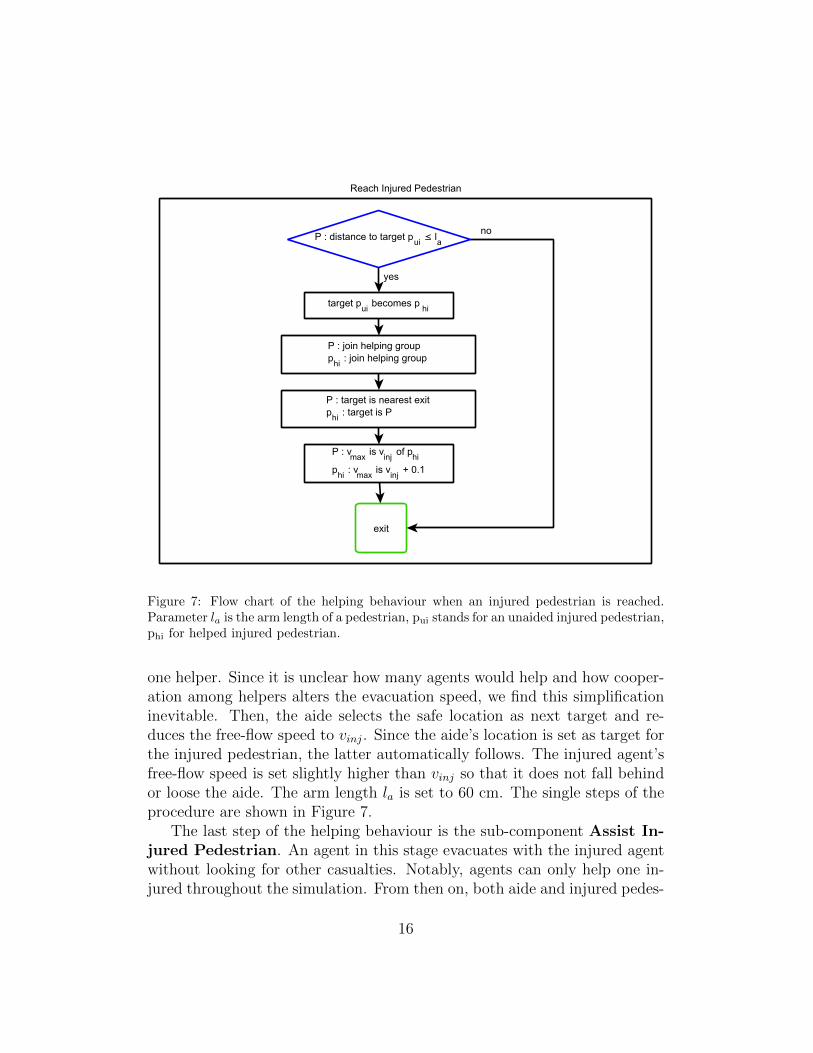
Figure 7: Flow chart of the helping behaviour when an injured pedestrian is reached.Parameter la is the arm length of a pedestrian, pui stands for an unaided injured pedestrian,phi for helped injured pedestrian.
one helper. Since it is unclear how many agents would help and how cooper-ation among helpers alters the evacuation speed, we find this simplificationinevitable. Then, the aide selects the safe location as next target and re-duces the free-flow speed to vinj. Since the aide’s location is set as target forthe injured pedestrian, the latter automatically follows. The injured agent’sfree-flow speed is set slightly higher than vinj so that it does not fall behindor loose the aide. The arm length la is set to 60 cm. The single steps of theprocedure are shown in Figure 7.
The last step of the helping behaviour is the sub-component Assist In-jured Pedestrian. An agent in this stage evacuates with the injured agentwithout looking for other casualties. Notably, agents can only help one in-jured throughout the simulation. From then on, both aide and injured pedes-
16
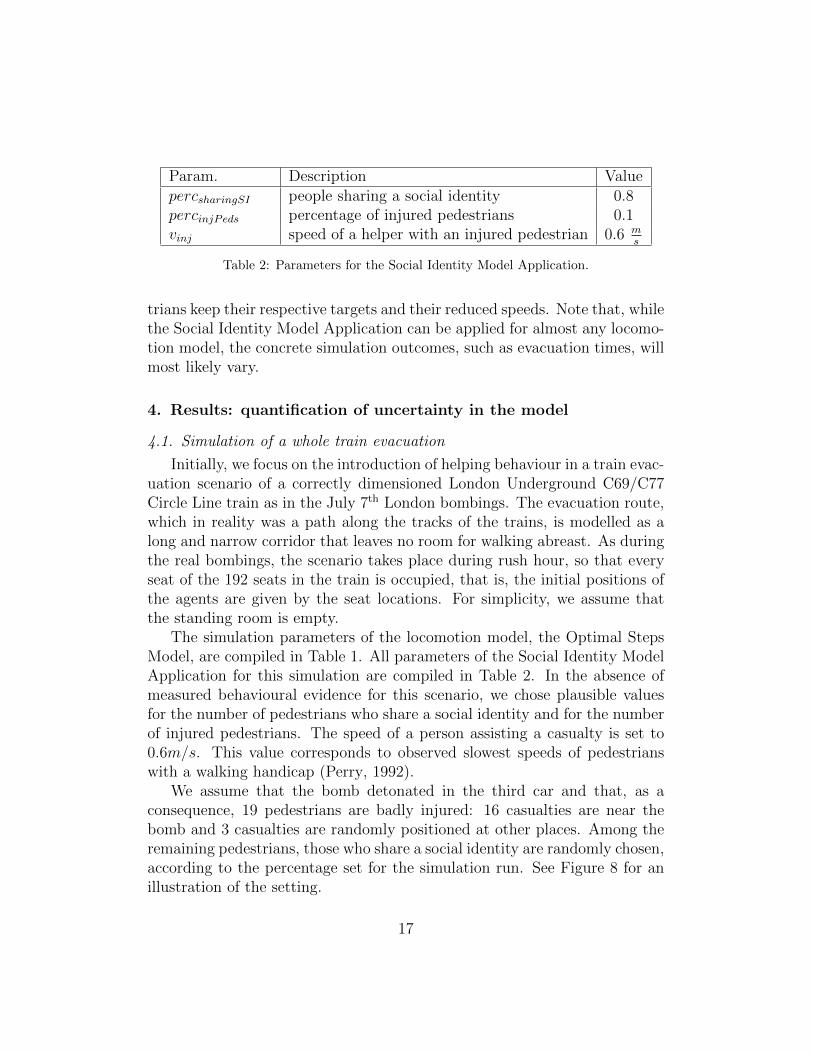
Param. Description ValuepercsharingSI people sharing a social identity 0.8percinjPeds percentage of injured pedestrians 0.1vinj speed of a helper with an injured pedestrian 0.6 m
s
Table 2: Parameters for the Social Identity Model Application.
trians keep their respective targets and their reduced speeds. Note that, whilethe Social Identity Model Application can be applied for almost any locomo-tion model, the concrete simulation outcomes, such as evacuation times, willmost likely vary.
4. Results: quantification of uncertainty in the model
4.1. Simulation of a whole train evacuation
Initially, we focus on the introduction of helping behaviour in a train evac-uation scenario of a correctly dimensioned London Underground C69/C77Circle Line train as in the July 7th London bombings. The evacuation route,which in reality was a path along the tracks of the trains, is modelled as along and narrow corridor that leaves no room for walking abreast. As duringthe real bombings, the scenario takes place during rush hour, so that everyseat of the 192 seats in the train is occupied, that is, the initial positions ofthe agents are given by the seat locations. For simplicity, we assume thatthe standing room is empty.
The simulation parameters of the locomotion model, the Optimal StepsModel, are compiled in Table 1. All parameters of the Social Identity ModelApplication for this simulation are compiled in Table 2. In the absence ofmeasured behavioural evidence for this scenario, we chose plausible valuesfor the number of pedestrians who share a social identity and for the numberof injured pedestrians. The speed of a person assisting a casualty is set to0.6m/s. This value corresponds to observed slowest speeds of pedestrianswith a walking handicap (Perry, 1992).
We assume that the bomb detonated in the third car and that, as aconsequence, 19 pedestrians are badly injured: 16 casualties are near thebomb and 3 casualties are randomly positioned at other places. Among theremaining pedestrians, those who share a social identity are randomly chosen,according to the percentage set for the simulation run. See Figure 8 for anillustration of the setting.
17

unharmed pedestriansinjured pedestriansevent, explosion
Figure 8: Evacuation scenario of a train. We assume that every seat is occupied (bluecircles for unharmed passengers and red-rimmed light blue circles for injured passengers),but nobody is standing. Black lines indicate the partitioning inside the train and the walls.Light grey areas cannot be stepped upon. The escape route is the narrow white corridorthat leads to safety. The safe area, and target, is indicated by the large (yellow, striped)rectangle in the upper left corner. 16 of the 19 injured pedestrians are placed near theevent (grey star), three more randomly in the train.
After a few seconds of the simulation, the first pairs of aides and injuredpedestrians form. In Figure 9 the helpers are depicted by black stripedcircles and the injured by light blue circles. At this point, some of theinjured pedestrians are still without helpers. A few seconds later, all injuredpedestrians are assisted (see Figure 10). The other pedestrians (indicated byblue circles) evacuate on their own. In this model, those pedestrians who donot help anybody leave faster than those assisting injured pedestrians. Thisis a result of the reduced speed of the aides and injured pedestrians.
In a later state of the simulation, the escape route becomes congested.In this scenario, overtaking while walking along the evacuation path is notpossible. Thus, faster agents get stuck behind aides with their charges. SeeFigure 11.
All observations outlined in the simulation match accounts by survivorsin emergencies (Johnson, 2005; Drury et al., 2009b). They reported thatsurvivors assisted those who were injured before leaving and formed orderlyqueues while evacuating. This is the behaviour that emerges in our simula-tions. We argue that this constitutes a qualitative validation of the SocialIdentity Model Application. Quantitative validation must be postponed un-til suitable data is available, possibly from evacuation drills or video footageof future emergencies. For a longer discussion on validation challenges seevon Sivers et al. (2014). In addition to qualitative validation, we are able
18

Figure 9: Evacuation scenario of a train. Close-up after the first seconds of the evacuation.First pairs of injured pedestrians (red-rimmed light blue cirlces) with helpers (black stripedcircles) form.
Figure 10: Evacuation scenario of a train. Close-up after all pairs of aides and chargeshave formed. The unharmed pedestrians (blue circles) leave the train faster, the helpers(black striped circles) with injured (red-rimmed light blue circles) are slower.
Figure 11: Evacuation scenario of a train. The slow pairs of helpers and charges (red-rimmed light blue and black striped circles) cause congestions.
19
to provide statistical data on the variation of simulation outcomes using thetechniques of uncertainty quantification.
4.2. Uncertainty quantification of the Social Identity Model Application
In many applications, the precise value of an important parameter, suchas the number of injured pedestrians in emergency planning, is unknown.Moreover, even if a measured value for the parameter is available, it is onlycorrect within a margin of error. If the model is sensitive to the variation ofthis parameter the predictive power of the model is decreased.
For example, the new helping behaviour in the simulation has a crucialimpact on the evacuation time. Clearly, the average evacuation time mustdepend on the number of injured pedestrians and helpers. In the extremecase, where at least one pedestrian is injured but nobody helps, the evacu-ation time is infinite. The same occurs if everyone is injured. On the otherhand, if there are no casualties then no time is invested in searching for themand nobody is slowed down by helping. Evacuation is much faster. A samplesimulation with the setting from Section 4.1 with 10% casualties results inan evacuation time of 467 seconds. In the same scenario without injuries,the evacuation time is 231 seconds. Only 10% of casualties in this scenariodoubles the evacuation time.
As long as there are uncertain parameters and sensitive parameters, onesample simulation does not give a reasonable estimate of the evacuation time.But how can one reasonably quantify the impact of uncertain parameterssuch as the number of injured pedestrians? We tackle this challenge usinguncertainty quantification.
4.2.1. Simulation setup for uncertainty quantification
For a proof of concept, we focus on one car and make several assumptionwith respect to the initial states of the agents. Again, every seat is occupied,but this time some people are standing, so that there are 60 persons in thecar. They evacuate to a ‘safe’ platform next to the car. We assume that thebomb detonated at one end of the car and that the 14 people near the eventare likely to be injured. As long as the percentage of injured pedestrians isset below 25%, the attribute of being injured is randomly assigned to thesepedestrians. Above 25%, all of 14 likely casualties are marked as injured.For the remaining number of casualties other passengers are randomly cho-sen. The percentage of passengers sharing a social percinjPeds is completelyunknown. It is the first uncertain parameter we investigate. The attribute
20

Figure 12: Scenario for the analysis with uncertainty quantification: evacuation of one carwith 60 passengers (blue and light blue circles) to a platform (yellow striped rectangle inthe upper part of the picture) after a bomb explosion. The grey star shows the place ofthe bomb. Thus, the red-rimmed light blue circles on the left side of the train are thepassengers with a high risk of injury.
Parameter Description Min. Max.percsharingSI people sharing a social identity 0.6 1.0percinjPeds percentage of injured pedestrians 0.1 0.3vinj speed of a helper with an injured
pedestrian0.4 0.8
Table 3: Three uncertain parameters in the Social Identity Model Application. They areuniformly distributed between their minimum and maximum values.
is randomly assigned to passengers using a uniform distribution according topercinjPeds. Figure 12 illustrates the setting.
Further uncertain parameters are the percentage of casualties and thespeed at which an aide and charge evacuate. Since there is no data onparameter distributions from real evacuations or experiments, we need tomake plausible assumptions. We assume that the parameters are uniformlydistributed with the minimum and maximum values in Table 3.
We choose the maximum evacuation time and the number of people whohave not yet reached safety as quantities of interest. At each time step, weanalyse the mean and the variance or standard deviation of each quantity ofinterest, until all persons have evacuated.
The next step is to calculate percentiles which measure which percentageof the determined values are below a specific value. By plotting values of the10th percentile and the 90th percentile, the space between this values can be
21
0 10 20 30 40 50time (t) - seconds
0
10
20
30
40
50
60pedest
rians
mean10th percentile90th percentile
0 10 20 30 40 50time (t) - seconds
0
10
20
30
40
50
60
standard
devia
tion (
pedest
rians)
std. dev.
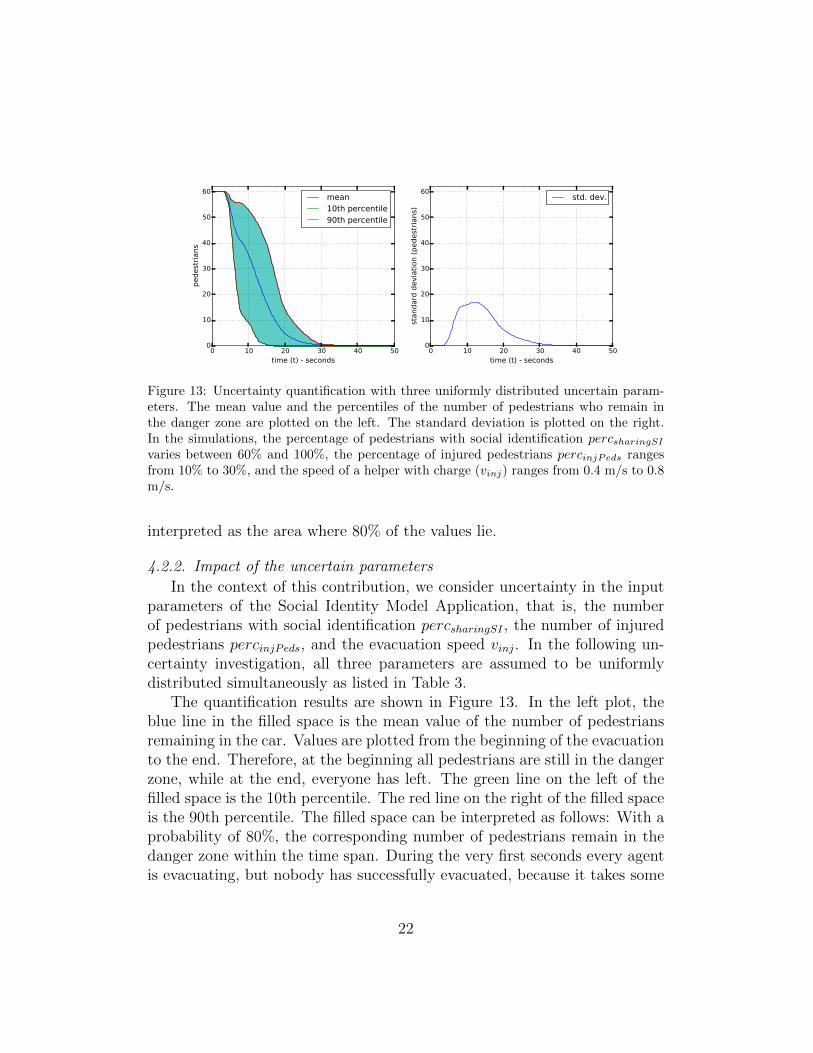
Figure 13: Uncertainty quantification with three uniformly distributed uncertain param-eters. The mean value and the percentiles of the number of pedestrians who remain inthe danger zone are plotted on the left. The standard deviation is plotted on the right.In the simulations, the percentage of pedestrians with social identification percsharingSI
varies between 60% and 100%, the percentage of injured pedestrians percinjPeds rangesfrom 10% to 30%, and the speed of a helper with charge (vinj) ranges from 0.4 m/s to 0.8m/s.
interpreted as the area where 80% of the values lie.
4.2.2. Impact of the uncertain parameters
In the context of this contribution, we consider uncertainty in the inputparameters of the Social Identity Model Application, that is, the numberof pedestrians with social identification percsharingSI , the number of injuredpedestrians percinjPeds, and the evacuation speed vinj. In the following un-certainty investigation, all three parameters are assumed to be uniformlydistributed simultaneously as listed in Table 3.
The quantification results are shown in Figure 13. In the left plot, theblue line in the filled space is the mean value of the number of pedestriansremaining in the car. Values are plotted from the beginning of the evacuationto the end. Therefore, at the beginning all pedestrians are still in the dangerzone, while at the end, everyone has left. The green line on the left of thefilled space is the 10th percentile. The red line on the right of the filled spaceis the 90th percentile. The filled space can be interpreted as follows: With aprobability of 80%, the corresponding number of pedestrians remain in thedanger zone within the time span. During the very first seconds every agentis evacuating, but nobody has successfully evacuated, because it takes some
22

0 10 20 30 40 50time (t) - seconds
0
10
20
30
40
50
60pedest
rians
mean10th percentile90th percentile
0 10 20 30 40 50time (t) - seconds
0
10
20
30
40
50
60
standard
devia
tion (
pedest
rians)
std. dev.
Figure 14: Uncertainty quantification with the percentage of injured pedestrian as uncer-tain parameter. The mean value and the percentiles of the number of pedestrians whoremain in danger are plotted on the left. The standard deviation is plotted on the right.Parameter percinjPeds is uniformly distributed between 10% and 40%.
time to reach the safe area. In the right plot of Figure 13, the standarddeviation for the number of pedestrians who are still in danger is plotted.It illustrates the spread around the mean number of agents at every timestep from the beginning of the simulation to the end. The mean for themaximum evacuation time is 21.35 seconds. The standard deviation is 5.68seconds (32.37 variance).
To analyse the impact of a single parameter, only this parameter is dis-turbed and the others are kept fixed. We choose the average of the minimumand the maximum values from Table 3 as the fixed values.
Figure 14 shows the results where the percentage of the injured pedestri-ans percinjPeds is uncertain. Not surprisingly, we observe that the percentageof injured pedestrians has a strong impact on the number of pedestrians whostill remain in the danger zone during the whole simulated evacuation time.During the first seconds of the evacuation, the spread around the mean issmall. This is because the number of casualties does not have an impact onthe behaviour of agents who are not sharing a social identity and directlyevacuate without helping. The mean for the maximum evacuation time is20.60 seconds and the standard deviation is 5.43 seconds.
Next we consider the speed of a helper with an injured pedestrian vinjas uncertain. The result is depicted in Figure 15. During the first seconds,there is no uncertainty in the number of safely evacuated pedestrians. Thiscan be explained with the immediate evacuation of the unharmed pedestrians
23

0 10 20 30 40 50time (t) - seconds
0
10
20
30
40
50
60pedest
rians
mean10th percentile90th percentile
0 10 20 30 40 50time (t) - seconds
0
10
20
30
40
50
60
standard
devia
tion (
pedest
rians)
std. dev.
Figure 15: Uncertainty quantification with the speed of a helper with charge as uncertainparameter. The mean value and the percentiles of the number of pedestrians who remain indanger are plotted on the left. The standard deviation is plotted on the right. Parametervinj is uniformly distributed between 0.1 m/s and 0.4 m/s.
who do not share a social identity and who are near the doors. For thesepedestrians the speed of a helper with charge plays no role. The mean forthe maximum evacuation time is 21.81 seconds and the standard deviationis 3.29 seconds.
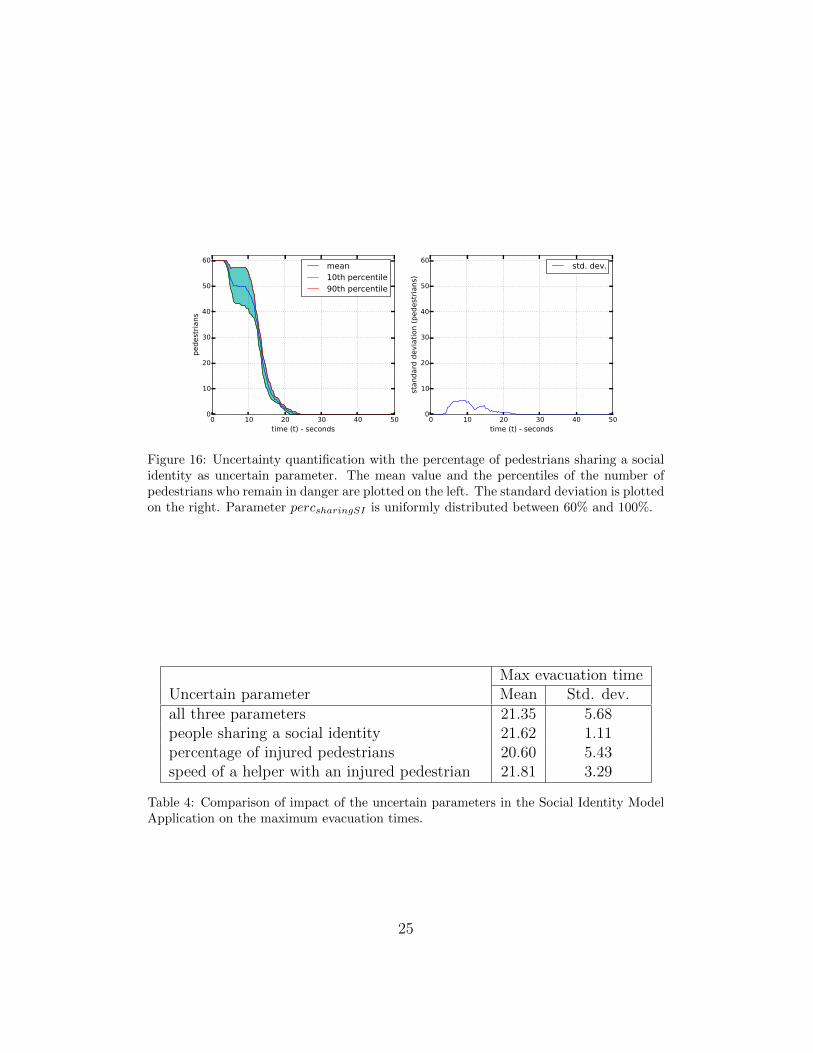
Finally, Figure 16 illustrates the results when the percentage of pedestri-ans with a shared social identity is uncertain. At the beginning of the evacua-tion, the number of aides has a strong influence on the number of pedestriansremaining in the danger zone. We find this plausible, because many potentialhelpers make it likely that injured pedestrians are reached quickly and thathelping behaviour has an impact on how the situation evolves. Later in thesimulation, the influence of the parameter decreases as one might expect:As long as enough unharmed pedestrians share a social identity each injuredperson will be helped eventually. The values for the maximum evacuationtime spread only a little bit around the mean of 21.62 seconds with a valueof 1.11 seconds for the standard deviation.
Table 4 gives a survey of the results of the four uncertainty quantificationsabove. From the standard deviation, we see that the percentage of injuredpedestrians has the greatest impact on the simulation results. In an earliersensitivity study (Davidich and Koster, 2013) where the evolution of a pas-senger stream at a German railway station was simulated and compared tovideo footage, it was found that changing the targets for the pedestrians hadthe greatest impact on results compared to other parameters like the pas-
24
0 10 20 30 40 50time (t) - seconds
0
10
20
30
40
50
60
pedest
rians
mean10th percentile90th percentile
0 10 20 30 40 50time (t) - seconds
0
10
20
30
40
50
60
standard
devia
tion (
pedest
rians)
std. dev.
Figure 16: Uncertainty quantification with the percentage of pedestrians sharing a socialidentity as uncertain parameter. The mean value and the percentiles of the number ofpedestrians who remain in danger are plotted on the left. The standard deviation is plottedon the right. Parameter percsharingSI is uniformly distributed between 60% and 100%.
Max evacuation timeUncertain parameter Mean Std. dev.all three parameters 21.35 5.68people sharing a social identity 21.62 1.11percentage of injured pedestrians 20.60 5.43speed of a helper with an injured pedestrian 21.81 3.29
Table 4: Comparison of impact of the uncertain parameters in the Social Identity ModelApplication on the maximum evacuation times.
25
sengers’ preferred walking speeds. Interestingly, this coincides with our newresults: In the Social Identity Model Application each injured agent changes,first and above all, targets: for itself and for potential aides. The percentageof pedestrians who share a social identity, on the other hand, has a com-paratively small impact. Moreover, if all three parameters are uncertain theimpact of the different uncertain parameter does not appear to be cumula-tive: The standard deviation of 5.68 seconds in the maximum evacuationtime is only marginally higher than the standard deviation of 5.43 secondswhen the percentage of injured pedestrians is the only uncertain parameter.
Through uncertainty quantification we attain a better and deeper un-derstanding of our new model and the parameters – an understanding thatcannot be derived from the model itself but is important to safety scientists.And we have good news: While the number of pedestrians sharing a socialidentity, or the degree of this identification, defies measurement, at least atpresent, the impact of its variation seems small. Thus, the model retains itspredictive power.
Finally, the results quantitatively substantiate our earlier claim that mod-elling social identity and the helping behaviour that ensues has a very signif-icant impact on evacuation simulations. Neglecting helping behaviour leadsto quantitative results at one extreme end of the analysis. In view of therange of the evacuation times in Figure 14, for example, neglecting injuredpedestrians would lead to a serious underestimation of evacuation times.
5. Conclusions
In this paper, we presented an algorithmic formulation of empirical find-ings from social psychology on human behaviour in a situation of great dan-ger and duress. In particular, we looked at the effect of social identificationwithin a crowd and ensuing helping behaviour during an evacuation. Forthis, we embedded our algorithm into a pedestrian evacuation simulation.We examined the behaviour in the simulation for a particular scenario thatresembled the bomb attack on a metro train in London on July 7th 2005.The computer simulation reproduced observations from the real evacuation.In particular, the agents evacuated in pairs of injured passengers and helpersand the overall behaviour was orderly. We argue, that this constitutes aqualitative validation of the computer model.
Crucially, we went a step beyond qualitative validation: In most cases,one or more model parameters that influence simulation outcomes are un-
26
certain. Either they are entirely unknown, such as the number of injuredpedestrians in our virtual evacuation, or they are measured with limited ac-curacy. We identified three parameters that could be decisive in our model:the percentage of injured pedestrians, the speed at which helpers and chargesevacuate, and the percentage of people who share a social identity. We useduncertainty quantification to quantify their influence in an example scenariofrom which more complex scenarios can be derived. Variations in the per-centage of injured pedestrians turned out to have a great influence, whereasvariations in the speed had a medium impact, and variations in the percent-age of pedestrians sharing a social identity had a relatively small impact.Since the latter parameter is very hard to measure, this is encouraging newsfor the safety scientist who needs predictive power of the model to give safetyadvise on the basis of simulations.
Quantitative validation of our model against measurements, such as tra-jectories of pedestrians or evacuation times, is still open and must remainopen until suitable data is available. Knowing this, we reported all modelparameters so that independent researchers can replicate and thus validate– or falsify – our findings.
We consider the instantiation of social identity and helping among strangersin our computer model as a proof of concept that it is indeed possible to carryover findings from social psychology into computer models that possess pre-dictive power. Having more realistic models constitutes progress in itself butthere is also an immediate practical application. Safety planners are able toget a much better estimation of evacuation times for scenarios with injuredpeople.
Yet, helping among strangers in emergencies is only one behaviour amongmany that stem from social identification and that are relevant to safety sci-ence. Another important example is the identification with ones own family.Also, with competing social identities the question arises which of the socialidentities is salient in which situation. Strategies to handle this must befound. Methods from uncertainty quantification which we have introducedto the field of safety science, promise to allow efficient characterisation andquantification of the influence of competing and interworking identities andof further social phenomena.
27

Acknowledgements
This work was funded by the German Federal Ministry of Education andResearch through the projects MEPKA on mathematical characteristics ofpedestrian stream models (grant number 17PNT028) and MultikOSi on as-sistance systems for urban events – multi criteria integration for opennessand safety (grant number 13N12824), and the Engineering and Physical Sci-ences Research Council (grant number EP/L505109/1). The authors alsoacknowledge the support by the Faculty Graduate Center CeDoSIA of TUMGraduate School at Technische Universitat Munchen, Germany.
Antonini, G., Bierlaire, M., Weber, M., 2006. Discrete choice models of pedes-trian walking behavior. Transportation Research Part B: Methodological40, 667–687.
Baker, W., Barnett, J., Marrion, C., Milke, J., Nelson, H., 2002. World TradeCenter Building Performance Study: Data Collection, Preliminary Obser-vations, and Recommendations. Federal Emergency Management Agency.chapter Chapter 2: WTC1 and WTC2. pp. 2–1 – 2–40.
Blue, V.J., Embrechts, M.J., Adler, J.L., 1997. Cellular automata modelingof pedestrian movements, in: IEEE International Conference on Systems,Man, and Cybernetics, pp. 2320–2323.
Carter, H., Drury, J., Amlot, R., Rubin, G.J., Williams, R., 2014. Effectiveresponder communication improves efficiency and psychological outcomesin a mass decontamination field experiment: Implications for public be-haviour in the event of a chemical incident. PLoS ONE 9, e89846.
Chu, M., Law, K., 2013. Computational framework incorporating human be-haviors for egress simulations. Journal of Computing in Civil Engineering27, 699–707.
Chu, M., Pan, X., Law, K., 2011. Incorporating social behaviors in egresssimulation, in: Computing in Civil Engineering. American Society of CivilEngineers. chapter 67, pp. 544–551.
Davidich, M., Koster, G., 2013. Predicting pedestrian flow: A methodologyand a proof of concept based on real-life data. PLoS ONE 8, 1–11.
28
Dijkstra, J., Jessurun, J., Vries, B., Timmermans, H., 2006. Agent archi-tecture for simulating pedestrians in the built environment, in: Agents inTraffic and Transportation, pp. 8–16.
Drury, J., Cocking, C., Reicher, S., 2009a. Everyone for themselves? Acomparative study of crowd solidarity among emergency survivors. BritishJournal of Social Psychology 28, 487–506.
Drury, J., Cocking, C., Reicher, S., 2009b. The nature of collective resilience:Survivor reactions to the 2005 London bombings. International Journal ofMass Emergencies and Disasters 27, 66–95.
Drury, J., Cocking, C., Reicher, S., Burton, A., Schofield, D., Hardwick,A., Graham, D., Langston, P., 2009c. Cooperation versus competition ina mass emergency evacuation: A new laboratory simulation and a newtheoretical model. Behavior Research Methods 41, 957–970.
Feinberg, J., Langtangen, H.P., 2015. Chaospy: An open source tool fordesigning methods of uncertainty quantification. Journal of ComputationalScience Volume 11, Pages 46–57.
Gipps, P., Marksjo, B., 1985. A micro-simulation model for pedestrian flows.Mathematics and Computers in Simulation 27, 95–105.
Grieve, D.W., Gear, R.J., 1966. The relationships between length of stride,step frequency, time of swing and speed of walking for children and adults.Ergonomics 9, 379–399.
Hartmann, D., 2010. Adaptive pedestrian dynamics based on geodesics. NewJournal of Physics 12, 043032.
Helbing, D., Molnar, P., 1995. Social Force Model for pedestrian dynamics.Physical Review E 51, 4282–4286.
Iaccarino, G., 2008. Quantification of uncertainty in flow simulations usingprobabilistic methods, in: VKI Lecture Series.
Jelic, A., Appert-Rolland, C., Lemercier, S., Pettre, J., 2012. Properties ofpedestrians walking in line. ii. stepping behavior. Physical Review E 86,046111.
29
Johnson, C., 2005. Lessons from the evacuation of the world trade center, sept11th 2001 for the future development of computer simulations. Cognition,Technology and Work 7, 214–240.
Karamouzas, I., Heil, P., van Beek, P., Overmars, M.H., 2009. A predic-tive collision avoidance model for pedestrian simulation, in: Motion inGames: Second International Workshop, MIG 2009, Zeist, The Nether-lands, November 21–24, 2009, Proceedings. Springer, pp. 41–52.
Kielar, P.M., Handel, O., Biedermann, D.H., Borrmann, A., 2014. Concur-rent hierarchical finite state machines for modeling pedestrian behavioraltendencies, in: The Conference in Pedestrian and Evacuation Dynamics2014, Delft, The Netherlands. pp. 576–584.
Kirik, E., Yurgel’yan, T., Krouglov, D., 2007. An intelligent floor field cellularautomation model for pedestrian dynamics, in: Proceedings of the 2007Summer Computer Simulation Conference, pp. 21:1–21:6.
Kirtley, C., Whittle, M.W., Jefferson, R., 1985. Influence of walking speedon gait parameters. Journal of Biomedical Engineering 7, 282–288.
Kneidl, A., 2015. How do people queue – a study of different queuing models,in: Traffic and Granular Flow ’15, Springer.
Koster, G., Zonnchen, B., 2014. Queuing at bottlenecks using a dynamicfloor field for navigation, in: The Conference in Pedestrian and EvacuationDynamics 2014, Delft, The Netherlands. pp. 344–352.
Kretz, T., 2009. Pedestrian traffic: on the quickest path. Journal of StatisticalMechanics: Theory and Experiment 2009, P03012.
Kretz, T., Bonisch, C., Vortisch, P., 2010. Comparison of various methods forthe calculation of the distance potential field, in: Klingsch, W., Rogsch, C.,Schadschneider, A., Schreckenberg, M. (Eds.), Pedestrian and EvacuationDynamics 2008, Springer Berlin Heidelberg. pp. 335–346. ISBN: 978-3-642-04503-5. 0804.3868.
Langston, P.A., Masling, R., Asmar, B.N., 2006. Crowd dynamics discreteelement multi-circle model. Safety Science 44, 395–417.
30

Levine, M., Prosser, A., Evans, D., Reicher, S., 2005. Identity and emer-gency intervention: how social group membership and inclusiveness ofgroup boundaries shape helping behavior. Personality and social psychol-ogy bulletin 31, 443–453.
Pan, X., Han, C., Dauber, K., Law, K., 2007. A multi-agent based frame-work for the simulation of human and social behaviors during emergencyevacuations. AI & Society 22, 113–132.
Perry, J., 1992. Gait Analysis: Normal and Pathological Function. SLACKIncorporated.
Reynolds, C.W., 1987. Flocks, herds and schools: A distributed behavioralmodel. ACM SIGGRAPH Computer Graphics 21, 25–34.
Reynolds, C.W., 1999. Steering behaviors for autonomous characters, in:Game Developers Conference, Miller Freeman Game Group, San Francisco,CA, San Jose, CA. pp. 763–782.
Schadschneider, A., 2001. Cellular automaton approach to pedestrian dy-namics - theory, in: Schreckenberg, M., Sharma, S.D. (Eds.), Pedestrianand Evacuation Dynamics. Springer, pp. 75–86.
Seitz, M.J., Dietrich, F., Koster, G., 2015. The effect of stepping on pedes-trian trajectories. Physica A: Statistical Mechanics and its Applications421, 594–604.
Seitz, M.J., Koster, G., 2012. Natural discretization of pedestrian movementin continuous space. Physical Review E 86, 046108.
Seitz, M.J., Koster, G., 2014. How update schemes influence crowd simula-tions. Journal of Statistical Mechanics: Theory and Experiment 7, P07002.
von Sivers, I., Koster, G., 2015. Dynamic stride length adaptation accordingto utility and personal space. Transportation Research Part B: Method-ological 74, 104 – 117.
von Sivers, I., Templeton, A., Koster, G., Drury, J., Philippides, A., 2014.Humans do not always act selfishly: Social identity and helping in emer-gency evacuation simulation, in: The Conference in Pedestrian and Evac-uation Dynamics 2014, Delft, The Netherlands. pp. 585–593.
31

Smith, R.C., 2014. Uncertainty Quantification: Theory, Implementation,and Applications. Computational Science and Engineering, Society forIndustrial and Applied Mathematics.
Sud, A., Andersen, E., Curtis, S., Lin, M.C., Manocha, D., 2008. Real-timepath planning in dynamic virtual environments using multiagent naviga-tion graphs. IEEE Transactions on Visualization and Computer Graphics14, 526–538.
Tajfel, H., Turner, J.C., 1979. Psychology of Intergroup Relations.Brooks/Cole. chapter An integrative theory of intergroup conflict. pp.33–47.
Templeton, A., Drury, J., Philippides, A., 2015. From mindless masses tosmall groups: Conceptualizing collective behavior in crowd modeling. Re-view of General Psychology 19, 215–229.
Tsai, J., Fridman, N., Bowring, E., Brown, M., Epstein, S., Kaminka, G.,Marsella, S., Ogden, A., Rika, I., Sheel, A., Taylor, M.E., Wang, X., Zilka,A., Tambe, M., 2011. Escapes: Evacuation simulation with children, au-thorities, parents, emotions, and social comparison, in: The 10th Interna-tional Conference on Autonomous Agents and Multiagent Systems - Vol-ume 2, International Foundation for Autonomous Agents and MultiagentSystems, Richland, SC. pp. 457 – 464.
Tucker, P.M., Pfefferbaum, B., North, C.S., Adrian Kent, J., Burgin, C.E.,Parker, D.E., Hossain, A., Jeon-Slaughter, H., Trautman, R.P., 2007.Physiologic reactivity despite emotional resilience several years after directexposure to terrorism. The American journal of psychiatry 164, 230–235.
Turner, J.C., Hogg, M.A., Oakes, P.J., Reicher, S.D., Wetherell, M.S., 1987.Rediscovering the social group: A self-categorization theory. Basil Black-well.
Xiu, D., 2007. Efficient collocational approach for parametric uncertaintyanalysis. Communications in computational physics 2, 293–309.
Xiu, D., 2009. Fast numerical methods for stochastic computations: a review.Communications in computational physics 5, 242–272.
32

Xiu, D., 2010. Numerical Methods for Stochastic Computations: A SpectralMethod Approach. PRINCETON UNIVERSITY PRESS.
Xiu, D., Karniadakis, G.E., 2002. The wiener–askey polynomial chaos forstochastic differential equations. SIAM Journal on Scientific Computing24, 61–644.
Xiu, D., Karniadakis, G.E., 2003. Modeling uncertainty in flow simulationsvia generalized polynomial chaos. Journal of Computational Physics 187,137–167.
33