Embed Size (px)
Citation preview
ORIGINAL ARTICLE
Modelling the acid/base 1H NMR chemical shift limitsof metabolites in human urine
Gregory D. Tredwell1,3 • Jacob G. Bundy1 • Maria De Iorio2 • Timothy M. D. Ebbels1
Received: 20 April 2016 / Accepted: 17 August 2016
� The Author(s) 2016. This article is published with open access at Springerlink.com
Abstract
Introduction Despite the use of buffering agents the 1H
NMR spectra of biofluid samples in metabolic profiling
investigations typically suffer from extensive peak fre-
quency shifting between spectra. These chemical shift
changes are mainly due to differences in pH and divalent
metal ion concentrations between the samples. This fre-
quency shifting results in a correspondence problem: it can
be hard to register the same peak as belonging to the same
molecule across multiple samples. The problem is espe-
cially acute for urine, which can have a wide range of ionic
concentrations between different samples.
Objectives To investigate the acid, base and metal ion
dependent 1H NMR chemical shift variations and limits of
the main metabolites in a complex biological mixture.
Methods Urine samples from five different individuals
were collected and pooled, and pre-treated with Chelex-
100 ion exchange resin. Urine samples were either treated
with either HCl or NaOH, or were supplemented with
various concentrations of CaCl2, MgCl2, NaCl or KCl, and
their 1H NMR spectra were acquired.
Results Nonlinear fitting was used to derive acid dissoci-
ation constants and acid and base chemical shift limits for
peaks from 33 identified metabolites. Peak pH titration
curves for a further 65 unidentified peaks were also
obtained for future reference. Furthermore, the peak vari-
ations induced by the main metal ions present in urine,
Na?, K?, Ca2? and Mg2?, were also measured.
Conclusion These data will be a valuable resource for 1H
NMR metabolite profiling experiments and for the devel-
opment of automated metabolite alignment and identifica-
tion algorithms for 1H NMR spectra.
Keywords NMR � pH � Peak shift � Acid/base limits
1 Introduction
1H NMR is widely used for the metabolomic analysis of
biofluids, as it provides quantitative, structural information
on a wide range of metabolites, in a non-destructive and
highly reproducible manner (Nicholson and Wilson 1989;
Wishart 2008; Zhang et al. 2010). However, metabolite
chemical shifts are sensitive to the chemical environment
and subtle matrix effects, such as differences in pH and
ionic strength, generally lead to inter-sample peak position
variation (Weljie et al. 2006).
Urine is a popular biofluid used for metabolomic
investigations, as it consists of various metabolites that can
provide insight into a number of metabolic processes and
disease states (Lindon et al. 1999). However, differences in
its other components (such as urea, salts and other ions) are
common, and result in often large variations in metabolite
peak chemical shifts (Lindon et al. 1999). The main metal
Electronic supplementary material The online version of thisarticle (doi:10.1007/s11306-016-1101-y) contains supplementarymaterial, which is available to authorized users.
& Gregory D. Tredwell
& Jacob G. Bundy
1 Department of Surgery and Cancer, Imperial College
London, London, UK
2 Department of Statistical Science, University College
London, London, UK
3 Department of Applied Mathematics, Australian National
University, Canberra, Australia
123
Metabolomics (2016) 12:152
DOI 10.1007/s11306-016-1101-y
ions present in urine are sodium, potassium, and the
divalent ions calcium and magnesium, however it is the
divalent ions that are the main contributors (after pH) to
peak chemical shift variability (Ackerman et al. 1996;
Lindon et al. 2007; Yang et al. 2008).
A number of studies have investigated different sample
preparation techniques in order to limit the pH and metal
ion dependent NMR peak position variation. Buffers are
commonly added to urine samples to control the pH vari-
ation of different samples. Lauridsen et al. (Lauridsen et al.
2007) recommended a minimum final concentration of
0.3 M for normal urine, and 1 M for concentrated urine
samples. Xiao et al. (2009) recommended using 1.5 M
buffer solutions in a 1:10 volume ratio of urine. While the
use of a strong buffer may limit many metabolite peaks
chemical shifts, a small number of metabolites, such as
citrate and histidine, still exhibit strong inter-sample
chemical shift variations (Lindon et al. 1999). In addition,
very salty samples reduce NMR sensitivity, especially for
cryogenically cooled probes. An alternative approach to
minimise pH-dependent shifts is to move the sample pH to
extreme values away from metabolite pKa values and
towards the acid/base chemical shift limits (Beneduci et al.
2011; Lehnert and Hunkler 1986; Sze and Jardetzky 1994;
Wevers et al. 1999). A potential problem with this
approach however may be the degradation of pH sensitive
metabolites through hydrolysis or redox reactions.
A number of approaches have been proposed to remove
the divalent metal ions from urine samples and therefore
remove their influence on metabolite peak chemical shifts.
Chelation of the divalent metals with EDTA has been used
with promising results (Asiago et al. 2008; Ross et al.
2007). However, the use of EDTA introduces a number of1H NMR signals for the free form as well as the Ca- and
Mg-bound chelate forms. Deuterated EDTA is available,
but this is quite expensive. Studies using biological 31P
NMR have often used ion-exchange resins (such as Chelex-
100) to remove paramagnetic metal ions, and some early
work in 1H NMR metabolic profiling also used these to
remove metal ions (Briceno et al. 2006; Cade-Menun and
Preston 1996; Fan et al. 1997, 2001). Another proposed
method for the removal of calcium and magnesium is the
formation of insoluble fluoride salts of the metals by the
addition of NaF or KF (Jiang et al. 2012). The metal pre-
cipitates can then be removed by centrifugation of the
samples; however, this method may not be suitable for all
metals and a combined approach with chelation may prove
to be optimal (Jiang et al. 2012).
Despite the attempts to limit the metabolite peak
chemical shifts, NMR spectra often require extensive pre-
processing prior to chemometric analysis. A number of
analytical strategies have been adopted to overcome
shifting NMR peaks, such as spectral binning, automated
alignment algorithms, or deconvolution methods that
match metabolite standards to the NMR spectra (Alm et al.
2009; Anderson et al. 2011; Hao et al. 2012; Liebeke et al.
2013; Veselkov et al. 2009; Weljie et al. 2006). However
each of these methods comes with certain drawbacks. For
example, spectral binning results in loss of information and
lower resolution, and still does not solve the problem of
correspondence of peaks near bin boundaries; peak align-
ment strategies can introduce artefacts and are not suit-
able for the (common) situation where adjacent peaks cross
over in frequency between samples; and successful peak
deconvolution may require a lot of user input to get the best
quality results.
Part of the problem lies in not knowing the extent of the
shifts for individual peaks. Different metabolite protons
have different chemical shift ranges and sensitivity to
varying sample properties, and therefore global methods to
account for peak shifts cannot be applied. A popular
commercial peak-fitting software package, NMR Suite
(Chenomx, Edmonton, Canada), provides chemical shift
ranges of individual peaks and multiplets for common pH
range values, and this assists the user to identify unknown
metabolites; however this information is not freely avail-
able, and also does not account for shifts caused by other
ions.
The pH dependency on NMR chemical shifts is not
always detrimental: this phenomenon has been used to
measure titration curves of various metabolites (Fan 1996).
When a monobasic ligand (L) becomes protonated (HL),
the change in the local electron density affects the chemical
shift for certain nuclei (Szakacs et al. 2004a). Since the
protonation event occurs effectively instantaneously on the
NMR time scale, the observed chemical shift (dobs) is
actually a weighted average of the limiting chemical shifts
of the unprotonated (dL) and the protonated (dHL) states ofthe molecule (Ackerman et al. 1996; Szakacs et al. 2004a).
The weighting factors correspond to the pH-dependent
mole fractions of L and HL, which can be expressed in
terms of the actual pH and the acid dissociation constant Ka
of the molecule as described by the Henderson-Hasselbalch
equation (Ackerman et al. 1996; Szakacs et al. 2004a).
Therefore the observed chemical shift can be expressed as
Eq. (1) (Ackerman et al. 1996), and the nonlinear fit of a
molecule’s 1H NMR titration curve to this equation reveals
the acid and base limiting chemical shifts dHL and dLrespectively, as well as the acid dissociation constant Ka for
that molecule.
dobs ¼dL þ dHL 10 pH�pKað Þ� �
1þ 10 pH�pKað Þ ð1Þ
For multibasic ligands (HnL), where n is the number of
protonation sites within the metabolite, Eq. (1) can be
extended to Eq. (2) (Szakacs et al. 2004a).
152 Page 2 of 10 G. D. Tredwell et al.
123
dobs ¼dL þ
Pni¼1 dHiL10
Pn
j¼n�iþ1pKj
� ��ipH
1þPn
k¼1 10
Pn
l¼n�kþ1pKl
� ��kpH
ð2Þ
This equation is much more complex than for the
monobasic ligand, due to interaction between protons
bound at different binding sites as well as the statistics of
proton binding (Onufriev et al. 2001). Three different
equilibrium constants—macroscopic, microscopic and
quasisite—have been described for multibasic ligands
(Onufriev et al. 2001; Ullmann 2003). The nonlinear fit of
an NMR titration curve to Eq. 2 gives the macroconstants,
but for molecules with multiple protonation sites with
similar pKa values, these macrospecies are actually mix-
tures of microspecies that hold identical numbers of pro-
tons but differ in the site of protonation (Ullmann 2003).
Thus, the macroconstants only refer to the stoichiometry of
proton binding, not the site of protonation, and a ligand
with n protonation sites has 2n microstates. It is also pos-
sible to characterise the titration curve of a multibasic
ligand with n protonation sites as a sum of N noninteracting
so called quasisites; see Onufriev et al. for a more in-depth
treatment (Onufriev et al. 2001).
Many studies that have used NMR to investigate pH
titration curves have focused on solutions of single
metabolites (Bezencon et al. 2014) or mixtures of a small
number of metabolites (Xiao et al. 2009), whereas in
metabolomics investigations complex biological matrices
are analysed. Here, we have characterised the pH- and ion-
dependent (Na?, K?, Ca2?, Mg2?) chemical shift changes
that occur in the 1H NMR spectra of urine. Knowledge of
the acid, base and metal ion dependent chemical shift limits
of the main metabolites in a complex biological mixture
will be important for metabolite assignments and will
provide information that we hope may prove valuable in
the future to help with designing alignment algorithms and
automatic peak detection methods.
2 Materials and methods
Urine samples from five different individuals were col-
lected in 1 day between 10 am and 3 pm, and placed on
ice. The collected samples were pooled, and then frozen at
-80 �C in aliquots of approximately 150 ml. Prior to the
NMR experiments, urine was passed through a column of
Chelex-100 ion exchange resin (BioRad) to remove the
majority of Ca2? and Mg2? ions, and the pH indicator
standards imidazole, formate, Tris and piperazine were
added to a final concentration of 1 mM, 1 mM, 0.25 mM
and 0.25 mM, respectively. We measured the main metal
ion concentrations in urine (Ca2?, Mg2?, Na? and K?)
with ion selective electrodes and pH measurements were
performed with a glass electrode with inbuilt temperature
sensor (Fisher Scientific).
For the pH titration experiment, two volumes of Chelex-
treated urine (200 ml) were treated dropwise with either
1 M HCl or 1 M NaOH while stirring. Samples were taken
for NMR (400 ll) at 0.2 pH unit intervals and were prepared
for NMR with addition of H2O (180 ll) and 2H2O (20 ll)containing 4,4-dimethyl-4-silapentane-1-sulfonic acid-2H6
(DSS) to give a final concentration of 0.1 mM. For the ion
titration experiment, Chelex-treated urine (400 ll), was
supplemented with H2O containing various concentrations
of CaCl2, MgCl2, NaCl or KCl, ranging from 0 to 1 M, and
D2O (20 ll) containing DSS to give a final concentration of
0.1 mM. NMR samples were centrifuged for 5 min at
13,000 rpm and 550 ll was transferred to a 5 mm NMR
tube. Spectra were acquired on a Bruker Avance DRX600
NMR spectrometer (Bruker BioSpin, Rheinstetten, Ger-
many), with 1H frequency of 600 MHz, and a 5 mm inverse
probe at a constant temperature of 300 K. Samples were
introduced with an automatic sampler and spectra were
acquired following the procedure described by Beckonert
et al. (2007). Briefly, a one-dimensional NOESY sequence
was used for water suppression; data were acquired into
64 K data points over a spectral width of 12 kHz, with 8
dummy scans and 128 scans per sample. Spectra were pro-
cessed in iNMR 3.4 (Nucleomatica, Molfetta, Italy). Fourier
transform of the free-induction decay was applied with a line
broadening of 0.5 Hz. Spectra were manually phased and
automated first order baseline correction was applied.
Metabolites were assigned at Metabolomics Standards Ini-
tiative (MSI) level 2 using the Chenomx NMR Suite 5.1
(Chenomx, Inc., Edmonton, Alberta, Canada). Metabolite
peak positions from the different samples relative to DSS
were obtained using MATLAB scripts written in-house by
Dr Gregory Tredwell, and appropriate chemical shifts were
determined for multiplets. A version of the scripts for peak
picking and spline fits are part of the BATMAN project
(batman.r-forge-project.org) (Liebeke et al. 2013). The
observed chemical shifts of the various metabolite peaks
were modelled with respect to pH with the general formula
(Eq. 2) for multibasic acids (HnL), using the nlinfit function
within MATLAB. The number of sites was assumed from
the chemical structure. This enabled the estimation of pKa
values and acid and base chemical shift limits for individual
metabolite peaks.
3 Results and discussion
In order to systematically characterise the pH and ionic
variation in a biologically relevant sample matrix, we
collected a urine sample from five different individuals and
Modelling the acid/base 1H NMR chemical shift limits of metabolites in human urine Page 3 of 10 152
123
pooled it to obtain a single large-volume representative
human urine sample. Our aim was to manipulate the pH of
the urine over a wide pH range and measure the resultant
peak variability with 1H NMR. It is likely that the large pH
changes would alter metal ion concentrations in the urine,
which could themselves interfere with the metabolite peak
chemical shifts. To limit the effect of these changes, the
main divalent metal ions, such as Ca2? and Mg2?, were
removed from the urine sample using Chelex ion exchange
resin before the pH adjustment step. The treatment reduced
the concentrations of Ca2? and Mg2?, without compro-
mising the metabolic composition of the urine (Supple-
mentary Fig. 1, Supplementary Table 1). While the ion
exchange resin was successful in removing the divalent
ions, K? concentrations were only slightly reduced by the
resin treatment, and Na? concentrations were slightly
increased as they were displaced from the resin by the
divalent ions. This was unfortunate as the sample ionic
strength has the potential to alter certain metabolite pKa
values and acid/base chemical shift limits (Xiao et al.
2009). However, as the increase in Na? from the Chelex
resin was relatively small compared with commonly used
buffer concentrations (Lauridsen et al. 2007; Xiao et al.
2009), and as the main ionic contributors to NMR peak
shift variations are the divalent ions Ca2? and Mg2?
(Ackerman et al. 1996; Lindon et al. 2007, 2011; Yang
et al. 2008), we felt that this was a suitable baseline urine
sample to continue our investigations.
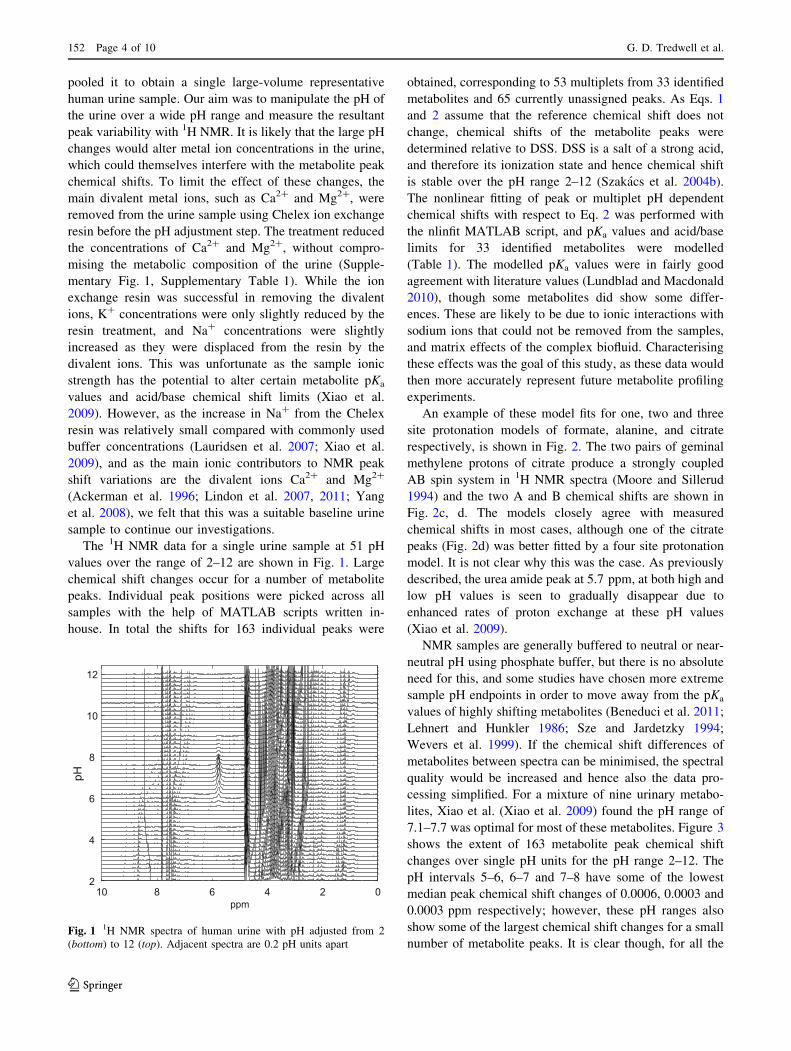
The 1H NMR data for a single urine sample at 51 pH
values over the range of 2–12 are shown in Fig. 1. Large
chemical shift changes occur for a number of metabolite
peaks. Individual peak positions were picked across all
samples with the help of MATLAB scripts written in-
house. In total the shifts for 163 individual peaks were
obtained, corresponding to 53 multiplets from 33 identified
metabolites and 65 currently unassigned peaks. As Eqs. 1
and 2 assume that the reference chemical shift does not
change, chemical shifts of the metabolite peaks were
determined relative to DSS. DSS is a salt of a strong acid,
and therefore its ionization state and hence chemical shift
is stable over the pH range 2–12 (Szakacs et al. 2004b).
The nonlinear fitting of peak or multiplet pH dependent
chemical shifts with respect to Eq. 2 was performed with
the nlinfit MATLAB script, and pKa values and acid/base
limits for 33 identified metabolites were modelled
(Table 1). The modelled pKa values were in fairly good
agreement with literature values (Lundblad and Macdonald
2010), though some metabolites did show some differ-
ences. These are likely to be due to ionic interactions with
sodium ions that could not be removed from the samples,
and matrix effects of the complex biofluid. Characterising
these effects was the goal of this study, as these data would
then more accurately represent future metabolite profiling
experiments.
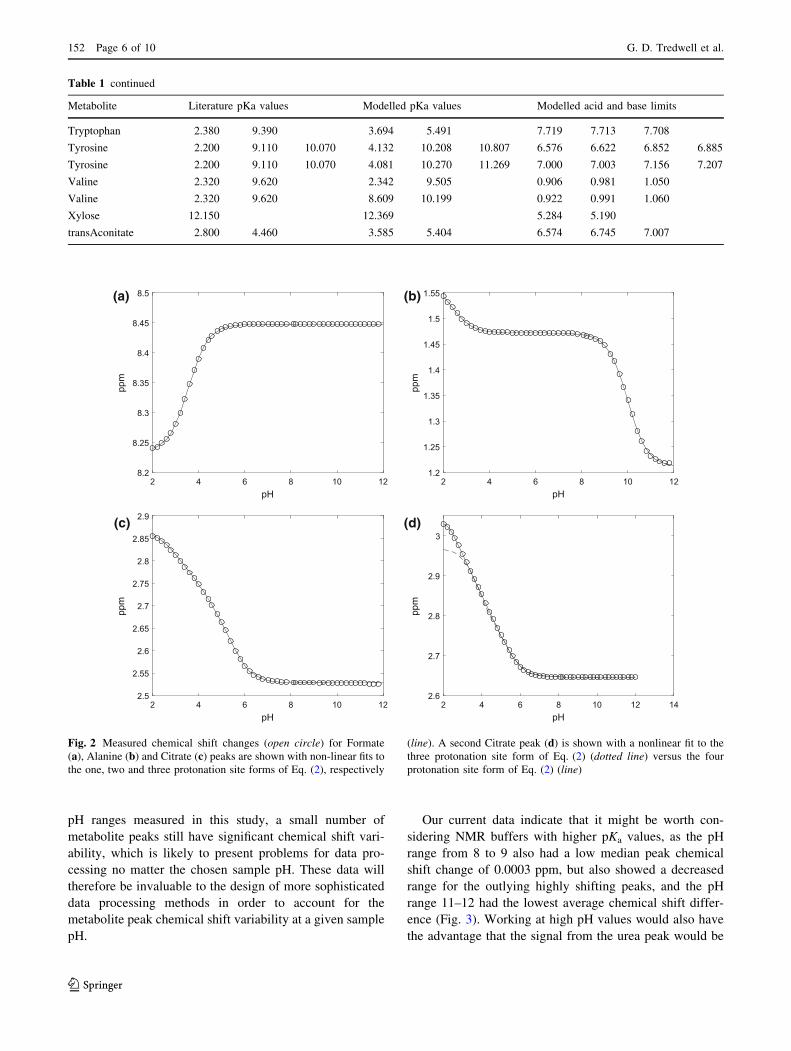
An example of these model fits for one, two and three
site protonation models of formate, alanine, and citrate
respectively, is shown in Fig. 2. The two pairs of geminal
methylene protons of citrate produce a strongly coupled
AB spin system in 1H NMR spectra (Moore and Sillerud
1994) and the two A and B chemical shifts are shown in
Fig. 2c, d. The models closely agree with measured
chemical shifts in most cases, although one of the citrate
peaks (Fig. 2d) was better fitted by a four site protonation
model. It is not clear why this was the case. As previously
described, the urea amide peak at 5.7 ppm, at both high and
low pH values is seen to gradually disappear due to
enhanced rates of proton exchange at these pH values
(Xiao et al. 2009).
NMR samples are generally buffered to neutral or near-
neutral pH using phosphate buffer, but there is no absolute
need for this, and some studies have chosen more extreme
sample pH endpoints in order to move away from the pKa
values of highly shifting metabolites (Beneduci et al. 2011;
Lehnert and Hunkler 1986; Sze and Jardetzky 1994;
Wevers et al. 1999). If the chemical shift differences of
metabolites between spectra can be minimised, the spectral
quality would be increased and hence also the data pro-
cessing simplified. For a mixture of nine urinary metabo-
lites, Xiao et al. (Xiao et al. 2009) found the pH range of
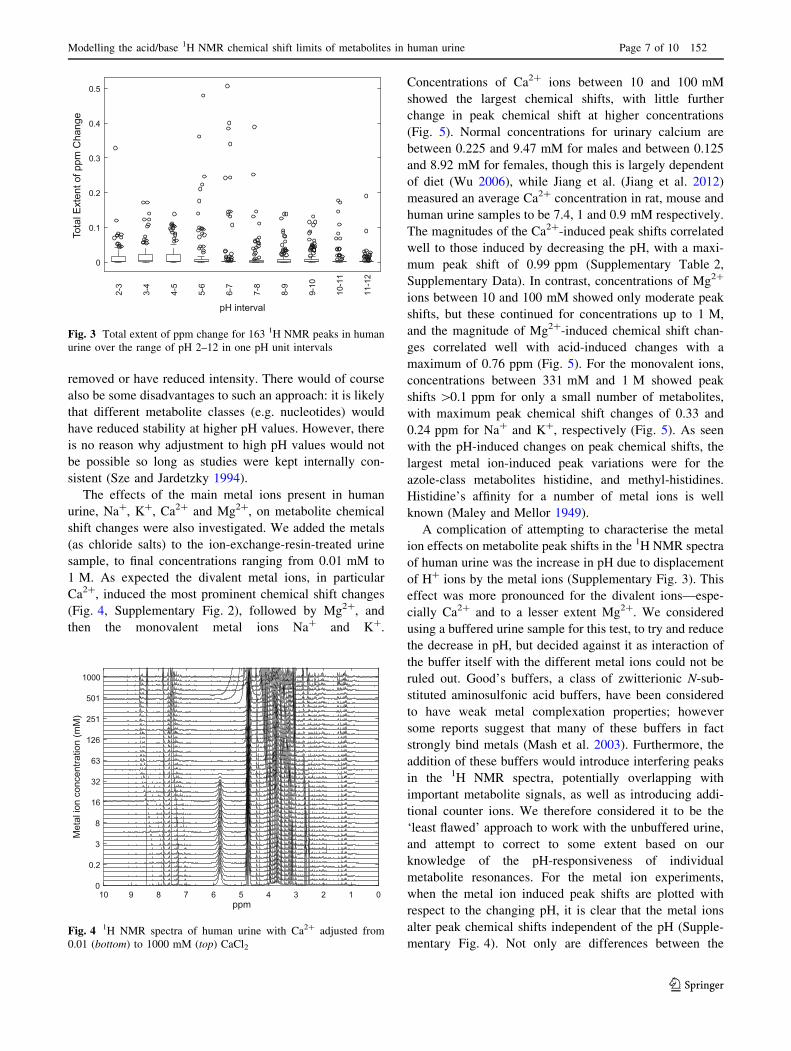
7.1–7.7 was optimal for most of these metabolites. Figure 3
shows the extent of 163 metabolite peak chemical shift
changes over single pH units for the pH range 2–12. The
pH intervals 5–6, 6–7 and 7–8 have some of the lowest
median peak chemical shift changes of 0.0006, 0.0003 and
0.0003 ppm respectively; however, these pH ranges also
show some of the largest chemical shift changes for a small
number of metabolite peaks. It is clear though, for all the
02468102
4
6
8
10
12
pH
ppm
Fig. 1 1H NMR spectra of human urine with pH adjusted from 2
(bottom) to 12 (top). Adjacent spectra are 0.2 pH units apart
152 Page 4 of 10 G. D. Tredwell et al.
123
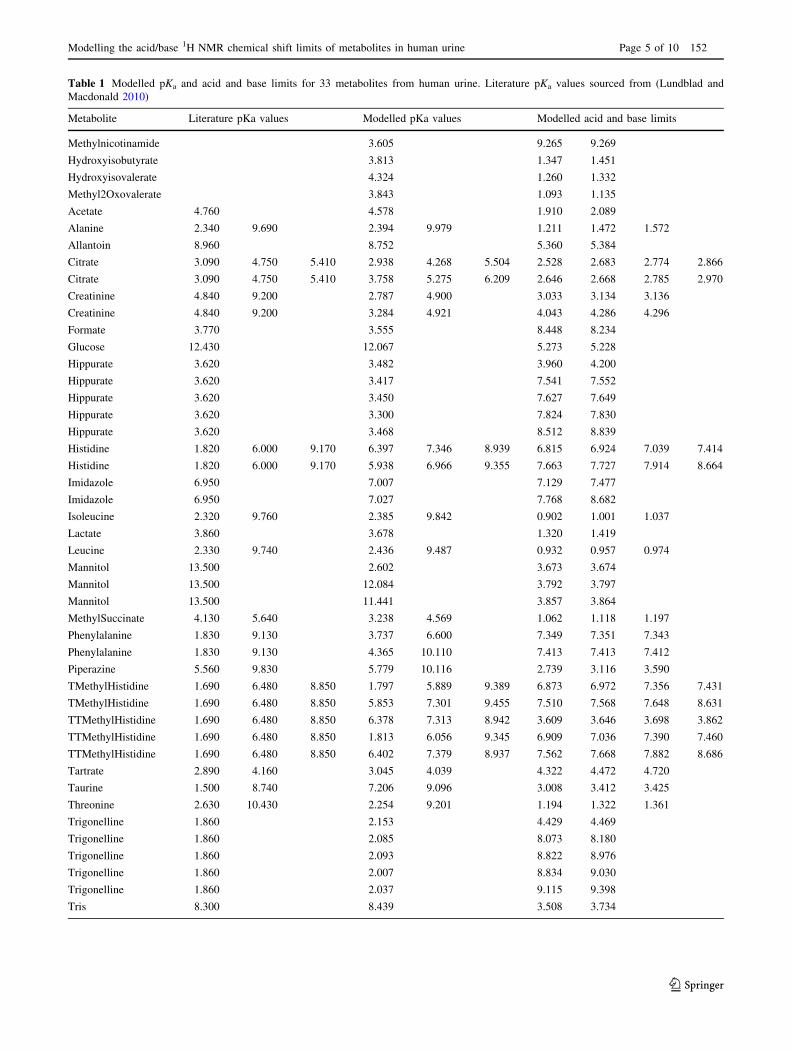
Table 1 Modelled pKa and acid and base limits for 33 metabolites from human urine. Literature pKa values sourced from (Lundblad and
Macdonald 2010)
Metabolite Literature pKa values Modelled pKa values Modelled acid and base limits
Methylnicotinamide 3.605 9.265 9.269
Hydroxyisobutyrate 3.813 1.347 1.451
Hydroxyisovalerate 4.324 1.260 1.332
Methyl2Oxovalerate 3.843 1.093 1.135
Acetate 4.760 4.578 1.910 2.089
Alanine 2.340 9.690 2.394 9.979 1.211 1.472 1.572
Allantoin 8.960 8.752 5.360 5.384
Citrate 3.090 4.750 5.410 2.938 4.268 5.504 2.528 2.683 2.774 2.866
Citrate 3.090 4.750 5.410 3.758 5.275 6.209 2.646 2.668 2.785 2.970
Creatinine 4.840 9.200 2.787 4.900 3.033 3.134 3.136
Creatinine 4.840 9.200 3.284 4.921 4.043 4.286 4.296
Formate 3.770 3.555 8.448 8.234
Glucose 12.430 12.067 5.273 5.228
Hippurate 3.620 3.482 3.960 4.200
Hippurate 3.620 3.417 7.541 7.552
Hippurate 3.620 3.450 7.627 7.649
Hippurate 3.620 3.300 7.824 7.830
Hippurate 3.620 3.468 8.512 8.839
Histidine 1.820 6.000 9.170 6.397 7.346 8.939 6.815 6.924 7.039 7.414
Histidine 1.820 6.000 9.170 5.938 6.966 9.355 7.663 7.727 7.914 8.664
Imidazole 6.950 7.007 7.129 7.477
Imidazole 6.950 7.027 7.768 8.682
Isoleucine 2.320 9.760 2.385 9.842 0.902 1.001 1.037
Lactate 3.860 3.678 1.320 1.419
Leucine 2.330 9.740 2.436 9.487 0.932 0.957 0.974
Mannitol 13.500 2.602 3.673 3.674
Mannitol 13.500 12.084 3.792 3.797
Mannitol 13.500 11.441 3.857 3.864
MethylSuccinate 4.130 5.640 3.238 4.569 1.062 1.118 1.197
Phenylalanine 1.830 9.130 3.737 6.600 7.349 7.351 7.343
Phenylalanine 1.830 9.130 4.365 10.110 7.413 7.413 7.412
Piperazine 5.560 9.830 5.779 10.116 2.739 3.116 3.590
TMethylHistidine 1.690 6.480 8.850 1.797 5.889 9.389 6.873 6.972 7.356 7.431
TMethylHistidine 1.690 6.480 8.850 5.853 7.301 9.455 7.510 7.568 7.648 8.631
TTMethylHistidine 1.690 6.480 8.850 6.378 7.313 8.942 3.609 3.646 3.698 3.862
TTMethylHistidine 1.690 6.480 8.850 1.813 6.056 9.345 6.909 7.036 7.390 7.460
TTMethylHistidine 1.690 6.480 8.850 6.402 7.379 8.937 7.562 7.668 7.882 8.686
Tartrate 2.890 4.160 3.045 4.039 4.322 4.472 4.720
Taurine 1.500 8.740 7.206 9.096 3.008 3.412 3.425
Threonine 2.630 10.430 2.254 9.201 1.194 1.322 1.361
Trigonelline 1.860 2.153 4.429 4.469
Trigonelline 1.860 2.085 8.073 8.180
Trigonelline 1.860 2.093 8.822 8.976
Trigonelline 1.860 2.007 8.834 9.030
Trigonelline 1.860 2.037 9.115 9.398
Tris 8.300 8.439 3.508 3.734
Modelling the acid/base 1H NMR chemical shift limits of metabolites in human urine Page 5 of 10 152
123
pH ranges measured in this study, a small number of
metabolite peaks still have significant chemical shift vari-
ability, which is likely to present problems for data pro-
cessing no matter the chosen sample pH. These data will
therefore be invaluable to the design of more sophisticated
data processing methods in order to account for the
metabolite peak chemical shift variability at a given sample
pH.
Our current data indicate that it might be worth con-
sidering NMR buffers with higher pKa values, as the pH
range from 8 to 9 also had a low median peak chemical
shift change of 0.0003 ppm, but also showed a decreased
range for the outlying highly shifting peaks, and the pH
range 11–12 had the lowest average chemical shift differ-
ence (Fig. 3). Working at high pH values would also have
the advantage that the signal from the urea peak would be
Table 1 continued
Metabolite Literature pKa values Modelled pKa values Modelled acid and base limits
Tryptophan 2.380 9.390 3.694 5.491 7.719 7.713 7.708
Tyrosine 2.200 9.110 10.070 4.132 10.208 10.807 6.576 6.622 6.852 6.885
Tyrosine 2.200 9.110 10.070 4.081 10.270 11.269 7.000 7.003 7.156 7.207
Valine 2.320 9.620 2.342 9.505 0.906 0.981 1.050
Valine 2.320 9.620 8.609 10.199 0.922 0.991 1.060
Xylose 12.150 12.369 5.284 5.190
transAconitate 2.800 4.460 3.585 5.404 6.574 6.745 7.007
2 4 6 8 10 12pH
8.2
8.25
8.3
8.35
8.4
8.45
8.5
2 4 6 8 10 12pH
1.2
1.25
1.3
1.35
1.4
1.45
1.5
1.55
2 4 6 8 10 12pH
2.5
2.55
2.6
2.65
2.7
2.75
2.8
2.85
2.9
2 4 6 8 10 12 14pH
2.6
2.7
2.8
2.9
3
(b)(a)
(d)(c)
ppm
ppm
mp pmpp
Fig. 2 Measured chemical shift changes (open circle) for Formate
(a), Alanine (b) and Citrate (c) peaks are shown with non-linear fits tothe one, two and three protonation site forms of Eq. (2), respectively
(line). A second Citrate peak (d) is shown with a nonlinear fit to the
three protonation site form of Eq. (2) (dotted line) versus the four
protonation site form of Eq. (2) (line)
152 Page 6 of 10 G. D. Tredwell et al.
123
removed or have reduced intensity. There would of course
also be some disadvantages to such an approach: it is likely
that different metabolite classes (e.g. nucleotides) would
have reduced stability at higher pH values. However, there
is no reason why adjustment to high pH values would not
be possible so long as studies were kept internally con-
sistent (Sze and Jardetzky 1994).
The effects of the main metal ions present in human
urine, Na?, K?, Ca2? and Mg2?, on metabolite chemical
shift changes were also investigated. We added the metals
(as chloride salts) to the ion-exchange-resin-treated urine
sample, to final concentrations ranging from 0.01 mM to
1 M. As expected the divalent metal ions, in particular
Ca2?, induced the most prominent chemical shift changes
(Fig. 4, Supplementary Fig. 2), followed by Mg2?, and
then the monovalent metal ions Na? and K?.
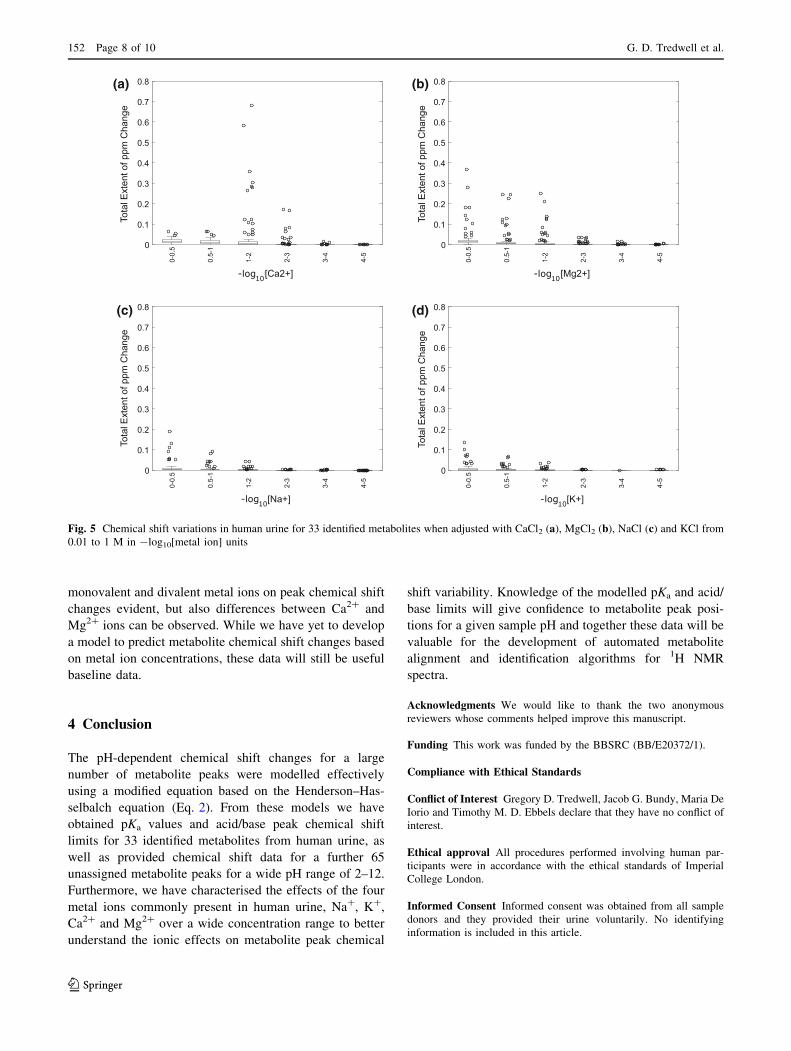
Concentrations of Ca2? ions between 10 and 100 mM
showed the largest chemical shifts, with little further
change in peak chemical shift at higher concentrations
(Fig. 5). Normal concentrations for urinary calcium are
between 0.225 and 9.47 mM for males and between 0.125
and 8.92 mM for females, though this is largely dependent
of diet (Wu 2006), while Jiang et al. (Jiang et al. 2012)
measured an average Ca2? concentration in rat, mouse and
human urine samples to be 7.4, 1 and 0.9 mM respectively.
The magnitudes of the Ca2?-induced peak shifts correlated
well to those induced by decreasing the pH, with a maxi-
mum peak shift of 0.99 ppm (Supplementary Table 2,
Supplementary Data). In contrast, concentrations of Mg2?
ions between 10 and 100 mM showed only moderate peak
shifts, but these continued for concentrations up to 1 M,
and the magnitude of Mg2?-induced chemical shift chan-
ges correlated well with acid-induced changes with a
maximum of 0.76 ppm (Fig. 5). For the monovalent ions,
concentrations between 331 mM and 1 M showed peak
shifts [0.1 ppm for only a small number of metabolites,
with maximum peak chemical shift changes of 0.33 and
0.24 ppm for Na? and K?, respectively (Fig. 5). As seen
with the pH-induced changes on peak chemical shifts, the
largest metal ion-induced peak variations were for the
azole-class metabolites histidine, and methyl-histidines.
Histidine’s affinity for a number of metal ions is well
known (Maley and Mellor 1949).
A complication of attempting to characterise the metal
ion effects on metabolite peak shifts in the 1H NMR spectra
of human urine was the increase in pH due to displacement
of H? ions by the metal ions (Supplementary Fig. 3). This
effect was more pronounced for the divalent ions—espe-
cially Ca2? and to a lesser extent Mg2?. We considered
using a buffered urine sample for this test, to try and reduce
the decrease in pH, but decided against it as interaction of
the buffer itself with the different metal ions could not be
ruled out. Good’s buffers, a class of zwitterionic N-sub-
stituted aminosulfonic acid buffers, have been considered
to have weak metal complexation properties; however
some reports suggest that many of these buffers in fact
strongly bind metals (Mash et al. 2003). Furthermore, the
addition of these buffers would introduce interfering peaks
in the 1H NMR spectra, potentially overlapping with
important metabolite signals, as well as introducing addi-
tional counter ions. We therefore considered it to be the
‘least flawed’ approach to work with the unbuffered urine,
and attempt to correct to some extent based on our
knowledge of the pH-responsiveness of individual
metabolite resonances. For the metal ion experiments,
when the metal ion induced peak shifts are plotted with
respect to the changing pH, it is clear that the metal ions
alter peak chemical shifts independent of the pH (Supple-
mentary Fig. 4). Not only are differences between the
0
0.1
0.2
0.3
0.4
0.5
pH interval
2-3
3-4
4-5
5-6
6-7
7-8
8-9
9-10
10-1
1
11-1
2
Tota
l Ext
ent o
f ppm
Cha
nge
Fig. 3 Total extent of ppm change for 163 1H NMR peaks in human
urine over the range of pH 2–12 in one pH unit intervals
012345678910ppm
0
0.2
3
8
16
32
63
126
251
501
1000
Met
al io
n co
ncen
tratio
n (m
M)
Fig. 4 1H NMR spectra of human urine with Ca2? adjusted from
0.01 (bottom) to 1000 mM (top) CaCl2
Modelling the acid/base 1H NMR chemical shift limits of metabolites in human urine Page 7 of 10 152
123
monovalent and divalent metal ions on peak chemical shift
changes evident, but also differences between Ca2? and
Mg2? ions can be observed. While we have yet to develop
a model to predict metabolite chemical shift changes based
on metal ion concentrations, these data will still be useful
baseline data.
4 Conclusion
The pH-dependent chemical shift changes for a large
number of metabolite peaks were modelled effectively
using a modified equation based on the Henderson–Has-
selbalch equation (Eq. 2). From these models we have
obtained pKa values and acid/base peak chemical shift
limits for 33 identified metabolites from human urine, as
well as provided chemical shift data for a further 65
unassigned metabolite peaks for a wide pH range of 2–12.
Furthermore, we have characterised the effects of the four
metal ions commonly present in human urine, Na?, K?,
Ca2? and Mg2? over a wide concentration range to better
understand the ionic effects on metabolite peak chemical
shift variability. Knowledge of the modelled pKa and acid/
base limits will give confidence to metabolite peak posi-
tions for a given sample pH and together these data will be
valuable for the development of automated metabolite
alignment and identification algorithms for 1H NMR
spectra.
Acknowledgments We would like to thank the two anonymous
reviewers whose comments helped improve this manuscript.
Funding This work was funded by the BBSRC (BB/E20372/1).
Compliance with Ethical Standards
Conflict of Interest Gregory D. Tredwell, Jacob G. Bundy, Maria De
Iorio and Timothy M. D. Ebbels declare that they have no conflict of
interest.
Ethical approval All procedures performed involving human par-
ticipants were in accordance with the ethical standards of Imperial
College London.
Informed Consent Informed consent was obtained from all sample
donors and they provided their urine voluntarily. No identifying
information is included in this article.
0
0.1
0.2
0.3
0.4
0.5
0.6
0.7
0.8
log10[Ca2+]
0-0.
5
0.5-
1
1-2
2-3
3-4
4-5
0
0.1
0.2
0.3
0.4
0.5
0.6
0.7
0.8
log10[Mg2+]
0-0.
5
0.5-
1
1-2
2-3
3-4
4-5
0
0.1
0.2
0.3
0.4
0.5
0.6
0.7
0.8
log10[Na+]
0-0.
5
0.5-
1
1-2
2-3
3-4
4-5
0
0.1
0.2
0.3
0.4
0.5
0.6
0.7
0.8
log10[K+]
0-0.
5
0.5-
1
1-2
2-3
3-4
4-5
(b)(a)
(d)(c)
-log10
-log10 -log10
-log10
Tota
l Ext
ent o
f ppm
Cha
nge
Tota
l Ext
ent o
f ppm
Cha
nge
Tota
l Ext
ent o
f ppm
Cha
nge
Tota
l Ext
ent o
f ppm
Cha
nge
Fig. 5 Chemical shift variations in human urine for 33 identified metabolites when adjusted with CaCl2 (a), MgCl2 (b), NaCl (c) and KCl from
0.01 to 1 M in -log10[metal ion] units
152 Page 8 of 10 G. D. Tredwell et al.
123
Open Access This article is distributed under the terms of the
Creative Commons Attribution 4.0 International License (http://crea
tivecommons.org/licenses/by/4.0/), which permits unrestricted use,
distribution, and reproduction in any medium, provided you give
appropriate credit to the original author(s) and the source, provide a
link to the Creative Commons license, and indicate if changes were
made.
References
Ackerman, J. J. H., Soto, G. E., Spees, W. M., Zhu, Z., & Evelhoch, J.
L. (1996). The NMR chemical shift pH measurement revisited:
Analysis of error and modeling of a pH dependent reference.
Magnetic Resonance in Medicine, 36(5), 674–683. doi:10.1002/
mrm.1910360505.
Alm, E., Torgrip, R. J. O., Aberg, K. M., Schuppe-Koistinen, I., &
Lindberg, J. (2009). A solution to the 1D NMR alignment
problem using an extended generalized fuzzy Hough transform
and mode support. Analytical and Bioanalytical Chemistry,
395(1), 213–223. doi:10.1007/s00216-009-2940-4.
Anderson, P. E., Mahle, D. A., Doom, T. E., Reo, N. V., DelRaso, N.
J., & Raymer, M. L. (2011). Dynamic adaptive binning: An
improved quantification technique for NMR spectroscopic data.
Metabolomics, 7(2), 179–190. doi:10.1007/s11306-010-0242-7.
Asiago, V. M., Nagana Gowda, G. A., Zhang, S., Shanaiah, N., Clark,
J., & Raftery, D. (2008). Use of EDTA to minimize ionic
strength dependent frequency shifts in the 1H NMR spectra of
urine. Metabolomics, 4(4), 328–336. doi:10.1007/s11306-008-
0121-7.
Beckonert, O., Keun, H. C., Ebbels, T. M. D., Bundy, J., Holmes, E.,
Lindon, J. C., et al. (2007). Metabolic profiling, metabolomic
and metabonomic procedures for NMR spectroscopy of urine,
plasma, serum and tissue extracts. Nature Protocols, 2(11),
2692–2703. doi:10.1038/nprot.2007.376.
Beneduci, A., Chidichimo, G., Dardo, G., & Pontoni, G. (2011).
Highly routinely reproducible alignment of 1H NMR spectral
peaks of metabolites in huge sets of urines. Analytica Chimica
Acta, 685(2), 186–195. doi:10.1016/j.aca.2010.11.027.
Bezencon, J., Wittwer, M. B., Cutting, B., Smiesko, M., Wagner, B.,
Kansy, M., et al. (2014). PKa determination by 1H NMR
spectroscopy—An old methodology revisited. Journal of Phar-
maceutical and Biomedical Analysis, 93, 147–155. doi:10.1016/
j.jpba.2013.12.014.
Briceno, M., Escudey, M., Galindo, G., Borchardt, D., & Chang, A.
(2006). Comparison of extraction procedures used in determi-
nation of phosphorus species by 31 P-NMR in Chilean volcanic
soils. Communications in Soil Science and Plant Analysis,
37(11–12), 1553–1569. doi:10.1080/00103620600710116.
Cade-Menun, B. J., & Preston, C. M. (1996). A comparison of soil
extraction procedures for 31P NMR spectroscopy. Soil Science,
161(11), 770–785. doi:10.1097/00010694-199611000-00006.
Fan, T. W.-M. (1996). Metabolite profiling by one- and two-
dimensional NMR analysis of complex mixtures. Progress in
Nuclear Magnetic Resonance Spectroscopy, 28(2), 161–219.
doi:10.1016/0079-6565(95)01017-3.
Fan, T. W.-M., Lane, A. N., Pedler, J., Crowley, D., & Higashi, R. M.
(1997). Comprehensive analysis of organic ligands in whole root
exudates using nuclear magnetic resonance and gas chromatog-
raphy—mass spectrometry. Analytical Biochemistry, 251(1),
57–68. doi:10.1006/abio.1997.2235.
Fan, T. W.-M., Lane, A. N., Shenker, M., Bartley, J. P., Crowley, D.,
& Higashi, R. M. (2001). Comprehensive chemical profiling of
gramineous plant root exudates using high-resolution NMR and
MS. Phytochemistry, 57(2), 209–221. doi:10.1016/S0031-
9422(01)00007-3.
Hao, J., Astle, W., De Iorio, M., & Ebbels, T. M. D. (2012).
Batman—an R package for the automated quantification of
metabolites from nuclear magnetic resonance spectra using a
bayesian model. Bioinformatics, 28(15), 2088–2090. doi:10.
1093/bioinformatics/bts308.
Jiang, L., Huang, J., Wang, Y., & Tang, H. (2012). Eliminating the
dication-induced intersample chemical-shift variations for NMR-
based biofluid metabonomic analysis. The Analyst, 137(18),
4209–4219. doi:10.1039/c2an35392j.
Lauridsen, M., Hansen, S. H., Jaroszewski, J. W., & Cornett, C. (2007).
Human urine as test material in 1H NMR-based metabonomics:
Recommendations for sample preparation and storage. Analytical
Chemistry, 79(3), 1181–1186. doi:10.1021/ac061354x.
Lehnert, W., & Hunkler, D. (1986). Possibilities of selective
screening for inborn errors of metabolism using high-resolution
1H-FT-NMR spectrometry. European Journal of Pediatrics,
145(4), 260–266. doi:10.1007/BF00439397.
Liebeke, M., Hao, J., Ebbels, T. M. D., & Bundy, J. G. (2013).
Combining spectral ordering with peak fitting for one-dimen-
sional NMR quantitative metabolomics. Analytical Chemistry,
85(9), 4605–4612. doi:10.1021/ac400237w.
Lindon, J. C., Holmes, E., & Nicholson, J. K. (2007). Metabonomics
in pharmaceutical R & D. FEBS Journal, 274(5), 1140–1151.
doi:10.1111/j.1742-4658.2007.05673.x.
Lindon, J. C., Nicholson, J. K., & Everett, J. R. (1999). NMR
spectroscopy of biofluids. Annual Reports on NMR Spec-
troscopy,. doi:10.1016/S0066-4103(08)60035-6.
Lindon, J. C., Nicholson, J. K., & Holmes, E. (Eds.). (2011). The
Handbook of metabonomics and metabolomics. Amsterdam:
Elsevier. doi:10.1016/b978-044452841-4/50002-3.
Lundblad, R. L., & Macdonald, F. (2010). In R. Lundblad & F.
MacDonald (Eds.), Handbook of biochemistry and molecular
biology. Boca Raton: CRC Press. doi:10.1201/b10501.
Maley, L. E., & Mellor, D. P. (1949). The relative stability of internal
metal Complexes. II. Metal derivatives of 8-hydroxyquinoline
5-sulphonic acid and a series of monocarboxylic mono-a-amino
acids including Histidine. Australian Journal of Chemistry, 2(4),
579–594. doi:10.1071/CH9490579.
Mash, H. E., Chin, Y.-P., Sigg, L., Hari, R., & Xue, H. (2003).
Complexation of copper by zwitterionic aminosulfonic (good)
buffers. Analytical Chemistry, 75(3), 671–677. doi:10.1021/
ac0261101.
Moore, G. J., & Sillerud, L. O. (1994). The pH dependence of
chemical shift and spin-spin coupling for citrate. Journal of
Magnetic Resonance Series B, 103(1), 87–88. doi:10.1006/jmrb.
1994.1013.
Nicholson, J. K., & Wilson, I. D. (1989). High resolution proton
magnetic resonance spectroscopy of biological fluids. Progress
in Nuclear Magnetic Resonance Spectroscopy, 21(4–5),
449–501. doi:10.1016/0079-6565(89)80008-1.
Onufriev, A., Case, D. A., & Ullmann, G. M. (2001). A novel view of
pH titration in biomolecules. Biochemistry, 40(12), 3413–3419.
doi:10.1021/bi002740q.
Ross, A., Schlotterbeck, G., Dieterle, F., & Senn, H. (2007). NMR
spectroscopy techniques for application to metabonomics (pp.
55–112). Amsterdam: Elsevier.
Szakacs, Z., Hagele, G., & Tyka, R. (2004a). 1H/31P NMR pH
indicator series to eliminate the glass electrode in NMR
spectroscopic pKa determinations. Analytica Chimica Acta,
522(2), 247–258. doi:10.1016/j.aca.2004.07.005.
Szakacs, Z., Kraszni, M., & Noszal, B. (2004b). Determination of
microscopic acid-base parameters from NMR-pH titrations.
Analytical and Bioanalytical Chemistry, 378(6), 1428–1448.
doi:10.1007/s00216-003-2390-3.
Modelling the acid/base 1H NMR chemical shift limits of metabolites in human urine Page 9 of 10 152
123
Sze, D. Y., & Jardetzky, O. (1994). High-resolution proton NMR
studies of lymphocyte extracts. ImmunoMethods, 4(2), 113–126.
doi:10.1006/immu.1994.1013.
Ullmann, G. M. (2003). Relations between protonation constants and
titration curves in polyprotic acids: A critical view. Journal of
Physical Chemistry B, 107(5), 1263–1271. doi:10.1021/
jp026454v.
Veselkov, K. A., Lindon, J. C., Ebbels, T. M. D., Crockford, D.,
Volynkin, V. V., Holmes, E., et al. (2009). Recursive segment-
wise peak alignment of biological 1H NMR spectra for improved
metabolic biomarker recovery. Analytical Chemistry, 81(1),
56–66. doi:10.1021/ac8011544.
Weljie, A. M., Newton, J., Mercier, P., Carlson, E., & Slupsky, C. M.
(2006). Targeted pofiling: Quantitative analysis of1H NMR
metabolomics data. Analytical Chemistry, 78(13), 4430–4442.
doi:10.1021/ac060209g.
Wevers, R. A., Engelke, U. F. H., Moolenaar, S. H., Brautigam, C., de
Jong, J. G. N., Duran, R., et al. (1999). 1H-NMR spectroscopy of
body fluids: Inborn errors of purine and pyrimidine metabolism.
Clinical Chemistry, 45(4), 539–548. doi:10.1023/A:
1005313524869.
Wishart, D. S. (2008). Quantitative metabolomics using NMR.
TrAC—Trends in Analytical Chemistry, 27(3), 228–237.
doi:10.1016/j.trac.2007.12.001.
Wu, A. H. B. (2006). Tietz Clinical Guide to Laboratory Tests.
Philadelphia: Elsevier Health Sciences.
Xiao, C., Hao, F., Qin, X., Wang, Y., & Tang, H. (2009). An
optimized buffer system for NMR-based urinary metabonomics
with effective pH control, chemical shift consistency and
dilution minimization. The Analyst, 134(5), 916–925. doi:10.
1039/b818802e.
Yang, W., Wang, Y., Zhou, Q., & Tang, H. (2008). Analysis of
human urine metabolites using SPE and NMR spectroscopy.
Science in China. Series B, 51(3), 218–225. doi:10.1007/s11426-
008-0031-6.
Zhang, S., Nagana Gowda, G. A., Ye, T., & Raftery, D. (2010).
Advances in NMR-based biofluid analysis and metabolite
profiling. The Analyst, 135(7), 1490–1498. doi:10.1039/
c000091d.
152 Page 10 of 10 G. D. Tredwell et al.
123