Embed Size (px)
Citation preview
This is an electronic reprint of the original article.This reprint may differ from the original in pagination and typographic detail.
Powered by TCPDF (www.tcpdf.org)
This material is protected by copyright and other intellectual property rights, and duplication or sale of all or part of any of the repository collections is not permitted, except that material may be duplicated by you for your research use or educational purposes in electronic or print form. You must obtain permission for any other use. Electronic or print copies may not be offered, whether for sale or otherwise to anyone who is not an authorised user.
Aji, Arif T.; Kalliomäki, Taina; Wilson, Benjamin P.; Aromaa, Jari; Lundström, MariModelling the effect of temperature and free acid, silver, copper and lead concentrations onsilver electrorefining electrolyte conductivity
Published in:Hydrometallurgy
DOI:10.1016/j.hydromet.2016.09.006
Published: 01/12/2016
Document VersionPeer reviewed version
Published under the following license:CC BY-NC-ND
Please cite the original version:Aji, A. T., Kalliomäki, T., Wilson, B. P., Aromaa, J., & Lundström, M. (2016). Modelling the effect of temperatureand free acid, silver, copper and lead concentrations on silver electrorefining electrolyte conductivity.Hydrometallurgy, 166, 154-159. https://doi.org/10.1016/j.hydromet.2016.09.006
�������� ����� ��
Modelling the effect of temperature and free acid, silver, copper and leadconcentrations on silver electrorefining electrolyte conductivity
Arif T. Aji, Taina Kalliomaki, Benjamin P. Wilson, Jari Aromaa, MariLundstrom
PII: S0304-386X(16)30208-0DOI: doi: 10.1016/j.hydromet.2016.09.006Reference: HYDROM 4435
To appear in: Hydrometallurgy
Received date: 29 April 2016Revised date: 30 August 2016Accepted date: 24 September 2016
Please cite this article as: Aji, Arif T., Kalliomaki, Taina, Wilson, Benjamin P., Aromaa,Jari, Lundstrom, Mari, Modelling the effect of temperature and free acid, silver, copperand lead concentrations on silver electrorefining electrolyte conductivity, Hydrometallurgy(2016), doi: 10.1016/j.hydromet.2016.09.006
This is a PDF file of an unedited manuscript that has been accepted for publication.As a service to our customers we are providing this early version of the manuscript.The manuscript will undergo copyediting, typesetting, and review of the resulting proofbefore it is published in its final form. Please note that during the production processerrors may be discovered which could affect the content, and all legal disclaimers thatapply to the journal pertain.
ACC
EPTE
D M
ANU
SCR
IPT
ACCEPTED MANUSCRIPT
1
Modelling the Effect of Temperature and Free acid, Silver, Copper and Lead Concentrations
on Silver Electrorefining Electrolyte Conductivity
Arif T. Aji*, Taina Kalliomäki, Benjamin P. Wilson, Jari Aromaa, Mari Lundström
Laboratory of Hydrometallurgy and Corrosion, Dept. of Materials Science and Engineering,
School of Chemical Technology, Aalto University, P.O. Box 16300, FI-00076 AALTO, Finland
* Corresponding Author: [email protected]
Abstract
Conductivity is one of the key physico-chemical properties of electrolyte in silver electrorefining
since it affects the energy consumption of the process. As electrorefining process development
trends towards high current density operation, having electrolytes with high conductivities will
greatly reduce the energy consumption of the process. This study outlines investigations into silver
electrorefining electrolyte conductivity as a function of silver, free acid, copper and lead
concentration at different temperatures via a full factorial design comprising of 246 individual
measurements. Regression analysis of the model was used to determine the goodness of fit R2,
goodness of prediction Q2, model validity and reproducibility. Conductivity was shown to be
enhanced by increases in free acid, copper, silver and lead, with free acid having the highest impact
on conductivity. Temperature also increased conductivity in two ways: both as a single factor and as
a combined effect with free acid, silver and copper concentration. Overall, this work produced a
model of high accuracy that allows conductivity of a range of industrial silver electrorefining
conditions to be calculated.
Keywords: silver electrolyte, conductivity model, electrorefining overpotential, industrial
1. Introduction
Electrorefining to produce high purity silver is industrially undertaken via one of two methods:
either the Balbach-Thum or the Moebius process. These processes have traditionally involved the
use of silver anodes and stainless steel cathodes immersed in AgNO3 electrolyte with [Ag+]
concentration in the range of 30 to 150 g/dm3 and 10 g/dm
3 free acid operating at temperature range
of 25-50 °C (Pletcher., 1990; Claessens and Cromwell., 1999). While the same systems are still
commonly used in industrial applications, more recent silver electrorefining process development
has focused on methods that allow for continuous processing, higher tolerance of anode impurities
and an increased production rate (Auerswald and Radcliffe, 2005).
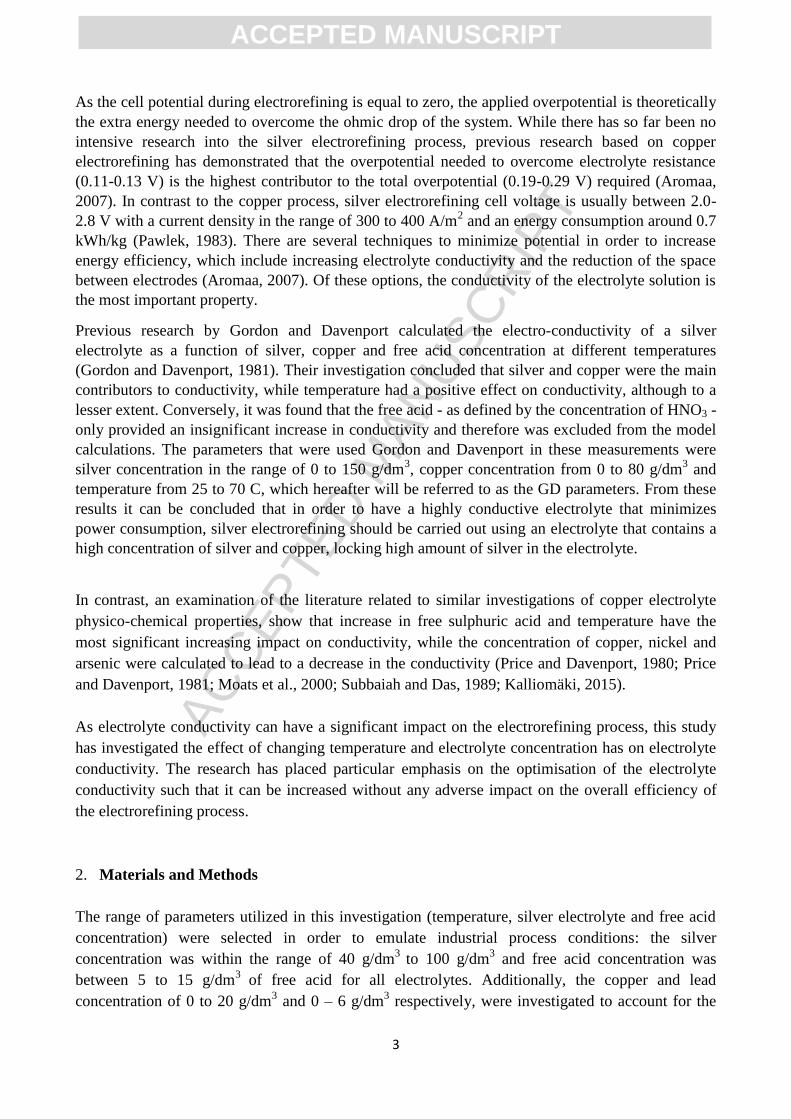
A majority (~60%) of the silver bullion that is used to make anodes for electrorefining is produced
as a by-product of gold, copper, lead and zinc mining and as result the most common impurities
present in the silver electrorefining process are gold, copper and to a lesser extent, lead. While gold
is insoluble in dilute nitric acid (Walkiden and Jarman, 1994), copper and lead can readily dissolve
and thus affect the physico-chemical properties of the process electrolyte like conductivity, density
and viscosity. From the impurities of bullion and electrolyte composition, it was considered that in
silver electrorefining the predominant ion contributors would be silver, nitric acid, copper and lead.
ACC
EPTE
D M
ANU
SCR
IPT
ACCEPTED MANUSCRIPT
2
In the current research, these ion contributors along with temperature were investigated to ascertain
their effect on the electrolyte conductivity during silver electrorefining.
Early investigations of electrolyte conductivity theory (Onsager., 1927; Shedlovsky., 1934) have
described the effect of the concentration of each ion in an electrolyte. Subsequently it was
determined that each ion makes a unique and independent contribution to the total molar
conductivity of the system, as defined by Kohlrausch law (Crow, 1988). The conductivity of an
electrolyte can be measured using Ohm’s law of electrical resistance approach, where conductivity
( ) is defined as the reciprocal of the specific resistance ( ) (Jones and Bollinger,
1931). The correlation between conductivity and specific resistance is shown in equation (1).
(1)
By further substituting the value of specific resistance with conductivity of electrolyte, the
resistance of electrolyte can be defined by equation (2).
(2)
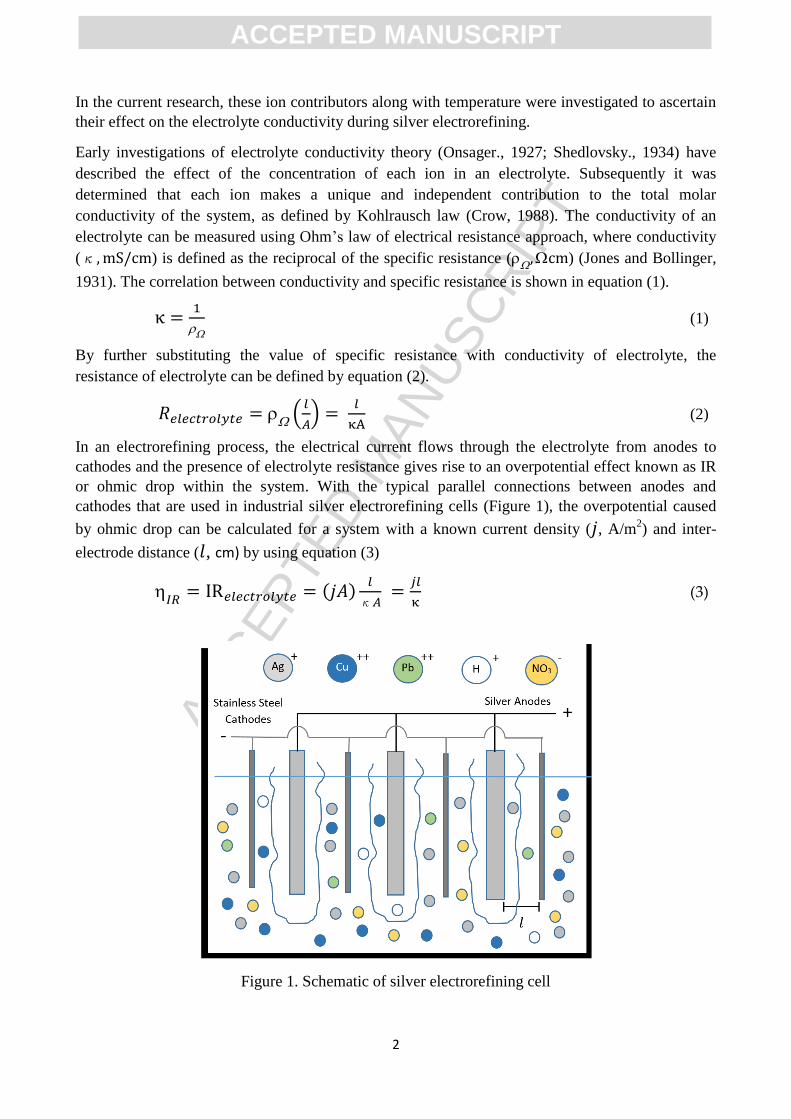
In an electrorefining process, the electrical current flows through the electrolyte from anodes to
cathodes and the presence of electrolyte resistance gives rise to an overpotential effect known as IR
or ohmic drop within the system. With the typical parallel connections between anodes and
cathodes that are used in industrial silver electrorefining cells (Figure 1), the overpotential caused
by ohmic drop can be calculated for a system with a known current density ( , A/m2) and inter-
electrode distance ( , cm) by using equation (3)
(3)
Figure 1. Schematic of silver electrorefining cell
ACC
EPTE
D M
ANU
SCR
IPT
ACCEPTED MANUSCRIPT
3
As the cell potential during electrorefining is equal to zero, the applied overpotential is theoretically
the extra energy needed to overcome the ohmic drop of the system. While there has so far been no
intensive research into the silver electrorefining process, previous research based on copper
electrorefining has demonstrated that the overpotential needed to overcome electrolyte resistance
(0.11-0.13 V) is the highest contributor to the total overpotential (0.19-0.29 V) required (Aromaa,
2007). In contrast to the copper process, silver electrorefining cell voltage is usually between 2.0-
2.8 V with a current density in the range of 300 to 400 A/m2 and an energy consumption around 0.7
kWh/kg (Pawlek, 1983). There are several techniques to minimize potential in order to increase
energy efficiency, which include increasing electrolyte conductivity and the reduction of the space
between electrodes (Aromaa, 2007). Of these options, the conductivity of the electrolyte solution is
the most important property.
Previous research by Gordon and Davenport calculated the electro-conductivity of a silver
electrolyte as a function of silver, copper and free acid concentration at different temperatures
(Gordon and Davenport, 1981). Their investigation concluded that silver and copper were the main
contributors to conductivity, while temperature had a positive effect on conductivity, although to a
lesser extent. Conversely, it was found that the free acid - as defined by the concentration of HNO3 -
only provided an insignificant increase in conductivity and therefore was excluded from the model
calculations. The parameters that were used Gordon and Davenport in these measurements were
silver concentration in the range of 0 to 150 g/dm3, copper concentration from 0 to 80 g/dm
3 and
temperature from 25 to 70 C, which hereafter will be referred to as the GD parameters. From these
results it can be concluded that in order to have a highly conductive electrolyte that minimizes
power consumption, silver electrorefining should be carried out using an electrolyte that contains a
high concentration of silver and copper, locking high amount of silver in the electrolyte.
In contrast, an examination of the literature related to similar investigations of copper electrolyte
physico-chemical properties, show that increase in free sulphuric acid and temperature have the
most significant increasing impact on conductivity, while the concentration of copper, nickel and
arsenic were calculated to lead to a decrease in the conductivity (Price and Davenport, 1980; Price
and Davenport, 1981; Moats et al., 2000; Subbaiah and Das, 1989; Kalliomäki, 2015).
As electrolyte conductivity can have a significant impact on the electrorefining process, this study
has investigated the effect of changing temperature and electrolyte concentration has on electrolyte
conductivity. The research has placed particular emphasis on the optimisation of the electrolyte
conductivity such that it can be increased without any adverse impact on the overall efficiency of
the electrorefining process.
2. Materials and Methods
The range of parameters utilized in this investigation (temperature, silver electrolyte and free acid
concentration) were selected in order to emulate industrial process conditions: the silver
concentration was within the range of 40 g/dm3
to 100 g/dm3 and free acid concentration was
between 5 to 15 g/dm3
of free acid for all electrolytes. Additionally, the copper and lead
concentration of 0 to 20 g/dm3 and 0 – 6 g/dm
3 respectively, were investigated to account for the
ACC
EPTE
D M
ANU
SCR
IPT
ACCEPTED MANUSCRIPT
4
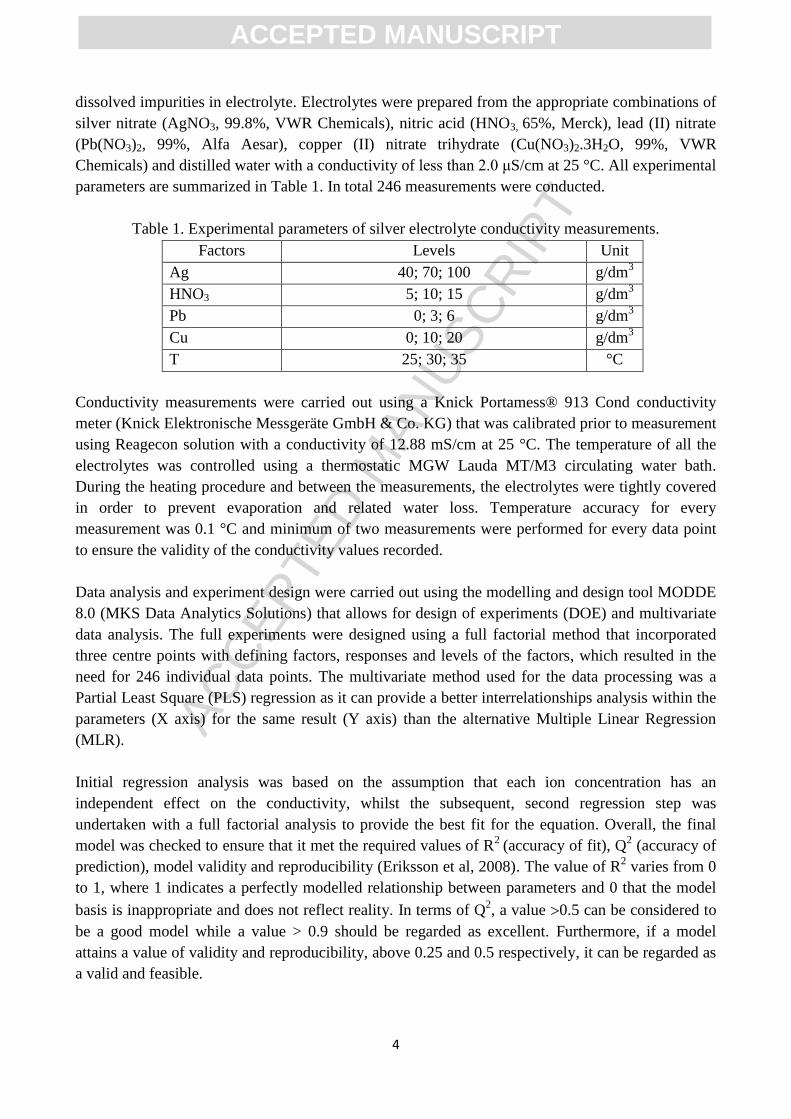
dissolved impurities in electrolyte. Electrolytes were prepared from the appropriate combinations of
silver nitrate (AgNO3, 99.8%, VWR Chemicals), nitric acid (HNO3, 65%, Merck), lead (II) nitrate
(Pb(NO3)2, 99%, Alfa Aesar), copper (II) nitrate trihydrate (Cu(NO3)2.3H2O, 99%, VWR
Chemicals) and distilled water with a conductivity of less than 2.0 μS/cm at 25 °C. All experimental
parameters are summarized in Table 1. In total 246 measurements were conducted.
Table 1. Experimental parameters of silver electrolyte conductivity measurements.
Factors Levels Unit
Ag 40; 70; 100 g/dm3
HNO3 5; 10; 15 g/dm3
Pb 0; 3; 6 g/dm3
Cu 0; 10; 20 g/dm3
T 25; 30; 35 °C
Conductivity measurements were carried out using a Knick Portamess® 913 Cond conductivity
meter (Knick Elektronische Messgeräte GmbH & Co. KG) that was calibrated prior to measurement
using Reagecon solution with a conductivity of 12.88 mS/cm at 25 °C. The temperature of all the
electrolytes was controlled using a thermostatic MGW Lauda MT/M3 circulating water bath.
During the heating procedure and between the measurements, the electrolytes were tightly covered
in order to prevent evaporation and related water loss. Temperature accuracy for every
measurement was 0.1 °C and minimum of two measurements were performed for every data point
to ensure the validity of the conductivity values recorded.
Data analysis and experiment design were carried out using the modelling and design tool MODDE
8.0 (MKS Data Analytics Solutions) that allows for design of experiments (DOE) and multivariate
data analysis. The full experiments were designed using a full factorial method that incorporated
three centre points with defining factors, responses and levels of the factors, which resulted in the
need for 246 individual data points. The multivariate method used for the data processing was a
Partial Least Square (PLS) regression as it can provide a better interrelationships analysis within the
parameters (X axis) for the same result (Y axis) than the alternative Multiple Linear Regression
(MLR).
Initial regression analysis was based on the assumption that each ion concentration has an
independent effect on the conductivity, whilst the subsequent, second regression step was
undertaken with a full factorial analysis to provide the best fit for the equation. Overall, the final
model was checked to ensure that it met the required values of R2
(accuracy of fit), Q2 (accuracy of
prediction), model validity and reproducibility (Eriksson et al, 2008). The value of R2 varies from 0
to 1, where 1 indicates a perfectly modelled relationship between parameters and 0 that the model
basis is inappropriate and does not reflect reality. In terms of Q2, a value 0.5 can be considered to
be a good model while a value > 0.9 should be regarded as excellent. Furthermore, if a model
attains a value of validity and reproducibility, above 0.25 and 0.5 respectively, it can be regarded as
a valid and feasible.
ACC
EPTE
D M
ANU
SCR
IPT
ACCEPTED MANUSCRIPT
5
By taking the best fit model from this study, further analysis into the effect of conductivity on
energy consumption was also calculated to determine the optimum conductive electrolyte.
3. Results and Discussion
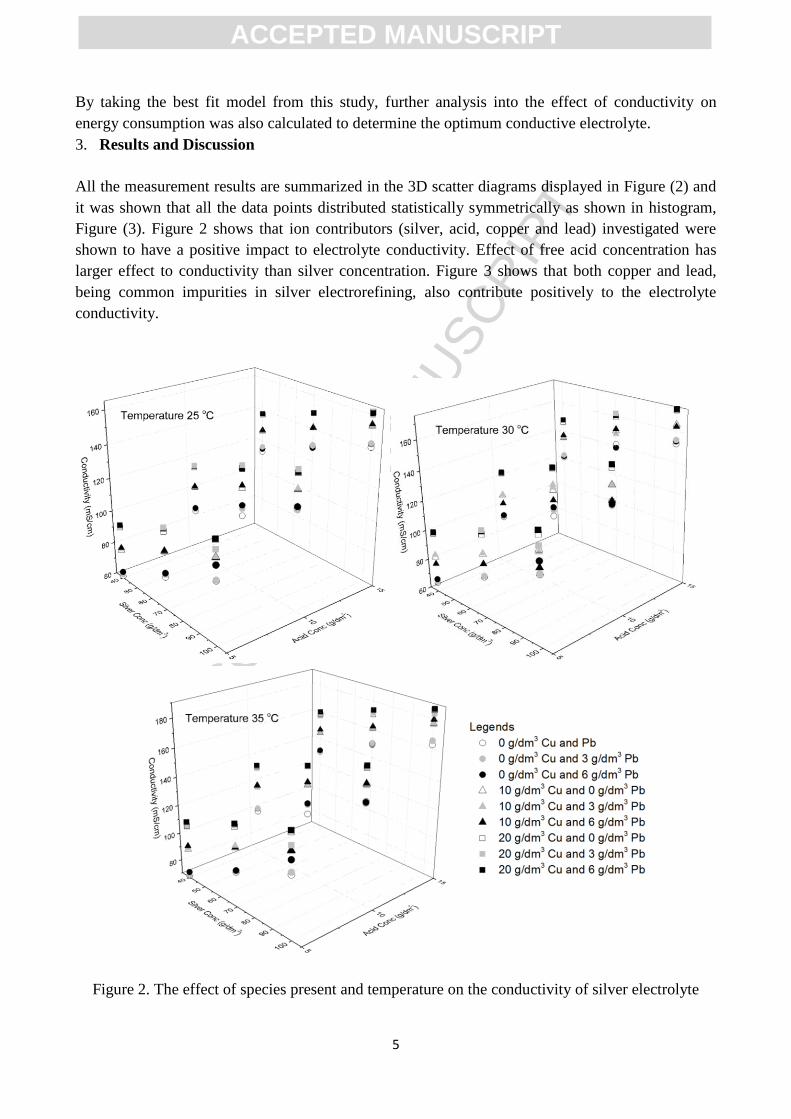
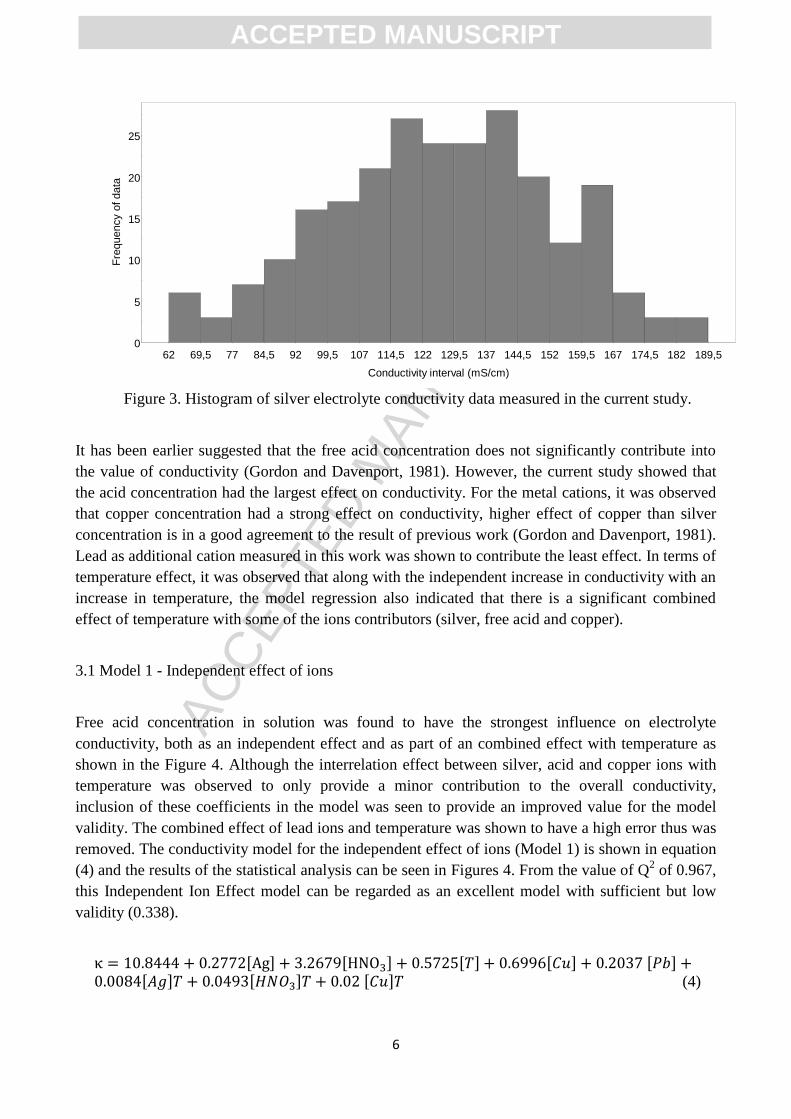
All the measurement results are summarized in the 3D scatter diagrams displayed in Figure (2) and
it was shown that all the data points distributed statistically symmetrically as shown in histogram,
Figure (3). Figure 2 shows that ion contributors (silver, acid, copper and lead) investigated were
shown to have a positive impact to electrolyte conductivity. Effect of free acid concentration has
larger effect to conductivity than silver concentration. Figure 3 shows that both copper and lead,
being common impurities in silver electrorefining, also contribute positively to the electrolyte
conductivity.
Figure 2. The effect of species present and temperature on the conductivity of silver electrolyte
ACC
EPTE
D M
ANU
SCR
IPT
ACCEPTED MANUSCRIPT
6
Figure 3. Histogram of silver electrolyte conductivity data measured in the current study.
It has been earlier suggested that the free acid concentration does not significantly contribute into
the value of conductivity (Gordon and Davenport, 1981). However, the current study showed that
the acid concentration had the largest effect on conductivity. For the metal cations, it was observed
that copper concentration had a strong effect on conductivity, higher effect of copper than silver
concentration is in a good agreement to the result of previous work (Gordon and Davenport, 1981).
Lead as additional cation measured in this work was shown to contribute the least effect. In terms of
temperature effect, it was observed that along with the independent increase in conductivity with an
increase in temperature, the model regression also indicated that there is a significant combined
effect of temperature with some of the ions contributors (silver, free acid and copper).
3.1 Model 1 - Independent effect of ions
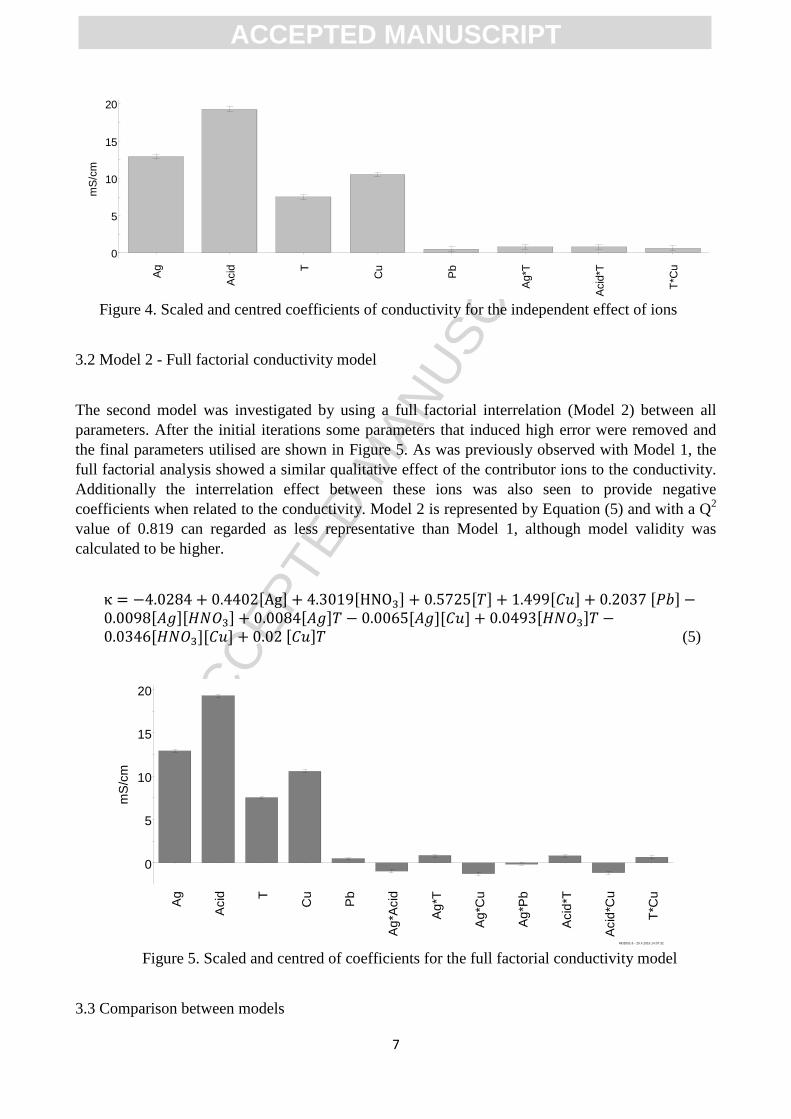
Free acid concentration in solution was found to have the strongest influence on electrolyte
conductivity, both as an independent effect and as part of an combined effect with temperature as
shown in the Figure 4. Although the interrelation effect between silver, acid and copper ions with
temperature was observed to only provide a minor contribution to the overall conductivity,
inclusion of these coefficients in the model was seen to provide an improved value for the model
validity. The combined effect of lead ions and temperature was shown to have a high error thus was
removed. The conductivity model for the independent effect of ions (Model 1) is shown in equation
(4) and the results of the statistical analysis can be seen in Figures 4. From the value of Q2 of 0.967,
this Independent Ion Effect model can be regarded as an excellent model with sufficient but low
validity (0.338).
(4)
0
5
10
15
20
25
62 69,5 77 84,5 92 99,5 107 114,5 122 129,5 137 144,5 152 159,5 167 174,5 182 189,5
Fre
quency o
f data
Conductivity interval (mS/cm)
Investigation: Silver Electrolyte PhisicoChemical Full Factorial 150216 up to 100 with ionic agents crosseffect
MODDE 8 - 26.8.2016 11:23:52
ACC
EPTE
D M
ANU
SCR
IPT
ACCEPTED MANUSCRIPT
7
Figure 4. Scaled and centred coefficients of conductivity for the independent effect of ions
3.2 Model 2 - Full factorial conductivity model
The second model was investigated by using a full factorial interrelation (Model 2) between all
parameters. After the initial iterations some parameters that induced high error were removed and
the final parameters utilised are shown in Figure 5. As was previously observed with Model 1, the
full factorial analysis showed a similar qualitative effect of the contributor ions to the conductivity.
Additionally the interrelation effect between these ions was also seen to provide negative
coefficients when related to the conductivity. Model 2 is represented by Equation (5) and with a Q2
value of 0.819 can regarded as less representative than Model 1, although model validity was
calculated to be higher.
(5)
Figure 5. Scaled and centred of coefficients for the full factorial conductivity model
3.3 Comparison between models
0
5
10
15
20
Ag
Acid T
Cu
Pb
Ag*T
Acid
*T
T*C
u
mS
/cm
Investigation: Silver Electrolyte PhisicoChemical Full Factorial 150216 up to 100 with ionic agents crosseffect (PLS, comp.=1)
MODDE 8 - 16.4.2016 11:16:04
0
5
10
15
20
Ag
Acid T
Cu
Pb
Ag
*Acid
Ag
*T
Ag
*Cu
Ag
*Pb
Acid
*T
Acid
*Cu
T*C
u
mS
/cm
Investigation: Silver Electrolyte PhisicoChemical Full Factorial 150216 up to 100 with ionic agents crosseffect (PLS, comp.=1)
MODDE 8 - 20.4.2016 14:07:32
ACC
EPTE
D M
ANU
SCR
IPT
ACCEPTED MANUSCRIPT
8
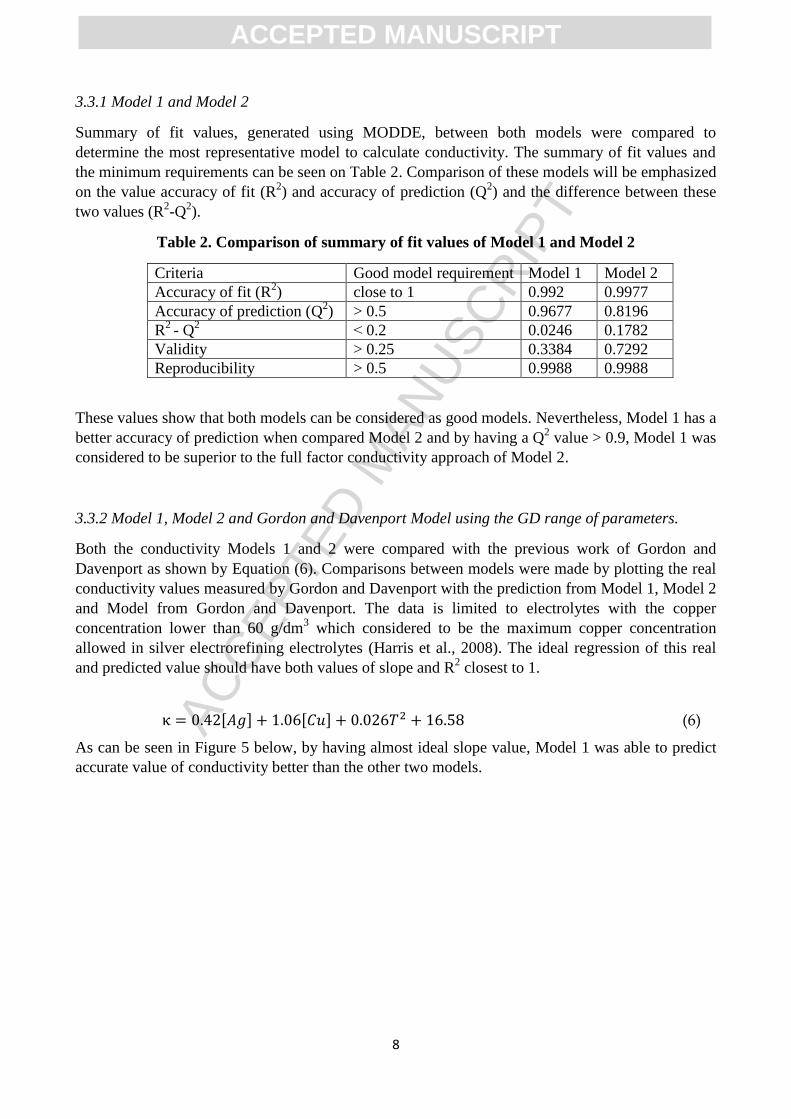
3.3.1 Model 1 and Model 2
Summary of fit values, generated using MODDE, between both models were compared to
determine the most representative model to calculate conductivity. The summary of fit values and
the minimum requirements can be seen on Table 2. Comparison of these models will be emphasized
on the value accuracy of fit (R2) and accuracy of prediction (Q
2) and the difference between these
two values (R2-Q
2).
Table 2. Comparison of summary of fit values of Model 1 and Model 2
Criteria Good model requirement Model 1 Model 2
Accuracy of fit (R2) close to 1 0.992 0.9977
Accuracy of prediction (Q2) > 0.5 0.9677 0.8196
R2
- Q2 ˂ 0.2 0.0246 0.1782
Validity > 0.25 0.3384 0.7292
Reproducibility > 0.5 0.9988 0.9988
These values show that both models can be considered as good models. Nevertheless, Model 1 has a
better accuracy of prediction when compared Model 2 and by having a Q2 value > 0.9, Model 1 was
considered to be superior to the full factor conductivity approach of Model 2.
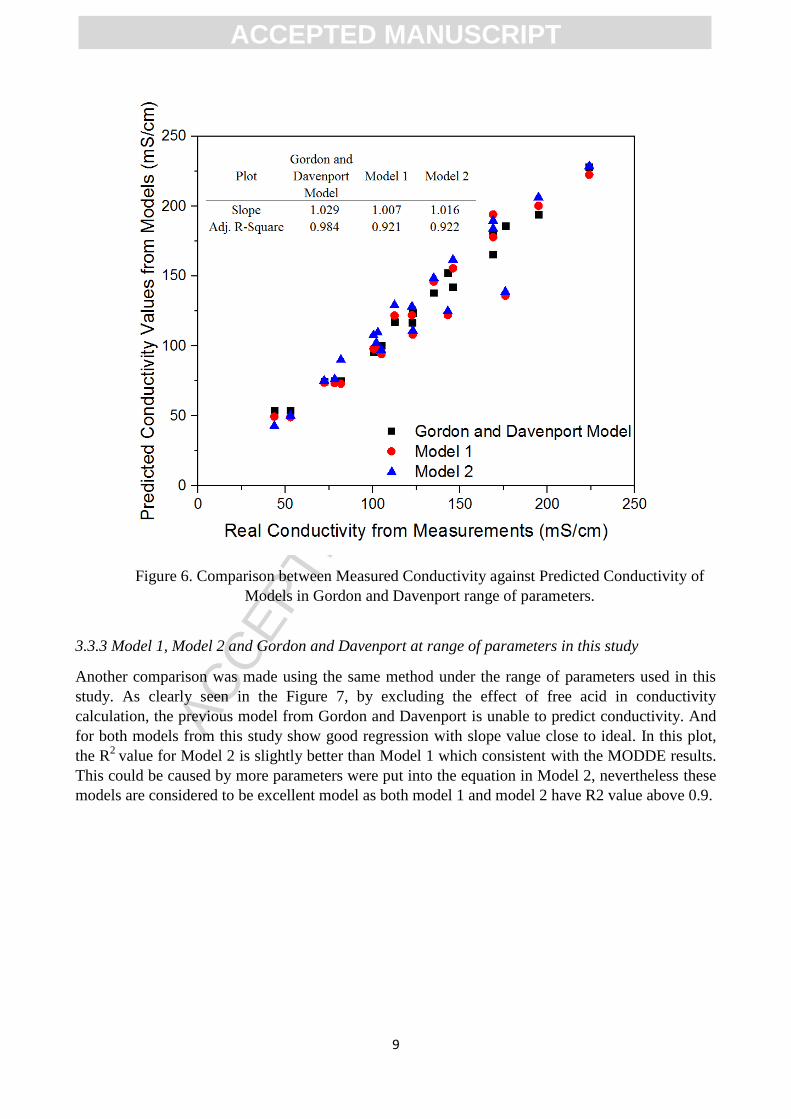
3.3.2 Model 1, Model 2 and Gordon and Davenport Model using the GD range of parameters.
Both the conductivity Models 1 and 2 were compared with the previous work of Gordon and
Davenport as shown by Equation (6). Comparisons between models were made by plotting the real
conductivity values measured by Gordon and Davenport with the prediction from Model 1, Model 2
and Model from Gordon and Davenport. The data is limited to electrolytes with the copper
concentration lower than 60 g/dm3 which considered to be the maximum copper concentration
allowed in silver electrorefining electrolytes (Harris et al., 2008). The ideal regression of this real
and predicted value should have both values of slope and R2 closest to 1.
(6)
As can be seen in Figure 5 below, by having almost ideal slope value, Model 1 was able to predict
accurate value of conductivity better than the other two models.
ACC
EPTE
D M
ANU
SCR
IPT
ACCEPTED MANUSCRIPT
9
Figure 6. Comparison between Measured Conductivity against Predicted Conductivity of
Models in Gordon and Davenport range of parameters.
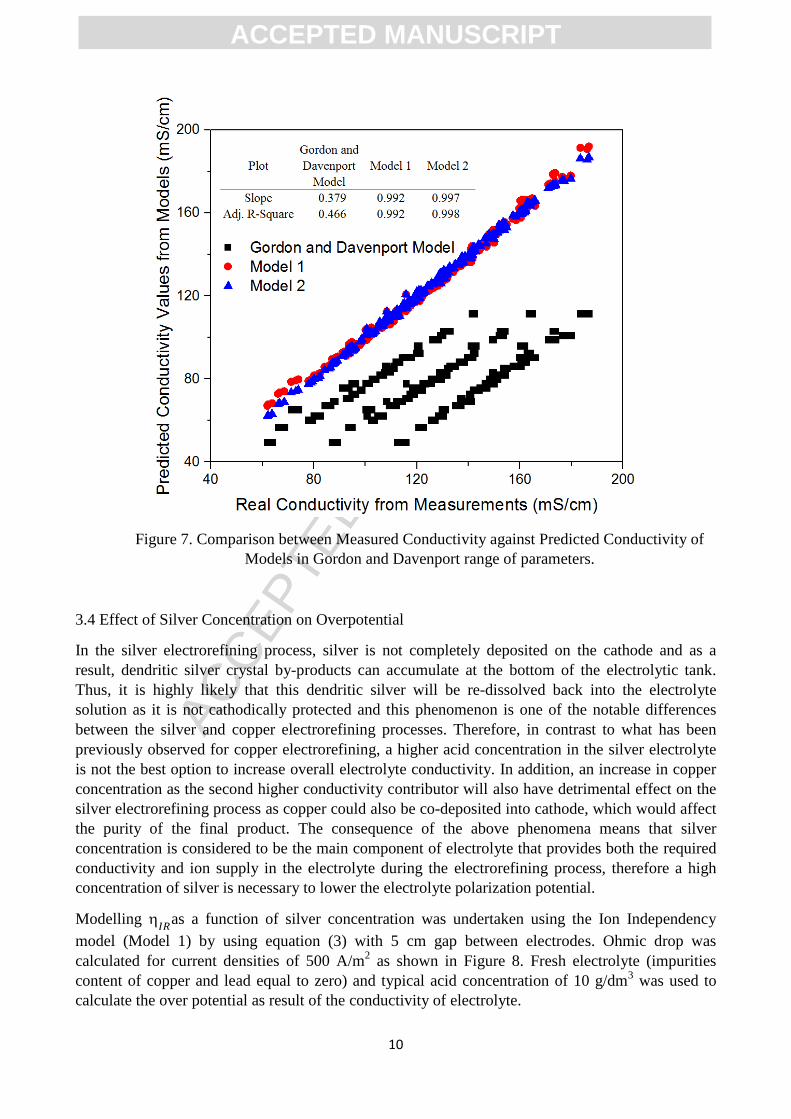
3.3.3 Model 1, Model 2 and Gordon and Davenport at range of parameters in this study
Another comparison was made using the same method under the range of parameters used in this
study. As clearly seen in the Figure 7, by excluding the effect of free acid in conductivity
calculation, the previous model from Gordon and Davenport is unable to predict conductivity. And
for both models from this study show good regression with slope value close to ideal. In this plot,
the R2
value for Model 2 is slightly better than Model 1 which consistent with the MODDE results.
This could be caused by more parameters were put into the equation in Model 2, nevertheless these
models are considered to be excellent model as both model 1 and model 2 have R2 value above 0.9.
ACC
EPTE
D M
ANU
SCR
IPT
ACCEPTED MANUSCRIPT
10
Figure 7. Comparison between Measured Conductivity against Predicted Conductivity of
Models in Gordon and Davenport range of parameters.
3.4 Effect of Silver Concentration on Overpotential
In the silver electrorefining process, silver is not completely deposited on the cathode and as a
result, dendritic silver crystal by-products can accumulate at the bottom of the electrolytic tank.
Thus, it is highly likely that this dendritic silver will be re-dissolved back into the electrolyte
solution as it is not cathodically protected and this phenomenon is one of the notable differences
between the silver and copper electrorefining processes. Therefore, in contrast to what has been
previously observed for copper electrorefining, a higher acid concentration in the silver electrolyte
is not the best option to increase overall electrolyte conductivity. In addition, an increase in copper
concentration as the second higher conductivity contributor will also have detrimental effect on the
silver electrorefining process as copper could also be co-deposited into cathode, which would affect
the purity of the final product. The consequence of the above phenomena means that silver
concentration is considered to be the main component of electrolyte that provides both the required
conductivity and ion supply in the electrolyte during the electrorefining process, therefore a high
concentration of silver is necessary to lower the electrolyte polarization potential.
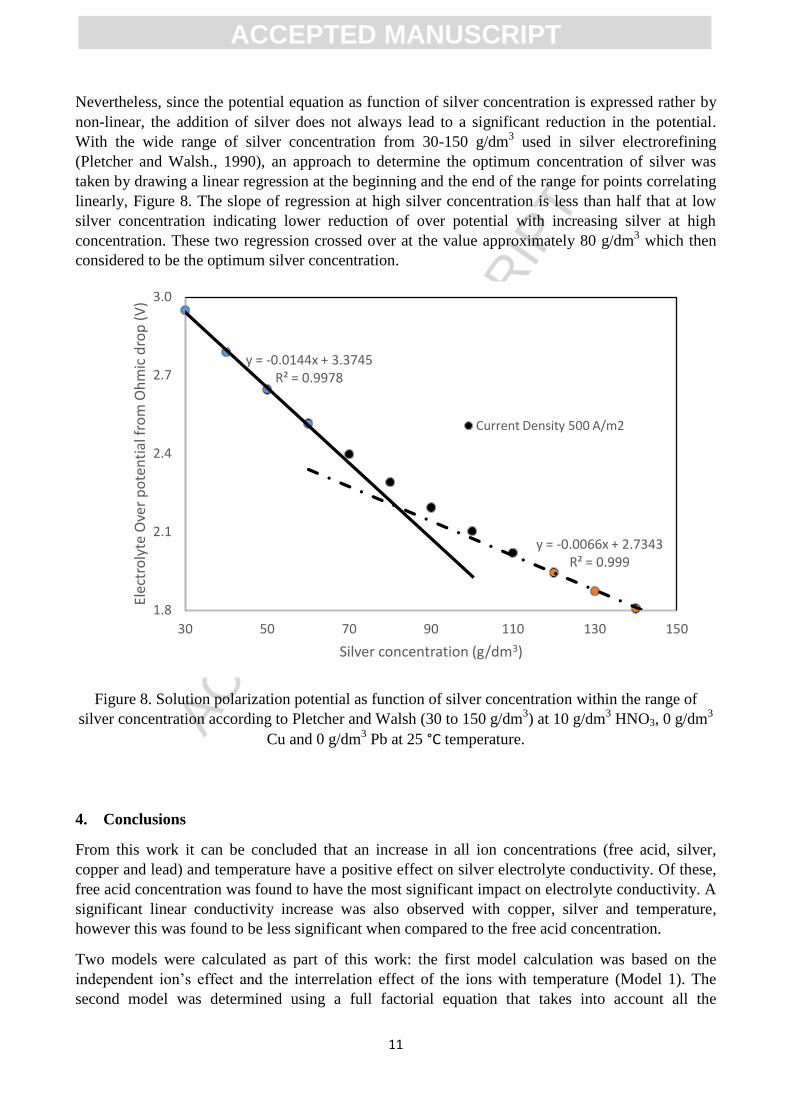
Modelling
as a function of silver concentration was undertaken using the Ion Independency
model (Model 1) by using equation (3) with 5 cm gap between electrodes. Ohmic drop was
calculated for current densities of 500 A/m2 as shown in Figure 8. Fresh electrolyte (impurities
content of copper and lead equal to zero) and typical acid concentration of 10 g/dm3 was used to
calculate the over potential as result of the conductivity of electrolyte.
ACC
EPTE
D M
ANU
SCR
IPT
ACCEPTED MANUSCRIPT
11
Nevertheless, since the potential equation as function of silver concentration is expressed rather by
non-linear, the addition of silver does not always lead to a significant reduction in the potential.
With the wide range of silver concentration from 30-150 g/dm3 used in silver electrorefining
(Pletcher and Walsh., 1990), an approach to determine the optimum concentration of silver was
taken by drawing a linear regression at the beginning and the end of the range for points correlating
linearly, Figure 8. The slope of regression at high silver concentration is less than half that at low
silver concentration indicating lower reduction of over potential with increasing silver at high
concentration. These two regression crossed over at the value approximately 80 g/dm3 which then
considered to be the optimum silver concentration.
Figure 8. Solution polarization potential as function of silver concentration within the range of
silver concentration according to Pletcher and Walsh (30 to 150 g/dm3) at 10 g/dm
3 HNO3, 0 g/dm
3
Cu and 0 g/dm3 Pb at 25 °C temperature.
4. Conclusions
From this work it can be concluded that an increase in all ion concentrations (free acid, silver,
copper and lead) and temperature have a positive effect on silver electrolyte conductivity. Of these,
free acid concentration was found to have the most significant impact on electrolyte conductivity. A
significant linear conductivity increase was also observed with copper, silver and temperature,
however this was found to be less significant when compared to the free acid concentration.
Two models were calculated as part of this work: the first model calculation was based on the
independent ion’s effect and the interrelation effect of the ions with temperature (Model 1). The
second model was determined using a full factorial equation that takes into account all the
y = -0.0144x + 3.3745 R² = 0.9978
y = -0.0066x + 2.7343 R² = 0.999
1.8
2.1
2.4
2.7
3.0
30 50 70 90 110 130 150
Ele
ctro
lyte
Ove
r p
ote
nti
al f
rom
Oh
mic
dro
p (
V)
Silver concentration (g/dm3)
Current Density 500 A/m2
ACC
EPTE
D M
ANU
SCR
IPT
ACCEPTED MANUSCRIPT
12
interrelation effects between all the parameters, then removes any parameters that result in
significant errors within the equation (Model 2). In general, both of the models outlined in this work
were found to have high accuracy and sufficient validity.
Of the two models proposed, Model 1 was considered to be the superior one as it possess a higher
Q2
value (Q2
= 0.967) when compared to Model 2 (Q2
= 0.819). Moreover, Model 1 can accurately
predict values close to those measured by the Gordon and Davenport model, even though the
parameter ranges were outside those used in this investigation. In contrast, the Gordon and
Davenport model was unable to accurately predict the conductivity values achieved within the
parameter range of this work.
As mentioned previously, electrolyte resistance can be the major contributor factor to the total over
potential, therefore a further calculation of the electrolyte polarization potential with Model 1 was
also performed. It was found that the electrolyte polarization potential varies with a natural
logarithmic curve as a function of silver concentration. This finding suggests that the addition of
silver (up to an electrolyte concentration of approximately 80 g/dm3) could be the best way to
reduce the over potential of the silver electrorefining process.
Furthermore, this investigation calculated that under industrial silver electrorefining conditions as
defined by both Pawlek (parameter range of 300 to 400 A/m2) and Pletcher and Walsh (silver
concentration from 30 to 150 g/dm-3
), overpotential caused by electrolyte resistance was found to
vary between 1.05 to 2.36 Volts. This value range indicates that the overpotential contribution from
the electrolyte can be considered to be dominant, since the cell voltage of silver electrorefining is to
be between 2.0 to 2.8 Volts (Pawlek, 1983).
Acknowledgments:
This research has been performed within the SIMP (System Integrated Metal Production) project of
FIMECC (Finnish Metals and Engineering Competence Cluster Ltd) and funding support from
LPDP (Indonesian Endowment Fund for Education). Furthermore, discussions with Emeritus Prof.
Olof Fórsen on the theoretical background of conductivity in copper refining are gratefully
acknowledged.
References
Aromaa, J., 2007, “Electrochemical Engineering: Aqueous Processing of Metals”, Encyclopedia
of Electrochemistry, VHC Verlag GmbH & Co, KGaA, pp. 161-196.
Auerswald, D. A., Radcliffe, P. H., 2005, “Process technology development at Rand Refinery”,
Minerals Engineering 18, pp. 748-753.
Claessens, P., Cromwell, J. L., 1999, “Silver Electrolysis Method in Moebius Cells”, European
Patent, EP 0775 763 B1.
Crow, D. R., 1988, “Principles and Applications of Electrochemistry”, Chapman and Hall, 3rd
edition.
ACC
EPTE
D M
ANU
SCR
IPT
ACCEPTED MANUSCRIPT
13
Eriksson, L., Johansson, E., Kettaneh-Wold, N., Wikström, C and Wold, S., 2008, “Design of
Experiments”, Umetrics Academy., pp 78.
Gordon, N. L., Davenport, W. G., 1981, “Electrical conductivities, densities and viscosities of
silver refining electrolyte”, Canadian Mining Quarterly, vol 20, No 3, pp 369-372.
Harris, B., White, C., Aprahamian, V., 2008, “Method for Recovering Nitric Acid and Purifying
Silver Nitrate Electrolyte”, Royal Canadian Mint, WO 2009000072 A1.
Jones, G., Bollinger G. M., 1931, “The Validity of Ohm’s Law for Electrolytes”, Journal of the
American Chemical Society, 53 (4), pp 1207–1212.
Price, D.C., Davenport, W.G., 1980, “Densities, Electrical Conductivities and Viscosities of
CuSO4/H2SO4 Solutions in the Range of Modern Electrorefining and Electrowinning
Electrolytes,” Metallurgical Transactions B, vol. 11B, pp. 159–163.
Kalliomäki, T, 2015, “Effect of Composition and Temperature on Physico-Chemical Properties
of Copper Electrolyte”, Master Thesis, Aalto University.
Moats, M.S., Hiskey, J.B. and Collins, D.W., 2000, “The effect of copper, acid, and temperature
on the diffusion coefficient of cupric ions in simulated electrorefining electrolytes”,
Hydrometallurgy, vol. 56, pp. 255–268.
Onsager, L., 1927, “Report on Revision of Conductivity Theory”, Trans. Faraday Soc, pp 341-
349.
Pawlek, F., 1983, “Metalhutenkunde“, Walter de Gruyter, Berlin, p 865
Pletcher, D., Walsh, F. C., 1990, “Industrial Electrochemistry”, Springer.
Price, D.C., Davenport, W.G., 1981, “Physico-Chemical Properties of Copper Electrorefining
and Electrowinning Electrolytes,” Metallurgical Transactions B, vol. 12B, pp. 639–643.
Shedlovsky, T., 1932, An Equation for Electrolytic Conductance”, Journal of the American
Chemical Society, 54 (4), pp 1405–1411.
Subbaiah, T., Das, S.C., 1989, “Physico-Chemical Properties of Copper Electrolytes,”
Metallurgical Transactions B, vol. 20B, pp. 375–380.
ACC
EPTE
D M
ANU
SCR
IPT
ACCEPTED MANUSCRIPT
14
Highlights
Silver electrorefining electrolyte concentration and temperature effect to conductivity
High accuracy conductivity model for industrial silver electrorefining electrolyte
Optimizing electrolyte conductivity to reduce process overpotential