Embed Size (px)
Citation preview
1
Modelling the Effects of Reaction Temperature and Flow
Rate on the Conversion of Ethanol to 1,3-Butadiene
Simoní Da Rosa,b, Matthew D. Jonesb*, Davide Mattiac, Marcio Schwaabd,
Fábio B. Noronhae, José Carlos Pintoa*.
a Programa de Engenharia Química/COPPE, Universidade Federal do Rio de Janeiro,
Cidade Universitária-CP: 68502, 21941-972, Rio de Janeiro, Brasil
b Department of Chemistry, University of Bath, Claverton Down, Bath BA2 7AY, UK
c Department of Chemical Engineering, University of Bath, Claverton Down, Bath BA2
7AY, UK
d Departamento de Engenharia Química, Universidade Federal do Rio Grande do Sul,
Rua Engenheiro Luiz Englert, s/nº, 90040-040, Porto Alegre, Brasil
e Catalysis Division, National Institute of Technology, Av. Venezuela 82, 20081312,
Rio de Janeiro, Brasil
Corresponding author, E-mail: [email protected]; [email protected]
2
ABSTRACT
A full factorial experimental design was performed to investigate the conversion of
ethanol to 1,3-butadiene (1,3-BD), through manipulation of the reaction temperature and
ethanol weight hourly space velocity. Reactions were carried out in presence of the
catalyst K2O:ZrO2:ZnO/MgO-SiO2, prepared by co-precipitation methods. Mathematical
models were developed to correlate observed product selectivities, 1,3-BD yields and
productivities with the manipulated reaction variables, allowing for quantification of
variable effects on catalyst activity and assessment of the kinetic mechanism. Obtained
1,3-BD productivities were as high as 0.5 gBD/gcat.h, with 1,3-BD yields of 27 %. Results
suggest that acetaldehyde condensation is the rate determining step.
Keywords: Ethanol; 1,3-butadiene; silica-magnesia catalyst; experimental design;
kinetics.
3
1. Introduction
1,3-Butadiene (1,3-BD) is a valuable conjugated diene used for production of synthetic
polymers [1,2]. The conversion of ethanol into 1,3-BD constitutes a promising alternative
for the current conventional 1,3-BD production process, where 1,3-BD is obtained as a
co-product during ethene manufacture in steam crackers [3-5], responsible for significant
amounts of CO2 emissions [6]. Recently, Patel and co-workers have compared the
biobased route for 1,3-BD production to the conventional process, this study provided
positive evidence regarding the sustainability of the new process and that it is a plausible
way forward [4,5].
The conversion of ethanol to 1,3-BD has been known since the beginning of the
20th century, although only in the last decade has it received more significant attention
from the academic community [7,8]. In particular, it has been established that the ideal
catalyst for ethanol to 1,3-BD must present suitable amounts, in terms of strength and
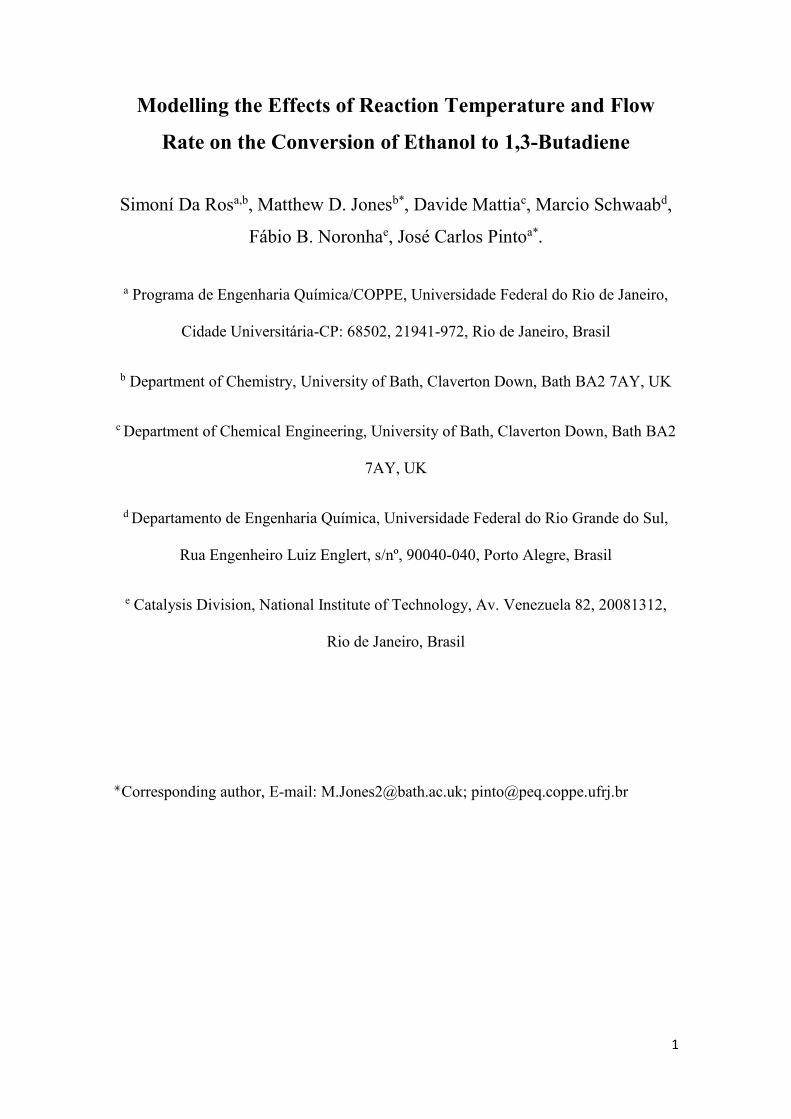
distribution, of acid and basic sites, since the widely accepted reaction pathway, Scheme
1 (a-e), involves different consecutives steps: (i) ethanol dehydrogenation, (ii) aldol
condensation, (iii) Meerwein-Ponndorf-Verley (MPV) reduction of crotonaldehyde and
(iv) crotyl alcohol dehydration [9-15]. However, ethanol dehydration to ethene and
diethyl ether (DEE) at acid sites leads to undesired reaction products, Scheme 1 (f-g). As
a consequence, much work has been dedicated to catalyst optimisation with the aim of
minimising the extent of the parallel reactions and enhancing 1,3-BD yield [1,8].
4
Scheme 1: Scheme illustrating of the potential reaction network.
Among the many catalysts studied, the use of MgO-SiO2 systems containing
different metals and/or metal oxides based on Cu, Zr, Zn and Ag have shown encouraging
performances, related mainly to the distinct Lewis acid and Brønsted basic sites of such
materials [12,16-19]. In particular, the method and the Mg-to-Si molar ratio employed to
synthesise the MgO-SiO2 precursor can be very important, as it can significantly modify
the catalyst’s properties [17,18,20,21]. Besides, as reported previously, the optimum Mg-
to-Si ratio may depend on the employed preparation procedure [12,18,20]. It is important
to note that the co-precipitation method has been used successfully in the synthesis of
Zr,Zn-containing MgO-SiO2 systems that are able to deliver high 1,3-BD productivities
(in gBD/gcat·h) [2]. Whereas ZrO2 and ZnO introduce synergic effects that facilitate the
ethanol dehydrogenation, aldol condensation and the MPV reduction
[11,13,18,19,22,23], the co-precipitation method allows for efficient formation of Mg-O-
Si bonds and homogeneous distribution of the distinct elements on the catalyst surfaces
[2,11,18]. Besides, modification of catalyst acidity with alkali metals constitutes an
attractive solution to minimise the undesired ethene and DEE by-products [2,23]. For
instance, the combined selectivity for 1,3-BD and acetaldehyde (AcH) has been reported
as 72 %, at ethanol conversion of 26 % and 1,3-BD yields of 27 % over a
K2O:ZrO2:ZnO/MgO-SiO2 system [2].
On the other hand, the effects of common reaction variables, such as temperature
and contact time, on ethanol to 1,3-BD reaction performance have received much less
attention [7]. There have been a few studies aimed at investigating the kinetic aspects of
this reaction, without sufficient support of statistical analyses [24,25]. However, in order
to improve the catalyst properties it may be necessary to understand the kinetic
mechanism and identify the rate-limiting step of the ethanol to 1,3-BD reaction, since
both ethanol dehydrogenation [9,17,19,26] and aldol condensation [13,19,26,27] steps
have been described as the rate-limiting step. Some previous studies point out that crotyl
alcohol might not be an intermediate in the reaction [14]; others, however, suggest that
1,3-BD is produced from the dehydration of crotyl alcohol, which is formed through the
reaction between an activated form of ethanol and acetaldehyde, not involving
acetaldehyde condensation [20,28]. Thus, it can be said that the ethanol to 1,3-BD
reaction mechanism is still subject to debate.
5
Usually, reaction variables are investigated using the “change-one-factor-at-a-
time” method; that is, one variable is changed while the other experimental conditions are
kept constant [2,10,12,13,26,27,29-31]. Based on this method, it has been found that
temperature exerts an important nonlinear effect on 1,3-BD yields, as observed with help
of different catalysts [13,19,26,30,31]. Similar studies have shown that the weight hourly
space velocity (WHSV) also modifies 1,3-BD yields and selectivities
[2,13,19,26,27,30,31]. Usually, enhancement of 1,3-BD selectivities [13,19] and yields
[19,27] could be observed when the WHSV was reduced, suggesting the positive effect
of contact times on reaction yields, as one might already expect. However, nonlinear
effects of ethanol flow rates on 1,3-BD yields were verified over different single and
binary metal oxides (such as MgO, ZrO2, Al2O3-MgO, Al2O3-Fe2O3, Al2O3-Cr2O3 and
ZrO2-Fe2O3) [30,31].
One of the main drawbacks associated with the “change-one-factor-at-a-time”
method is the fact that the influence observed for the particularly analyzed variable may
not be the same when some of the remaining experimental conditions change [32]. This
can occur because variables may interact with each other, resulting in unexpected
nonlinear effects [32,33]. Such interaction effects can only be identified when variables
are investigated and manipulated simultaneously. Statistical experimental design
techniques, such as factorial designs, overcome this drawback, allowing for identification
and quantification of the distinct main variable effects and variable interaction effects.
Besides, the use of statistical experimental design can lead to maximisation of the
information content of the experimental data set, as variable effects can be computed with
minimum uncertainty [34,35]. In this case, mathematical models can be developed to
correlate with maximum efficiency the independent (such as reaction temperature, feed
concentration and contact time) and dependent variables (such as ethanol conversion and
1,3-BD selectivity), making data interpretation easier and more robust.
Although the mechanistic kinetic modelling of the reaction system is usually
desirable, requiring the definition of fundamental rate equations and estimation of kinetic
parameters and equilibrium constants [36,37], it is well-known that the phenomenological
approach usually leads to very large number of model parameters, making their estimation
difficult (and many times impossible) [35,37,38]. For this reason, the empirical modelling
of reaction data, with help of sound statistical tools, may be much more efficient for
analysis and optimisation of complex catalytic processes, as the use of empirical
mathematical tools is relatively simple and much less time consuming [35,39].
6
In a previous work, we have investigated the kinetic information contained in
experimental fluctuations of ethanol to 1,3-BD conversion over the commonly used
MgO-SiO2 system. Acetaldehyde condensation was identified as the rate-limiting step
between 300 and 400 ºC, but reaction variables effects were not quantified [40]. In the
present study, reaction variables temperature and WHSV are rigorously investigated
through a full factorial experimental design, allowing the identification and quantification
of such variables effects on catalytic activity. Catalyst performance was characterised in
terms of the product distributions, 1,3-BD yields and productivities. These dependent
variables were correlated with reaction temperature and ethanol flow rate in order to allow
for quantification of reaction variable influence. Besides, the experimental study was
performed employing a K2O:ZrO2:ZnO/MgO-SiO2 system, a highly active catalyst [2],
allowing us to verify that acetaldehyde condensation is the rate-limiting step within the
investigated temperature range.
2. Materials and Methods
2.1 Catalyst Preparation and Characterisation
The catalyst was prepared by co-precipitation with the Mg-to-Si molar ratio equal to 1.0.
In a typical synthesis, 9.01 g of SiO2 (Sigma-Aldrich, 99.8 %) were dissolved in 100 mL
of 1.2 M NaOH (Sigma-Aldrich, 99 %) solution. The mixture was heated at 60-80 ºC
under vigorous stirring until complete SiO2 dissolution. The solution was cooled and 42.4
g of Na2CO3 (Sigma-Aldrich, 99.9 %) were added. A Mg(NO3)2•6H2O (Sigma-Aldrich,
99 %) solution was added drop-wise into this mixture whilst stirring at 25 ºC (38.85 g of
Mg(NO3)2•6H2O in 200 mL). The pH was maintained at 10.5 by adding appropriate
quantities of 1.2 M NaOH solution and, at the end of the process, the solution volume
was adjusted to 600 mL with deionized water. The resulting mixture was stirred for 2 h
and aged for 22 h at 25 ºC. Finally, the mixture was filtered and washed with 7.5 L of hot
water. The precipitate was dried in static air at 80 ºC for 24 h before grinding.
In order to produce materials with 1.5 wt% of Zr(IV) and 0.5 wt% of Zn(II),
0.57 g of ZrO(NO3)2·H2O (Sigma-Aldrich, 99 %) and 0.24 g of Zn(NO3)2·6H2O
(Sigma-Aldrich, 98 %) were dissolved in 50 mL of water. The solution was then
added to 10 g of the MgO-SiO2 system, dried under stirring and calcined in air at
500 C for 5 h (5 ºC/min). Finally, the appropriate volume of 0.4 M KOH (Sigma-
Aldrich, 90 %) solution was added to the calcined material drop-wise to generate
7
the final catalysts with 1.2 % weight of potassium. The mixture was stirred for 1 h
at 25 C before drying at 80 C for 5.5 h. The catalyst preparation procedure is
illustrated in Figure SI1 in the Supporting Information (SI).
Catalyst samples were characterised by static N2 adsorption at -196 ºC,
scanning electron microscopy with energy dispersive X-rays (SEM-EDX), powder
X-ray diffraction (pXRD), 29Si solid-state MAS NMR and temperature
programmed desorption of ammonia (NH3-TPD) as described elsewhere [2]. Bulk
loadings were confirmed by inductively coupled plasma optical emission spectroscopy
(ICP-OES), leading to K, Zn and Zr loadings of 1.31, 0.57 and 1.68 wt%, respectively.
Thermogravimetric analyses of used catalysts were carried out in a Setsys Evolution TGA
Setaram system. Samples (20 mg) were heated from room temperature to 1000 ºC under
air flow (100 mL/min), using a heating rate of 20 ºC/min. See reference [2] for further
characterisation of this family of catalysts, including investigations into their acid/base
properties.
2.2 Catalytic Tests
Catalytic tests were carried out in a flow quartz packed-bed reactor at atmospheric
pressure. Argon was used as carrier gas (8 mL/min). The ethanol WHSV was
varied within 0.3-2.5 h-1 through modification of the ethanol flow rate, keeping
catalyst mass and carrier gas flow rate fixed. The investigated WHSV range
corresponded to ethanol molar fractions between 0.41 and 0.85. The contact time
(calculated as the ratio between the catalyst volume and the total gas flow at the
reaction temperature) ranged from 1.3 to 5.3 s. Reaction temperature ranged from
300 to 400 C. Both WHSV and temperature ranges are consistent with the
majority of catalysts disclosed in the literature. The exhaust gases were analysed
after 3 h of time on stream (TOS) via GC-MS on an Agilent 7890A instrument,
equipped with a HP-PLOT/Q column of length 30 m and diameter 0.53 mm and
FID/MS detectors. The GC was calibrated as detailed elsewhere [11]. Carbon
balances were typically better than 85 %.
Ethanol conversion (X), selectivity (S), 1,3-BD yield (YBD) and 1,3-BD
productivity (PBD, in gBD/gcat·h) were computed as described in Equations (1), (2),
(3) and (4), respectively. NEtOH,in and NEtOH,out represent the number of mols of
ethanol that were added and collected, respectively. Ni represents the number of
8
mols of the product i, while NP is the total number of products, mcat is the catalyst
mass and t is the total reaction time.
, ,
,
( ) 100(%)
EtOH in EtOH out
EtOH in
N NX
N
(1)
1
(%) 100i
i NP
ii
NS
N
(2)
,
2(%) 100BD
BD
EtOH in
NY
N
(3)
54BDBD
cat
NP
m t
(4)
2.3 Experimental Design
The effect of the experimental reaction variables, temperature and WHSV, on the
catalyst performances were investigated with help of a two-level factorial design, with
four central point experiments. The statistical design approach was chosen to allow the
simultaneous and precise quantification of the main effects of temperature and WHSV,
their interaction effect and to study any potential non-linear effects present on catalyst
activity [32,33,35,41]. The experimental variables, zi, were normalised within the [−1,+1]
interval, according to Equation (5). zi represents the actual value of variable i, zic denotes
the actual value of variable i at the central condition (equal to 350 ºC and 0.93 h-1 for
temperature and WHSV, respectively), zi is equal to 25 ºC and 0.31 h-1 for temperature
and WHSV, respectively, and xi is the normalised value of variable i.
i ic
i
i
z zx
z
(5)
Table 1 shows the experimental design matrix, with normalised and actual values of
reaction conditions. Four experiments at central condition (Exps. 5-8, Table 1) were
carried out in order to evaluate the experimental error and to test for the evidence of non-
linear effects. Two additional axial experiments, −2 and +2, were performed for each
variable (Exps. 9-12), to allow for improved quantification of nonlinear effects [32].
Besides, Experiments 13 and 14, at conditions [-1,0] and [+1,0], were performed to
evaluate the prediction capability of the proposed models. Finally, additional experiments
9
were performed to assess the system behaviour at higher WHSV values (Exps. 15-18).
Thus, all models were statistically validated, as illustrated by Tables SI2-SI4 in the
Supporting Information.
Table 1. Matrix of experimental conditions: actual and normalised
variable values.
Experiment Temperature (ºC)
z1 (x1)
WHSV (h-1)
z2 (x2)
1 325 (-1) 0.62 (-1)
2 325 (-1) 1.24 (+1)
3 375 (+1) 0.62 (-1)
4 375 (+1) 1.24 (+1)
5 350 (0) 0.93 (0)
6 350 (0) 0.93 (0)
7 350 (0) 0.93 (0)
8 350 (0) 0.93 (0)
9 300 (-2) 0.93 (0)
10 400 (+2) 0.93 (0)
11 350 (0) 0.31 (-2)
12 350 (0) 1.55 (+2)
13 325 (-1) 0.93 (0)
14 375 (+1) 0.93 (0)
15 325 (-1) 2.49 (+5)
16 350 (0) 2.49 (+5)
17 375 (+1) 2.49 (+5)
18 400(+2) 2.49 (+5)
Ethanol conversions, product selectivities, molar fractions of reaction products,
1,3-BD yields and 1,3-BD productivities were selected as response or dependent variables
to assess reaction temperature and WHSV effects. Models with the general form of
Equation (6) - a classic structure used in factorial designs [32,33,35,41] - were then
applied to correlate dependent variables, yi, with the reactions conditions, using the
independent normalised variables, xi. At this point, it should be noted that in this work
WHSV was modified by varying ethanol flow rate only. This means that contact time and
ethanol composition were modified simultaneously as WHSV was modified. Thus, in the
following discussion it is necessary to keep in mind that WHSV influence is related to
both contact time and ethanol composition effects.
2 2
0 1 1 2 2 12 1 2 11 1 1 22 2 2iy b b x b x b x x b x b x (6)
10
The parameters of Equation (6), b1 and b2, b12, b11 and b22, are related to the linear,
interaction and quadratic effects of temperature and WHSV, respectively, while b0 is the
independent bias parameter. Finally, λi is a constant used to guarantee the orthogonality
of the design matrix, calculated as shown in Equation (7), where NE is the total number
of experiments. Parameters from Equation (6) were estimated with help of the well-
known least-squares estimation procedure. Statistical significance of estimated model
parameters was evaluated with the standard t-test. Whenever parameter significance was
lower than 5%, the parameter and respective variable effect were regarded as statistically
insignificant and were removed from Equation (6). Besides, fit quality was always further
verified by comparing experimental variance with Equation (6) prediction variance using
the standard F-test [42], in order to avoid over-parameterised solutions. For all models
obtained, experimental variances were always statistically equal to prediction variances,
supporting the satisfactory statistical quality of the models.
2
1
1 NE
i ij
j
xNE
(7)
3. Results and Discussion
3.1 Catalysis Characterisation
The BET surface area of the catalyst was equal to 305 m²/g. To minimise internal pore
diffusion limitations, catalyst particles were ground until sizes smaller than 200 μm were
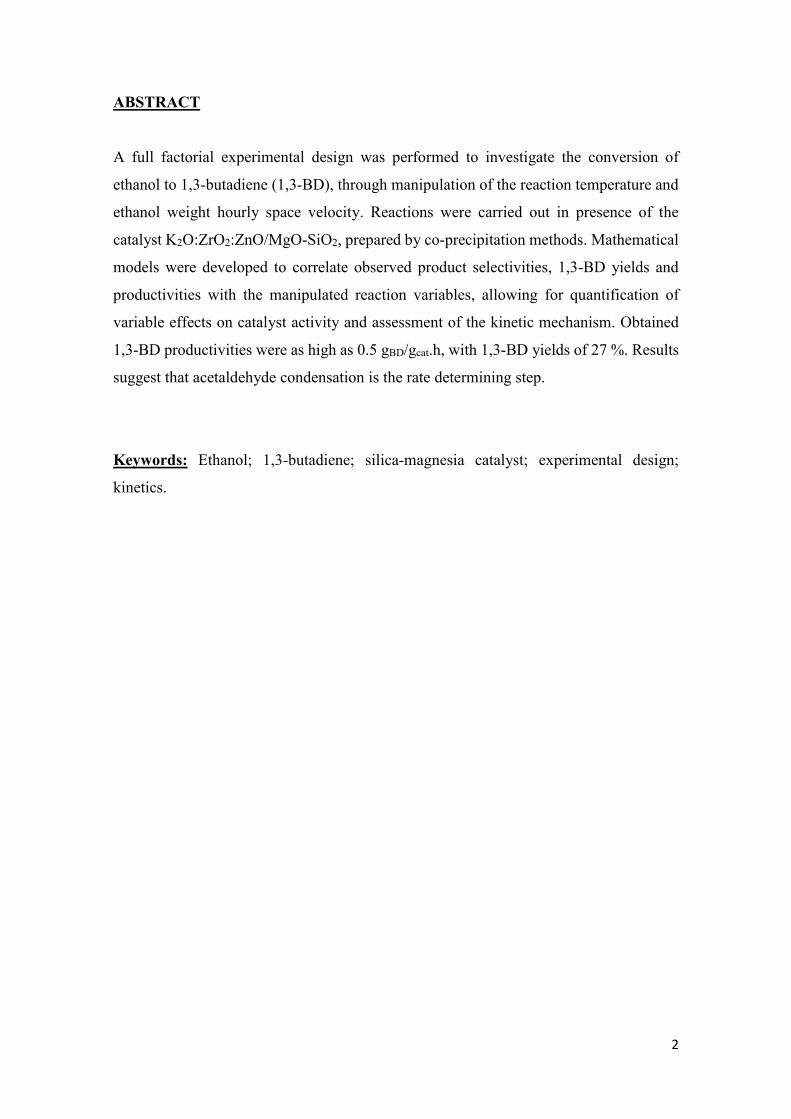
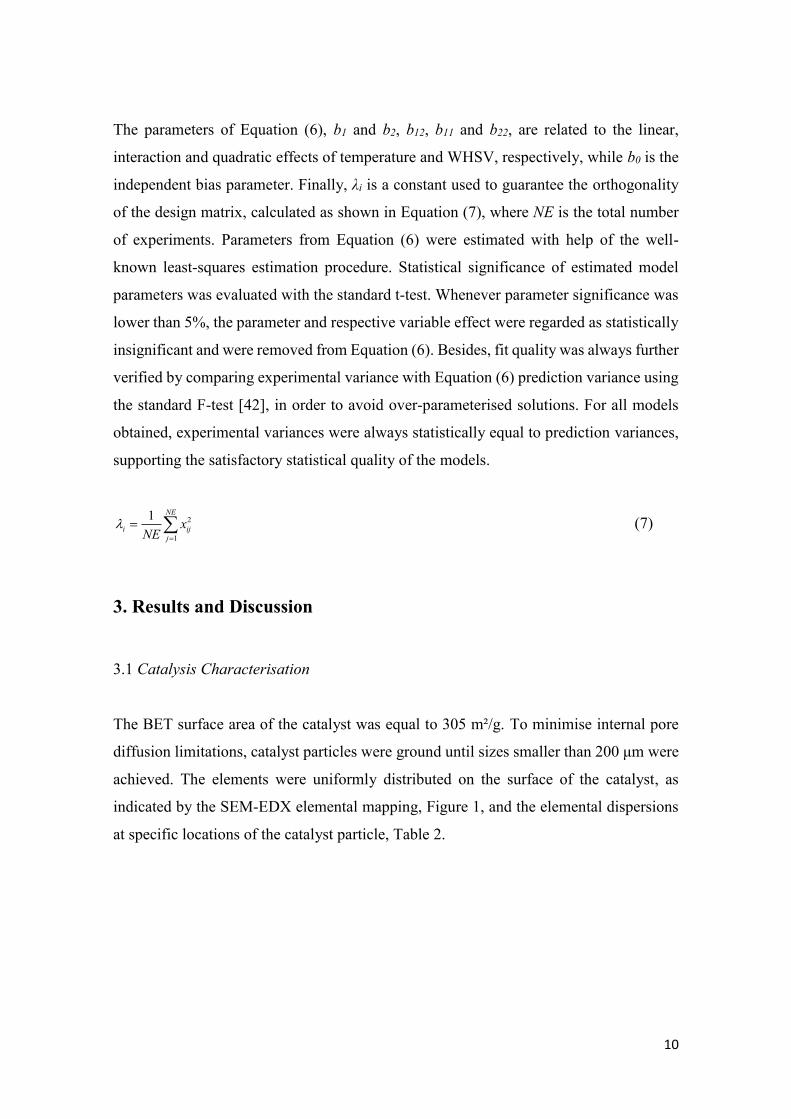
achieved. The elements were uniformly distributed on the surface of the catalyst, as
indicated by the SEM-EDX elemental mapping, Figure 1, and the elemental dispersions
at specific locations of the catalyst particle, Table 2.
11
Table 2 – Surface elemental dispersion of catalyst sample in wt %[a].
Mg Si Zr Zn K
37.42 ± 0.50 52.79 ± 0.49 5.44 ± 0.55 1.69 ± 0.31 2.66 ± 0.20 [a] Elemental values were normalised to 100 and represent a dispersion measure only.
Figure 1 – Elemental mapping of the K2O:ZrO2:ZnO/MgO-SiO2 catalyst.
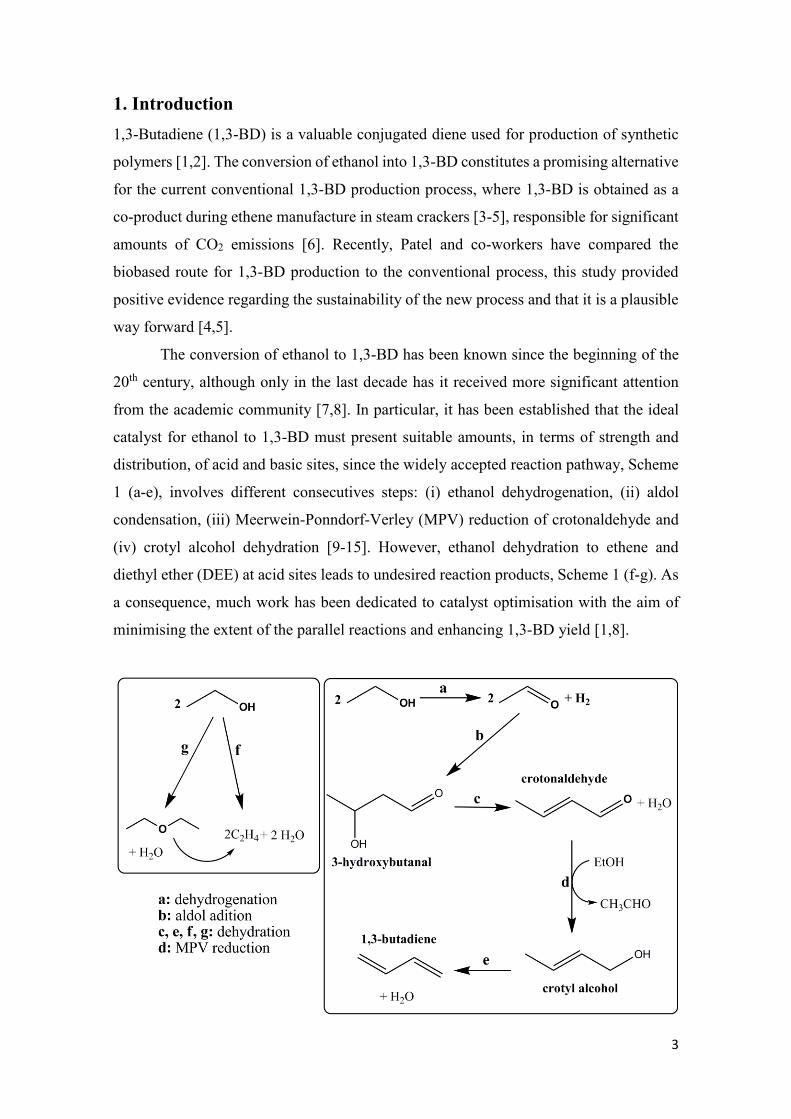
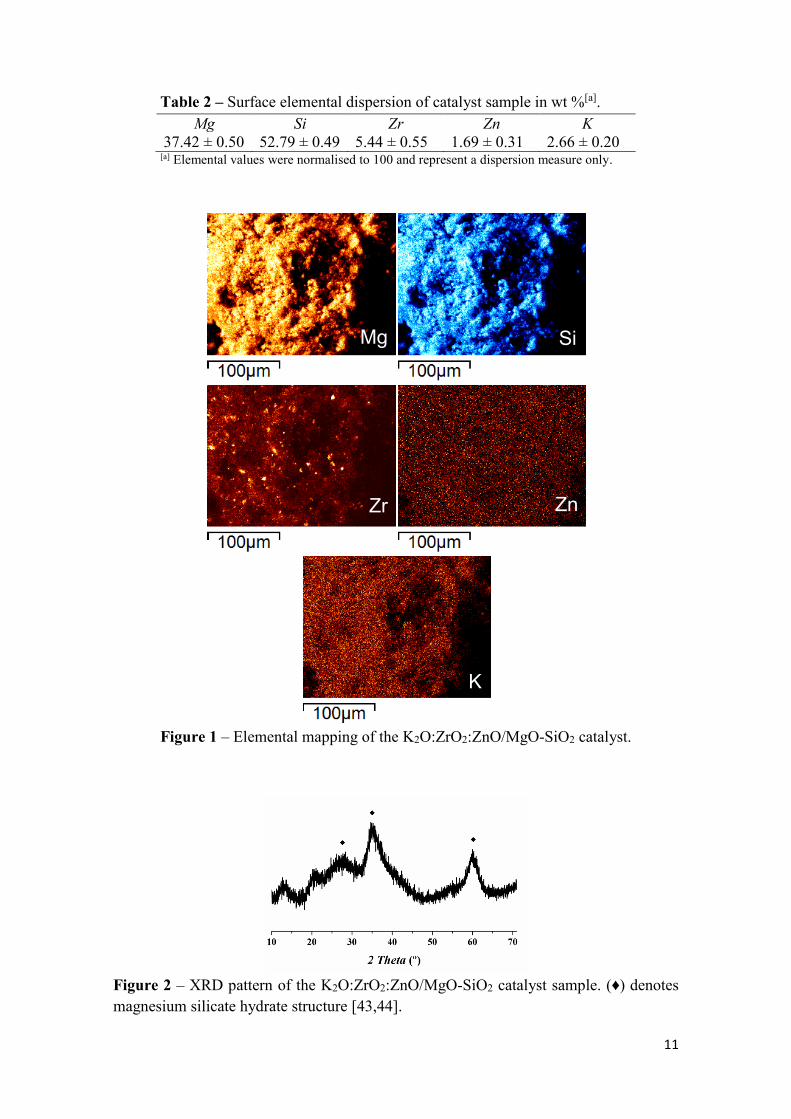
Figure 2 – XRD pattern of the K2O:ZrO2:ZnO/MgO-SiO2 catalyst sample. (♦) denotes
magnesium silicate hydrate structure [43,44].
Mg Si
Zr Zn
K
12
Moreover, the catalyst sample was amorphous, as characterised by pXRD as
shown in Figure 2. The broad diffraction bands (at 25-30, 33-39 and 58-62 º) can be
assigned to the magnesium silicate hydrate structure [43,44]. ZrO2, ZnO and K2O were
efficiently dispersed into the -Mg-O-Si- network and could not be detected through the
pXRD analysis.
In a previous study [2], we have investigated the effect of the Mg-to-Si molar ratio
of MgO-SiO2 and ZrZn-containing MgO-SiO2 systems prepared by co-precipitation on
the ethanol to 1,3-BD conversion. Zr and Zn contents have been kept fixed since it was
shown that loadings of 1.5 and 0.5 wt% for Zr and Zn, respectively, produced higher
selectivities towards 1,3-BD [11]. A beneficial effect on 1,3-BD yield and selectivity was
observed as Zr and Zn were added on the MgO-SiO2 precursor [2]. However, the ethene
and DEE selectivities were also high.
Indeed, IR measurements after NH3 adsorption suggested a rise in catalyst Lewis
acidity from the MgO-SiO2 to the ZrZn-containing MgO-SiO2 samples [2]. Catalyst
doping with alkali metals, especially potassium, has been shown to overcome this
drawback, suppressing ethanol dehydration to ethene and DEE. It was rationalised that
the alkali metal addition neutralised the catalyst’s strong acid sites responsible for ethanol
dehydration, a conclusion supported by NH3-TPD and NH3-IR experiments [2,23]. The
alkali metal loading of 1.2 wt.% was shown to be the most suitable for this system:
whereas higher alkali metal loadings resulted in lower ethanol conversion and 1,3-BD
yields, lower loadings produced more ethene and DEE [2]. Moreover, 29Si NMR
experiments indicated that as alkali metal, as Zr and Zr addition did not change silicon
environments [2], which could be involved in the catalyst Brønsted acidity, supporting
the hypothesis of Lewis acid sites participation in the overall reaction pathway.
In this work, we have further assessed the silicon environments of the
K2O:ZrO2:ZnO/MgO-SiO2 material by 29Si NMR analysis, Fig SI2. The two broad
resonances with maxima around -85 and -94 ppm suggest the presence of -Mg-O-
Si- linkages, in line with the pXRD pattern. Chemical shifts between -85 and -89
ppm and between -92 and -99 ppm were already reported for magnesium silicate
systems and they were attributed to Q2 and Q3 species, respectively, as
Si*(OMg)(OSi)2(OH) and Si*(OMg)(OSi)3 [26,43,45].
13
The role of potassium in the catalyst system has been evaluated through
NH3-TPD experiments, Fig SI3, which confirmed a reduction in the total catalyst
acidity as the alkali metal was added, as expected. It should be emphasised,
however, that to determine the active sites of the employed catalyst is beyond the
scope of this work, which pursue to rigorously quantify reaction variables
temperature and WHSV effects on the catalyst performance. Thus, the
K2O:ZrO2:ZnO/MgO-SiO2 system has been selected for this study due to its high
selectivity to 1,3-BD. Nevertheless, active sites could be related to weak Lewis acid-
Brønsted basic pairs distributed throughout catalyst surface, which could involve,
for instance, Mg-O, Zn-O, Zr-O pairs with different metal coordination
environments.
3.2 Catalytic Tests
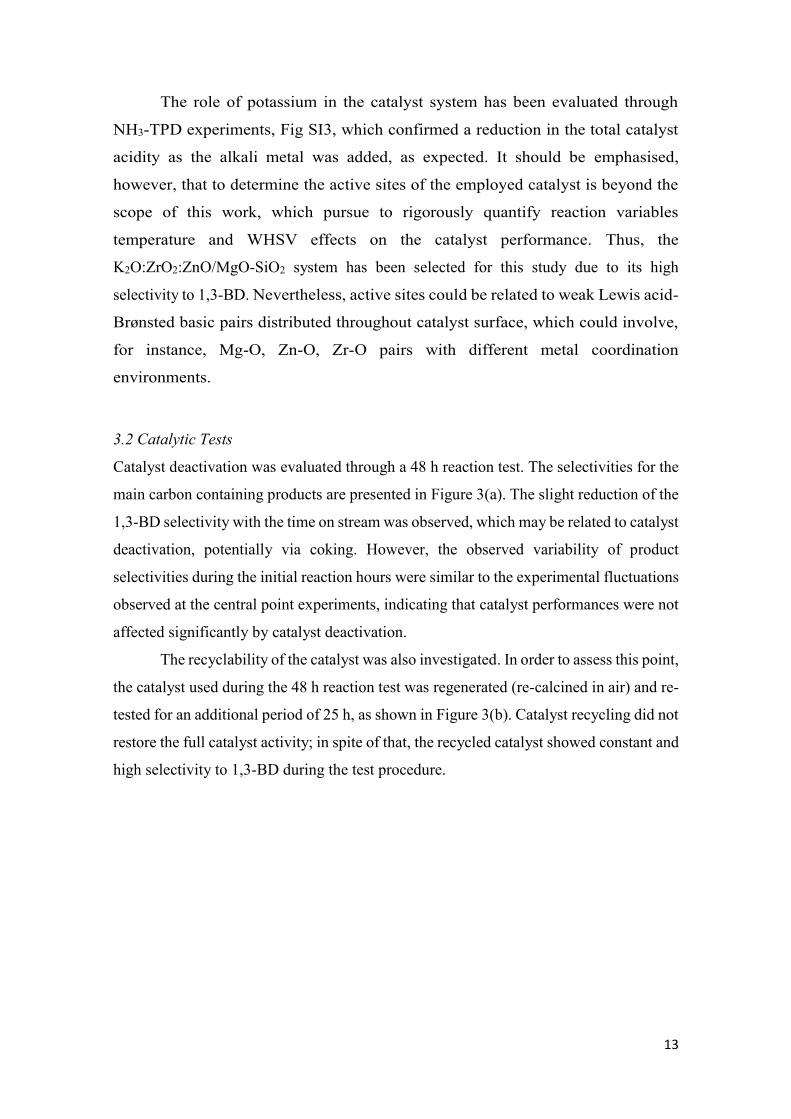
Catalyst deactivation was evaluated through a 48 h reaction test. The selectivities for the
main carbon containing products are presented in Figure 3(a). The slight reduction of the
1,3-BD selectivity with the time on stream was observed, which may be related to catalyst
deactivation, potentially via coking. However, the observed variability of product
selectivities during the initial reaction hours were similar to the experimental fluctuations
observed at the central point experiments, indicating that catalyst performances were not
affected significantly by catalyst deactivation.
The recyclability of the catalyst was also investigated. In order to assess this point,
the catalyst used during the 48 h reaction test was regenerated (re-calcined in air) and re-
tested for an additional period of 25 h, as shown in Figure 3(b). Catalyst recycling did not
restore the full catalyst activity; in spite of that, the recycled catalyst showed constant and
high selectivity to 1,3-BD during the test procedure.
14
Figure 3 - Effect of time on stream on the selectivity of the main carbon containing
products: (a) fresh catalyst; (b) recycled catalyst. (T = 350 ºC, WHSV = 0.62 h-1, contact
time = 3.8 s).
The designed experimental conditions afforded ethanol conversions ranging from
7 to 44 %. The main carbon containing products were 1,3-BD, acetaldehyde (AcH),
ethene, diethyl ether (DEE) and butene (1-butene, cis- and trans-2-butene). Other minor
products were propene, propane, ethane, acetone, with combined selectivities below 5 %.
Besides, traces of C5 and C6 compounds could also be detected. Table 3 shows ethanol
conversions, selectivities of the main carbon containing products, 1,3-BD yields and
productivities obtained in the designed experiments. Additional information regarding
contact time, ethanol molar fractions in the feed, molar fractions of the main products and
carbon balances (typically greater than 85 %) are reported in Table SI1 as Supporting
Information.
15
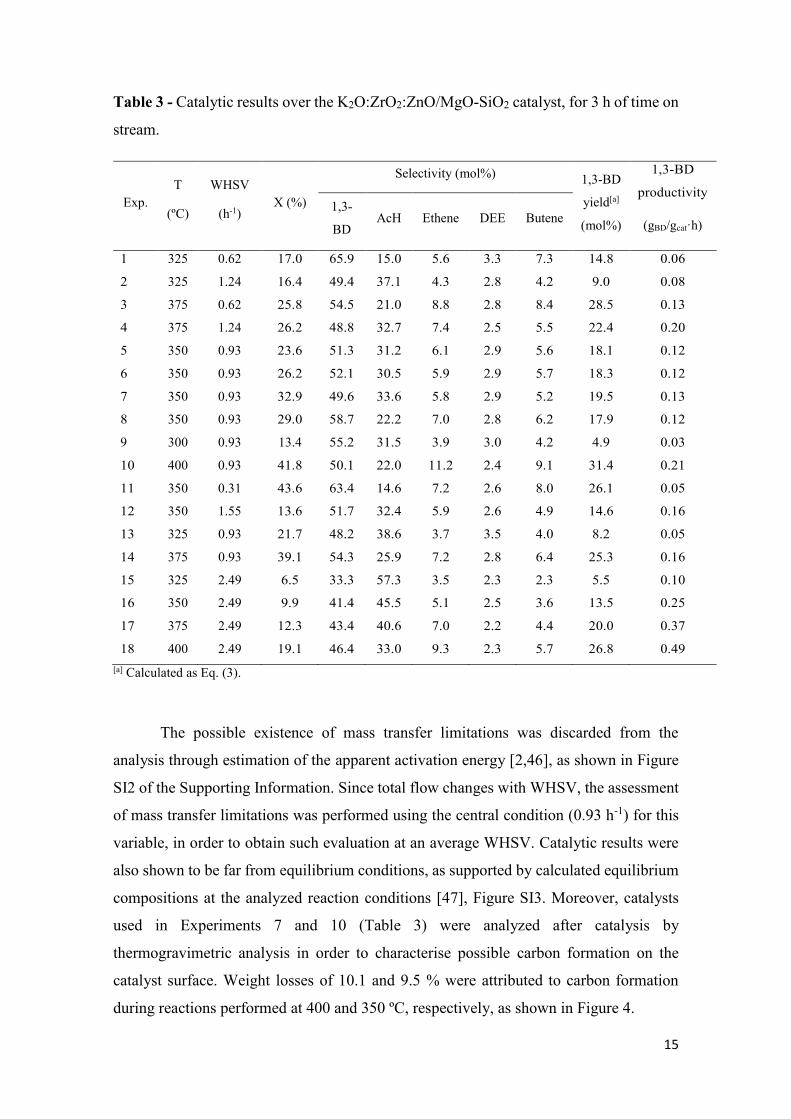
Table 3 - Catalytic results over the K2O:ZrO2:ZnO/MgO-SiO2 catalyst, for 3 h of time on
stream.
Exp.
T
(ºC)
WHSV
(h-1) X (%)
Selectivity (mol%) 1,3-BD
yield[a]
(mol%)
1,3-BD
productivity
(gBD/gcat·h)
1,3-
BD AcH Ethene DEE Butene
1 325 0.62 17.0 65.9 15.0 5.6 3.3 7.3 14.8 0.06
2 325 1.24 16.4 49.4 37.1 4.3 2.8 4.2 9.0 0.08
3 375 0.62 25.8 54.5 21.0 8.8 2.8 8.4 28.5 0.13
4 375 1.24 26.2 48.8 32.7 7.4 2.5 5.5 22.4 0.20
5 350 0.93 23.6 51.3 31.2 6.1 2.9 5.6 18.1 0.12
6 350 0.93 26.2 52.1 30.5 5.9 2.9 5.7 18.3 0.12
7 350 0.93 32.9 49.6 33.6 5.8 2.9 5.2 19.5 0.13
8 350 0.93 29.0 58.7 22.2 7.0 2.8 6.2 17.9 0.12
9 300 0.93 13.4 55.2 31.5 3.9 3.0 4.2 4.9 0.03
10 400 0.93 41.8 50.1 22.0 11.2 2.4 9.1 31.4 0.21
11 350 0.31 43.6 63.4 14.6 7.2 2.6 8.0 26.1 0.05
12 350 1.55 13.6 51.7 32.4 5.9 2.6 4.9 14.6 0.16
13 325 0.93 21.7 48.2 38.6 3.7 3.5 4.0 8.2 0.05
14 375 0.93 39.1 54.3 25.9 7.2 2.8 6.4 25.3 0.16
15 325 2.49 6.5 33.3 57.3 3.5 2.3 2.3 5.5 0.10
16 350 2.49 9.9 41.4 45.5 5.1 2.5 3.6 13.5 0.25
17 375 2.49 12.3 43.4 40.6 7.0 2.2 4.4 20.0 0.37
18 400 2.49 19.1 46.4 33.0 9.3 2.3 5.7 26.8 0.49
[a] Calculated as Eq. (3).
The possible existence of mass transfer limitations was discarded from the
analysis through estimation of the apparent activation energy [2,46], as shown in Figure
SI2 of the Supporting Information. Since total flow changes with WHSV, the assessment
of mass transfer limitations was performed using the central condition (0.93 h-1) for this
variable, in order to obtain such evaluation at an average WHSV. Catalytic results were
also shown to be far from equilibrium conditions, as supported by calculated equilibrium
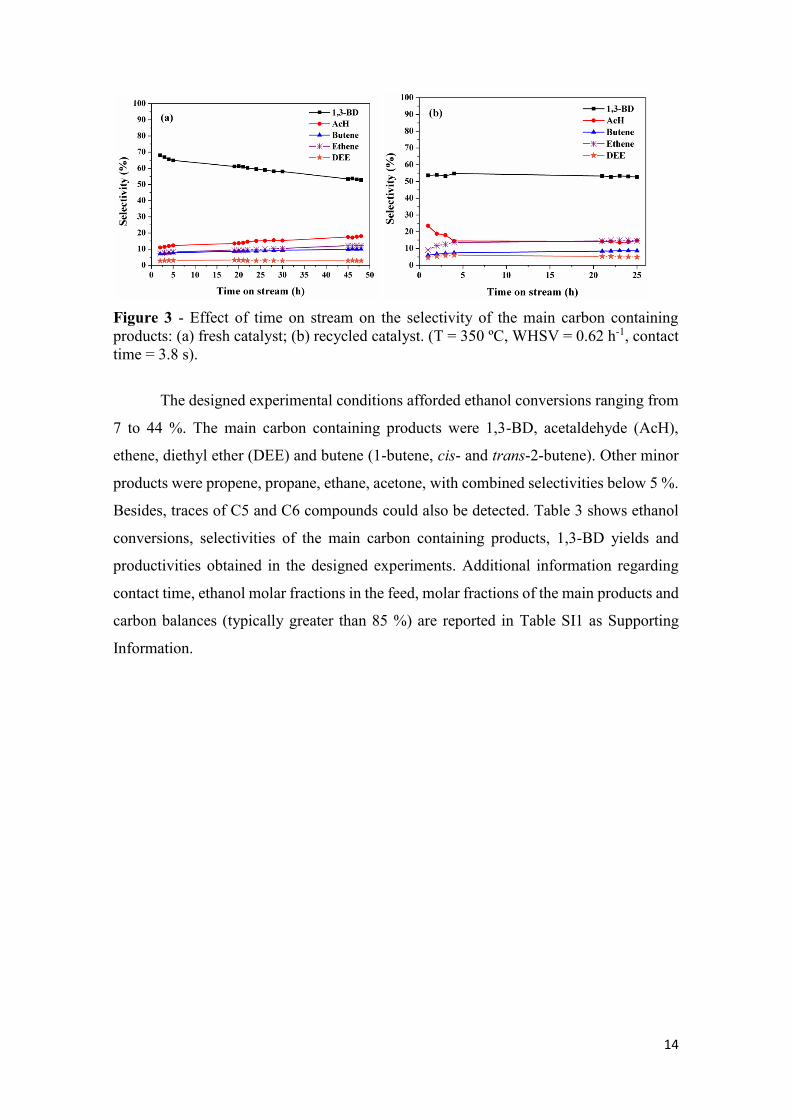
compositions at the analyzed reaction conditions [47], Figure SI3. Moreover, catalysts
used in Experiments 7 and 10 (Table 3) were analyzed after catalysis by
thermogravimetric analysis in order to characterise possible carbon formation on the
catalyst surface. Weight losses of 10.1 and 9.5 % were attributed to carbon formation
during reactions performed at 400 and 350 ºC, respectively, as shown in Figure 4.
16
Figure 4 -Thermogravimetric analysis of used catalysts in Experiments 7 (a) and 10 (b).
Only weight loss above 280 ºC was attributed as carbon formation.
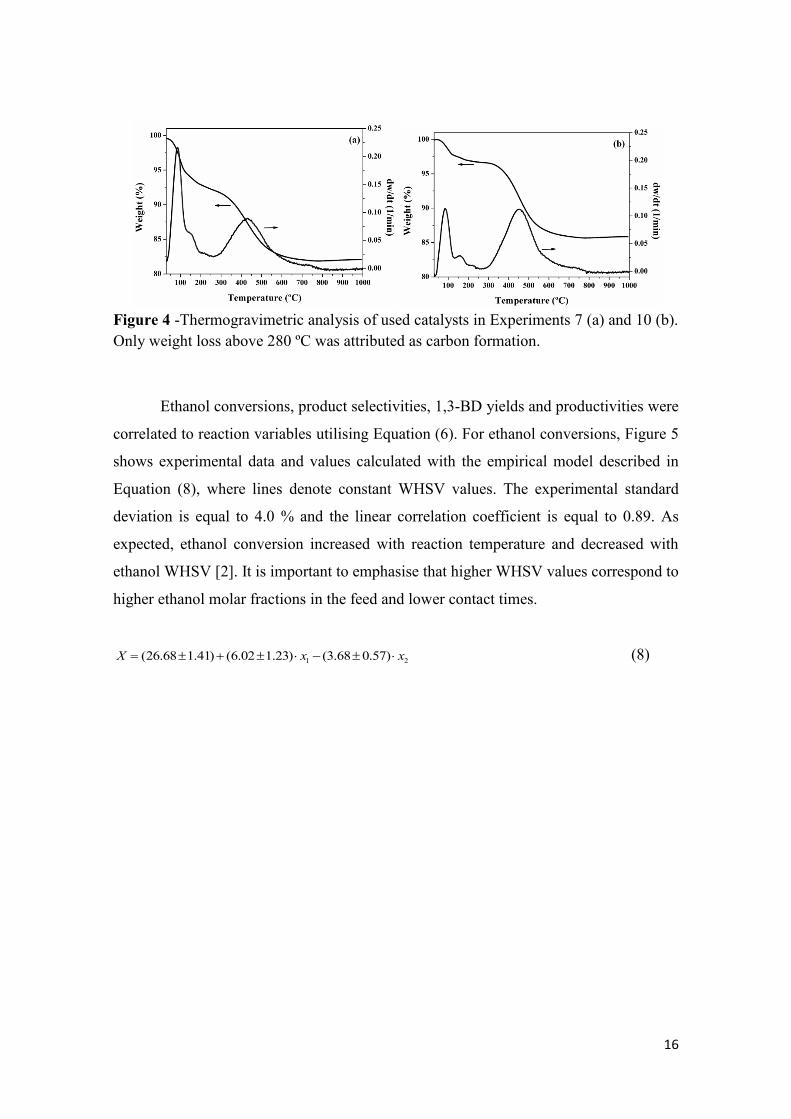
Ethanol conversions, product selectivities, 1,3-BD yields and productivities were
correlated to reaction variables utilising Equation (6). For ethanol conversions, Figure 5
shows experimental data and values calculated with the empirical model described in
Equation (8), where lines denote constant WHSV values. The experimental standard
deviation is equal to 4.0 % and the linear correlation coefficient is equal to 0.89. As
expected, ethanol conversion increased with reaction temperature and decreased with
ethanol WHSV [2]. It is important to emphasise that higher WHSV values correspond to
higher ethanol molar fractions in the feed and lower contact times.
1 2(26.68 1.41) (6.02 1.23) (3.68 0.57)X x x (8)
17
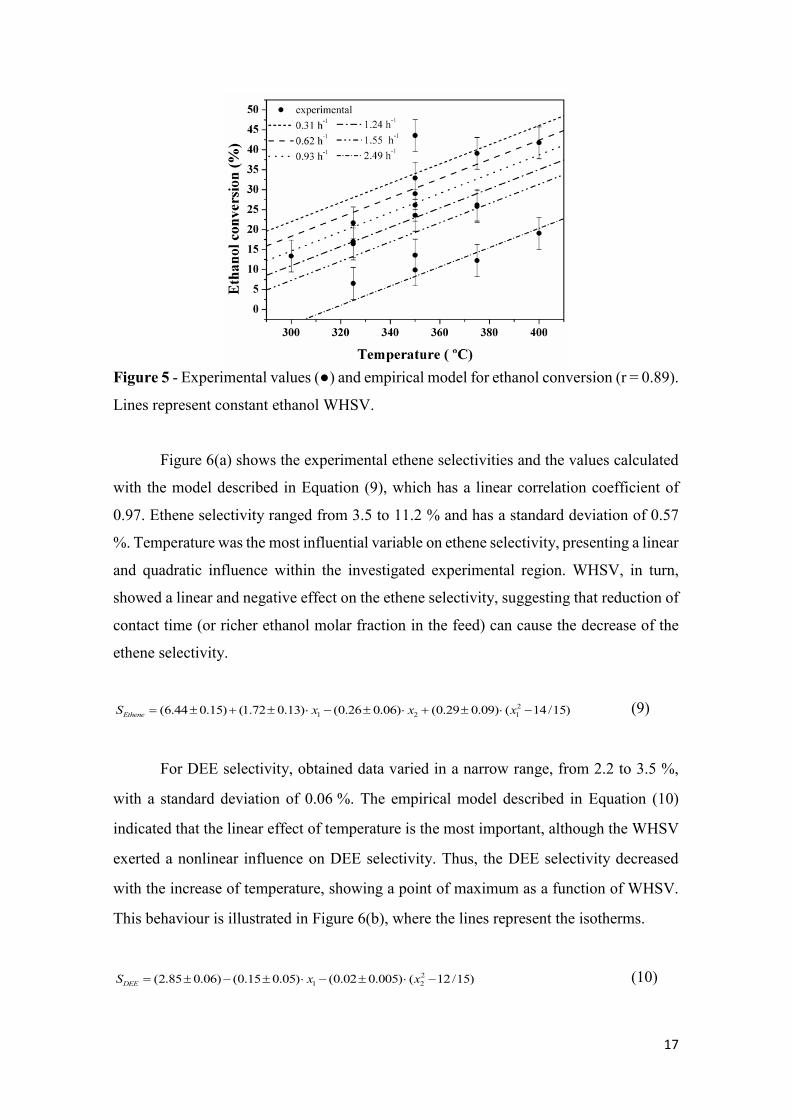
Figure 5 - Experimental values (●) and empirical model for ethanol conversion (r = 0.89).
Lines represent constant ethanol WHSV.
Figure 6(a) shows the experimental ethene selectivities and the values calculated
with the model described in Equation (9), which has a linear correlation coefficient of
0.97. Ethene selectivity ranged from 3.5 to 11.2 % and has a standard deviation of 0.57
%. Temperature was the most influential variable on ethene selectivity, presenting a linear
and quadratic influence within the investigated experimental region. WHSV, in turn,
showed a linear and negative effect on the ethene selectivity, suggesting that reduction of
contact time (or richer ethanol molar fraction in the feed) can cause the decrease of the
ethene selectivity.
2
1 2 1(6.44 0.15) (1.72 0.13) (0.26 0.06) (0.29 0.09) ( 14/15)EtheneS x x x (9)
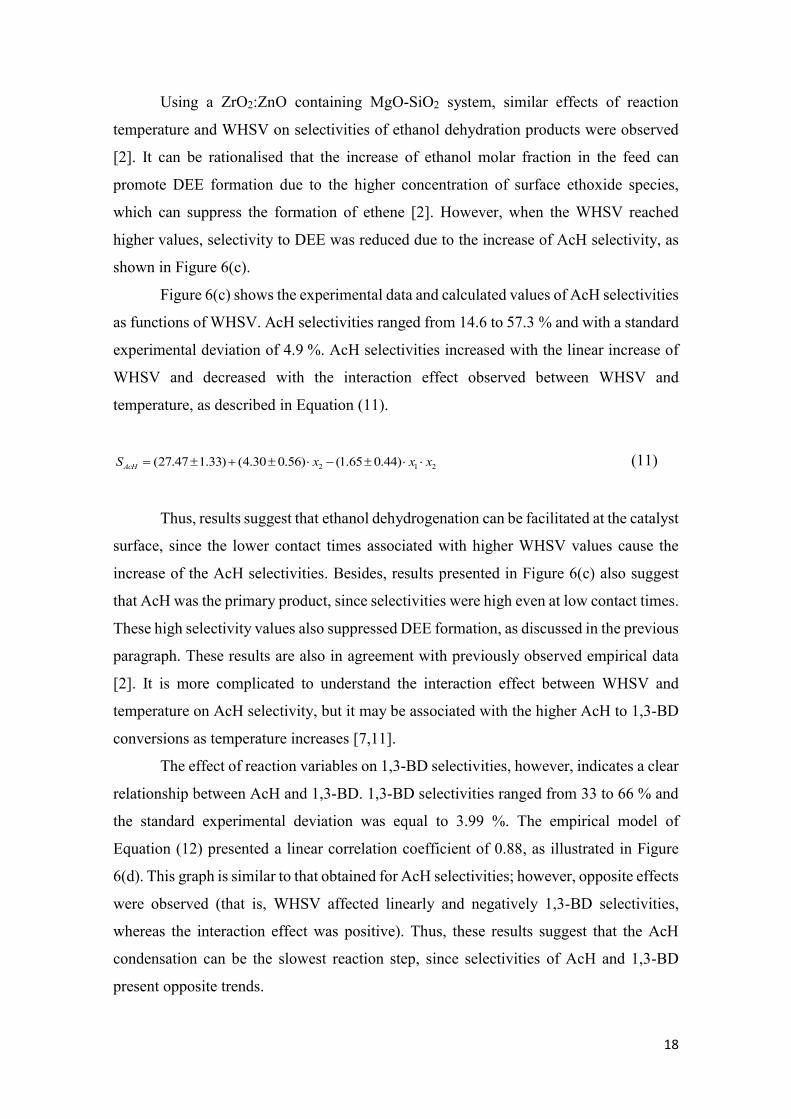
For DEE selectivity, obtained data varied in a narrow range, from 2.2 to 3.5 %,
with a standard deviation of 0.06 %. The empirical model described in Equation (10)
indicated that the linear effect of temperature is the most important, although the WHSV
exerted a nonlinear influence on DEE selectivity. Thus, the DEE selectivity decreased
with the increase of temperature, showing a point of maximum as a function of WHSV.
This behaviour is illustrated in Figure 6(b), where the lines represent the isotherms.
2
1 2(2.85 0.06) (0.15 0.05) (0.02 0.005) ( 12/15)DEES x x (10)
18
Using a ZrO2:ZnO containing MgO-SiO2 system, similar effects of reaction
temperature and WHSV on selectivities of ethanol dehydration products were observed
[2]. It can be rationalised that the increase of ethanol molar fraction in the feed can
promote DEE formation due to the higher concentration of surface ethoxide species,
which can suppress the formation of ethene [2]. However, when the WHSV reached
higher values, selectivity to DEE was reduced due to the increase of AcH selectivity, as
shown in Figure 6(c).
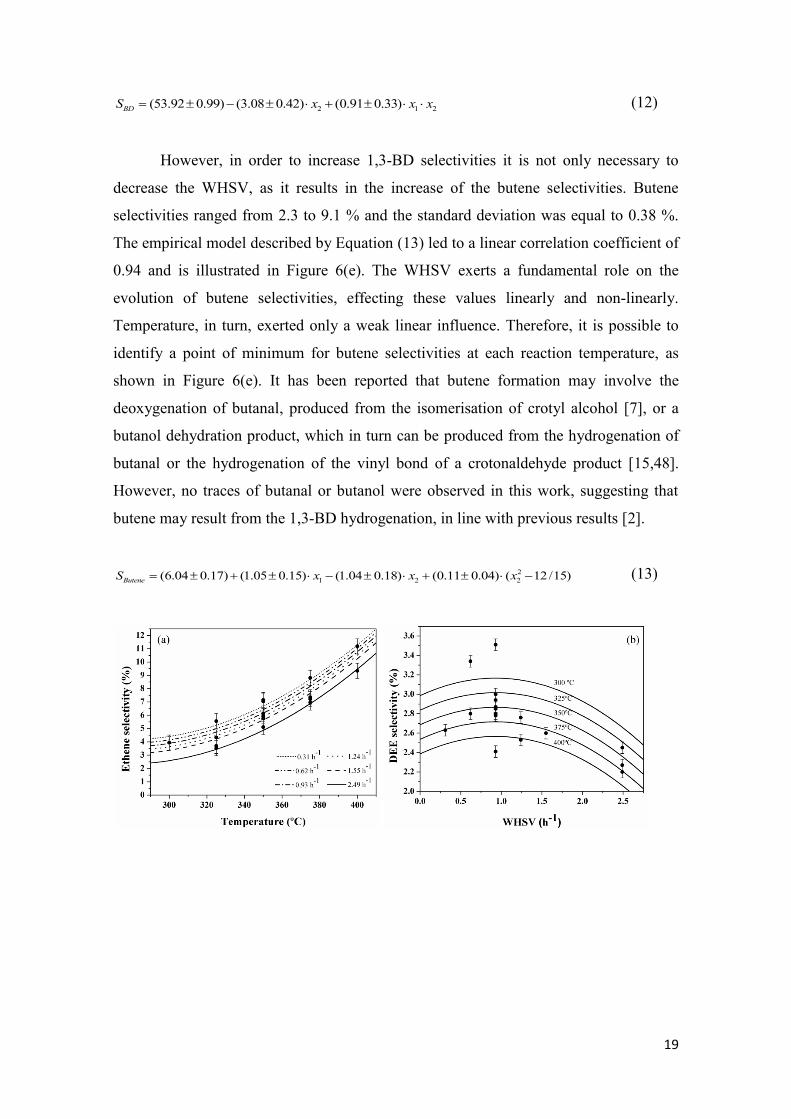
Figure 6(c) shows the experimental data and calculated values of AcH selectivities
as functions of WHSV. AcH selectivities ranged from 14.6 to 57.3 % and with a standard
experimental deviation of 4.9 %. AcH selectivities increased with the linear increase of
WHSV and decreased with the interaction effect observed between WHSV and
temperature, as described in Equation (11).
2 1 2(27.47 1.33) (4.30 0.56) (1.65 0.44)AcHS x x x (11)
Thus, results suggest that ethanol dehydrogenation can be facilitated at the catalyst
surface, since the lower contact times associated with higher WHSV values cause the
increase of the AcH selectivities. Besides, results presented in Figure 6(c) also suggest
that AcH was the primary product, since selectivities were high even at low contact times.
These high selectivity values also suppressed DEE formation, as discussed in the previous
paragraph. These results are also in agreement with previously observed empirical data
[2]. It is more complicated to understand the interaction effect between WHSV and
temperature on AcH selectivity, but it may be associated with the higher AcH to 1,3-BD
conversions as temperature increases [7,11].
The effect of reaction variables on 1,3-BD selectivities, however, indicates a clear
relationship between AcH and 1,3-BD. 1,3-BD selectivities ranged from 33 to 66 % and
the standard experimental deviation was equal to 3.99 %. The empirical model of
Equation (12) presented a linear correlation coefficient of 0.88, as illustrated in Figure
6(d). This graph is similar to that obtained for AcH selectivities; however, opposite effects
were observed (that is, WHSV affected linearly and negatively 1,3-BD selectivities,
whereas the interaction effect was positive). Thus, these results suggest that the AcH
condensation can be the slowest reaction step, since selectivities of AcH and 1,3-BD
present opposite trends.
19
2 1 2(53.92 0.99) (3.08 0.42) (0.91 0.33)BDS x x x (12)
However, in order to increase 1,3-BD selectivities it is not only necessary to
decrease the WHSV, as it results in the increase of the butene selectivities. Butene
selectivities ranged from 2.3 to 9.1 % and the standard deviation was equal to 0.38 %.
The empirical model described by Equation (13) led to a linear correlation coefficient of
0.94 and is illustrated in Figure 6(e). The WHSV exerts a fundamental role on the
evolution of butene selectivities, effecting these values linearly and non-linearly.
Temperature, in turn, exerted only a weak linear influence. Therefore, it is possible to
identify a point of minimum for butene selectivities at each reaction temperature, as
shown in Figure 6(e). It has been reported that butene formation may involve the
deoxygenation of butanal, produced from the isomerisation of crotyl alcohol [7], or a
butanol dehydration product, which in turn can be produced from the hydrogenation of
butanal or the hydrogenation of the vinyl bond of a crotonaldehyde product [15,48].
However, no traces of butanal or butanol were observed in this work, suggesting that
butene may result from the 1,3-BD hydrogenation, in line with previous results [2].
2
1 2 2(6.04 0.17) (1.05 0.15) (1.04 0.18) (0.11 0.04) ( 12/15)ButeneS x x x (13)
20
Figure 6 - Experimental values (●) and empirical model selectivities for: (a) ethene (r =
0.97); (b) DEE (r = 0.82); (c) AcH (r = 0.89); (d) 1,3-BD (r = 0.88); (e) butene (r = 0.94).
In (a), lines represent constant WHSV. In (b), (c), (d) and (e), lines represent isotherms.
However, analyses of the reaction variables effects on product molar fractions
resulted in much more accurate relationships, with linear correlation coefficients of 0.99,
0.96, 0.95, 0.99 and 0.98 for ethene, DEE, AcH, 1,3-BD and butene, respectively, as
shown in Figure 7. This is because selectivities are strongly affected by fluctuations of
molar fractions of all reaction products. As a consequence, variances of selectivities are
higher than variances of molar fractions, contributing to the lower quality of fittings
presented in Figure 6.
The molar fractions of ethanol dehydration products, ethene and DEE, were not
significantly affected by the WHSV, with temperature being the only variable responsible
for changes in these molar fractions. Figure 7(a-b) shows the experimental and empirical
model for ethene and DEE molar fraction, as described in Equations (14) and (15).
21
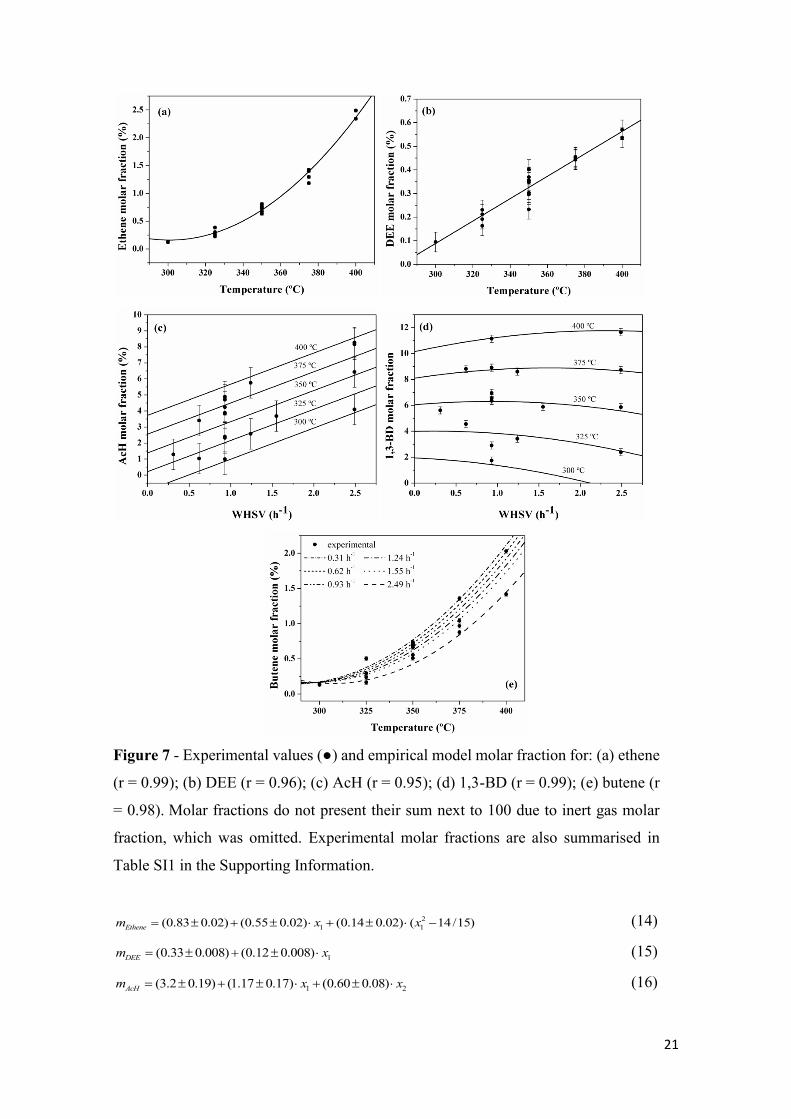
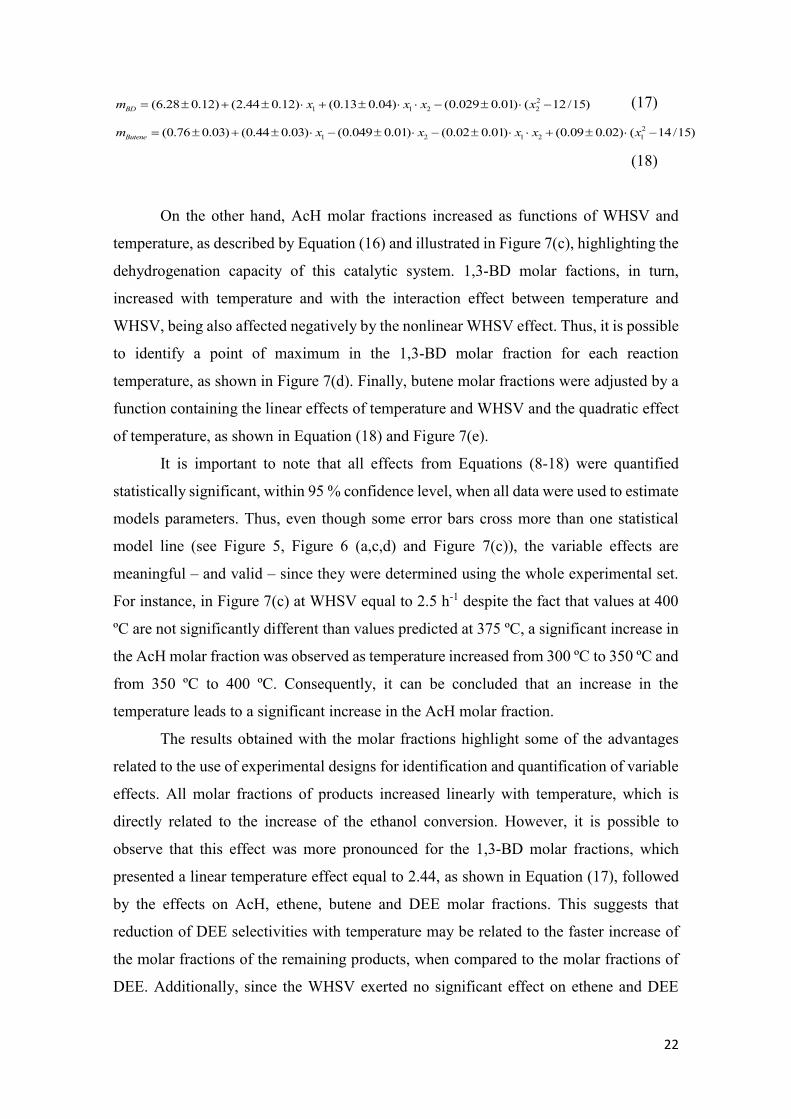
Figure 7 - Experimental values (●) and empirical model molar fraction for: (a) ethene
(r = 0.99); (b) DEE (r = 0.96); (c) AcH (r = 0.95); (d) 1,3-BD (r = 0.99); (e) butene (r
= 0.98). Molar fractions do not present their sum next to 100 due to inert gas molar
fraction, which was omitted. Experimental molar fractions are also summarised in
Table SI1 in the Supporting Information.
2
1 1(0.83 0.02) (0.55 0.02) (0.14 0.02) ( 14/15)Ethenem x x (14)
1(0.33 0.008) (0.12 0.008)DEEm x (15)
1 2(3.2 0.19) (1.17 0.17) (0.60 0.08)AcHm x x (16)
22
2
1 1 2 2(6.28 0.12) (2.44 0.12) (0.13 0.04) (0.029 0.01) ( 12/15)BDm x x x x (17)
2
1 2 1 2 1(0.76 0.03) (0.44 0.03) (0.049 0.01) (0.02 0.01) (0.09 0.02) ( 14/15)Butenem x x x x x
(18)
On the other hand, AcH molar fractions increased as functions of WHSV and
temperature, as described by Equation (16) and illustrated in Figure 7(c), highlighting the
dehydrogenation capacity of this catalytic system. 1,3-BD molar factions, in turn,
increased with temperature and with the interaction effect between temperature and
WHSV, being also affected negatively by the nonlinear WHSV effect. Thus, it is possible
to identify a point of maximum in the 1,3-BD molar fraction for each reaction
temperature, as shown in Figure 7(d). Finally, butene molar fractions were adjusted by a
function containing the linear effects of temperature and WHSV and the quadratic effect
of temperature, as shown in Equation (18) and Figure 7(e).
It is important to note that all effects from Equations (8-18) were quantified
statistically significant, within 95 % confidence level, when all data were used to estimate
models parameters. Thus, even though some error bars cross more than one statistical
model line (see Figure 5, Figure 6 (a,c,d) and Figure 7(c)), the variable effects are
meaningful – and valid – since they were determined using the whole experimental set.
For instance, in Figure 7(c) at WHSV equal to 2.5 h-1 despite the fact that values at 400
ºC are not significantly different than values predicted at 375 ºC, a significant increase in
the AcH molar fraction was observed as temperature increased from 300 ºC to 350 ºC and
from 350 ºC to 400 ºC. Consequently, it can be concluded that an increase in the
temperature leads to a significant increase in the AcH molar fraction.
The results obtained with the molar fractions highlight some of the advantages
related to the use of experimental designs for identification and quantification of variable
effects. All molar fractions of products increased linearly with temperature, which is
directly related to the increase of the ethanol conversion. However, it is possible to
observe that this effect was more pronounced for the 1,3-BD molar fractions, which
presented a linear temperature effect equal to 2.44, as shown in Equation (17), followed
by the effects on AcH, ethene, butene and DEE molar fractions. This suggests that
reduction of DEE selectivities with temperature may be related to the faster increase of
the molar fractions of the remaining products, when compared to the molar fractions of
DEE. Additionally, since the WHSV exerted no significant effect on ethene and DEE
23
molar fractions, the WHSV effect on ethene and DEE selectivities can be understood as
a consequence of the observed WHSV effect on 1,3-BD, AcH and butene molar fractions.
Equations (14-18) also indicate that higher WHSV conditions are beneficial for
1,3-BD production, as AcH and 1,3-BD molar fractions are favoured by this variable.
This suggests that the catalyst surface should be rich in active sites for ethanol
dehydrogenation, since the increase of the ethanol molar fraction in the feed (using higher
WHSV) resulted in higher AcH molar fractions. Furthermore, the behaviour of 1,3-BD
and AcH molar fractions supports the hypothesis that the AcH condensation step
constitutes the slowest reaction step, as also concluded from product selectivity analysis.
Therefore, efforts should be driven to describe how AcH condensation sites depend on
the reaction conditions and catalyst preparation conditions, in order to further optimise
catalyst properties and maximise 1,3-BD production.
At this point, it is important to emphasise that due to the empirical nature of the
developed relationships, Equations (8-18) are statistically valid to describe catalytic
performance only within experimental ranges in which they were built and validated.
Equations (8-18) should not be used for catalytic performance prediction at extrapolated
experimental conditions. Note that whereas ethanol conversion, products selectivities and
molar fractions should vary from 0 to 100 %, developed relationships will not necessarily
follow these constraints. For instance, Equations (15-16) predict that DEE and AcH molar
fractions will tend to infinite as temperature and WHSV are continuously increased.
Nevertheless, models described catalyst activity very well inside the experimental region
chosen, unveiling the kinetic rate-limiting step. Further, it should be emphasised that the
experimental conditions we have employed cover the most common range of conditions
used in the literature.
Moreover, as in a phenomenological model that presents different kinetic
parameters (e.g. activation energy and pre-exponential factor) depending on the catalyst
employed, the parameters estimated in this work will need to be re-estimated when
evaluating different active catalysts for the ethanol to 1,3-BD reaction. However, the
approach presented in this work is broadly applicable and highlights the importance of a
full statistical study.
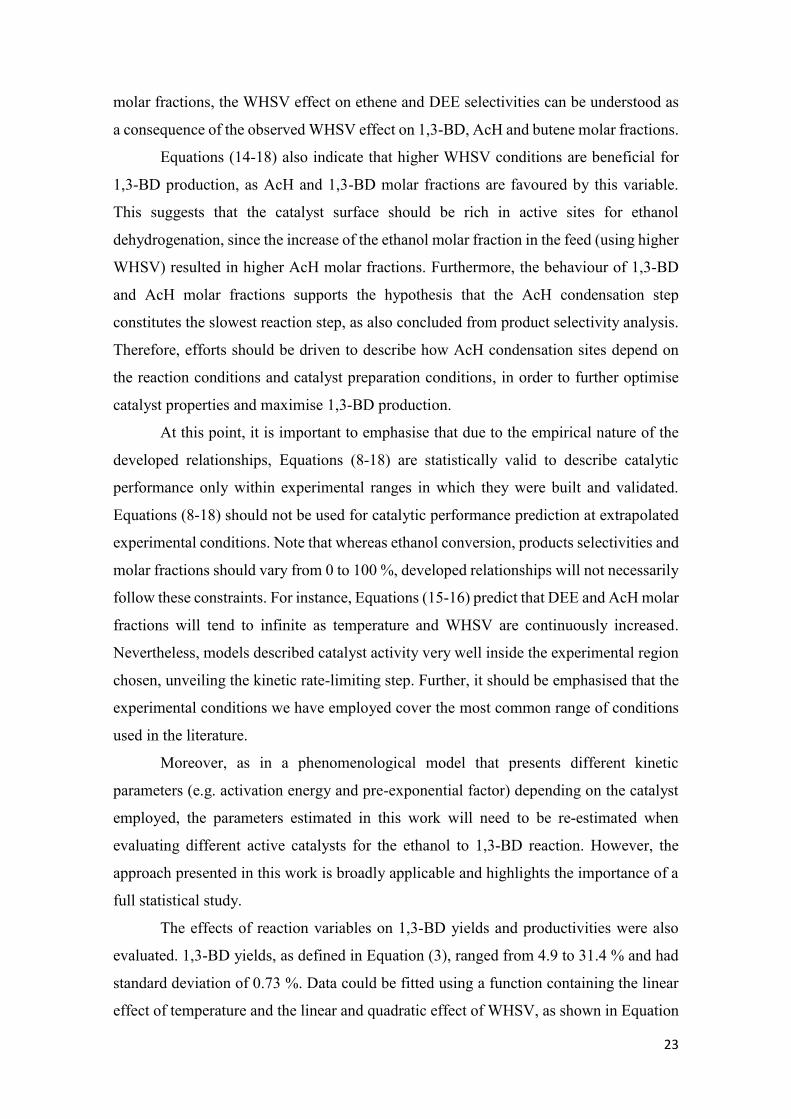
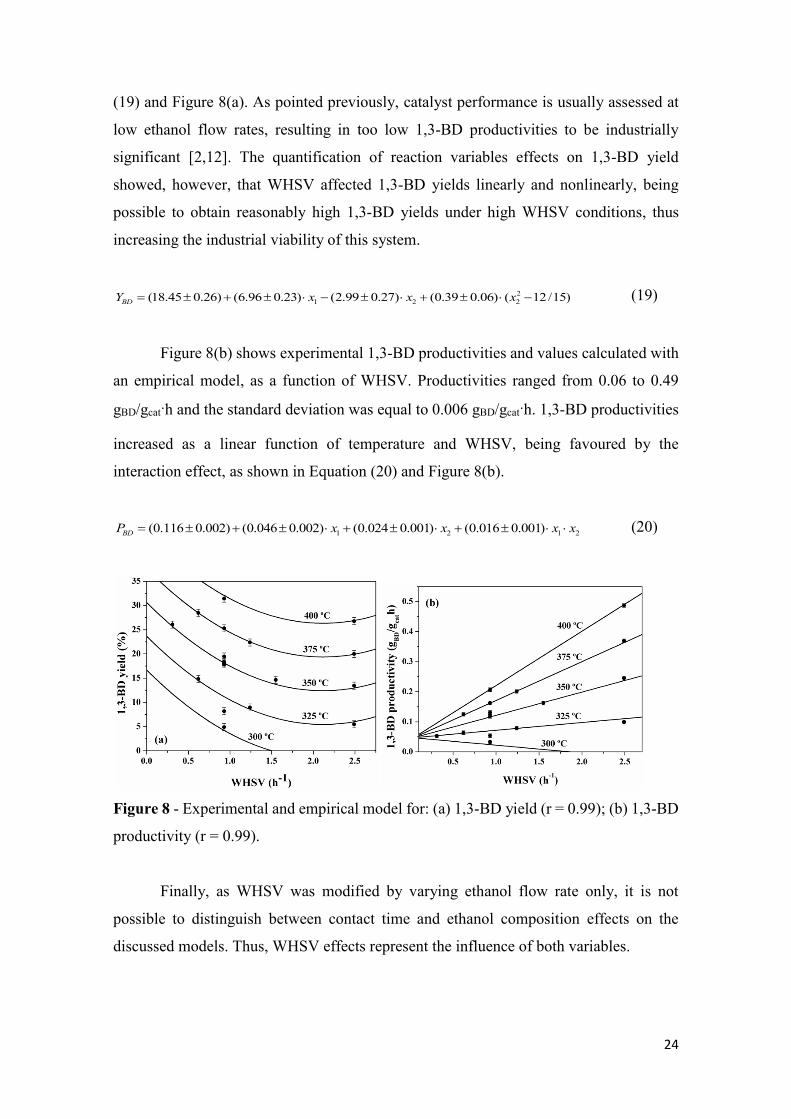
The effects of reaction variables on 1,3-BD yields and productivities were also
evaluated. 1,3-BD yields, as defined in Equation (3), ranged from 4.9 to 31.4 % and had
standard deviation of 0.73 %. Data could be fitted using a function containing the linear
effect of temperature and the linear and quadratic effect of WHSV, as shown in Equation
24
(19) and Figure 8(a). As pointed previously, catalyst performance is usually assessed at
low ethanol flow rates, resulting in too low 1,3-BD productivities to be industrially
significant [2,12]. The quantification of reaction variables effects on 1,3-BD yield
showed, however, that WHSV affected 1,3-BD yields linearly and nonlinearly, being
possible to obtain reasonably high 1,3-BD yields under high WHSV conditions, thus
increasing the industrial viability of this system.
2
1 2 2(18.45 0.26) (6.96 0.23) (2.99 0.27) (0.39 0.06) ( 12/15)BDY x x x (19)
Figure 8(b) shows experimental 1,3-BD productivities and values calculated with
an empirical model, as a function of WHSV. Productivities ranged from 0.06 to 0.49
gBD/gcat·h and the standard deviation was equal to 0.006 gBD/gcat·h. 1,3-BD productivities
increased as a linear function of temperature and WHSV, being favoured by the
interaction effect, as shown in Equation (20) and Figure 8(b).
1 2 1 2(0.116 0.002) (0.046 0.002) (0.024 0.001) (0.016 0.001)BDP x x x x (20)
Figure 8 - Experimental and empirical model for: (a) 1,3-BD yield (r = 0.99); (b) 1,3-BD
productivity (r = 0.99).
Finally, as WHSV was modified by varying ethanol flow rate only, it is not
possible to distinguish between contact time and ethanol composition effects on the
discussed models. Thus, WHSV effects represent the influence of both variables.
25
4. Conclusions
For the first time the effects of temperature and ethanol WHSV on the performances of
ethanol to 1,3-BD reactions were investigated with the aid of a statistical experimental
design approach. Catalytic results, ethanol conversions, product selectivities, 1,3-BD
yields and productivities were correlated with reaction variables, allowing for
identification and quantification of variable effects on the 1,3-BD formation.
The interaction effect between temperature and WHSV was very important for 1,3-BD
molar fractions, selectivities and productivities. Thus, evaluation of catalyst performance
in terms of the “change-one-factor-at-a-time” method should be thought carefully, so as
not to erroneously assign a change in selectivity to one variable and not two acting in a
cooperative manner. Moreover, the nonlinear effects of WHSV on 1,3-BD molar fractions
and yields were significant, indicating that high WHSV conditions can clearly benefit the
1,3-BD formation with the investigated catalyst system.
Further, the results indicate the existence of a strong relationship between
acetaldehyde and 1,3-BD selectivities, as well as their respective molar fractions,
suggesting that conversion of acetaldehyde to 1,3-BD constitutes the rate determining
step of the reaction mechanism. As a consequence, efforts should be driven to understand
and improve how AcH condensation sites depend on the reaction conditions and catalyst
preparation conditions, in order to allow for optimisation of catalyst properties and
maximise 1,3-BD production. Finally, given the obtained empirical model responses, the
investigation of 1,3-BD production at higher temperatures and WHSV's should be
considered.
5. Acknowledgments
The authors thank CNPq (Conselho Nacional de Desenvolvimento Científico e
Tecnológico, Brazil) and University of Bath for funding this research and providing
scholarships. We thank the EPSRC for funding the solid-state NMR facility in Durham
(UK) in particularly Dr David Apperley.
Full experimental data and further characterisation is available as supporting information
6. References
[1] P. I. Kyriienko, O. V. Larina, S. O. Soloviev, S. M. Orlyk and S. Dzwigaj, Catal.
Commun., 2016, 77, 123-126.
26
[2] S. Da Ros, M. D. Jones, D. Mattia, J. C. Pinto, M. Schwaab, F. B. Noronha, S. A.
Kondrat, T. C. Clarke, and S. H. Taylor, ChemCatChem, 2016, 8, 2376-2386.
[3] W. C. White, Chem-Biol Interact, 2007, 166, 10-14.
[4] J. A. Posada, A. D. Patel, A. Roes, K. Blok, A. P. C. Faaij, M.K. Patel, Bioresour
Technol., 2013, 135, 490-9.
[5] A.D. Patel, K. Meesters, H. den Uil, E. de Jong, K. Blok, M. K. Patel, Energy Environ.
Sci., 2012, 5, 8430-8444.
[6] T. Ren, M. Patel and K. Blok, Energy, 2008, 33, 817-833.
[7] E. V. Makshina, M. Dusselier, W. Janssens, J. Degrève, P. A. Jacobs, B. F. Sels,
Chem. Soc. Rev. 2014, 43, 7917-7953.
[8] A. Klein, K. Keisers and R. Palkovits, Appl. Catal. A: Gen., 2016, 514, 192-202.
[9] H. Niiyama, S. Morii, E. Echigoya, Bull. Chem. Soc. Jpn. 1972, 45, 655-659.
[10] S. Kvisle, A. Aguero, R. P. A. Sneeden, Appl. Catal. 1988, 43, 117-131.
[11] M. D. Jones, C. G. Keir, C. Di Iulio, R. A. M. Robertson, C. V. Williams, D. C.
Apperley, Catal. Sci. Technol. 2011, 1, 267-272.
[12] E. V. Makshina, W. Janssens, B. F. Sels, P. A. Jacobs, Catal. Today. 2012, 198, 338-
344.
[13] V. L. Sushkevich, I. I. Ivanova, V. V Ordomsky, E. Taarning, ChemSusChem 2014,
7, 2527-2536
[14] M. Gao, Z. Liu, M. Zhang, L. Tong, Catal. Lett., 2014, 144, 2071-2079.
[15] V. L. Sushkevich, I. I. Ivanova, E. Taarning, Green Chem. 2015, 17, 2552-2559.
[16] V. V. Ordomsky, V. L. Sushkevich, I. I. Ivanova, J. Mol. Catal. A: Chem. 2010, 333,
85-93.
[17] C. Angelici, M. E. Z. Velthoen, B. M. Weckhuysen, P. C. A. Bruijnincx,
ChemSusChem, 2014, 7, 2505-2515.
[18] M. Lewandowski, G. S. Babu, M. Vezzoli, M. D. Jones, R. E. Owen, D. Mattia, P.
Plucinski, E. Mikolajska, A. Ochenduszko, D. C. Apperley, Catal. Commun. 2014, 49,
25-28.
[19] O. V. Larina, P. I. Kyriienko and S. O. Soloviev, Catal. Lett. 2015, 145, 1162-1168.
[20] J. V. Ochoa, C. Bandinelli, O. Vozniuk, A. Chieregato, A. Malmusi, C. Recchi, F.
Cavani, Green Chem. 2016, 18, 1653-1663.
27
[21] T. D. Baerdemaeker, M. Feyen, U. Müller, B. Yilmaz, F.-S. Xiao, W. Zhang, T.
Yokoi, X. Bao, H. Gies, D. E. De Vos, ACS Catal. 2015, 5, 3392-3397.
[22] Y. Sekiguchi, S. Akiyama, W. Urakawa, T. Koyama, A. Miyaji, K. Motokura and T.
Baba, Catal. Commun. 2015, 68, 20-24
[23] R. A. L. Baylon, J. Sun and Y. Wang, Catal. Today 2016, 259, 446-452.
[24] H. E. Jones, E. E. Stahly and B. B. Corson, J. Am. Chem. Soc., 1949, 71, 1822-1828.
[25] G. O. Ezinkwo, V. F. Tretjakov, R. M. Talyshinky, A M. Ilolov and T. A. Mutombo,
Catal. Commun., 2014, 43, 207-212.
[26] W. Janssens, E. V. Makshina, P. Vanelderen, F. De Clippel, K. Houthoofd, S.
Kerkhofs, J. A. Martens, P. A. Jacobs, B. F. Sels, ChemSusChem 2015, 8, 994-1008.
[27] S. K. Bhattacharyya, S. K. Sanyal, J. Catal., 1967, 7, 152-158.
[28] A. Chieregato, J. Velasquez Ochoa, C. Bandinelli, G. Fornasari, F. Cavani, M. Mella,
ChemSusChem 2015, 8, 377-388.
[29] B. B. Corson, E. E. Stahly, H. E. Jones, H. D. Bishop, Chem. Eng. Chem. 1949, 41,
1012-1017.
[30] S. K. Bhattacharyya, N. D. Ganguly, J. Appl. Chem., 1962, 12, 97-104.
[31] S. K. Bhattacharyya, N. D. Ganguly, J. Appl. Chem., 1962, 12, 105-110.
[32] M. Nele, A. Vidal, D. L. Bhering, J. C. Pinto and V. M. M. Salim, Appl. Catal. A:
Gen., 1999, 178, 177-189.
[33] S. Da Ros, E. Barbosa-Coutinho, M. Schwaab, V. Calsavara and N. R. C. Fernandes-
Machado, Mater. Charact. 2013, 80, 50-61.
[34] T. F. Edgar, D. M. Himmelblau, L. S. Lasdon, Optimization of chemical processes,
McGraw-Hill, New York, 2001.
[35] A. L. Larentis, N. S. De Resende, V. Maria, M. Salim and J. C. Pinto, Appl. Catal.
A: Gen., 2001, 215, 211-224.
[36] G. F. Froment, K. B. Bischoff, J. De Wilde, Chemical reactor analysis and design,
third ed., John Wiley & Sons, Inc., 2011.
[37] J. C. Pinto, M. W. Lobão, A. L. Alberton, M. Schwaab, M. Embiruçu, S. V. Melo,
Int. J. Chem. Reactor Eng., 2011, 9, A87.
[38] M. Schwaab, L. P. Lemos, J. C. Pinto, Chem. Eng. Sci., 2008, 63, 2895-2906.
[39] G. Calleja, A. De Lucas, R. Van Grieken, Fuel, 1995, 74, 445-451.
28
[40] S. Da Ros, M. D. Jones, D. Mattia, M. Schwaab, E. Barbosa-Coutinho, R.C. Rabelo-
neto, F. B. Noronha, J. C. Pinto, Chem. Eng. J., 2017, 308, 988-1000.
[41] G. E. P. Box, J. S. Hunter, W. G. Hunter, Statistics for Experimenters – Design,
Innovation, and Discovery, John Wiley & Sons, New Jersey, 2005.
[42] G. E. P. Box, W. G. Hunter, J. S. Hunter, Statistics for Experimenters – An
Introduction to Design, Data Analysis, and Model Building, John Wiley & Sons, New
York, 1978.
[43] D. R. M. Brew and F.P. Glasser, Cem. Concr. Res. 2005, 35, 85-98.
[44] Z. Li, T. Zhang, J. Hu, Y. Tang, Y. Niu, J. Wei and Q. Yu, Constr. Build. Mater.
2014, 61, 252-259.
[45] J. S. Hartman and R. L. Millard, Phys. Chem. Minerals, 1990, 17, 1-8.
[46] C. Perego, S. Peratello, Catal. Today, 1999, 52, 133-145.
[47] A. J. Scheid, E. Barbosa-Coutinho, M. Schwaab, N. P. G. Salau, V. C. Costa, Gas
phase reaction equilibrium calculator software.
[48] M. León, E. Díaz, S. Ordóñez, Catal. Today, 2011, 164, 436-442.