Embed Size (px)
Citation preview

HAL Id: hal-00870543https://hal-enpc.archives-ouvertes.fr/hal-00870543
Submitted on 15 Oct 2013
HAL is a multi-disciplinary open accessarchive for the deposit and dissemination of sci-entific research documents, whether they are pub-lished or not. The documents may come fromteaching and research institutions in France orabroad, or from public or private research centers.
L’archive ouverte pluridisciplinaire HAL, estdestinée au dépôt et à la diffusion de documentsscientifiques de niveau recherche, publiés ou non,émanant des établissements d’enseignement et derecherche français ou étrangers, des laboratoirespublics ou privés.
Modelling the fate of nonylphenolic compounds in theSeine River – part 2: Assessing the impact of global
change on daily concentrationsMathieu Cladière, Céline Bonhomme, Lauriane Vilmin, Johnny Gasperi,
Nicolas Flipo, Florence Habets, Bruno Tassin
To cite this version:Mathieu Cladière, Céline Bonhomme, Lauriane Vilmin, Johnny Gasperi, Nicolas Flipo, et al.. Mod-elling the fate of nonylphenolic compounds in the Seine River – part 2: Assessing the impact of globalchange on daily concentrations. Science of the Total Environment, Elsevier, 2014, 468 - 469, pp.1059- 1068. �10.1016/j.scitotenv.2013.09.029�. �hal-00870543�

1
Modelling the fate of nonylphenolic compounds in 1
the Seine River - part 2: assessing the impact of 2
global change on daily concentrations 3
Mathieu Cladière1, Céline Bonhomme1, Lauriane Vilmin2, Johnny Gasperi1, Nicolas Flipo2, Florence Habets2 4
and Bruno Tassin1 5
1: Université Paris-Est, LEESU (UMR MA102), UPEC, UPEMLV, ENPC, AgroParisTech, 94010 Créteil 6
2: Geosciences Department, MINES ParisTech, 35 rue Saint-Honoré, 77305 Fontainebleau 7
Corresponding authors: [email protected]; [email protected] 8
Journal: Science of the Total Environment, 2014; DOI: 10.1016/j.scitotenv.2013.09.029 9
10
This study aims at modelling the daily concentrations of nonylphenolic compounds such as 4-nonylphenol 11 (4-NP), nonylphenol monoethoxylate (NP1EO) and nonylphenoxy acetic acid (NP1EC) within the Seine River 12 downstream of Paris City over a year, firstly in the present state (year 2010) and for years 2050 and 2100 in 13 order to assess the consequences of global change on the fate of nonylphenolic compounds in the Seine river. 14
Concentrations were first simulated for the year 2010 and compared to monthly measured values downstream of 15 Paris. To achieve this goal, the hydrodynamic and biogeochemical model, ProSe, was updated to simulate the 16 fate of 4-NP, NP1EO and NP1EC. The Seine upstream and Oise Rivers (tributaries of the Seine River) 17 concentrations are estimated according to concentrations - flow relationships. For Seine Aval wastewater 18 treatment plan (SA-WWTP), the concentrations are considered constant and the median values of 11 campaigns 19 are used. The biodegradation kinetics of 4-NP, NP1EO and NP1EC in the Seine River were deduced from the 20 results of the companion paper. The Nash-Sutcliffe coefficient indicates a good efficiency to simulate the 21 concentrations of 4-NP, NP1EC and NP1EO over an entire year. 22
Eight scenarios were built to forecast the impacts of global warming (flow decrease), population growth (SA-23 WWTP flow increase) and optimisation of wastewater treatment (improvement of the quality of effluents) on 24 annual concentrations of 4-NP, NP1EO and NP1EC at Meulan by 2050 and 2100. As a result, global warming 25 and population growth may increase the concentrations of 4-NP, NP1EC and NP1EO, especially during low-flow 26 conditions, while the optimisation of wastewater treatment is an efficient solution to balance the global change 27 by reducing WWTP outflows. 28
Keywords: Nonylphenol; nonylphenol ethoxylate; endocrine disrupting compounds; global change; 29

2
1. Introduction 1
Climate change at the scale of Europe is expected to increase the frequency of extreme events such as dry 2
periods or storms (Christensen et al., 2007). These extreme events have significant influence on river flow rates 3
such as long low-water periods or river flooding (Habets et al., 2013). In addition to climate change, population 4
growth and economic development of urbanized area are forecasted by the 21st century (De Biasi, 2010). 5
Combining both aspects suggest that the European cities will likely put a higher pressure on receiving surface 6
water during the 21st century than at the end of 20th century. 7
Global change on European river basins may lead to a disruption of the biogeochemical status of river as already 8
predicted for nitrogen and phosphorus concentrations (Andersen et al., 2006; Hadjikakou et al., 2011; Wilson 9
and Weng, 2011). Despite the significant concern no study deals with the modelling of the global change 10
influence on endocrine disruptor concentrations in surface water. Among the endocrine disruptors, nonylphenol 11
ethoxylates NPnEO and especially 4-nonylphenol (4-NP) hold an important place due to their widespread 12
presence all over the world (Ahel et al., 1994; Vethaak et al., 2005; Bergé et al., 2012) and their proved toxicity. 13
4-NP mainly originates from the biodegradation of non-ionic surfactants nonylphenol polyethoxylate (NPnEO) 14
through anaerobic (John and White, 1998) or aerobic (Jonkers et al., 2001) processes. NPnEO are used in a large 15
range of domestic and industrial detergents, as emulsifier or wetting agents with a world annual consumption of 16
500,000 tons in 2000 (Ying et al., 2002). The fate of NPnEO in the environment is a important issue since their 17
biodegradation products (nonylphenol monoethoxylate - NP1EO - nonylphenol acetic acid - NP1EC - and 4-NP) 18
are recognized as being more toxic and estrogenic than the longer NPnEO (Soto et al., 1991). Jugan et al., 19
(2009) reported that the 4-NP significantly contributes to the estrogenic activities found in surface water. Based 20
on the toxicity of 4-NP on the aquatic wildlife, it has been added to the 33 priority pollutants of the Water 21
Framework Directive 2000/60/EC (European Commission, 2000). The European directive 2008/105/EC 22
(European Commission, 2008) fixed its annual average environmental quality standard (AA-EQS) within surface 23
water at 300 ng/L. 24
The occurrence and fate of endocrine disrupting compounds such as 4-NP in river water are of concern for 25
aquatic wildlife as well as regarding the capacity of European cities to provide safe drinkable freshwater to their 26
residents. Therefore decision makers need reliable information to select the most efficient solutions to reach or 27
maintain the good ecological status of water bodies as defined by the Water Framework Directive, in the 28

3
upcoming years and decades. This issue is more crucial for the largest European cities such as London, Moscow 1
or Paris since they are built in basins of very small rivers. 2
A modelling project was intended in 2010 to assess the long-term fate of nonylphenolic compounds in the Seine 3
River was carried out in order to forecast the impacts of global change on the Parisian Metropolitan Area and it 4
describes in two successive papers. Beyond studied compounds, this modelling project also attempts to give 5
guidelines and methodology for fate modelling of other pollutants included in the list of priority pollutants 6
(European Commission, 2000) or for emerging pollutants with close behaviours as regards their sources, transfer 7
and biodegradability in surface water. 8
The first step, performed in a companion paper (Cladière et al., 2014), aimed at setting up an efficient model by 9
determining the in-situ attenuation rate constants of 4-NP, NP1EC and NP1EO within the Seine River. This first 10
part provides relevant information on attenuation constant rates and reveals that the calibrated parameters vary 11
significantly according to the biogeochemical conditions of the Seine River. Two parameter sets have been 12
calculated from July and September 2011 campaigns and need to be tested over longer periods of time. 13
In this paper, this model is firstly validated over a complete year (2010) by comparing results to data collected 14
monthly at different locations on the Seine River catchment. Then, the impact of global change in the Seine 15
River basin on daily concentrations of nonylphenolic compounds is assessed over one year in the middle (2045 - 16
2055) and the late (2090 - 2100) 21st century. Two aspects of the global change are considered: i) the climate 17
change (based on two contrasted projections), ii) the growth of the Parisian population and iii) the wastewater 18
treatment optimisation in the Parisian largest plant. 19
2. Material and methods 20
2.1. Studying sites 21
This study focuses on the Seine River basin and especially the Parisian Metropolitan Area. Nowadays, the Paris 22
City puts a strong anthropic pressure on the Seine River by a combination of important volume of treated water 23
(≈ 30 m3/s generated by 12 millions of inhabitants) discharged in the Seine River which has a low mean annual 24
flow (300 m3/s). The Seine River transect considered in this study is located downstream of Paris City and is 25
40 km long from Bougival to Meulan (Fig.1) to ensure that the downstream point included all Parisian 26
discharges. This transect is selected because of the presence of two major hydro-ecological discontinuities: the 27
confluence with the Oise River (annual mean flow = 110 m3/s) and the outflow of Seine Aval wastewater 28

4
treatment plant (SA-WWTP) (annual mean flow = 19.3 m3/s) which are the only lateral inflows during dry 1
weather periods. 2
Oise RiverMeulan
Seine Aval WWTP
Paris City
Flow
Flow
Surface waterWWTP effluent
Paris
Seine
Oise
Seine
Flow
Bougival
Oise RiverMeulan
Seine Aval WWTP
Paris City
Flow
Flow
Surface waterWWTP effluent
Paris
Seine
Oise
Seine
Flow
Bougival 3
Fig. 1 Simulated transect downstream of Paris City and sampling sites 4 5
Annual and seasonal variabilities of 4-NP, NP1EC and NP1EO concentrations in the Seine River were examined 6
during eleven monthly sampling campaigns. Samples were collected for surface water and SA-WWTP effluent 7
from February 2010 to February 2011. The surface waters were manually sampled at Bougival (upstream point), 8
and at Meulan (downstream point) for the transect and in the Oise River at its confluence with the Seine River 9
and SA-WWTP effluents for the tributaries, in 2L amber glass bottles (Fig.1). These four sampling points 10
provide all boundary conditions required to simulate this transect. The analytical procedure, including sample 11
preparations and analyses (liquid chromatography coupled to a tandem mass spectrometry, UPLC-MS-MS), is 12
described in details by Cladière et al., (2013b). This method enables the quantification of 4-NP, NP1EC and 13
NP1EO concentrations in the dissolved phase of water samples. 14
2.2. Modelling tool: ProSe model 15
The hydrodynamic and biogeochemical ProSe model was firstly developed to simulate the impacts of human 16
activities on the carbon, nitrogen, and phosphorus cycles in the Seine River and its tributaries (Even et al., 1998; 17
Flipo et al., 2004; Flipo et al., 2007). For this study the biogeochemical module is updated to take into account 18
the biodegradation pathways of NPnEO lastly updated in the literature by Giger et al., (2009). The conceptual 19
scheme of the modelling attempt and the input parameters needed to simulate daily concentrations of 20
nonylphenolic compounds at Meulan are depicted in the Fig. 2. 21

5
Biodegradation parameters
BOUGIVALFlow rate
[C] time series
SA-WWTPFlow rate
[C] time series
Seine River (hydrodynamic module)K1, K1’, K 2 , K3
Meulan[C] time series
Boundary conditions
Results
Precursor inputsPrecursor inputs Precursor inputs
OISE RIVERFlow rate
[C] time series
Biodegradation parameters
BOUGIVALFlow rate
[C] time series
BOUGIVALFlow rate
[C] time series
SA-WWTPFlow rate
[C] time series
SA-WWTPFlow rate
[C] time series
Seine River (hydrodynamic module)K1, K1’, K 2 , K3K1, K1’, K 2 , K3
Meulan[C] time series
Meulan[C] time series
Boundary conditions
ResultsResults
Precursor inputsPrecursor inputsPrecursor inputsPrecursor inputs Precursor inputsPrecursor inputs
OISE RIVERFlow rate
[C] time series
OISE RIVERFlow rate
[C] time series
1 Fig. 2 Conceptual scheme of the modelling approach and the required inputs parameters. 2
[C]: concentrations of 4-NP, NP1EC and NP1EO 3 4
As previously explained in the companion paper (Cladière et al., 2014), the nonylphenol polyethoxylate 5
biodegradation scheme (Giger et al., 2009) and two sampling campaigns are used to determine biodegradation 6
parameters. The attenuation rate constants K1, K1’ and K2 represent the biotransformation of NP1EO and NP1EC 7
into their products (NP1EC or NP) while K3 represents the global disappearance of 4-NP from the dissolved 8
phase and takes into account biodegradation, volatilisation and sorption onto particles without possibility to 9
differentiate the processes (Cladière et al. 2014). Jonkers et al. (2005) reported for NP1EO and NP1EC that their 10
concentrations are relatively insensitive toward sorption. Based on this result and considering the fact that we 11
focused on dissolved concentration as Jonkers et al. (2005), we decide to neglect sorption onto particles for 12
NP1EO and NP1EC. In addition, the water-air exchange for nonylphenolic compounds (NP1EO and NP1EC) has 13
been considered as insignificant due to very low Henry’s constants (e.g. NP1EO and NP2EO ≈ 14
0.0003 Pa.m3/mole). The precursor inputs in ng/L/d correspond to the appearance of NP1EC and NP1EO due to 15
the biodegradation of long chain precursors (nonylphenol polyethoxylates: NPnEO and nonylphenoxy 16
polyethoxy acetic acids: NPnEC). 17
The biodegradation parameters have been calibrated according to two sampling campaigns carried out in July 18
and September 2011. The biodegradation parameters, summarised in Table 1, are significantly higher in July 19
than in September 2011. This discrepancy may be linked to an enhanced microbial activities in July due to an 20
algal bloom (Chlorophyll a > 20 µg/L) while in September no disturbance of biogeochemical status of the Seine 21
River is found (Chlorophyll a < 5 µg/L) (Cladière et al., 2014).22

6
Table 1 Biodegradation parameters (rate constants in d-1 and precursor inputs in ng/L/d) assessed in the Seine 1 River 2
Attenuation rate constants (d-1) Precursor inputs (ng/L/d)
K1 = K1’ (NP1EO) min - opt - max
K2 (NP1EC) min - opt - max
K3 (4-NP) min - opt - max
NP1EC min - max
NP1EO min - max
July 2011 0.05 - 0.10 - 0.15 3.14 - 3.30 - 3.47 2.38 - 2.50 - 2.75 3.44 - 7.84 0.06 - 0.4
September 2011 0.29 - 0.30 - 0.33 0.08 - 0.10 - 0.14 0.09 - 0.15 - 0.19 0.01 - 0.3 0.04 - 0.4
Kx = attenuation rate constant. Biodegradation scheme is provided in the companion paper. 3
2.3. Determination of model efficiency 4
The efficiency of an annual simulation is evaluated by calculation of the Nash-Sutcliffe coefficient (Nash and 5
Sutcliffe, 1970) (NS, Equation 1) 6
( )( )
∑ −
∑ −−=
°°
°°
2
2
1AvgMes
SimMes
CC
CCNS Equation 1
Where: 7
NS is the Nash-Sutcliffe efficiency coefficient 8
C°Mes is the measured concentration 9
C°Sim is the simulated concentration 10
C°Avg is the average value of measured concentrations 11
The NS can range from - ∞ to 1. A positive NS coefficient means that the model gives more accurate prediction 12
than the average value of measured concentrations. The higher the value, the better the model. Commonly, a 13
model could be considered as accurate if NS is higher than 0.4 (Nash and Sutcliffe, 1970). 14
2.4. Boundary conditions for 2010 15
2.4.1. Calculation methods for daily concentrations of boundary conditions 16
The boundary conditions such as flow rates and concentrations of nonylphenolic compounds (at Bougival, SA-17
WWTP and Oise River) are calculated on a daily basis. The river flow rates are extracted from national 18
discharge gauging stations (supplementary data, Fig. S1) and the SA-WWTP flow rate is provided by the Paris 19
public sanitation service. Concentrations of nonylphenolic compounds measured at Bougival, the Oise River, 20
Seine Aval WWTP and Meulan as well as biogeochemical parameters are available in the supplementary 21
material Table S1. 22

7
Concentration-flow relationships [C] = a x Q-b, where [C] is the concentration and Q the river flow rate were 1
adjusted for year 2010 to the monthly sampling campaigns, for NP1EC and NP1EO at Bougival (Fig.3) and for 2
the NP1EC in the Oise River (supplementary data, Fig. S2). 3
NP1EC NP1EO
[NP1EC] = 36,478 x Q -1.1871
R2 = 0.76
0
50
100
150
200
250
0 200 400 600 800River flow rate (Q, m 3/s)
Con
cent
ratio
n ([
C],
ng/L
) [NP1EO] = 19,622 x Q -1.2208
R2 = 0.75
0
50
100
150
0 200 400 600 800River flow rate (Q, m 3/s)
Con
cent
ratio
n ([
C],
ng/L
)
NP1EC NP1EO
[NP1EC] = 36,478 x Q -1.1871
R2 = 0.76
0
50
100
150
200
250
0 200 400 600 800River flow rate (Q, m 3/s)
Con
cent
ratio
n ([
C],
ng/L
) [NP1EO] = 19,622 x Q -1.2208
R2 = 0.75
0
50
100
150
0 200 400 600 800River flow rate (Q, m 3/s)
Con
cent
ratio
n ([
C],
ng/L
)
4 Fig. 3 Relationships between NP1EC and NP1EO concentrations and Seine River flow at Bougival 5
6
The coefficients of determination (R²), higher than 0.75 and a p value < 0.05, suggest that these relations are 7
robust enough to estimate daily concentrations. The concentrations - flow relationship of 4-NP and NP1EO in the 8
Oise River are based on linear correlations between fluxes (g/d) and river flow rate (Fig. S2). No 9
concentration - flow relationship exists for 4-NP at Bougival and a polynomial interpolation of concentrations 10
between two sampling campaigns has been used. The empirical correlations between concentrations and river 11
flows are not designed to explain all processes involved in the fate of nonylphenolic compound but are intended 12
to simplify building of daily concentrations in the Seine River. 13
Concerning SA-WWTP effluent quality and flow, no seasonal variation is observed. Flow rates (19.3 m3/s) and 14
concentrations are, therefore, considered as constant and equal to their median values (n = 11, 4-NP: 133 ng/L; 15
NP1EC: 842 ng/L and NP1EO: 120 ng/L). 16
2.4.2. Upstream daily concentrations in 2010 17
Based on the relationships between flow rate and compound concentrations, daily concentrations of 4-NP, 18
NP1EC and NP1EO are built at Bougival and downstream the Oise River. These concentrations are compared to 19
the measured ones at Bougival (Fig. 4) and downstream the Oise River (Fig. S3 in the supplementary data). 20
8
4-NP
0
40
80
120
160
200
1 2 3 4 5 6 7 8 9 10 11 12
Con
cent
ratio
n (n
g/L)
NP1EC
0
40
80
120
160
200
240
Con
cent
ratio
n (n
g/L)
NP1EO
0
40
80
120
160
200
Con
cent
ratio
n (n
g/L)
1
Simulated time series 2010
Measured concentrations 2010
1 2 3 4 5 6 7 8 9 10 11 12
1 2 3 4 5 6 7 8 9 10 11 12
4-NP
0
40
80
120
160
200
1 2 3 4 5 6 7 8 9 10 11 12
Con
cent
ratio
n (n
g/L)
NP1EC
0
40
80
120
160
200
240
Con
cent
ratio
n (n
g/L)
NP1EO
0
40
80
120
160
200
Con
cent
ratio
n (n
g/L)
1
Simulated time series 2010
Measured concentrations 2010
Simulated time series 2010
Measured concentrations 2010
1 2 3 4 5 6 7 8 9 10 11 12
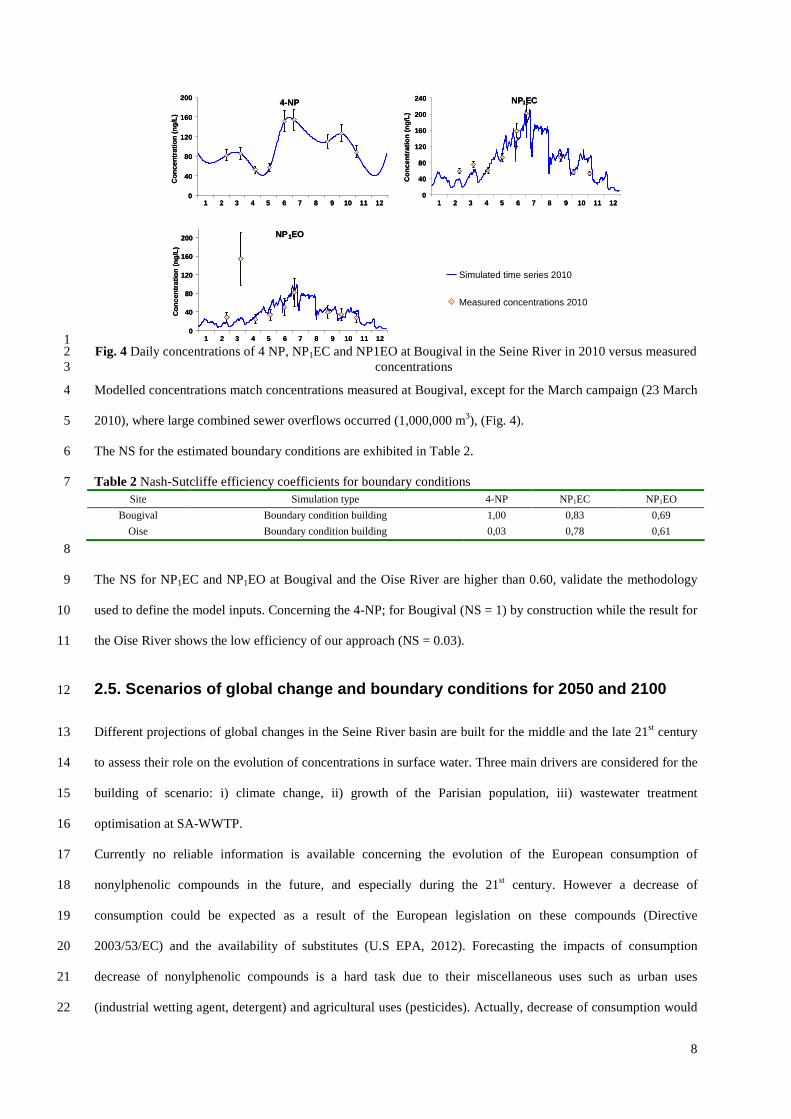
1 2 3 4 5 6 7 8 9 10 11 12 1 Fig. 4 Daily concentrations of 4 NP, NP1EC and NP1EO at Bougival in the Seine River in 2010 versus measured 2
concentrations 3
Modelled concentrations match concentrations measured at Bougival, except for the March campaign (23 March 4
2010), where large combined sewer overflows occurred (1,000,000 m3), (Fig. 4). 5
The NS for the estimated boundary conditions are exhibited in Table 2. 6
Table 2 Nash-Sutcliffe efficiency coefficients for boundary conditions 7 Site Simulation type 4-NP NP1EC NP1EO
Bougival Boundary condition building 1,00 0,83 0,69
Oise Boundary condition building 0,03 0,78 0,61
8
The NS for NP1EC and NP1EO at Bougival and the Oise River are higher than 0.60, validate the methodology 9
used to define the model inputs. Concerning the 4-NP; for Bougival (NS = 1) by construction while the result for 10
the Oise River shows the low efficiency of our approach (NS = 0.03). 11
2.5. Scenarios of global change and boundary condit ions for 2050 and 2100 12
Different projections of global changes in the Seine River basin are built for the middle and the late 21st century 13
to assess their role on the evolution of concentrations in surface water. Three main drivers are considered for the 14
building of scenario: i) climate change, ii) growth of the Parisian population, iii) wastewater treatment 15
optimisation at SA-WWTP. 16
Currently no reliable information is available concerning the evolution of the European consumption of 17
nonylphenolic compounds in the future, and especially during the 21st century. However a decrease of 18
consumption could be expected as a result of the European legislation on these compounds (Directive 19
2003/53/EC) and the availability of substitutes (U.S EPA, 2012). Forecasting the impacts of consumption 20
decrease of nonylphenolic compounds is a hard task due to their miscellaneous uses such as urban uses 21
(industrial wetting agent, detergent) and agricultural uses (pesticides). Actually, decrease of consumption would 22

9
influence concentrations of the upstream part of river basins (commonly used for agriculture) as well as urban 1
discharges. Given the impossibility of currently modelling the impacts of consumption decrease of 2
nonylphenolic compounds on the upstream part of the Seine River basin, their consumption is considered as 3
constant during the 21st century and this study will focus on the impacts of climate change, growth of the 4
Parisian population and wastewater treatment optimisation. 5
Climate projections from CMIP3 (Coupled Model Intercomparison Project Phase 3) over Europe presents 6
important variability (Christensen et al., 2007). In order to limit the number of simulations, two of these climate 7
projections downscaled by a weather typing approach (Boé et al., 2009), which give contrasted results on the 8
Seine River flow rate (Habets et al., 2013), are used. They are the ARP_CONT_A1B (ARP) and 9
MPI_ECHAM5_A1B (MPI) and use the SRES-A1B gas emission scenario for the 21st century (Randall et al., 10
2007). ARP projects important decrease of rainfall by 2050 (-13.7 %) and 2100 (-21.8 %) while MPI projects 11
less pronounced decrease (2050: +0.1 % and 2100: -6.9 %). Both models are in accordance with increases of 12
potential evaporation and air temperature by 2050 and 2100 (supplementary data, Table S2). 13
The impacts of climate change on Seine and Oise River flows are estimated by the hydrogeological model 14
MODCOU in the framework of the REXHYSS project (Habets et al., 2013) using these two downscaled climate 15
projections (ARP and MPI). Thus, two projections of the monthly river flow rates are available for three 16
different periods, the reference decade (2000 - 2010), the middle (2045 - 2055) and the late 21st century 17
(2090 - 2100). The anomalies of river flow rates induced by climate change are calculated for every month by 18
dividing the flow rates predicted in 2045 - 2050 or 2090 - 2100 by those simulated for the reference decade 19
(2000 - 2010). The ratios, thereby calculated, are exhibited in Table 3. 20
Table 3 Impact of the climate change scenario ARP and MPI on the Seine River flow at Bougival and the Oise 21 River flow 22
Seine River Oise River
Reference ARP MPI Reference ARP MPI
2000-2010 2045-2055 2090-2100 2045-2055 2090-2100 2000-2010 2045-2055 2090-2100 2045-2055 2090-2100
Flow (m3/s)
Anomalies ratio
Anomalies ratio
Anomalies ratio
Anomalies ratio
Flow (m3/s)
Anomalies ratio
Anomalies ratio
Anomalies ratio
Anomalies ratio
January 515 1.0 1.0 0.7 0.6 179 0.9 1.0 0.9 0.7
February 487 1.1 1.3 0.8 0.8 175 1.1 1.4 0.9 0.9
March 433 1.3 1.0 1.0 1.1 154 1.2 1.0 1.0 1.0
April 338 0.8 0.7 1.4 1.1 127 0.8 0.7 1.2 1.0
May 239 0.5 0.5 1.2 0.7 88 0.6 0.5 1.0 0.7
June 153 0.6 0.5 1.0 0.8 64 0.6 0.5 1.0 0.7
July 144 0.8 0.6 1.1 0.7 51 0.7 0.6 1.1 0.7
August 126 0.7 0.5 1.1 0.7 39 0.6 0.6 1.0 0.7
September 146 0.6 0.6 0.8 0.6 41 0.6 0.6 0.9 0.7
October 211 0.6 0.6 0.8 0.4 50 0.7 0.6 0.8 0.5
November 314 0.7 0.6 0.9 0.5 81 0.7 0.7 0.9 0.6
December 439 0.8 0.7 1.2 0.9 148 0.7 0.7 1.1 0.9
23

10
According to these anomalies, daily river flows can be estimated for one dry year or one wet year in the decades 1
2045 - 2055 or 2090 - 2100. The present day proxy of a dry year is based on the year 2005 which had a 2
pronounced low-water period (from June to October 2005) and the present day proxy of the wet year is 2001 3
which had a significant river flooding during spring. Thus, for instance; a dry year (wet year) in the middle and 4
late 21st century is estimated to have the daily river flow rate of 2005 (2001) corrected by the monthly ratios 5
calculated (Table 3). The Seine and Oise River flow rates predicted for a dry and a wet year in 2045 - 2050 and 6
2090 - 2100 are shown in Fig. S4 (supplementary data). 7
The estimate of the Parisian population growth by 2050 was provided by the French National Institute of 8
Statistics and Economic Studies (INSEE). By 2050, the Parisian population should reach between 11 millions 9
(low hypothesis) and 15 millions (high hypothesis) of inhabitants with a median hypothesis of 13 millions of 10
inhabitants, which means an increase of 11.7 % compared to 2009 (De Biasi, 2010). No study focuses on the 11
Parisian population growth by 2100; however by linear extrapolation of the median hypothesis for 2050 the 12
population could be estimated about 14.7 millions of inhabitants (+26 % compared with 2009). Assuming that 13
the water consumption per capita remains constant during the 21st century, the growth of the Parisian population 14
leads to an increase of wastewater volume treated daily. Therefore, the SA-WWTP flow rate is estimated at 15
22.6 m3/s in 2050 and 24.3 m3/s in 2100 (2010 flow rate: 19.3 m3/s). 16
Finally, the optimisation of wastewater treatment of SA-WWTP is also taken into account. Currently this 17
WWTP uses activated sludge coupled to a single stage biofiltration. In the upcoming years, the treatment will be 18
optimised by implementing essentially a three stage biofiltration. Consequently, two scenarios for SA-WWTP 19
are simulated: 1) the wastewater treatment remains similar (baseline scenario) and 2) the wastewater treatment is 20
optimised (optimised scenario). For the first scenario, SA-WWTP effluent concentrations in 2010 (4-NP: 21
133 ng/L, NP1EC: 842 ng/L and NP1EO: 120 ng/L) are considered. For the second scenario, concentrations 22
found at the most efficient WWTP in 2010 in Paris Metropolitan Area, where the three stage biofiltration is 23
already implemented, are applied (4-NP: 85 ng/L, NP1EC: 214 ng/L et NP1EO: 74 ng/L) (Cladière et al., 2013b). 24
All scenarios considered, are summarised in the Table 4. They are similar for a dry and a wet year in 2050 and 25
2100.26

11
Table 4 Description of changes considered for one dry or wet year in periods 2050 and 2100 and their 1 corresponding name 2
Year Climate change model Population growth Seine Aval WWTP Name of scenario
2050 ARP_CONT_A1B + 11.7 % Baseline scenario ARP_base_2050
2050 ARP_CONT_A1B + 11.7 % Optimised scenario ARP_opt_2050
2050 MPI_ECHAM5_A1B + 11.7 % Baseline scenario MPI_base_2050
2050 MPI_ECHAM5_A1B + 11.7 % Optimised scenario MPI_opt_2050
2100 ARP_CONT_A1B + 26 % Baseline scenario ARP_base_2100
2100 ARP_CONT_A1B + 26 % Optimised scenario ARP_opt_2100
2100 MPI_ECHAM5_A1B + 26 % Baseline scenario MPI_base_2100
2100 MPI_ECHAM5_A1B + 26 % Optimised scenario MPI_opt_2100
3. Results and discussion 3
3.1. Modelling of daily concentrations at Meulan ov er the reference year 2010 4
Based on the boundary conditions and the biodegradation parameters (July and September), daily concentrations 5
of 4-NP, NP1EC and NP1EO are modelled at Meulan and compared with the monthly sampling campaigns in 6
order to test the robustness of both biodegradation sets (July and September). 7
The simulation using the September biodegradation parameters are displayed in Fig.5 while simulations using 8
the July biodegradation parameters are shown in Fig. S5 (supplementary data). With July parameters, the 9
simulated concentrations are far lower than the measured concentrations, likely due to the high attenuation rate 10
constants (about 1 d-1), and the seasonal cycle of concentrations is not reproduced (Fig. S5). The negative values 11
of NS (Table 5) confirm the inefficiency of these parameters to simulate concentrations at the annual scale and 12
reinforce the hypothesis of the disruption of the biogeochemical status of the Seine River in July 2011 (Cladière 13
et al., 2014). 14
4-NP
0
40
80
120
160
200
Con
cent
ratio
n (n
g/L)
NP1EC
0
40
80
120
160
200
240
280
320
Con
cent
ratio
n (n
g/L)
NP1EO
0
40
80
120
160
200
Con
cent
ratio
n (n
g/L)
Simulated concentrations 2010
Measured concentrations 2010
Simulated concentrations 2010
Measured concentrations 2010
1 2 3 4 5 6 7 8 9 10 11 12 1 2 3 4 5 6 7 8 9 10 11 12
1 2 3 4 5 6 7 8 9 10 11 12
4-NP
0
40
80
120
160
200
Con
cent
ratio
n (n
g/L)
NP1EC
0
40
80
120
160
200
240
280
320
Con
cent
ratio
n (n
g/L)
NP1EO
0
40
80
120
160
200
Con
cent
ratio
n (n
g/L)
Simulated concentrations 2010
Measured concentrations 2010
Simulated concentrations 2010
Measured concentrations 2010
Simulated concentrations 2010
Measured concentrations 2010
Simulated concentrations 2010
Measured concentrations 2010
1 2 3 4 5 6 7 8 9 10 11 12 1 2 3 4 5 6 7 8 9 10 11 12
1 2 3 4 5 6 7 8 9 10 11 12
15 Fig. 5 Simulated concentrations of 4 NP, NP1EC and NP1EO at Meulan using the Prose model (September 16
parameter set) versus measured concentrations 17 18

12
As exhibited in Fig. 5 the simulated concentrations modelled by coupling the boundary conditions and the 1
September biodegradation parameters, are close to the measured concentrations and reproduce the annual 2
variation of concentrations of 4-NP, NP1EC and to a lesser extend NP1EO (previously underlined by Cladière et 3
al., (2013b). 4
Table 5 Nash-Sutcliffe efficiency coefficients for annual modelling at Meulan 5 Site Simulation type 4-NP NP1EC NP1EO
Meulan ProSe modelling (July constants) -0,25 -1,64 -0,44
Meulan ProSe modelling (September constants) 0,55 0,44 0,61
6
The NS determined for this simulation range from 0.44 for NP1EC to 0.61 for NP1EO (Table 5) and suggest that 7
the model, using September biodegradation parameters is efficient to predict annual concentrations in the Seine 8
River at Meulan. 9
Moreover, the 4-NP AA-EQS (300 ng/L) is never exceeded in the Seine River at Meulan downstream of all 10
urban discharges. This observation likely results from the low concentrations in SA-WWTP effluent (133 ng/L) 11
and the biodegradation occurring within the Seine River. 12
This modelling approach has, however, three possibility of improvement for modelling of daily concentrations of 13
nonylphenolic compounds. First, this study focuses on dry weather conditions which represent the most 14
important part of the year but cause punctual underestimations of NP1EO concentrations at Bougival and 15
Meulan. Indeed, combined sewer overflows may constitute significant alkylphenol inputs into the Seine River 16
during wet weather conditions (Cladière et al., 2013b). Second, SA–WWTP effluent is assumed to remain 17
constant all over the year which is not entirely representative since variabilities of concentrations are observed 18
from a campaign to another. Finally, the biodegradation parameters remain constant in the model over the year, 19
while the water temperature variability between summer and winter (± 10°C) may affect the biodegradation 20
constant rates (Manzano et al., 1999). Moreover, the results between July and September 2011 highlight 21
discrepancies according to the biogeochemical status of the Seine River (Cladière et al., 2014). However, despite 22
these deficiencies, the current simulations are satisfying to predict the annual concentrations of 4-NP, NP1EC 23
and NP1EO in the Seine River. Therefore, in the context of the parsimony of our approach, these deficiencies are 24
not determining for modelling the daily concentrations of nonylphenolic compounds in the Seine River and 25
could be neglected. 26

13
3.2. Forecasted concentrations in the middle of 21 st century (2045 - 2055) 1
The 4-NP and NP1EC concentrations were simulated at Meulan for one dry or wet year in the decade 2045 - 2
2055 (Fig. 6). NP1EO concentrations are not discuss because of their significant variability (± 37 %) pointed out 3
in (Cladière et al., 2014). In addition, the increase of air temperature by 2050 (+ 2 K) or 2100 (+ 3 K) (probably 4
lower for water temperature) is not considered since the variability intra-annual in 2010 (± 10 K) seems not 5
influence the modelling of the fate of nonylphenolic compounds in the Seine River. 6
The forecasted concentrations for the middle of the 21st century are compared with the ones of 2010 hereafter. 7
3.2.1. Dry year 8
As underscored by the scenario ARP_base_2050 and MPI_base_2050 during one dry year (Fig. 6), the long low-9
water period has a significant influence on NP1EC concentrations and to a lesser extent on 4-NP concentrations. 10
Without optimisation of Seine Aval WWTP (baseline scenario), the concentrations of NP1EC reach 300 ng/L in 11
July and exceed 250 ng/L from June to December according to the ARP_base_2050 scenario (against 200 ng/L 12
for MPI_base_2050). Although the current concentrations are about 150 ng/L, it may become a concern in the 13
future if the SA-WWTP does not improve its efficiency. 14
4-NP concentrations reach a maximum of 180 ng/L (ARP_base_2050) and are generally below 150 ng/L. 15
Despite climate change and growth of the Parisian population, the AA-EQS of 300 ng/L is not exceeded. 16
However, the high concentration of NP1EC (which can be biodegraded into 4-NP) at Meulan suggests a risk of 17
exceeding the AA-EQS downstream, in the Seine River estuary. 18
The optimisation of SA-WWTP (scenarios ARP_opt_2050 and MPI_opt_2050), could compensate the effect of 19
global change on the Seine River basin by 2050. The Fig. 6 points out significant decreases of NP1EC 20
concentrations during the low-water period. Decreases of concentrations are also noticeable for 4-NP. Finally, 21
thanks to the optimisation of SA-WWTP, NP1EC and 4-NP concentrations during a dry year in the decade 2045 -22
2055 remain lower or close to those simulated for 2010 meaning that the quality of the Seine River may be 23
preserved.24

14
Dry year Wet year a) Projection ARP in 2050
NP1EC
0
50
100
150
200
250
300
350
1/1 1/2 1/3 1/4 1/5 1/6 1/7 1/8 1/9 1/10 1/11 1/12 1/1
Con
cent
ratio
n (n
g/L)
ARP_base_2050ARP_opt_2050Reference_2010
1 2 3 4 5 6 7 8 9 10 11 12
NP1EC
0
50
100
150
200
250
300
350
1/1 1/2 1/3 1/4 1/5 1/6 1/7 1/8 1/9 1/10 1/11 1/12 1/1
Con
cent
ratio
n (n
g/L)
ARP_base_2050ARP_opt_2050Reference_2010
1 2 3 4 5 6 7 8 9 10 11 12
NP1EC
0
50
100
150
200
250
300
350
1/1 1/2 1/3 1/4 1/5 1/6 1/7 1/8 1/9 1/10 1/11 1/12 1/1
Con
cent
ratio
n (n
g/L)
ARP_base_2050ARP_opt_2050Reference_2010
1 2 3 4 5 6 7 8 9 10 11 12
NP1EC
0
50
100
150
200
250
300
350
1/1 1/2 1/3 1/4 1/5 1/6 1/7 1/8 1/9 1/10 1/11 1/12 1/1
Con
cent
ratio
n (n
g/L)
ARP_base_2050ARP_opt_2050Reference_2010
1 2 3 4 5 6 7 8 9 10 11 12
4-NP
0
50
100
150
200
1/1 1/2 1/3 1/4 1/5 1/6 1/7 1/8 1/9 1/10 1/11 1/12 1/1
Con
cent
ratio
n (n
g/L)
ARP_base_2050ARP_opt_2050Reference_2010
1 2 3 4 5 6 7 8 9 10 11 12
4-NP
0
50
100
150
200
1/1 1/2 1/3 1/4 1/5 1/6 1/7 1/8 1/9 1/10 1/11 1/12 1/1
Con
cent
ratio
n (n
g/L)
ARP_base_2050ARP_opt_2050Reference_2010
1 2 3 4 5 6 7 8 9 10 11 12
4-NP
0
50
100
150
200
1/1 1/2 1/3 1/4 1/5 1/6 1/7 1/8 1/9 1/10 1/11 1/12 1/1
Con
cent
ratio
n (n
g/L)
ARP_base_2050ARP_opt_2050reference_2010
1 2 3 4 5 6 7 8 9 10 11 12
4-NP
0
50
100
150
200
1/1 1/2 1/3 1/4 1/5 1/6 1/7 1/8 1/9 1/10 1/11 1/12 1/1
Con
cent
ratio
n (n
g/L)
ARP_base_2050ARP_opt_2050reference_2010
1 2 3 4 5 6 7 8 9 10 11 12
b) Projection MPI in 2050
NP1EC
0
50
100
150
200
250
300
350
1/1 1/2 1/3 1/4 1/5 1/6 1/7 1/8 1/9 1/10 1/11 1/12 1/1
Con
cent
ratio
n (n
g/L)
MPI_base_2050MPI_opt_2050Reference_2010
1 2 3 4 5 6 7 8 9 10 11 12
NP1EC
0
50
100
150
200
250
300
350
1/1 1/2 1/3 1/4 1/5 1/6 1/7 1/8 1/9 1/10 1/11 1/12 1/1
Con
cent
ratio
n (n
g/L)
MPI_base_2050MPI_opt_2050Reference_2010
1 2 3 4 5 6 7 8 9 10 11 12
NP1EC
0
50
100
150
200
250
300
350
1/1 1/2 1/3 1/4 1/5 1/6 1/7 1/8 1/9 1/10 1/11 1/12 1/1
Con
cent
ratio
n (n
g/L)
MPI_base_2050MPI_opt_2050Reference_2010
1 2 3 4 5 6 7 8 9 10 11 12
NP1EC
0
50
100
150
200
250
300
350
1/1 1/2 1/3 1/4 1/5 1/6 1/7 1/8 1/9 1/10 1/11 1/12 1/1
Con
cent
ratio
n (n
g/L)
MPI_base_2050MPI_opt_2050Reference_2010
1 2 3 4 5 6 7 8 9 10 11 12
4-NP
0
50
100
150
200
1/1 1/2 1/3 1/4 1/5 1/6 1/7 1/8 1/9 1/10 1/11 1/12 1/1
Con
cent
ratio
n (n
g/L)
MPI_base_2050MPI_opt_2050Reference_2010
1 2 3 4 5 6 7 8 9 10 11 12
4-NP
0
50
100
150
200
1/1 1/2 1/3 1/4 1/5 1/6 1/7 1/8 1/9 1/10 1/11 1/12 1/1
Con
cent
ratio
n (n
g/L)
MPI_base_2050MPI_opt_2050Reference_2010
1 2 3 4 5 6 7 8 9 10 11 12
4-NP
0
50
100
150
200
1/1 1/2 1/3 1/4 1/5 1/6 1/7 1/8 1/9 1/10 1/11 1/12 1/1
Con
cent
ratio
n (n
g/L)
MPI_base_2050MPI_opt_2050Reference_2010
1 2 3 4 5 6 7 8 9 10 11 12
4-NP
0
50
100
150
200
1/1 1/2 1/3 1/4 1/5 1/6 1/7 1/8 1/9 1/10 1/11 1/12 1/1
Con
cent
ratio
n (n
g/L)
MPI_base_2050MPI_opt_2050Reference_2010
1 2 3 4 5 6 7 8 9 10 11 12
Fig. 6 Forecasted concentrations of 4 NP and NP1EC for one dry and wet year in the decade 2045 - 2055 1 2
3.2.2. Wet year 3
Fig. 6 shows that during one wet year in the decade 2045 - 2055 the concentrations of NP1EC and 4-NP are not 4
higher than concentrations simulated for 2010, even without optimisation of SA-WWTP. 5
Both ARP and MPI scenarios predict similar drops of 4-NP and NP1EC concentrations during Seine River 6
flooding (from March to May). The decreases of concentrations are more significant for the MPI projection 7

15
(NP1EC < 20 ng/L from 18th March to 6th May) than for the ARP projection (NP1EC < 20 ng/L from 15th March 1
to 1st April). However, the wet weather urban sources, which may play a significant role during a wet year, are 2
not taken into account in this forecast. The concentrations of nonylphenolic compounds predicted during the 3
river flooding are, therefore, likely underestimated. This has to be confirmed or contradicted by further studies. 4
At last, the optimisation of SA-WWTP has a smaller influence during a wet year than a dry year (Fig.6), mainly 5
explained by effluent dilution factor during a wet year (about 37) against a dry year (about 11). 6
3.3. Forecasted concentrations in the late 21 st century (2090 - 2100) 7
4-NP and NP1EC concentrations at Meulan are simulated for one dry or wet year in the decade 2090 - 2100 8
(Fig. 7). 9
3.3.1. Dry year 10
The observations are similar to 2050 but the trends are reinforced especially at the end of autumn (November). 11
Indeed, without optimisation of SA-WWTP, the ARP_base_2100 scenario projects that the NP1EC 12
concentrations may reach 350 ng/L in July and exceed 250 ng/L during 7 months. For MPI_base_2100 scenario, 13
the highest concentration (350 ng/L) is reached in November and the concentrations exceed 300 ng/L from 14
October to December. To a lesser extent, similar observations are noticeable for 4-NP concentrations. Despite the 15
long low-water period forecasted for a dry year by 2100, no exceedance of the current AA-EQS is pointed out 16
for both baseline scenarios. However, like for 2050, the NP1EC concentration is of concern for downstream 17
stations due to biodegradation processes. 18
As previously observed for 2050, the optimisation of SA-WWTP may counterbalance the impacts of climate 19
change coupled to the growth of the Parisian population from January to October (ARP and MPI projections). 20
During this period the concentrations of 4-NP and NP1EC are close to those simulated for 2010. Nevertheless, 21
despite the significant decrease of 4-NP and NP1EC concentrations due to SA-WTTP optimisation, the latter 22
may exceed concentrations of 2010 from October to December. These differences are likely due to the long low-23
water period (June to December). 24
16
Dry year Wet year a) scenario ARP in 2100
NP1EC
0
50
100
150
200
250
300
350
400
1/1 1/2 1/3 1/4 1/5 1/6 1/7 1/8 1/9 1/10 1/11 1/12 1/1
Con
cent
ratio
n (n
g/L)
ARP_base_2100ARP_opt_2100Reference_2010
1 2 3 4 5 6 7 8 9 10 11 12
NP1EC
0
50
100
150
200
250
300
350
400
1/1 1/2 1/3 1/4 1/5 1/6 1/7 1/8 1/9 1/10 1/11 1/12 1/1
Con
cent
ratio
n (n
g/L)
ARP_base_2100ARP_opt_2100Reference_2010
1 2 3 4 5 6 7 8 9 10 11 12
NP1EC
0
50
100
150
200
250
300
350
400
1/1 1/2 1/3 1/4 1/5 1/6 1/7 1/8 1/9 1/10 1/11 1/12 1/1
Con
cent
ratio
n (n
g/L)
ARP_base_2100ARP_opt_2100Reference_2010
1 2 3 4 5 6 7 8 9 10 11 12
NP1EC
0
50
100
150
200
250
300
350
400
1/1 1/2 1/3 1/4 1/5 1/6 1/7 1/8 1/9 1/10 1/11 1/12 1/1
Con
cent
ratio
n (n
g/L)
ARP_base_2100ARP_opt_2100Reference_2010
1 2 3 4 5 6 7 8 9 10 11 12
4-NP
0
50
100
150
200
250
1/1 1/2 1/3 1/4 1/5 1/6 1/7 1/8 1/9 1/10 1/11 1/12 1/1
Con
cent
ratio
n (n
g/L)
ARP_base_2100ARP_opt_2100Reference_2010
1 2 3 4 5 6 7 8 9 10 11 12
4-NP
0
50
100
150
200
250
1/1 1/2 1/3 1/4 1/5 1/6 1/7 1/8 1/9 1/10 1/11 1/12 1/1
Con
cent
ratio
n (n
g/L)
ARP_base_2100ARP_opt_2100Reference_2010
1 2 3 4 5 6 7 8 9 10 11 12
4-NP
0
50
100
150
200
250
1/1 1/2 1/3 1/4 1/5 1/6 1/7 1/8 1/9 1/10 1/11 1/12 1/1
Con
cent
ratio
n (n
g/L)
ARP_base_2100ARP_opt_2100Reference_2010
1 2 3 4 5 6 7 8 9 10 11 12
4-NP
0
50
100
150
200
250
1/1 1/2 1/3 1/4 1/5 1/6 1/7 1/8 1/9 1/10 1/11 1/12 1/1
Con
cent
ratio
n (n
g/L)
ARP_base_2100ARP_opt_2100Reference_2010
1 2 3 4 5 6 7 8 9 10 11 12
b) scenario MPI in 2100
NP1EC
0
50
100
150
200
250
300
350
400
1/1 1/2 1/3 1/4 1/5 1/6 1/7 1/8 1/9 1/10 1/11 1/12 1/1
Con
cent
ratio
n (n
g/L)
MPI_base_2100MPI_opt_2100Reference_2010
1 2 3 4 5 6 7 8 9 10 11 12
NP1EC
0
50
100
150
200
250
300
350
400
1/1 1/2 1/3 1/4 1/5 1/6 1/7 1/8 1/9 1/10 1/11 1/12 1/1
Con
cent
ratio
n (n
g/L)
MPI_base_2100MPI_opt_2100Reference_2010
1 2 3 4 5 6 7 8 9 10 11 12
NP1EC
0
50
100
150
200
250
300
350
400
1/1 1/2 1/3 1/4 1/5 1/6 1/7 1/8 1/9 1/10 1/11 1/12 1/1
Con
cent
ratio
n (n
g/L)
MPI_base_2100MPI_opt_2100Reference_2010
1 2 3 4 5 6 7 8 9 10 11 12
NP1EC
0
50
100
150
200
250
300
350
400
1/1 1/2 1/3 1/4 1/5 1/6 1/7 1/8 1/9 1/10 1/11 1/12 1/1
Con
cent
ratio
n (n
g/L)
MPI_base_2100MPI_opt_2100Reference_2010
1 2 3 4 5 6 7 8 9 10 11 12
4-NP
0
50
100
150
200
250
1/1 1/2 1/3 1/4 1/5 1/6 1/7 1/8 1/9 1/10 1/11 1/12 1/1
Con
cent
ratio
n (n
g/L)
MPI_base_2100MPI_opt_2100Reference_2010
1 2 3 4 5 6 7 8 9 10 11 12
4-NP
0
50
100
150
200
250
1/1 1/2 1/3 1/4 1/5 1/6 1/7 1/8 1/9 1/10 1/11 1/12 1/1
Con
cent
ratio
n (n
g/L)
MPI_base_2100MPI_opt_2100Reference_2010
1 2 3 4 5 6 7 8 9 10 11 12
4-NP
0
50
100
150
200
250
1/1 1/2 1/3 1/4 1/5 1/6 1/7 1/8 1/9 1/10 1/11 1/12 1/1
Con
cent
ratio
n (n
g/L)
MPI_base_2100MPI_opt_2100Reference_2010
1 2 3 4 5 6 7 8 9 10 11 12
4-NP
0
50
100
150
200
250
1/1 1/2 1/3 1/4 1/5 1/6 1/7 1/8 1/9 1/10 1/11 1/12 1/1
Con
cent
ratio
n (n
g/L)
MPI_base_2100MPI_opt_2100Reference_2010
1 2 3 4 5 6 7 8 9 10 11 12
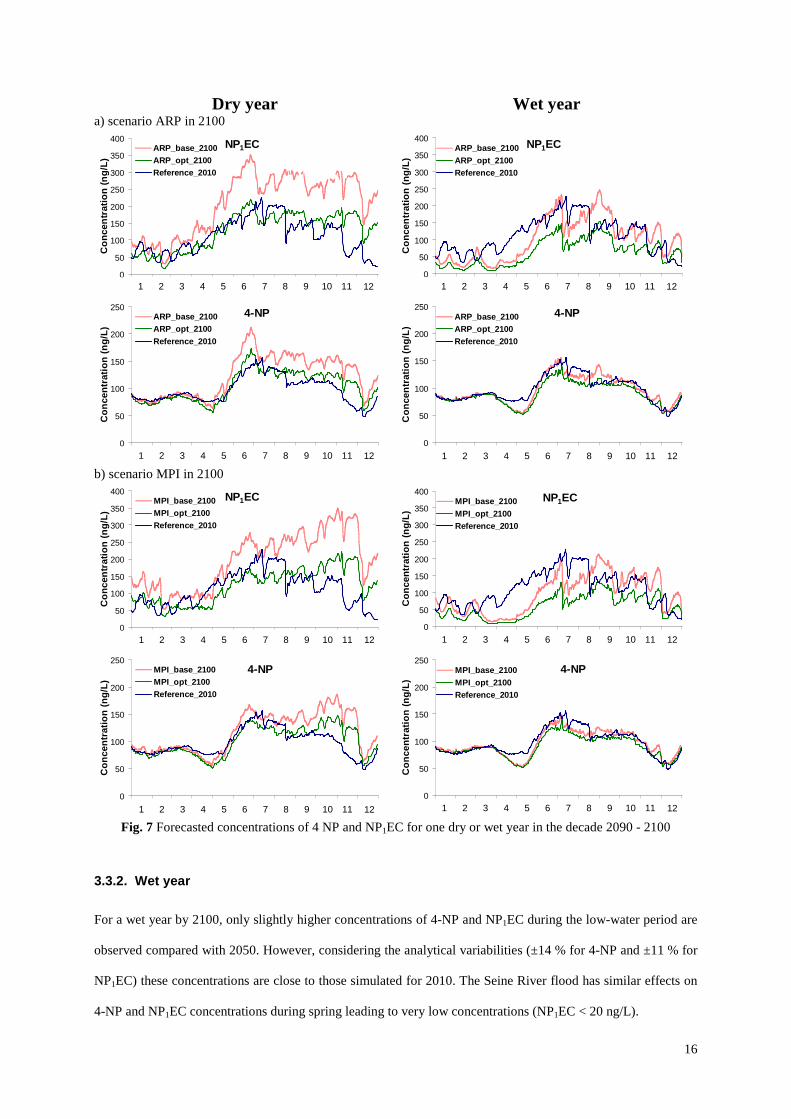
Fig. 7 Forecasted concentrations of 4 NP and NP1EC for one dry or wet year in the decade 2090 - 2100
3.3.2. Wet year
For a wet year by 2100, only slightly higher concentrations of 4-NP and NP1EC during the low-water period are
observed compared with 2050. However, considering the analytical variabilities (±14 % for 4-NP and ±11 % for
NP1EC) these concentrations are close to those simulated for 2010. The Seine River flood has similar effects on
4-NP and NP1EC concentrations during spring leading to very low concentrations (NP1EC < 20 ng/L).

17
4. Conclusions
A global project of modelling the fate of nonylphenolic compounds in river water was launched in 2010 with the
objectives to determine in-situ attenuation rate constants and to apply them to simulate their annual behaviour for
present and upcoming years (Cladière et al., (2014) and this paper).
In pursuit of the first part paper, this study aimed at testing the biodegradation parameters and at using them to
forecast the fate of nonylphenolic compounds in the Seine River in the middle and the late 21st century.
In a first step, the modelling of annual concentrations of 4-NP, NP1EC and NP1EO at Meulan in the Seine River
reveals that the biodegradation parameters calibrated in September 2011 have been validated for the year 2010
and can be used to forecast the fate of nonylphenolic compounds in the middle and the late 21st century.
For the first time, this study provides relevant results on the fate of micropollutants in river water with regard to
global change. In this study, climate change, the growth of the Parisian population and the optimisation of Seine
Aval wastewater treatment plant for the middle (2050) and the late (2100) 21st century were considered.
The first forecasts by 2050 and 2100 underscore the key impact of low-water periods on NP1EC and 4-NP
concentrations downstream of Paris City. These longer and more pronounced low water periods (according to
the climate change projections ARP_CONT_A1B and MPI_ ECHAM5_A1B) combined with the growth of the
Parisian population, could lead to significant concentration increases in autumn. Wastewater treatment
optimisation (currently in progress for SA-WWTP) appears to be an efficient solution to limit the impacts of
population growth and low-water periods by 2050 and to a lesser extent by 2100.
Although the assessed changes are the most important expected on the Seine River basin, the parsimony of our
approach leads to disregard others significant factors such as evolution of nonylphenolic compound consumption
or the intra-annual variability of concentrations because of the scarcity of reliable information. In addition, all
annual simulations are performed under dry weather conditions and do not considered the wet weather urban
sources. Thus, the concentrations forecasted for the 21st century could be punctually underestimated since
combined sewer overflows and urban runoff are significant sources of nonylphenolic compounds in the Seine
River during storm events, as previously demonstrated for 2010 by Cladière et al., (2013b).
Ultimately, the two parts of this study highlight that the coupling between analytical chemistry, biogeochemical
modelling is, despite its limits, a key tool to understand and forecast the fate of nonylphenolic compounds in
surface waters and the influence of global change. This study gives the first guidelines and considerations for
forecasting the fate of pollutants in surface water during the 21st century. Therefore, this kind of approach could
be applied to other pollutants such as priority pollutants (European Commission, 2000) or emerging pollutants.

18
Moreover, this study could support the implementation of the Water Framework Directive and its daughter
Directives in surface water in the upcoming years and decades.
5. Acknowledgment
The authors want to thank Science of the Total Environment for the permission to archive the post-print version
of the manuscript.
6. References
Ahel M, Giger W, Koch M. Behaviour of alkylphenol polyethoxylate surfactants in the aquatic environment--I. Occurrence and transformation in sewage treatment. Water Research 1994; 28: 1131-1142.
Andersen HE, Kronvang B, Larsen SE, Hoffmann CC, Jensen TS, Rasmussen EK. Climate-change impacts on hydrology and nutrients in a Danish lowland river basin. Science of The Total Environment 2006; 365: 223-237.
Bergé A, Cladière M, Gasperi J, Coursimault A, Tassin B, Moilleron R. Meta-analysis of environmental contamination by alkylphenols. Environmental Science and Pollution Research 2012; 19: 3798-3819.
Boé J, Terray L, Martin E, Habets F. Projected changes in components of the hydrological cycle in French river basins during the 21st century. Water Resources Research 2009; 45.
Christensen JH, B. , Hewitson A, Busuioc A, Chen X, Gao I, Held R, et al. Regional Climate Projections. In: Climate Change 2007: The Physical Science Basis. Contribution of Working Group I to the Fourth Assessment Report of the Intergovernmental Panel on Climate Change. Solomon S, Qin D, Manning M, Chen Z, Marquis M, Averyt KB, et al. Cambridge University Pres, Cambridge, United Kingdom and New York, NY, USA., 2007.
Cladière M, Bonhomme C, Vilmin L, Gasperi J, Flipo N, Tassin B. Modelling the fate of nonylphenolic compounds in the Seine River - part 1: determination of in-situ attenuation rate constants. Science of The Total Environment 2014; DOI: 10.1016/j.scitotenv.2013.09.028.
Cladière M, Gasperi J, Lorgeoux C, Bonhomme C, Rocher V, Tassin B. Alkylphenolic compounds and bisphenol A contamination within a heavily urbanized area: case study of Paris. Environmental Science and Pollution Research 2013b; 20: 2973 - 2983.
De Biasi K. Parisian population in 2040: the migration limits the aging. INSEE : Île-de-France à la page 2010; 310.
European Commission. Directive 2000/60/EC of the European Parliament and of the Council of 23 October 2000 establishing a framework for Community action in the field of water policy, Official journal of the European Communities L 327 n°43, 2000, pp. 1-72.
European Commission. Directive 2003/53/EC of the European Parliament and of the Council of 18 June 2003 amending for the 26th time Council Directive 76/769/EEC relating to restrictions on the marketing and use of certain dangerous substances and preparations (nonylphenol, nonylphenol ethoxylate and cement). Official Journal of the European Union L 178 n°46, 2003, pp. 25-27.
European Commission. Directive 2008/105/EC of the European Parliament and of the Council of 16 December 2008 on environmental quality standards in the field of water policy, amending and subsequently repealing Council Directives 82/176/EEC, 83/513/EEC, 84/156/EEC, 84/491/EEC, 86/280/EEC and amending Directive 2000/60/EC of the European Parliament and of the Council. Official Journal of the European Union L 348 n°51, 2008, pp. 84-97.
Even S, Poulin M, Gamier J, Billen G, Servais P, Chesterikoff A, et al. River ecosystem modelling: Application
of the PROSE model to the Seine river (France). Hydrobiologia 1998; 373-374: 27-45. Flipo N, Even S, Poulin M, Tusseau-Vuillemin MH, Ameziane T, Dauta A. Biogeochemical modelling at the
river scale: Plankton and periphyton dynamics: Grand Morin case study, France. Ecological Modelling 2004; 176: 333-347.
Flipo N, Rabouille C, Poulin M, Even S, Tusseau-Vuillemin MH, Lalande M. Primary production in headwater streams of the Seine basin: The Grand Morin river case study. Science of The Total Environment 2007; 375: 98-109.

19
Giger W, Gabriel FLP, Jonkers N, Wettstein FE, Kohler H-PE. Environmental fate of phenolic endocrine disruptors: field and laboratory studies. Philosophical Transactions of the Royal Society A: Mathematical, Physical and Engineering Sciences 2009; 367: 3941-3963.
Habets F, Boé J, Déqué M, Ducharne A, Gascoin S, Hachour A, et al. Impact of climate change on surface water and groundwater of two basins in Northern France: analysis of the uncertainties associated with climate and hydrological models, emission scenarios and downscaling methods. Climatic change 2013; submitted.
Hadjikakou M, Whitehead PG, Jin L, Futter M, Hadjinicolaou P, Shahgedanova M. Modelling nitrogen in the Yeilirmak River catchment in Northern Turkey: Impacts of future climate and environmental change and implications for nutrient management. Science of The Total Environment 2011; 409: 2404-2418.
John DM, White GF. Mechanism for Biotransformation of Nonylphenol polyethoxylates to xenoestrogens in Pseudomonas putida. Journal of Bacteriology 1998; 180: 4332-4338.
Jonkers N, Knepper TP, De Voogt P. Aerobic biodegradation studies of nonylphenol ethoxylates in river water using liquid chromatography-electrospray tandem mass spectrometry. Environmental Science & Technology 2001; 35: 335-340.
Jugan ML, Oziol L, Bimbot M, Huteau V, Tamisier-Karolak S, Blondeau JP, et al. In vitro assessment of thyroid and estrogenic endocrine disruptors in wastewater treatment plants, rivers and drinking water supplies in the greater Paris area (France). Science of The Total Environment 2009; 407: 3579-3587.
Manzano MA, Perales JA, Sales D, Quiroga JM. The effect of temperature on the biodegradation of a nonylphenol polyethoxylate in river water. Water Research 1999; 33: 2593-2600.
Nash JE, Sutcliffe JV. River flow forecasting through conceptual models part I : A discussion of principles. Journal of Hydrology 1970; 10: 282-290.
Randall DA, Wood RA, Bony S, Colman R, Fichefet T, Fyfe J, et al. Climate Models and Their Evaluation. In: Climate Change 2007: The Physical Science Basis. Contribution of Working Group I to the Fourth Assessment Report of the Intergovernmental Panel on Climate Change. Solomon S, Qin D, Manning M, Chen Z, Marquis M, Averyt KB, et al. Cambridge University Pres, Cambridge, United Kingdom and New York, NY, USA., 2007.
Soto AM, Justicia H, Wray JW, Sonnenschein C. Para-nonyl-phenol - An estrogenic xenobiotic released from modified polystyrene. Environmental Health Perspectives 1991; 92: 167-173.
U.S. EPA. DfE Alternatives Assessment for Nonylphenol Ethoxylates. May 2012. U.S. EPA, 2012, pp. 27. Vethaak AD, Lahr J, Schrap SM, Belfroid AC, Rijs GBJ, Gerritsen A, et al. An integrated assessment of
estrogenic contamination and biological effects in the aquatic environment of The Netherlands. Chemosphere 2005; 59: 511-524.
Wilson CO, Weng Q. Simulating the impacts of future land use and climate changes on surface water quality in the Des Plaines River watershed, Chicago Metropolitan Statistical Area, Illinois. Science of The Total Environment 2011; 409: 4387-4405.
Ying G-G, Williams B, Kookana R. Environmental fate of alkylphenols and alkylphenol ethoxylates--a review. Environment International 2002; 28: 215-226.