Embed Size (px)
DESCRIPTION
Modelling the global atmospheric transport and deposition of radionuclides from the Fukushima Dai-ichi nuclear accident
Citation preview
Atmos. Chem. Phys., 13, 1425–1438, 2013www.atmos-chem-phys.net/13/1425/2013/doi:10.5194/acp-13-1425-2013© Author(s) 2013. CC Attribution 3.0 License.
EGU Journal Logos (RGB)
Advances in Geosciences
Open A
ccess
Natural Hazards and Earth System
Sciences
Open A
ccess
Annales Geophysicae
Open A
ccessNonlinear Processes
in Geophysics
Open A
ccess
Atmospheric Chemistry
and PhysicsO
pen Access
Atmospheric Chemistry
and Physics
Open A
ccess
Discussions
Atmospheric Measurement
Techniques
Open A
ccess
Atmospheric Measurement
Techniques
Open A
ccess
Discussions
Biogeosciences
Open A
ccess
Open A
ccess
BiogeosciencesDiscussions
Climate of the Past
Open A
ccess
Open A
ccess
Climate of the Past
Discussions
Earth System Dynamics
Open A
ccess
Open A
ccess
Earth System Dynamics
Discussions
GeoscientificInstrumentation
Methods andData Systems
Open A
ccess
GeoscientificInstrumentation
Methods andData Systems
Open A
ccess
Discussions
GeoscientificModel Development
Open A
ccess
Open A
ccess
GeoscientificModel Development
Discussions
Hydrology and Earth System
Sciences
Open A
ccess
Hydrology and Earth System
Sciences
Open A
ccess
Discussions
Ocean Science
Open A
ccess
Open A
ccess
Ocean ScienceDiscussions
Solid Earth
Open A
ccess
Open A
ccess
Solid EarthDiscussions
The Cryosphere
Open A
ccess
Open A
ccess
The CryosphereDiscussions
Natural Hazards and Earth System
Sciences
Open A
ccess
Discussions
Modelling the global atmospheric transport and deposition ofradionuclides from the Fukushima Dai-ichi nuclear accident
T. Christoudias1 and J. Lelieveld1,2
1The Cyprus Institute, Nicosia, Cyprus2Max Planck Institute of Chemistry, Mainz, Germany
Correspondence to:T. Christoudias ([email protected])
Received: 24 August 2012 – Published in Atmos. Chem. Phys. Discuss.: 19 September 2012Revised: 7 January 2013 – Accepted: 22 January 2013 – Published: 5 February 2013
Abstract. We modeled the global atmospheric dispersionand deposition of radionuclides released from the FukushimaDai-ichi nuclear power plant accident. The EMAC atmo-spheric chemistry – general circulation model was used, withcirculation dynamics nudged towards ERA-Interim reanaly-sis data. We applied a resolution of approximately 0.5 de-grees in latitude and longitude (T255). The model accountsfor emissions and transport of the radioactive isotopes131Iand137Cs, and removal processes through precipitation, par-ticle sedimentation and dry deposition. In addition, we sim-ulated the release of133Xe, a noble gas that can be regardedas a passive transport tracer of contaminated air. The sourceterms are based onChino et al.(2011) andStohl et al.(2012);especially the emission estimates of131I are associated witha high degree of uncertainty. The calculated concentrationshave been compared to station observations by the Com-prehensive Nuclear-Test-Ban Treaty Organisation (CTBTO).We calculated that about 80 % of the radioactivity fromFukushima which was released to the atmosphere depositedinto the Pacific Ocean. In Japan a large inhabited land areawas contaminated by more than 40 kBqm−2. We also esti-mated the inhalation and 50-year dose by137Cs, 134Cs and131I to which the people in Japan are exposed.
1 Introduction
On the 11 March 2011 an earthquake occurred off the Pa-cific coast of Tohoku, which triggered a powerful tsunami.The tsunami damaged the Fukushima Dai-ichi nuclear powerplant complex, followed by a series of major accidents, giv-ing rise to three INES (International Nuclear Event Scale)
level 7 events. This caused the release of large amounts ofradionuclides to the atmosphere (Butler, 2011; Chino et al.,2011; Stohl et al., 2012). In particular the isotopes of io-dine and caesium adversely affect human health through thelarge-scale contamination of air, water, soils and agricul-tural products (Anspaugh et al., 1988). Although both ra-dionuclides are released as gases, caesium has a low volatil-ity and partitions into ambient aerosol particles, whereasin our model iodine largely remains in the gas phase. Re-moval of these compounds from the atmosphere is governedby dry and wet deposition processes. Several initial stud-ies of the atmospheric behaviour and budgets of radioactivespecies, notably131I and137Cs, were conducted using chem-istry transport models. For example, the Austrian WeatherService (ZAMG) performed a daily forecast of the disper-sion of radioactivity in the atmosphere.Morino et al.(2011)simulated the transport and deposition of the radionuclidesover Japan using an off-line regional model. A numericalsimulation for the long-range transport from the plant to theUS and even Europe with a global aerosol transport modelwas conducted byTakemura et al.(2011). Ten Hoeve and Ja-cobson(2012) quantified worldwide health effects using theGATOR-GCMOM global model.
The objective of the present study is to model the globalatmospheric dispersion of radionuclides from the Fukushimaaccident and compute the deposition patterns using an at-mospheric chemistry-general circulation model, initializedby estimated source terms. The emission strengths havebeen determined through inverse modelling byStohl et al.(2012). The temporal emission profiles of the radioactive iso-topes133Xe and137Cs were estimated at three reference re-lease heights using the Lagrangian transport model FLEX-
Published by Copernicus Publications on behalf of the European Geosciences Union.
1426 T. Christoudias and J. Lelieveld: Global atmospheric modeling of Fukushima radioactivity
PART (Stohl et al., 1998), driven by operational meteoro-logical data from the European Centre for Medium-RangeWeather Forecasts (ECMWF) and the National Center forEnvironmental Prediction (NCEP) Global Forecast System(GFS) analyses, and constrained by a large number of avail-able concentration and deposition data from Japan, NorthAmerica and Europe.
Furthermore, we incorporated the preliminary estimates ofrelease amounts of131I by Chino et al.(2011). A reverseestimation of the source term was conducted by couplingJapanese Environmental monitoring data with regional at-mospheric dispersion simulations. Emission inventories arefurther discussed in Sect.2.1.
We briefly describe the model in Sect.2, including theemissions of radionuclides and the representation of removalmechanisms. The analysis of our results regarding the globaldeposition (Sect.3.2) and a comparison of surface concen-trations to station measurements (Sect.3.1) are discussed inSect.3. Estimates of doses from the inhalation and grounddeposition of radionuclides are given in Sect.3.3. A sum-mary and conclusions are presented in Sect.4.
2 Model simulation
The global ECHAM5/MESSy Atmospheric Chemistry(EMAC) general circulation model includes sub-models de-scribing tropospheric and middle atmospheric processes andtheir interactions with oceans, land and vegetation, andtrace species emissions of natural and anthropogenic origin(Jockel et al., 2005). It uses the first version of the ModularEarth Submodel System (MESSy1) to link multi-institutionalcomputer codes. The core atmospheric model is the 5th gen-eration European Centre Hamburg general circulation model(ECHAM5; Roeckner et al., 2003, 2006).
For the present study we applied EMAC version 1.9 (basedon ECHAM5 version 5.3) at the T255L31 resolution, i.e.,with a spherical spectral truncation of T255 (correspondingto a quadratic Gaussian grid of approximately 0.5 by 0.5 de-grees in latitude and longitude) with 31 vertical hybrid pres-sure levels up to 10 hPa, a time step of two minutes and three-hourly output. To test the effects of model resolution on thesimulation we repeated the study on the reduced T106L31resolution (corresponding to a quadratic Gaussian grid ofabout 1.1 by 1.1 degrees). Our simulation spans the periodof 1 March–31 May 2011.
The large-scale component of the model circulation dy-namics was nudged by applying a Newtonian relaxation(Jeuken et al., 1996) towards the European Centre forMedium-range Weather Forecasts (ECMWF) ERA-Interimreanalysis data (Simmons et al., 2007), produced at T255 res-olution, to realistically represent the tropospheric meteorol-ogy of the simulated period. The nudged variables are vortic-ity, divergence, temperature and surface pressure (Lelieveldet al., 2007), whereas the hydrological cycle is computed
freely and consistently according to the model dynamics.Therefore, the precipitation field is not necessarily identicalwith that of the ERA-Interim dataset, which is relevant forthe transport and wet deposition of soluble tracers, notably137Cs. In Fig.1 we present a comparison between the timeintegrated precipitation from ERA-Interim and our modelover the simulated period from 11 March onward. It showsthat precipitation patterns downwind of Japan are very simi-lar, whereas in the tropics (e.g., the intertropical convergencezone) differences are more evident. We do not expect thatthis significantly influences our results. Both ERA-Interimand EMAC results indicate that during the first week afterthe accident (11–18 March 2011; Fig.1) some precipitationoccurred in the northern part of the main island of Japan,mainly along the east coast (37◦–40◦ N).
The applied model setup comprises the submodelsRAD4ALL for radiation and atmospheric heating processes,CLOUD for cloud formation and microphysical processes in-cluding precipitation, and CONVECT for the vertical trans-ports of trace species associated with convection. The DRY-DEP (Kerkweg et al., 2006) and SCAV (Tost et al., 2006,2007) submodels were used to simulate aerosol dry and wetdeposition processes, respectively. The SEDI submodel wasused to simulate particle sedimentation, of which the resultswill be presented below as part of the simulated dry deposi-tion.
We focus on the radionuclides that were emitted as gasesand partly attached to ambient aerosol particles: the semi-volatile isotopes of iodine131I (with a half-life of 8 days)and caesium137Cs (with a half-life of∼30 years). We alsomodeled the emission of the isotope133Xe (with a half-lifeof 5.25 days). Since xenon is an unreactive noble gas and isnot removed by deposition processes, it serves as a passivetracer of atmospheric transport.137Cs is modeled as a water-soluble aerosol with a standard lognormal distribution withmean radius 0.25 µm and a Henry’s law coefficient equal to1.0 molL−1atm−1 and a density of 1000.0 kgm−3. Due tothe long decay lifetime of137Cs compared to the simulationperiod and the short timescales of the atmospheric removalprocesses considered, its radioactive decay is not taken intoaccount in the simulation.
2.1 Emissions
We used the temporal emission patterns for the radioactiveisotopes133Xe and137Cs for March and April 2011, esti-mated based on an inverse modelling method, applying thetransport model FLEXPART, byStohl et al.(2012). Thefirst guess for the a priori emissions was based on fuelevents and documented accident events. Measurement dataof both atmospheric activity concentrations and bulk deposi-tion from several stations in Japan, North America and otherregions were used to provide subsequently improved esti-mates by inverse modeling. Tracers are emitted within threeatmospheric layers over the Fukushima Dai-ichi power plant
Atmos. Chem. Phys., 13, 1425–1438, 2013 www.atmos-chem-phys.net/13/1425/2013/

T. Christoudias and J. Lelieveld: Global atmospheric modeling of Fukushima radioactivity 1427T.Christoudias et al.: Global atmospheric modeling of Fukushima radioactivity 3
Fig. 1. Time integrated precipitation (in m) patterns over the period 11 March – 31 May 2011 computed with the EMAC model (upperright) compared to the ERA-Interim data (upper left). The lower panels show the precipitation during the first week after the accident (11–18March 2011).
only deposition, based on Japanese and non-Japanese data,the sensitivity scaling factors of the a posteriori total emis-sions are reported to be 55%, 59% and 150% respectively.The total amount of 137Cs emitted is 36.7 (20.1–53.1) PBq,and of 133Xe 15.3 (12.2–18.3) EBq (Stohl et al., 2012). Al-though we did not explicitly include the emissions of 134Cs,in Sects. 3.2 and 3.3 we will discuss the deposition of thiscompound by assuming a scaling factor to 137Cs suggestedby Ten Hoeve and Jacobson (2012).
We also incorporated in our model preliminary emissionestimates of the released amounts of 131I (in total 150 PBq)and 137Cs (in total 13 PBq) by Chino et al. (2011), basedon the reverse estimation of the source term by couplingJapanese environmental monitoring data with regional atmo-spheric dispersion simulations. The System for Predictionof Environmental Emergency Dose Information (SPEEDI;Chino et al., 1993) network system, operated by the JapanseMinistry of Education, Culture, Sports, Science and Tech-nology (MEXT, 2011), was used to calculate dose rates andatmospheric concentrations.
The emission inventory compiled by Chino et al. (2011)used Japanese environmental monitoring station data withina regional simulation domain. The calculations assumed con-
stant radioactivity ratios for the different radionuclides basedon iodine and caesium concentrations in rain, snow and veg-etation in the area. By taking into account these factors and anumber of assumptions used in their simulation, Chino et al.(2011) estimate that their emission inventory is associatedwith an error of at least a factor of five. This uncertainty istaken into account in our model of the deposition of radionu-clides by conducting a sensitivity study with 5 times higheremissions, discussed in Sec. 3.2.
The preliminary initial emission estimates by Chino et al.(2011) were superceded by revised estimates published byKatata et al. (2012) based on additionally disclosed environ-mental monitoring data for air dose rates and concentrationsof radionuclides from four stations during the early phaseof the accident, from the morning of March 12 to late nightMarch 14. Major releases of high-concentration plumes dur-ing this period, which were not taken into account in Chinoet al. (2011), significanlty increased the amount of dry depo-sition and air dose rates. The preliminary and revised esti-mates of the source term were verified and refined in Teradaet al. (2012) and found to be reasonable, within the large un-certainties (order of factor 5), over the period when the plumedispersed over land, which could not be verified over the pe-
Fig. 1. Time integrated precipitation (in m) patterns over the period 11 March–31 May 2011 computed with the EMAC model (upper right)compared to the ERA-Interim data (upper left). The lower panels show the precipitation during the first week after the accident (11–18March 2011).
(which extend up to 50, 300 and 1000 m). Emission invento-ries are provided byStohl et al.(2012) and used in our studybetween the 10 March and the 20 April 2011.
The estimates are reported to be sensitive to replacing theGFS meteorological data with ECMWF data with a sensitiv-ity equal to scaling the a posteriori total emissions estimateby 104 % for133Xe and 68 % for137Cs. When using only de-position, based on Japanese and non-Japanese data, the sen-sitivity scaling factors of the a posteriori total emissions arereported to be 55 % , 59 % and 150 % respectively. The to-tal amount of137Cs emitted is 36.7 (20.1–53.1) PBq, and of133Xe 15.3 (12.2–18.3) EBq (Stohl et al., 2012). Although wedid not explicitly include the emissions of134Cs, in Sects.3.2and3.3 we will discuss the deposition of this compound byassuming a scaling factor to 137Cs suggested byTen Hoeveand Jacobson(2012).
We also incorporated in our model preliminary emissionestimates of the released amounts of131I (in total 150 PBq)and 137Cs (in total 13 PBq) byChino et al.(2011), basedon the reverse estimation of the source term by couplingJapanese environmental monitoring data with regional atmo-spheric dispersion simulations. The System for Predictionof Environmental Emergency Dose Information (SPEEDI;Chino et al., 1993) network system, operated by the Japanese
Ministry of Education, Culture, Sports, Science and Tech-nology (MEXT, 2011), was used to calculate dose rates andatmospheric concentrations.
The emission inventory compiled byChino et al.(2011)used Japanese environmental monitoring station data withina regional simulation domain. The calculations assumed con-stant radioactivity ratios for the different radionuclides basedon iodine and caesium concentrations in rain, snow and veg-etation in the area. By taking into account these factors and anumber of assumptions used in their simulation,Chino et al.(2011) estimate that their emission inventory is associatedwith an error of at least a factor of five. This uncertainty istaken into account in our model of the deposition of radionu-clides by conducting a sensitivity study with 5 times higheremissions, discussed in Sect.3.2.
The preliminary initial emission estimates byChino et al.(2011) were superseded by revised estimates published byKatata et al.(2012) based on additionally disclosed environ-mental monitoring data for air dose rates and concentrationsof radionuclides from four stations during the early phase ofthe accident, from the morning of 12 March to late night 14March. Major releases of high-concentration plumes duringthis period, which were not taken into account inChino et al.(2011), significantly increased the amount of dry deposition
www.atmos-chem-phys.net/13/1425/2013/ Atmos. Chem. Phys., 13, 1425–1438, 2013
1428 T. Christoudias and J. Lelieveld: Global atmospheric modeling of Fukushima radioactivityT.Christoudias et al.: Global atmospheric modeling of Fukushima radioactivity 5
Fig. 2. Total atmospheric content (in kg) of 137Cs (left) and 133Xe (middle) and 131I (right) that originated from Fukushima Dai-ichi basedon the emissions inventories by Stohl et al. (2012) and Chino et al. (2011). The red bands indicate the reported range of the emission sourceestimates, and the dashed lines correspond to the results of the T106 horizontal resolution simulation.
is critical for the simulation of wet deposition. It is notablethat the results of the higher resolution T255 calculations arenot systematically more consistent with the measurementsthan the lower resolution T106 results. The lower panels ofFigs. 3, 4, and 5 present the root-mean-square-deviations(RMSDs) between the measurements and model results forboth resolutions. We also computed the normalised RMSDs,and find that they are typically below 50%, irrespective of thedistance between the station and the emission source.
For the eight stations available with varying number ofmeasurements, there is good agreement between the modelresults and the measurements for the noble gas 133Xe, bothfor the higher and lower resolution (Fig. 3). Nevertheless, themodeled concentrations at JPX38 (Takasaki, Gunma, Japan)peak in March at values well outside the dynamic range ofthe measurement instruments. All measurements at the otherstations are below 100 mBqm−3, the reported upper range ofthe observation accuracy. The model not only represents themeasurements well in the vicinity of the source, but also inNorth, Middle and South America (stations USX75, PAX50,FRX31), and even as far downwind as Germany (DEX33).Again, there are no indications that the higher resolutionversion of the model performs systematically better. Eventhough the ERA-Interim data, used to nudge the model to theactual meteorology, are produced at T255 resolution, the re-gridding of the data to the coarser T106 resolution seems tohave little effect on the quality of the dynamics simulations.
For the comparison of the model simulation results to ob-servations of the surface concentrations of 137Cs (Fig. 4),reduced though nevertheless reasonable agreement can beclaimed, taking into account the inherent uncertainties basedon the multitude and the complexity of the simulated removalprocesses (sedimentation, dry and wet deposition). In mostcases there is close coincidence between the modeled and ob-served time of arrival of the first radioactive plume at the sta-
tion and most model results fall within the factor of five rangeof the measurements (Fig. 4). However, our model shows thearrival of high concentrations of radioactive aerosols in theAsia-Pacific region (see for example USP80 at Upi, Guam,in the supplement, and PHP52 in Tanay, the Philippines, inFig. 4), which are not reflected in the station observations.There is clearly reduced agreement compared to the resultsfor the noble gas 133Xe, which we attribute to the additionaluncertainties related to the simulation of removal processes,in particular by precipitation. These types of uncertaintiesalso affect the source estimates obtained by inverse mod-elling, e.g. by Stohl et al. (2012).
To determine the total level of airborne 131I concentra-tions, both the gaseous and particulate fractions of 131I mustbe accounted for. Sampling gaseous radio-iodine requiresactivated charcoal traps, which are not implemented in theIMS network, as they are not required for CTBT monitor-ing (Stoehlker et al., 2011). Therefore, the iodine measure-ments should be understood as a lower bound, as only theaerosol phase can be collected on particle filters (Winiareket al., 2012). Based on data by the “Ring of Five (Ro5)”,an informal network of European national authorities (whichcomprises more than 150 sampling systems of high volumesamplers and some with activated coal traps), the averagegaseous/total ratio for 131I is 77.2±13.6% (Masson et al.,2011). The U.S. Environmental Protection Agency (EPA)RadNet station measurements detected 81% of the ambi-ent 131I in the gas and 19% in the particle phase (Ten Ho-eve and Jacobson, 2012). These values are close to the av-erage reported value for the Chernobyl accident by Hiltonet al. (1991) and the average of 71±11% reported from theFukushima site from 22 March to 4 April 2011 (Stoehlkeret al., 2011). Therefore, a factor of 4 gaseous to particulatefraction seems an appropriate estimate for the partitioning.
As we do not account for the removal of 131I via wet de-
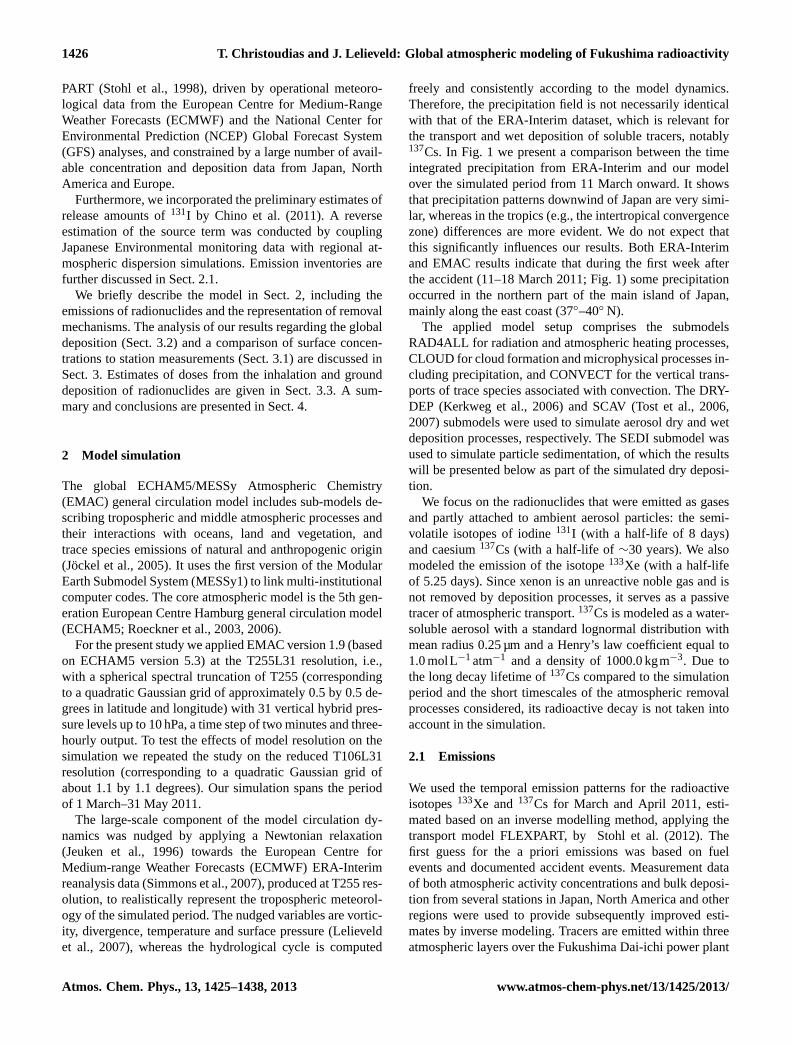
Fig. 2. Total atmospheric content (in kg) of137Cs (left) and133Xe (middle) and131I (right) that originated from Fukushima Dai-ichi basedon the emissions inventories byStohl et al.(2012) andChino et al.(2011). The red bands indicate the reported range of the emission sourceestimates, and the dashed lines correspond to the results of the T106 horizontal resolution simulation.
and air dose rates. The preliminary and revised estimates ofthe source term were verified and refined inTerada et al.(2012) and found to be reasonable, within the large uncer-tainties (order of factor 5), over the period when the plumedispersed over land, which could not be verified over the pe-riod when the plume travelled over the ocean. The refine-ments of the results byChino et al.(2011) are not includedin our study.
A comparison of the estimate of released137Cs byStohlet al.(2012) andChino et al.(2011) can be seen in the totalmodel calculated atmospheric content (Fig.2) and for indi-vidual station measurements (Figs.3–5). The two emissionestimates differ greatly, both in magnitude and time profile.We find that the spatial resolution of our model has little im-pact on the global atmospheric content of radionuclides.
3 Results
The comparison of our model results with station measure-ments is discussed in Sect.3.1. The modeled global deposi-tion of radionuclides is presented in Sect.3.2. The doses tothe public from deposition and inhalation based on our re-sults are calculated in Sect.3.3.
3.1 Comparison with Station Measurements
The Comprehensive Nuclear-Test-Ban Treaty (CTBT),adopted by the United Nations General Assembly, foreseesa ban of all nuclear explosions. For compliance, a global In-ternational Monitoring System (IMS) of measurement tech-nologies has been established by the CTBT Organization(CTBTO), with data delivered to the International Data Cen-tre for of the CTBTO Preparatory commission in Vienna,Austria. The IMS comprises radionuclide measurement sta-tions with continuous coverage, distributed around the globe.
The subset of stations with available measurements used inour study can be seen in Figs.3 and4.
The stations operate high volume aerosol samplers us-ing collection filters with a minimum detection capability(MDC) range typically between 1–10 µBqm−3 for Cs. Sinceiodine largely travels in the gas phase, the filter measure-ments represent only a small fraction of airborne131I, thusassociated with a relatively large measurement uncertainty(Stoehlker et al., 2011). Only 20–50 % of131I is collectedin the samples, since the IMS stations are using paper fil-ters through which part of the iodine passes unattenuated (asreported by the CTBTO Virtual Data Exploitation Centre).Noble gas concentration measurement stations are also beenset up worldwide, with133Xe being the most important andprevalent isotope. It is measured with typical MDC of about0.2 mBqm−3. The CTBTO station measurements of radionu-clide concentrations can be directly compared to the concen-trations simulated by our model.
There are some additional aspects that affect the CTBTOstation measurements, which should be taken into accountwhen comparing to the model simulations (Stoehlker et al.,2011). The highest concentrations of Xe after the accidentwere outside the dynamic range of the noble gas system,so detections that are higher than 100 Bqm−3 are not ex-pected to be accurate. It is also known that the Takasaki(JPX38) noble gas station in Japan was affected significantlyby dead time in the first three weeks after the accident. TheJapanese particulate station JPP38, also at Takasaki, was af-fected by radioactive leaks into the measurement room andpower outages between 14 and 16 March 2011. Contamina-tion at JPP38 lead to an overestimation of137Cs concentra-tions by about 1 mBqm−3 until August 2011. Similar con-tamination occurred at USP71 at Sand Point, Alaska, USA,leading to an overestimation in the range of 3 µBqm−3 for
Atmos. Chem. Phys., 13, 1425–1438, 2013 www.atmos-chem-phys.net/13/1425/2013/
T. Christoudias and J. Lelieveld: Global atmospheric modeling of Fukushima radioactivity 142910 T.Christoudias et al.: Global atmospheric modeling of Fukushima radioactivity
Fig. 3. Top: CTBTO measurement network station location and code for the noble gas 133Xe for the subset of stations with measurementsavailable used in our study.Middle: Observed (black points) and modeled (solid lines) surface concentrations of 133Xe at the eight stations. T255 horizontal resolutionis shown in blue and T106 in red. The time axis represents days after the accident.Bottom: Modeled versus observed surface concentrations of 133Xe at the eight stations. The diagonal lines represent the 1:1 ratio and thefactor of 5 over- and underestimates.
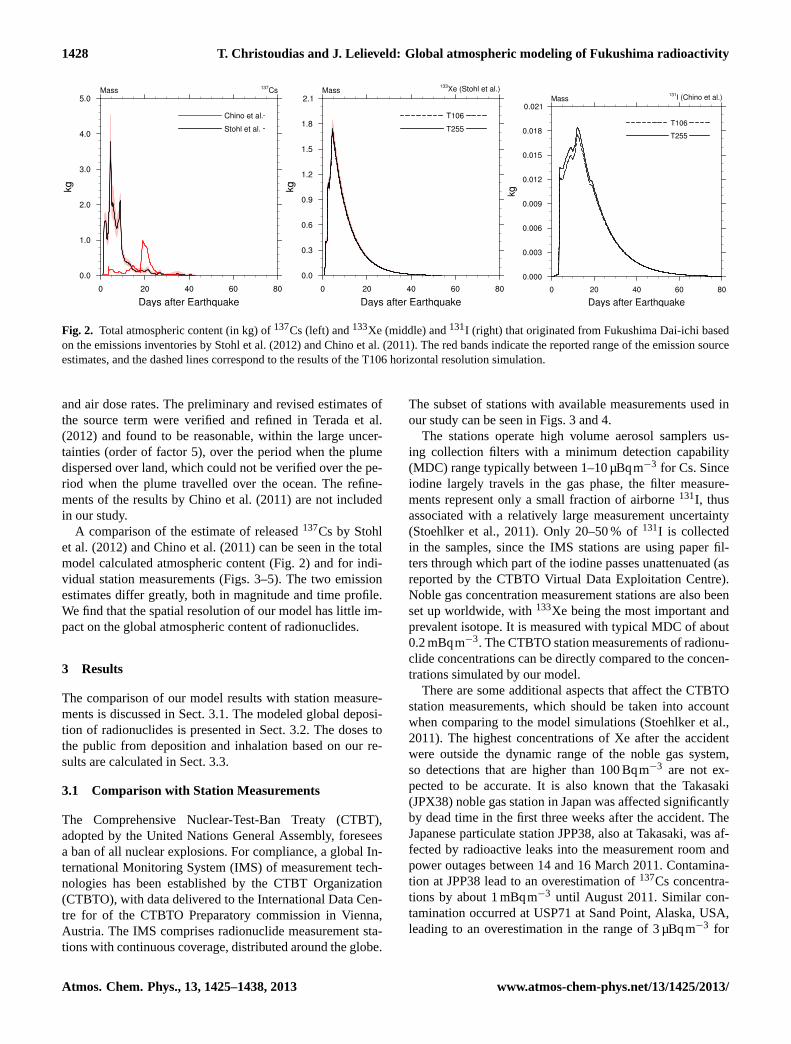
Fig. 3. Top: CTBTO measurement network station location and code for the noble gas133Xe for the subset of stations with measurementsavailable used in our study.Middle: Observed (black points) and modeled (solid lines) surface concentrations of133Xe at the eight stations. T255 horizontal resolutionis shown in blue and T106 in red. The time axis represents days after the accident.Bottom: Modeled versus observed surface concentrations of133Xe at the eight stations. The diagonal lines represent the 1:1 ratio and thefactor of 5 over- and underestimates.
www.atmos-chem-phys.net/13/1425/2013/ Atmos. Chem. Phys., 13, 1425–1438, 2013
1430 T. Christoudias and J. Lelieveld: Global atmospheric modeling of Fukushima radioactivity
137Cs. Therefore, for these locations we expect our model tounderestimate the reported observations.
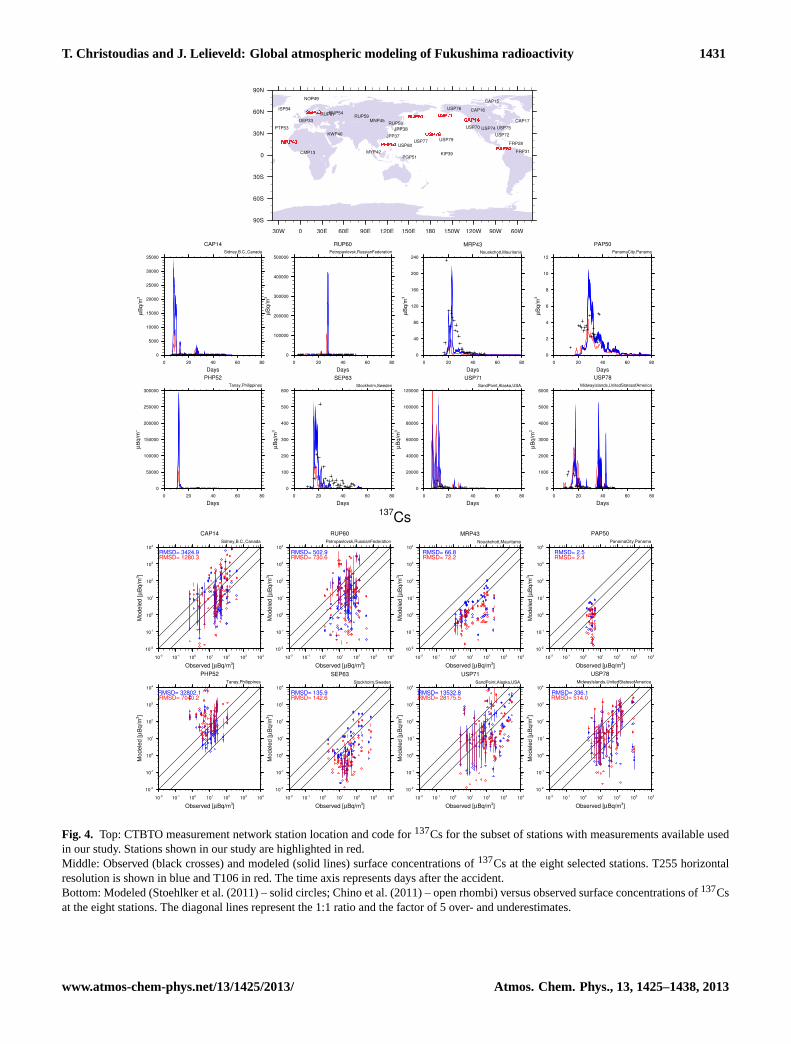
The locations of the CTBTO measurement stations for ra-dionuclide gases and particulates used for comparison, in-cluding station codes, can be seen in Fig.4. In total, eightstations are available for noble gas observations and 37 forparticulates. The availability of 3 months of measurementsallows for the comparison over a wide range of meteorologi-cal conditions and radionuclide concentrations at each stationlocation.
We focus on the concentrations of radionuclides in thelowest layer of our model and in the grid boxes where thestations are located, and compare with the measured concen-trations at each station at the nearest model output time stepto the station collection start time. The comparison for all133Xe stations is presented in Fig.3 and selected stations for137Cs and131I in Figs. 4 and5, respectively. The entire setof measurements and concomitant model results is presentedin the electronic supplement. Our model does not take intoaccount the resuspension of particles after they have beendeposited, though we expect the effect to be small.
Overall, there is good coincidence of the time of first ar-rival of the radionuclide plume at the station and the time offirst detection of radioactivity at a station, especially for sta-tions in the Asia-Pacific and North American regions, takinginto account coincidence timing uncertainties. As all the sta-tions collect samples over a period of typically 12 h or morefor each measurement performed, there is an associated un-certainty of the same order of magnitude over the time offirst arrival of radionuclides from Fukushima at each mea-surement location. Furthermore, the measurement record isnot continuous for all stations, resulting in cases where thereis no observational coverage of the model prediction of thearrival of radionulcide plumes. Good agreement is obtainedfor the inert noble gas133Xe (although only a limited num-ber of stations is available). The agreement is not as goodfor 137Cs and131I. This is to be expected as the greater ex-tend to which different removal processes are involved (dryand wet deposition and sedimentation), creates larger uncer-tainties in the source estimates and in the modelling of at-mospheric transport and removal. These removal processestake place on a sub-grid scale and are therefore parameter-ized and thus less explicitly resolved by the model than at-mospheric dynamical and transport processes. Especially themodel representation of precipitation is critical for the simu-lation of wet deposition. It is notable that the results of thehigher resolution T255 calculations are not systematicallymore consistent with the measurements than the lower res-olution T106 results. The lower panels of Figs.3, 4, and5present the root-mean-square-deviations (RMSDs) betweenthe measurements and model results for both resolutions. Wealso computed the normalised RMSDs, and find that they aretypically below 50 % , irrespective of the distance betweenthe station and the emission source.
For the eight stations available with varying number ofmeasurements, there is good agreement between the modelresults and the measurements for the noble gas133Xe, bothfor the higher and lower resolution (Fig.3). Nevertheless, themodeled concentrations at JPX38 (Takasaki, Gunma, Japan)peak in March at values well outside the dynamic range ofthe measurement instruments. All measurements at the otherstations are below 100 mBqm−3, the reported upper range ofthe observation accuracy. The model not only represents themeasurements well in the vicinity of the source, but also inNorth, Middle and South America (stations USX75, PAX50,FRX31), and even as far downwind as Germany (DEX33).Again, there are no indications that the higher resolutionversion of the model performs systematically better. Eventhough the ERA-Interim data, used to nudge the model tothe actual meteorology, are produced at T255 resolution, theregridding of the data to the coarser T106 resolution seems tohave little effect on the quality of the dynamics simulations.
For the comparison of the model simulation results to ob-servations of the surface concentrations of137Cs (Fig. 4),reduced though nevertheless reasonable agreement can beclaimed, taking into account the inherent uncertainties basedon the multitude and the complexity of the simulated re-moval processes (sedimentation, dry and wet deposition). Inmost cases there is close coincidence between the modeledand observed time of arrival of the first radioactive plumeat the station and most model results fall within the factorof five range of the measurements (Fig.4). However, ourmodel shows the arrival of high concentrations of radioactiveaerosols in the Asia-Pacific region (see for example USP80at Upi, Guam, in the supplement, and PHP52 in Tanay, thePhilippines, in Fig.4), which are not reflected in the stationobservations. There is clearly reduced agreement comparedto the results for the noble gas133Xe, which we attribute tothe additional uncertainties related to the simulation of re-moval processes, in particular by precipitation. These typesof uncertainties also affect the source estimates obtained byinverse modelling, e.g. byStohl et al.(2012).
To determine the total level of airborne131I concentra-tions, both the gaseous and particulate fractions of131I mustbe accounted for. Sampling gaseous radio-iodine requiresactivated charcoal traps, which are not implemented in theIMS network, as they are not required for CTBT monitor-ing (Stoehlker et al., 2011). Therefore, the iodine measure-ments should be understood as a lower bound, as only theaerosol phase can be collected on particle filters (Winiareket al., 2012). Based on data by the “Ring of Five (Ro5)”,an informal network of European national authorities (whichcomprises more than 150 sampling systems of high volumesamplers and some with activated coal traps), the averagegaseous/total ratio for131I is 77.2± 13.6 % (Masson et al.,2011). The US Environmental Protection Agency (EPA)RadNet station measurements detected 81 % of the ambi-ent 131I in the gas and 19 % in the particle phase (Ten Ho-eve and Jacobson, 2012). These values are close to the
Atmos. Chem. Phys., 13, 1425–1438, 2013 www.atmos-chem-phys.net/13/1425/2013/
T. Christoudias and J. Lelieveld: Global atmospheric modeling of Fukushima radioactivity 1431T.Christoudias et al.: Global atmospheric modeling of Fukushima radioactivity 11
�✁✂✄☎
✂✆✂✝✞
�✁✂✄✟
✠✆✂☎✡
✂☛✂✝☞
✁✌✂✍✎
✏✑✂✡✎
✑�✂✍✞
Fig. 4. Top: CTBTO measurement network station location and code for 137Cs for the subset of stations with measurements available usedin our study. Stations shown in our study are highlighted in red.Middle: Observed (black crosses) and modeled (solid lines) surface concentrations of 137Cs at the eight selected stations. T255 horizontalresolution is shown in blue and T106 in red. The time axis represents days after the accident.Bottom: Modeled (Stoehlker et al. (2011) – solid circles; Chino et al. (2011) – open rhombi) versus observed surface concentrations of 137Csat the eight stations. The diagonal lines represent the 1:1 ratio and the factor of 5 over- and underestimates.
Fig. 4. Top: CTBTO measurement network station location and code for137Cs for the subset of stations with measurements available usedin our study. Stations shown in our study are highlighted in red.Middle: Observed (black crosses) and modeled (solid lines) surface concentrations of137Cs at the eight selected stations. T255 horizontalresolution is shown in blue and T106 in red. The time axis represents days after the accident.Bottom: Modeled (Stoehlker et al.(2011) – solid circles;Chino et al.(2011) – open rhombi) versus observed surface concentrations of137Csat the eight stations. The diagonal lines represent the 1:1 ratio and the factor of 5 over- and underestimates.
www.atmos-chem-phys.net/13/1425/2013/ Atmos. Chem. Phys., 13, 1425–1438, 2013
1432 T. Christoudias and J. Lelieveld: Global atmospheric modeling of Fukushima radioactivity12 T.Christoudias et al.: Global atmospheric modeling of Fukushima radioactivity
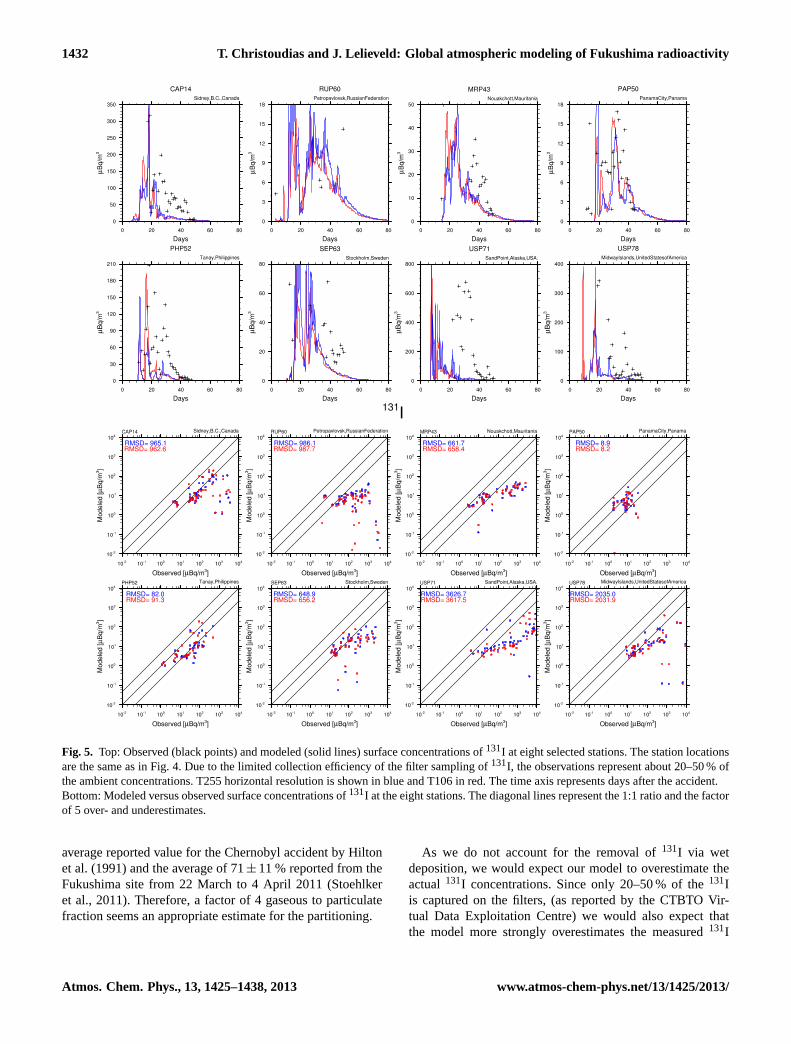
Fig. 5. Top: Observed (black points) and modeled (solid lines) surface concentrations of 131I at eight selected stations. The station locationsare the same as in Fig. 4. Due to the limited collection efficiency of the filter sampling of 131I, the observations represent about 20-50% ofthe ambient concentrations. T255 horizontal resolution is shown in blue and T106 in red. The time axis represents days after the accident.Bottom: Modeled versus observed surface concentrations of 131I at the eight stations. The diagonal lines represent the 1:1 ratio and thefactor of 5 over- and underestimates.
Fig. 5. Top: Observed (black points) and modeled (solid lines) surface concentrations of131I at eight selected stations. The station locationsare the same as in Fig.4. Due to the limited collection efficiency of the filter sampling of131I, the observations represent about 20–50 % ofthe ambient concentrations. T255 horizontal resolution is shown in blue and T106 in red. The time axis represents days after the accident.Bottom: Modeled versus observed surface concentrations of131I at the eight stations. The diagonal lines represent the 1:1 ratio and the factorof 5 over- and underestimates.
average reported value for the Chernobyl accident byHiltonet al.(1991) and the average of 71± 11 % reported from theFukushima site from 22 March to 4 April 2011 (Stoehlkeret al., 2011). Therefore, a factor of 4 gaseous to particulatefraction seems an appropriate estimate for the partitioning.
As we do not account for the removal of131I via wetdeposition, we would expect our model to overestimate theactual131I concentrations. Since only 20–50 % of the131Iis captured on the filters, (as reported by the CTBTO Vir-tual Data Exploitation Centre) we would also expect thatthe model more strongly overestimates the measured131I
Atmos. Chem. Phys., 13, 1425–1438, 2013 www.atmos-chem-phys.net/13/1425/2013/
T. Christoudias and J. Lelieveld: Global atmospheric modeling of Fukushima radioactivity 1433
T.Christoudias et al.: Global atmospheric modeling of Fukushima radioactivity 13
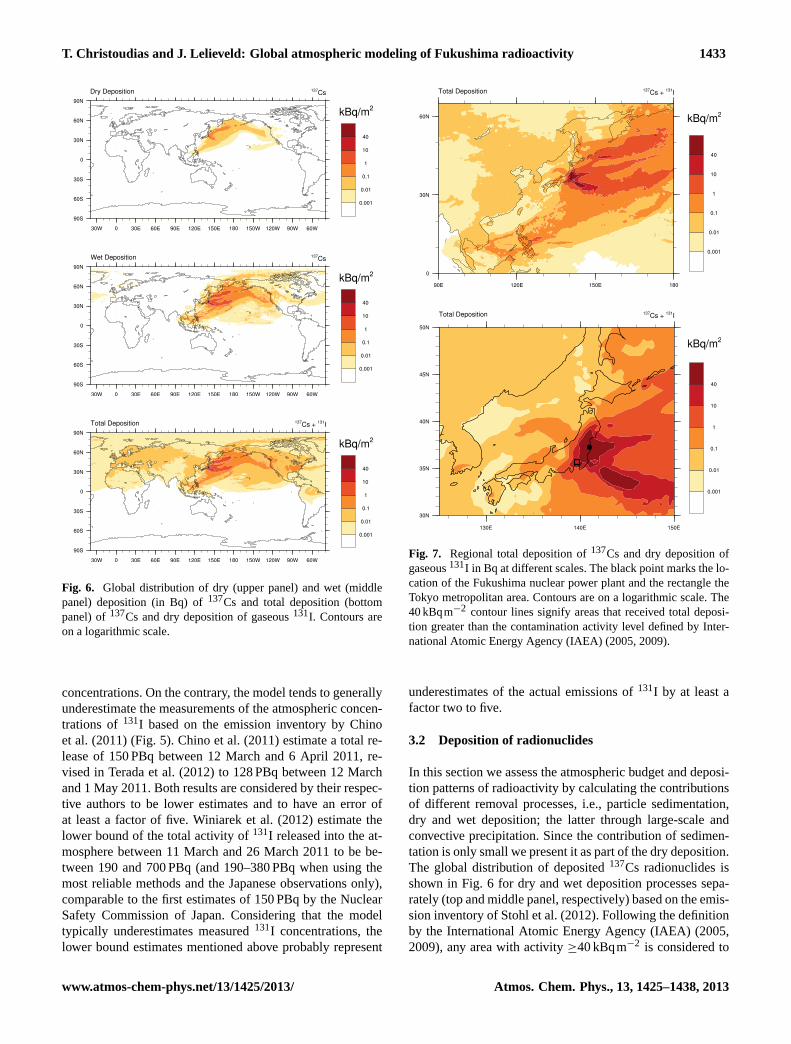
Fig. 6. Global distribution of dry (upper panel) and wet (middlepanel) deposition (in Bq) of 137Cs and total deposition (bottompanel) of 137Cs and dry deposition of gaseous 131I. Contours areon a logarithmic scale.
Fig. 7. Regional total deposition of 137Cs and dry deposition ofgaseous 131I in Bq at different scales. The black point marks thelocation of the Fukushima nuclear power plant and the rectanglethe Tokyo metropolitan area. Contours are on a logarithmic scale.The 40 kBqm−2 contour lines signify areas that received total de-position greater than the contamination activity level defined by In-ternational Atomic Energy Agency (IAEA) (2005, 2009).
Fig. 6. Global distribution of dry (upper panel) and wet (middlepanel) deposition (in Bq) of137Cs and total deposition (bottompanel) of137Cs and dry deposition of gaseous131I. Contours areon a logarithmic scale.
concentrations. On the contrary, the model tends to generallyunderestimate the measurements of the atmospheric concen-trations of131I based on the emission inventory byChinoet al.(2011) (Fig. 5). Chino et al.(2011) estimate a total re-lease of 150 PBq between 12 March and 6 April 2011, re-vised inTerada et al.(2012) to 128 PBq between 12 Marchand 1 May 2011. Both results are considered by their respec-tive authors to be lower estimates and to have an error ofat least a factor of five.Winiarek et al.(2012) estimate thelower bound of the total activity of131I released into the at-mosphere between 11 March and 26 March 2011 to be be-tween 190 and 700 PBq (and 190–380 PBq when using themost reliable methods and the Japanese observations only),comparable to the first estimates of 150 PBq by the NuclearSafety Commission of Japan. Considering that the modeltypically underestimates measured131I concentrations, thelower bound estimates mentioned above probably represent
T.Christoudias et al.: Global atmospheric modeling of Fukushima radioactivity 13
Fig. 6. Global distribution of dry (upper panel) and wet (middlepanel) deposition (in Bq) of 137Cs and total deposition (bottompanel) of 137Cs and dry deposition of gaseous 131I. Contours areon a logarithmic scale.
Fig. 7. Regional total deposition of 137Cs and dry deposition ofgaseous 131I in Bq at different scales. The black point marks thelocation of the Fukushima nuclear power plant and the rectanglethe Tokyo metropolitan area. Contours are on a logarithmic scale.The 40 kBqm−2 contour lines signify areas that received total de-position greater than the contamination activity level defined by In-ternational Atomic Energy Agency (IAEA) (2005, 2009).
Fig. 7. Regional total deposition of137Cs and dry deposition ofgaseous131I in Bq at different scales. The black point marks the lo-cation of the Fukushima nuclear power plant and the rectangle theTokyo metropolitan area. Contours are on a logarithmic scale. The40 kBqm−2 contour lines signify areas that received total deposi-tion greater than the contamination activity level defined byInter-national Atomic Energy Agency (IAEA)(2005, 2009).
underestimates of the actual emissions of131I by at least afactor two to five.
3.2 Deposition of radionuclides
In this section we assess the atmospheric budget and deposi-tion patterns of radioactivity by calculating the contributionsof different removal processes, i.e., particle sedimentation,dry and wet deposition; the latter through large-scale andconvective precipitation. Since the contribution of sedimen-tation is only small we present it as part of the dry deposition.The global distribution of deposited137Cs radionuclides isshown in Fig.6 for dry and wet deposition processes sepa-rately (top and middle panel, respectively) based on the emis-sion inventory ofStohl et al.(2012). Following the definitionby theInternational Atomic Energy Agency (IAEA)(2005,2009), any area with activity≥40 kBqm−2 is considered to
www.atmos-chem-phys.net/13/1425/2013/ Atmos. Chem. Phys., 13, 1425–1438, 2013
1434 T. Christoudias and J. Lelieveld: Global atmospheric modeling of Fukushima radioactivity
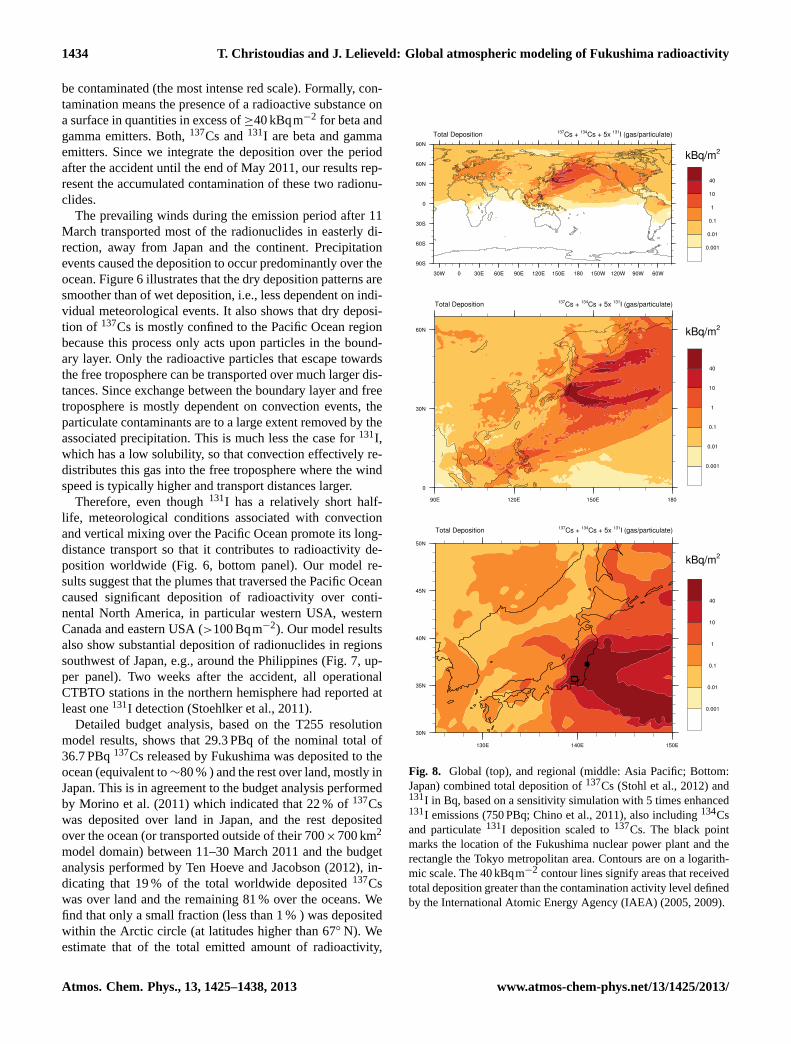
be contaminated (the most intense red scale). Formally, con-tamination means the presence of a radioactive substance ona surface in quantities in excess of≥40 kBqm−2 for beta andgamma emitters. Both,137Cs and131I are beta and gammaemitters. Since we integrate the deposition over the periodafter the accident until the end of May 2011, our results rep-resent the accumulated contamination of these two radionu-clides.
The prevailing winds during the emission period after 11March transported most of the radionuclides in easterly di-rection, away from Japan and the continent. Precipitationevents caused the deposition to occur predominantly over theocean. Figure6 illustrates that the dry deposition patterns aresmoother than of wet deposition, i.e., less dependent on indi-vidual meteorological events. It also shows that dry deposi-tion of 137Cs is mostly confined to the Pacific Ocean regionbecause this process only acts upon particles in the bound-ary layer. Only the radioactive particles that escape towardsthe free troposphere can be transported over much larger dis-tances. Since exchange between the boundary layer and freetroposphere is mostly dependent on convection events, theparticulate contaminants are to a large extent removed by theassociated precipitation. This is much less the case for131I,which has a low solubility, so that convection effectively re-distributes this gas into the free troposphere where the windspeed is typically higher and transport distances larger.
Therefore, even though131I has a relatively short half-life, meteorological conditions associated with convectionand vertical mixing over the Pacific Ocean promote its long-distance transport so that it contributes to radioactivity de-position worldwide (Fig.6, bottom panel). Our model re-sults suggest that the plumes that traversed the Pacific Oceancaused significant deposition of radioactivity over conti-nental North America, in particular western USA, westernCanada and eastern USA (>100 Bqm−2). Our model resultsalso show substantial deposition of radionuclides in regionssouthwest of Japan, e.g., around the Philippines (Fig.7, up-per panel). Two weeks after the accident, all operationalCTBTO stations in the northern hemisphere had reported atleast one131I detection (Stoehlker et al., 2011).
Detailed budget analysis, based on the T255 resolutionmodel results, shows that 29.3 PBq of the nominal total of36.7 PBq137Cs released by Fukushima was deposited to theocean (equivalent to∼80 % ) and the rest over land, mostly inJapan. This is in agreement to the budget analysis performedby Morino et al.(2011) which indicated that 22 % of137Cswas deposited over land in Japan, and the rest depositedover the ocean (or transported outside of their 700×700 km2
model domain) between 11–30 March 2011 and the budgetanalysis performed byTen Hoeve and Jacobson(2012), in-dicating that 19 % of the total worldwide deposited137Cswas over land and the remaining 81 % over the oceans. Wefind that only a small fraction (less than 1 % ) was depositedwithin the Arctic circle (at latitudes higher than 67◦ N). Weestimate that of the total emitted amount of radioactivity,
14 T.Christoudias et al.: Global atmospheric modeling of Fukushima radioactivity
Fig. 8. Global (top), and regional (middle: Asia Pacific; Bottom:Japan) combined total deposition of 137Cs (Stohl et al., 2012) and131I in Bq, based on a sensitivity simulation with 5 times enhanced131I emissions (750 PBq; Chino et al. (2011)), also including 134Csand particulate 131I deposition scaled to 137Cs. The black pointmarks the location of the Fukushima nuclear power plant and therectangle the Tokyo metropolitan area. Contours are on a logarith-mic scale. The 40 kBqm−2 contour lines signify areas that receivedtotal deposition greater than the contamination activity level definedby the International Atomic Energy Agency (IAEA) (2005, 2009).
Fig. 8. Global (top), and regional (middle: Asia Pacific; Bottom:Japan) combined total deposition of137Cs (Stohl et al., 2012) and131I in Bq, based on a sensitivity simulation with 5 times enhanced131I emissions (750 PBq;Chino et al., 2011), also including134Csand particulate131I deposition scaled to137Cs. The black pointmarks the location of the Fukushima nuclear power plant and therectangle the Tokyo metropolitan area. Contours are on a logarith-mic scale. The 40 kBqm−2 contour lines signify areas that receivedtotal deposition greater than the contamination activity level definedby theInternational Atomic Energy Agency (IAEA)(2005, 2009).
Atmos. Chem. Phys., 13, 1425–1438, 2013 www.atmos-chem-phys.net/13/1425/2013/
T. Christoudias and J. Lelieveld: Global atmospheric modeling of Fukushima radioactivity 1435
T.Christoudias et al.: Global atmospheric modeling of Fukushima radioactivity 15
Fig. 9. Effective dose from the inhalation of airborne radionuclides for the nominal emission dataset (left); inhalation dose sensitivity testfor the 131I emission scaled by factor 5 (middle); and fifty-year dose from the ground deposition of 131I, 134Cs and 137Cs (right) based ondose factors by the IAEA (2009).
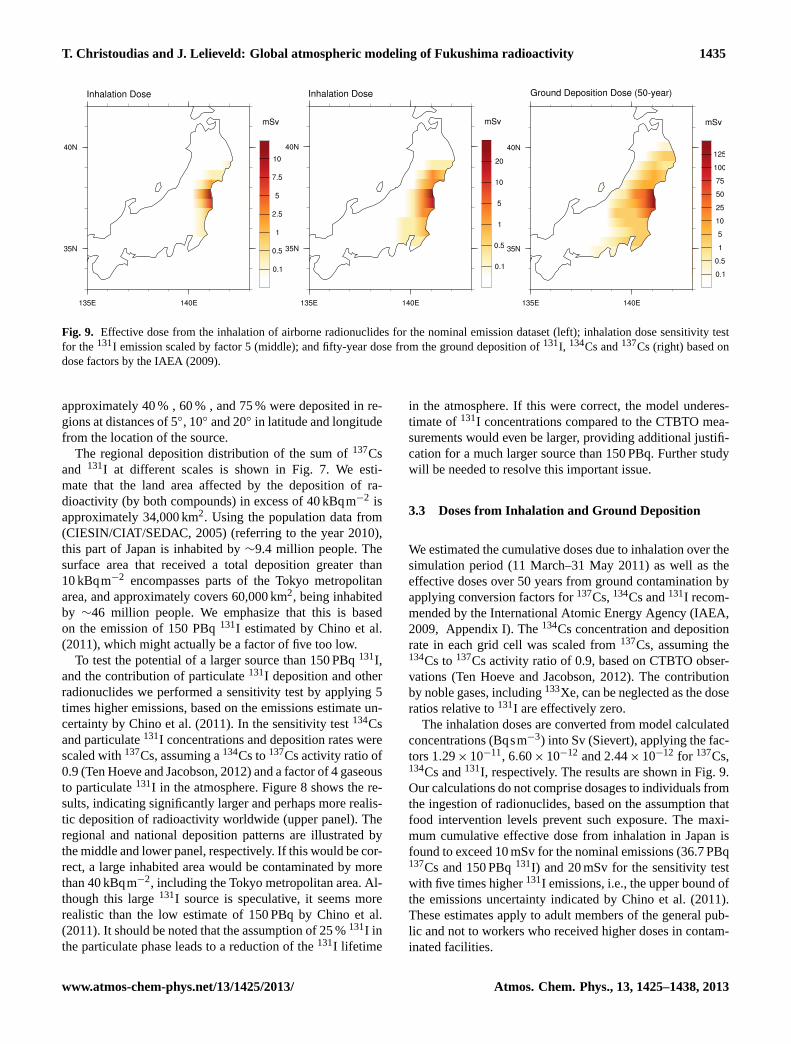
Fig. 9. Effective dose from the inhalation of airborne radionuclides for the nominal emission dataset (left); inhalation dose sensitivity testfor the131I emission scaled by factor 5 (middle); and fifty-year dose from the ground deposition of131I, 134Cs and137Cs (right) based ondose factors by theIAEA (2009).
approximately 40 % , 60 % , and 75 % were deposited in re-gions at distances of 5◦, 10◦ and 20◦ in latitude and longitudefrom the location of the source.
The regional deposition distribution of the sum of137Csand 131I at different scales is shown in Fig.7. We esti-mate that the land area affected by the deposition of ra-dioactivity (by both compounds) in excess of 40 kBqm−2 isapproximately 34,000 km2. Using the population data from(CIESIN/CIAT/SEDAC, 2005) (referring to the year 2010),this part of Japan is inhabited by∼9.4 million people. Thesurface area that received a total deposition greater than10 kBqm−2 encompasses parts of the Tokyo metropolitanarea, and approximately covers 60,000 km2, being inhabitedby ∼46 million people. We emphasize that this is basedon the emission of 150 PBq131I estimated byChino et al.(2011), which might actually be a factor of five too low.
To test the potential of a larger source than 150 PBq131I,and the contribution of particulate131I deposition and otherradionuclides we performed a sensitivity test by applying 5times higher emissions, based on the emissions estimate un-certainty byChino et al.(2011). In the sensitivity test134Csand particulate131I concentrations and deposition rates werescaled with137Cs, assuming a134Cs to137Cs activity ratio of0.9 (Ten Hoeve and Jacobson, 2012) and a factor of 4 gaseousto particulate131I in the atmosphere. Figure8 shows the re-sults, indicating significantly larger and perhaps more realis-tic deposition of radioactivity worldwide (upper panel). Theregional and national deposition patterns are illustrated bythe middle and lower panel, respectively. If this would be cor-rect, a large inhabited area would be contaminated by morethan 40 kBqm−2, including the Tokyo metropolitan area. Al-though this large131I source is speculative, it seems morerealistic than the low estimate of 150 PBq byChino et al.(2011). It should be noted that the assumption of 25 %131I inthe particulate phase leads to a reduction of the131I lifetime
in the atmosphere. If this were correct, the model underes-timate of131I concentrations compared to the CTBTO mea-surements would even be larger, providing additional justifi-cation for a much larger source than 150 PBq. Further studywill be needed to resolve this important issue.
3.3 Doses from Inhalation and Ground Deposition
We estimated the cumulative doses due to inhalation over thesimulation period (11 March–31 May 2011) as well as theeffective doses over 50 years from ground contamination byapplying conversion factors for137Cs,134Cs and131I recom-mended by the International Atomic Energy Agency (IAEA,2009, Appendix I). The134Cs concentration and depositionrate in each grid cell was scaled from137Cs, assuming the134Cs to137Cs activity ratio of 0.9, based on CTBTO obser-vations (Ten Hoeve and Jacobson, 2012). The contributionby noble gases, including133Xe, can be neglected as the doseratios relative to131I are effectively zero.
The inhalation doses are converted from model calculatedconcentrations (Bqsm−3) into Sv (Sievert), applying the fac-tors 1.29× 10⁻¹¹, 6.60× 10⁻¹² and 2.44× 10⁻¹² for 137Cs,134Cs and131I, respectively. The results are shown in Fig.9.Our calculations do not comprise dosages to individuals fromthe ingestion of radionuclides, based on the assumption thatfood intervention levels prevent such exposure. The maxi-mum cumulative effective dose from inhalation in Japan isfound to exceed 10 mSv for the nominal emissions (36.7 PBq137Cs and 150 PBq131I) and 20 mSv for the sensitivity testwith five times higher131I emissions, i.e., the upper bound ofthe emissions uncertainty indicated byChino et al.(2011).These estimates apply to adult members of the general pub-lic and not to workers who received higher doses in contam-inated facilities.
www.atmos-chem-phys.net/13/1425/2013/ Atmos. Chem. Phys., 13, 1425–1438, 2013
1436 T. Christoudias and J. Lelieveld: Global atmospheric modeling of Fukushima radioactivity
Further, we calculated the effective dose to the public fromexposure to ground contamination due to the deposition of137Cs,134Cs and131I. The 50-year ground deposition dosesare derived from the conversion of deposited radioactivityin Bqm−2 into an effective dose in Sv, applying the fac-tors 1.30× 10⁻⁷, 5.10× 10⁻⁹ and 2.70× 10⁻¹⁰ for 137Cs,134Cs and131I, respectively (IAEA, 2009). The cumulativeeffective dose from radioactive compounds remaining on theground for a period of 50 years is shown in the right panelof Fig. 9. The 50-year effective dose is dominated by the ef-fects of 137Cs and is less sensitive to the large uncertaintyof the deposited amounts of131I and 134Cs. The sensitiv-ity of these dose estimates to the radionuclide132Te is ex-pected to be low, because even though the radioactivity ratioof 131I:(131I+132Te):134Cs:137Cs=1:2:0.1:0.1 (Katata et al.,2011), the dose factors from ground deposition and inhala-tion are at least 3 orders of magnitude lower.
The geographic distribution of dose estimates within theland area of Japan is associated with a high degree of un-certainty, due to the spatial resolution of our model. A nestedregional model can be used in a future study to improve uponthe estimates by the use of more detailed land model and afiner grid. In Fig.9 we show the horizontal resolution to em-phasize the relatively coarse grid of our model, about 50 km,which for example cannot reflect the complex terrain aroundthe Dai-ichi accident site. Nevertheless, since the133Xe sim-ulations have shown that transport over large distances issimulated accurately by our model, we may assume that thisalso applies to shorter distances of 50 km upward.
4 Conclusions
The release of radioactivity from the Fukushima Dai-ichinuclear power plant accident and the atmospheric transportand deposition patterns between March and May 2011 weresimulated using the EMAC atmospheric chemistry – generalcirculation model at different resolutions (T255 and T106,equivalent to∼50 km and∼110 km Gaussian grid resolu-tion respectively). The atmospheric dynamics were nudgedtowards ERA-Interim reanalysis data of the ECMWF, avail-able at T255 resolution.
We initialized our model by applying emissions of the inertnoble gas133Xe and the semi-volatile gases131I and 137Cs.In our model, ceasium attaches to ambient aerosol particles,whereas the iodine remains in the gas phase. The sourceterms are based on estimates from the literature, produced byinverse modelling and reverse estimation techniques. Thereare significant differences and large uncertainties in the to-tal amount and temporal release of radionuclides betweenthe presently available estimates. Removal processes throughprecipitation, particle sedimentation, dry deposition and ra-dioactive decay were taken into account.
Modeled surface concentrations were compared to stationobservations by the Comprehensive Nuclear-Test-Ban Treaty
Organisation (CTBTO) global monitoring network for a se-lected number of stations. We obtained good agreement withmeasurements of133Xe, at both T255 and T106 resolution.The comparison for137Cs is less favorable, though not sys-tematically biased based on the137Cs emission estimate of36.7 (20.1–53.1) PBq byStohl et al.(2012). This is equiva-lent to somewhat less than half the137Cs source by Cher-nobyl (85 PBq,International Atomic Energy Agency (IAEA)(2006)). The estimate of 13 PBq byChino et al.(2011) (re-vised to 8.8 PBq byTerada et al.(2012) and confirmed as alower bound of 12 PBq byWiniarek et al.(2012), with an up-per bound of 210 PBq, was also included in our comparison.
The model calculated deposition patterns show that mostof the radioactivity which was released to the atmosphereended in the Pacific Ocean (about 80 % ), in agreement withother studies (Morino et al., 2011; Ten Hoeve and Jacobson,2012). Although the prevailing wind direction during the ac-cident was in easterly direction, some of the atmospheric ra-dioactivity was transported toward the west and southwest,and deposited in Japan and to a lesser extent reached thePhilippines. Based on the above mentioned emission esti-mates, we calculated that an area of Japan of 34,000 km2 wascontaminated by more than 40 kBqm−2 of 137Cs and131I, towhich∼9.4 million people were exposed. Our model resultsindicate that a surface area of 60,000 km2 received a total de-position greater than 10 kBqm−2, a region inhabited by∼46million people.
The source term of 150 PBq131I applied in our model,based onChino et al. (2011), is associated with a sys-tematic underestimate of simulated concentrations comparedto the CTBTO measurements. Therefore, we performed an131I emissions sensitivity test, with a factor of five strongersource, i.e., the upper bound of the uncertainty range indi-cated byChino et al.(2011). If this would be realistic, ourmodel indicates that a relatively large and densely populatedpart of Japan including parts of the Tokyo metropolitan areahas been contaminated by more than 40 kBqm−2. Additionalwork will be needed to estimate the131I source more accu-rately.
Finally, we estimated the cumulative doses to the pub-lic due to the inhalation of radionuclides over the simulatedtime period (11 March–31 May 2011) and the effective dosesover a 50-year period from ground contamination. The max-imum inhalation dose around the Fukushima nuclear acci-dent site is calculated to be>10 mSv for the nominal emis-sions case and>20 mSv for the sensitivity test to the emis-sions uncertainty byChino et al.(2011) (five times higher131I emissions). These estimates only include137Cs and131I,and neglect other isotopes of caesium and iodine and otherradionuclides such as132Te. The maximum 50-year dose dueto ground contamination in the area around the Fukushimanuclear power plant is estimated to be>125 mSv. This resultis less sensitive to the high uncertainty of the131I emissionssince it is dominated by the deposition of caesium.
Atmos. Chem. Phys., 13, 1425–1438, 2013 www.atmos-chem-phys.net/13/1425/2013/
T. Christoudias and J. Lelieveld: Global atmospheric modeling of Fukushima radioactivity 1437
Supplementary material related to this article isavailable online at:http://www.atmos-chem-phys.net/13/1425/2013/acp-13-1425-2013-supplement.pdf.
Acknowledgements.The research leading to these results hasreceived funding from the European Research Council under theEuropean Union’s Seventh Framework Programme (FP7/2007-2013) / ERC grant agreement no 226144. Computational resourceswere provided by the LinkSCEEM project. We thank the Interna-tional Data Centre (IDC) of the Provisional Technical Secretariat(PTS) for the CTBTO Preparatory Commission for producing andproviding the radionuclide measurement data. We are most gratefulfor comments received by the CTBTO PTS on how to improve ourmanuscript. The Preparatory Commission for the ComprehensiveNuclear-Test-Ban Treaty Organization and its Provisional Techni-cal Secretariat are not responsible for the views of the authors. TheNCAR Command Language (NCL) (UCAR/NCAR/CISL/VETS,2012) was used for data analysis and visualisation.
Edited by: Y. Balkanski
References
Anspaugh, L., Catlin, R., and Goldman, M.: The global impact ofthe Chernobyl reactor accident, Science, 242, 1513–1519, 1988.
Butler, D.: Radioactivity spreads in Japan, Nature, 471, 555–556,2011.
Chino, M., Ishikawa, H., et al.: SPEEDI and WSPEEDI: Japaneseemergency response systems to predict radiological impacts inlocal and workplace areas due to a nuclear accident, Radiat. Prot.Dosim., 50, 145–152, 1993.
Chino, M., Nakayama, H., Nagai, H., Terada, H., Katata, G., andYamazawa, H.: Preliminary estimation of release amounts of131I and 137Cs accidentally discharged from the FukushimaDaiichi nuclear power plant into the atmosphere, J. Nucl. Sci.Technol., 48, 1129–1134, 2011.
CIESIN/CIAT/SEDAC: Gridded Population of the World, Version3 (GPWv3),http://sedac.ciesin.columbia.edu/gpw, 2005.
Hilton, J., Cambray, R., and Green, N.: Chemical fractionation ofradioactive caesium in airborne particles containing bomb fall-out, Chernobyl fallout and atmospheric material from the Sell-afield site, J. Environ. Radioactiv., 15, 103–111, 1991.
IAEA: International Nuclear and Radiological Event Scale UserManual, Vienna, 2009.
International Atomic Energy Agency (IAEA): Regulations for theSafe Transport of Radioactive Material, IAEA Safety Require-ments, no. TS-R-1, Vienna, 2005.
International Atomic Energy Agency (IAEA): Environmental Con-sequences of the Chernobyl Accident and Their Remediation:Twenty Years of Experience, IAEA, Vienna, 2006.
International Atomic Energy Agency (IAEA): Regulations for theSafe Transport of Radioactive Material, IAEA Safety Require-ments, no. TS-R-1, Vienna, 2009.
Jeuken, A., Siegmund, P., Heijboer, L., Feichter, J., and Bengtsson,L.: On the potential assimilating meteorological analyses in a
global model for the purpose of model validation, J. Geophys.Res., 101, 16939–16950, 1996.
Jockel, P., Sander, R., Kerkweg, A., Tost, H., and Lelieveld, J.: Tech-nical Note: The Modular Earth Submodel System (MESSy) - anew approach towards Earth System Modeling, Atmos. Chem.Phys., 5, 433–444,doi:10.5194/acp-5-433-2005, 2005.
Katata, G., Terada, H., Nagai, H., and Chino, M.: Numerical recon-struction of high dose rate zones due to the Fukushima DaiichiNuclear Power Plant accident, J. Environ. Radioactiv., 111, 2–12,2012.
Katata, G., Ota, M., Terada, H., Chino, M., and Nagai, H.: At-mospheric discharge and dispersion of radionuclides during theFukushima Dai-ichi Nuclear Power Plant accident. Part I: Sourceterm estimation and local-scale atmospheric dispersion in earlyphase of the accident, J. Environ. Radioactiv., 109, 103–113,2012.
Kerkweg, A., Buchholz, J., Ganzeveld, L., Pozzer, A., Tost, H., andJockel, P.: Technical Note: An implementation of the dry removalprocesses DRY DEPosition and SEDImentation in the Modu-lar Earth Submodel System (MESSy), Atmos. Chem. Phys., 6,4617–4632,doi:10.5194/acp-6-4617-2006, 2006.
Lelieveld, J., Bruhl, C., Jockel, P., Steil, B., Crutzen, P. J., Fis-cher, H., Giorgetta, M. A., Hoor, P., Lawrence, M. G., Sausen,R., and Tost, H.: Stratospheric dryness: model simulationsand satellite observations, Atmos. Chem. Phys., 7, 1313–1332,doi:10.5194/acp-7-1313-2007, 2007.
Masson, O., Baeza, A., Bieringer, J., Brudecki, K., Bucci, S., Cap-pai, M., Carvalho, F., Connan, O., Cosma, C., Dalheimer, A.,et al.: Tracking of airborne radionuclides from the damagedFukushima Dai-ichi nuclear reactors by European networks, En-viron. Sci. Technol., 45, 7670–7677, 2011.
MEXT: Japanse Ministry of Education, Culture, Sports, Scienceand Technology,http://www.mext.go.jp/english, 2011.
Morino, Y., Ohara, T., and Nishizawa, M.: Atmospheric behav-ior, deposition, and budget of radioactive materials from theFukushima Daiichi nuclear power plant in March 2011, Geo-phys. Res. Lett, 38, L00G11,doi: 10.1029/2011GL048689,2011.
Roeckner, E., Bauml, G., Bonaventura, L., Brokopf, R., Esch,M., Giorgetta, M., Hagemann, S., Kirchner, I., Kornblueh,L., Manzini, E., Rhodin, A., Schlese, U., Schulzweida, U.,and Tompkins, A.: The atmospheric general circulation modelECHAM5.PART I: Model description, Technical report, MaxPlanck Institute for Meteorology, 2003.
Roeckner, E., Brokopf, R., Esch, M., Giorgetta, M., Hagemann, S.,Kornblueh, L., Manzini, E., Schlese, U., and Schulzweida, U.:Sensitivity of simulated climate to horizontal and vertical reso-lution in the ECHAM5 atmosphere model, J. Clim., 19, 3771–3791, 2006.
Simmons, A., Uppala, S., Dee, D., and Kobayashi, S.: ERA-Interim:New ECMWF reanalysis products from 1989 onwards, ECMWFnewsletter, 110, 25–35, 2007.
Stoehlker, U., Nikkinen, M., and Gheddou, A.: Detection of ra-dionuclides emitted during the Fukushima nuclear accidentwith the CTBT radionuclide network, Monitoring Research Re-view: Ground-Based Nuclear Explosion Monitoring Technolo-gies, 715–724, 2011.
Stohl, A., Hittenberger, M., and Wotawa, G.: Validation of the La-grangian particle dispersion model FLEXPART against large-
www.atmos-chem-phys.net/13/1425/2013/ Atmos. Chem. Phys., 13, 1425–1438, 2013
1438 T. Christoudias and J. Lelieveld: Global atmospheric modeling of Fukushima radioactivity
scale tracer experiment data, Atmos. Environ., 32, 4245–4264,1998.
Stohl, A., Seibert, P., Wotawa, G., Arnold, D., Burkhart, J. F., Eck-hardt, S., Tapia, C., Vargas, A., and Yasunari, T. J.: Xenon-133 and caesium-137 releases into the atmosphere from theFukushima Dai-ichi nuclear power plant: determination of thesource term, atmospheric dispersion, and deposition, Atmos.Chem. Phys., 12, 2313–2343,doi:10.5194/acp-12-2313-2012,2012.
Takemura, T., Nakamura, H., Takigawa, M., Kondo, H., Satomura,T., Miyasaka, T., and Nakajima, T.: A numerical simulationof global transport of atmospheric particles emitted from theFukushima Daiichi Nuclear Power Plant, Sola, 7, 101–104, 2011.
Ten Hoeve, J. and Jacobson, M.: Worldwide health effects of theFukushima Daiichi nuclear accident, Energ. Environ. Sci., 5,8743–8757, 2012.
Terada, H., Katata, G., Chino, M., and Nagai, H.: Atmospheric dis-charge and dispersion of radionuclides during the FukushimaDai-ichi Nuclear Power Plant accident. Part II: verification of thesource term and analysis of regional-scale atmospheric disper-sion, J. Environ. Radioactiv., 112, 141–154, 2012.
Tost, H., Jockel, P., Kerkweg, A., Sander, R., and Lelieveld, J.: Tech-nical note: A new comprehensive SCAVenging submodel forglobal atmospheric chemistry modelling, Atmos. Chem. Phys.,6, 565-574,doi:10.5194/acp-6-565-2006, 2006.
Tost, H., Jockel, P., Kerkweg, A., Pozzer, A., Sander, R.,and Lelieveld, J.: Global cloud and precipitation chem-istry and wet deposition: tropospheric model simulationswith ECHAM5/MESSy1, Atmos. Chem. Phys., 7, 2733–2757,doi:10.5194/acp-7-2733-2007, 2007.
UCAR/NCAR/CISL/VETS: The NCAR Command Lan-guage (Version 6.0.0) [Software], Boulder, Colorado,doi:10.5065/D6WD3XH5, http://dx.doi.org/10.5065/D6WD3XH5, 2012.
Winiarek, V., Bocquet, M., Saunier, O., and Mathieu, A.: Es-timation of errors in the inverse modeling of accidental re-lease of atmospheric pollutant: Application to the reconstruc-tion of the cesium-137 and iodine-131 source terms from theFukushima Daiichi power plant, J. Geophys. Res., 117, D05122,doi:10.1029/2011JD016932, 2012.
Atmos. Chem. Phys., 13, 1425–1438, 2013 www.atmos-chem-phys.net/13/1425/2013/
![Fukushima Dai-Ichi Nuclear Accident Analysis How much do ... · Before Fukushima Dai-ichi Nuclear Accident [Afterthoughts] Less attentions to BDBAs and BDBEs, e.g., devastating tsunami](https://img.pdfslide.net/doc/110x75/5f8ac5453fdf0878a818486a/fukushima-dai-ichi-nuclear-accident-analysis-how-much-do-before-fukushima-dai-ichi.jpg)