Embed Size (px)
Citation preview

Modelling the Impact of Workforce Change in Social
Services
Sally Brailsford1, Pei Shan Ang1 and Peter Knight 2
1 School of Management, University of Southampton, UK2 Hampshire Social Services, UK
ORAHS 32, Wrocław, Poland, 23-28 July 2006

Basingstoke
Portsmouth

Hampshire Social Services• One of the biggest Departments in England: over
5,000 staff, annual turnover over £300M• Serves population of over 1.2 million people• Divided into 7 regions • Proportion of people over 85 is higher than the
national average and is continuing to grow• Nationally, people over 65 use around 40% of the
NHS budget and 50% of the Social Services budget

Equipment services• HCC SSD provides services to enable elderly
and disabled people to maintain independence and autonomy in their daily lives
• Professional assessment service and the loaning of special equipment
• Equipment provision service run by the Integrated Community Equipment Service
• Two centres in the Hampshire region:– Hampshire Joint Equipment Store (JES) in
Basingstoke– Portsmouth Community JES

Current process
• Client’s needs assessed by Occupational Therapist (OT)
• OT orders equipment from JES or substore• Equipment delivered by van• OT makes second visit to demonstrate
equipment and train client in its use: may involve some reassessment

Yes
No
Yes
No
Yes
No
No
Start
Client phones OT Direct
Self assessment?
Staff arranges for OT visit
OT assesses and orders equipment
More than 3 items selected?
OT Direct (trained staff) processes order
JES receives order(via fax, e-form, post, hand)
Self collection?
Yes
Drivers receive tickets in the afternoon
Normal delivery: Within 7-10 working daysUrgent delivery : Within 3 working daysCollection : Within 2 weeks
Client collects items
Sub-store has inadequate stock
Sub-store makes order/ System shows that certain stocks are below standard
level
JES allocate equipment
Delivery and collection tickets being printed
Assessment through OT Direct/ Equipment collection?
OT visit clients and demonstrate equipment
End
Client waits
OT (or district nurse) visit client
OT (or district nurse) assesses client and orders equipment

Current Problems
• Shortage of OTs• Even the most basic equipment currently has
to be demonstrated by an OT • Long waiting times between assessment by
an OT and receiving the equipment and being able to use it
• Inappropriate use of the OTs’ expert skills• Problem likely to get worse in future

Potential Solution
• Train van drivers to install and demonstrate equipment
• Implications: costs of training and temporary cover for van drivers; need to recruit additional drivers; possible resistance from OT’s
• Key question: which specific equipment (of the 900 – 1000 types held in the JES) would it be safe for drivers to demonstrate?
Study Objectives
• To determine the optimum number of additional drivers that need to be recruited to maintain the current level of performance and to take on these additional duties
• To obtain the overall cash value of the time saving to OT’s from adopting this approach which enables them to focus their time and skills more appropriately

Modelling approach• Discrete-event simulation
– Need to allow for variability of input variables.– Allows users to forecast the impact of different
scenarios by asking ‘what if’ questions.– Graphical interface as a better communication tool .– Determine number of drivers needed after
implementing the proposal.
• Spreadsheet model– Convenient “front end” for user to experiment with
Simul8 model– To carry out the cost benefit analysis of this proposal.

Data Requirements
– Equipment groups– Demand (order arrival rate)– Client numbers– Travel time – Demonstration time – Proportion of clients with special conditions– Maximum hours drivers available for delivery/
collection– Sub-stores replenishment– Costs

Equipment Groups
• Different categories for each JES
• Categorized, after discussions with OTs, by the following criteria:– Equipment in the same group should have
similar demonstration time – Desirable to have equipment of a similar
function in the same group
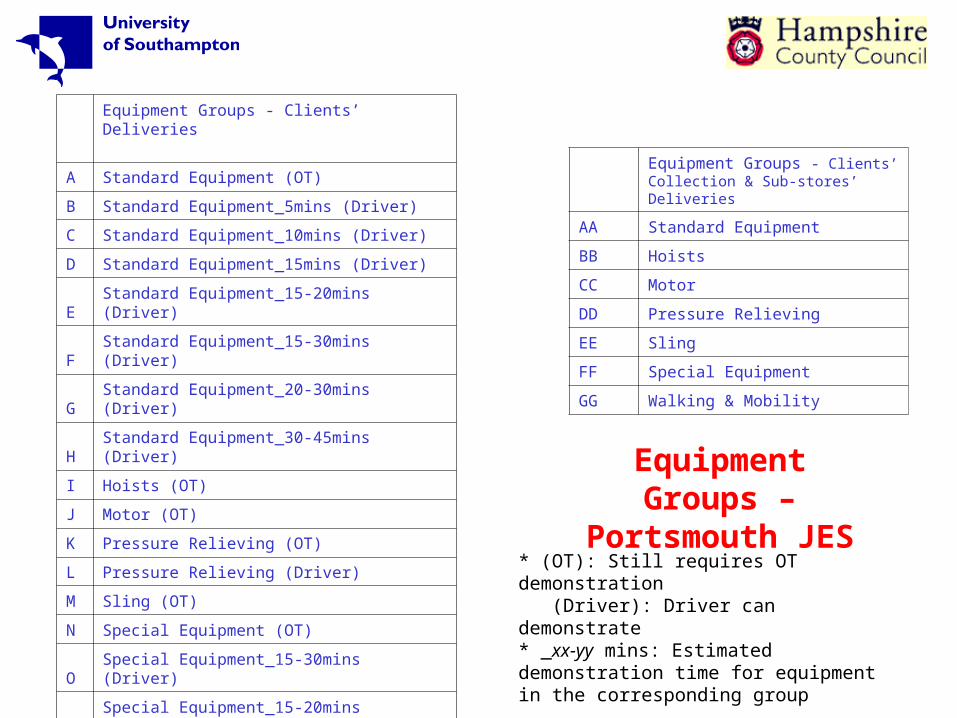
Equipment Groups - Clients’ Deliveries
A Standard Equipment (OT)
B Standard Equipment_5mins (Driver)
C Standard Equipment_10mins (Driver)
D Standard Equipment_15mins (Driver)
E Standard Equipment_15-20mins (Driver)
F Standard Equipment_15-30mins (Driver)
G Standard Equipment_20-30mins (Driver)
H Standard Equipment_30-45mins (Driver)
I Hoists (OT)
J Motor (OT)
K Pressure Relieving (OT)
L Pressure Relieving (Driver)
M Sling (OT)
N Special Equipment (OT)
O Special Equipment_15-30mins (Driver)
P Special Equipment_15-20mins (Driver)
Q Walking & Mobility (OT)
R Walking & Mobility (Driver)
* (OT): Still requires OT demonstration (Driver): Driver can demonstrate * _xx-yy mins: Estimated demonstration time for equipment in the corresponding group
Equipment Groups - Clients’ Collection & Sub-stores’ Deliveries
AA Standard Equipment
BB Hoists
CC Motor
DD Pressure Relieving
EE Sling
FF Special Equipment
GG Walking & Mobility
Equipment Groups –
Portsmouth JES
Demand and Travel Time
• Demand data – obtained from the Primary Care Trust Group
Reports and Store Activity Reports– analysed based on each group– distributions fitted using BestFit
• Travel time from work place to client or from client to client limits the maximum number of clients that a driver or OT can reach in a day

Demonstration time
• Vital in deciding the additional task time required from drivers and time saved in OTs
• Drivers will be up to 25% quicker than OTs (on average) in demonstration time, as they will not be reassessing the clients

Other data
• Clients with special conditions– Drivers might be less suitable to demonstrate to
certain clients, e.g. amputees, or clients with terminal conditions, Parkinsons disease etc
• Maximum hours drivers available for delivery/ collection– A main determinant of the total duties that can be
performed by a driver.
• Training and staffing costs

The Simul8 model

Three scenarios
• Permanent drivers do not cross-task (swap jobs with other drivers); No agency drivers
• Permanent drivers do not cross-task; Agency drivers will be employed when needed
• Permanent drivers cross-task; No agency drivers

Results – Basingstoke JES
Costs Permanent Agency Driver
Scenario Value (£) Driver Lower Limit Average Upper Limit
i 10968.75 13 - 0 -
ii 10720.76 12 62.73 66.20 69.66
iii 10968.75 13 - 0 -
Best combination 10720.76 12 62.73 66.20 69.66
OTs' time saved 677.66 695.45 713.25

Results – Portsmouth JES
Costs Permanent Agency Driver
Scenario Value (£) DriverLower Limit Average Upper Limit
i 6750.00 8 - 0.00 -
ii 6209.85 7 29.16 33.73 38.31
iii 6750.00 8 - 0.00 -
Best combination 6209.85 7 29.16 33.73 38.31
OTs' time saved 299.93 320.47 341.00
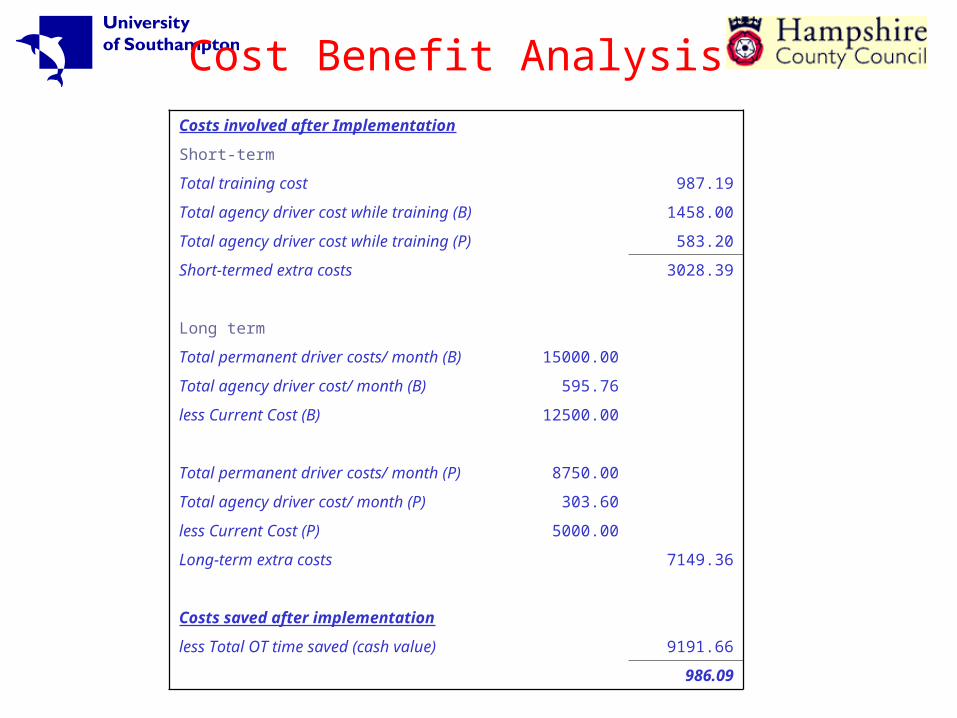
Costs involved after Implementation
Short-term
Total training cost 987.19
Total agency driver cost while training (B) 1458.00
Total agency driver cost while training (P) 583.20
Short-termed extra costs 3028.39
Long term
Total permanent driver costs/ month (B) 15000.00
Total agency driver cost/ month (B) 595.76
less Current Cost (B) 12500.00
Total permanent driver costs/ month (P) 8750.00
Total agency driver cost/ month (P) 303.60
less Current Cost (P) 5000.00
Long-term extra costs 7149.36
Costs saved after implementation
less Total OT time saved (cash value) 9191.66
986.09
Cost Benefit Analysis

Payback Period
Time Net Cash Cumulative Payback Month
(Month) Flow Cash Flow
0 Costs spent -3028.39 -3028.39
1 Costs spent 2042.30 -986.09
2 Costs saved 2042.30 1056.21 Payback Month
3 Costs saved 2042.30 3098.51
4 Costs saved 2042.30 5140.81
5 Costs saved 2042.30 7183.11
6 Costs saved 2042.30 9225.41
7 Costs saved 2042.30 11267.71
8 Costs saved 2042.30 13310.01
9 Costs saved 2042.30 15352.31
10 Costs saved 2042.30 17394.61
11 Costs saved 2042.30 19436.91
Conclusions
• Both JES need additional drivers if drivers are taking over part of the demonstration tasks from OTs
• This proposal will save OT time equating to a cash value of approx £9200 per month
• The payback period is less than two months

Thanks are due to
• Frances Farrar, Kevan Dyne and Richard Jarczyk from the Portsmouth JES
• Dr. Maxwell Chipulu and Korina Katsaliaki from the University of Southampton
• Many other HSS staff (OTs and drivers) who were involved directly or indirectly in this project