Embed Size (px)
Citation preview

NORTHWESTERN UNIVERSITY
Models and Studies of Self-assembled Systems Using High Information Polymer
Coated Particles
A DISSERTATION
SUBMITTED TO THE GRADUATE SCHOOL
IN PARTIAL FULFILLMENT OF THE REQUIREMENTS
for the degree
DOCTOR OF PHILOSOPHY
Field of Applied Physics
By
Martin Girard
EVANSTON, ILLINOIS
September 2018

2
c⃝ Copyright by Martin Girard 2018
All Rights Reserved

3
ABSTRACT
Models and Studies of Self-assembled Systems Using High Information Polymer Coated Particles
Martin Girard
Systems of colloids coated with high-information polymers are powerful tools for designing crystal
lattice with tailorable properties or studying the fundamentals of crystallization. By changing the
colloid-colloid interaction strength or colloid shape, different types of lattices can be assembled.
In this thesis, I present novel coarse-grained models to describe high-information polymer coated
colloids in simulation and use various explicit chain models to study experimental systems.
Chapter 2 presents a static model based on orbital descriptions that enable calculation of ar-
bitrary interaction potentials and colloid shape. This is intended to alleviate the need for explicit
chains in coarse-grained simulations. I show that this model enables computation of assembly of
Janus particles with charges on the surface interacting through Yukawa potential.
Chapter 3 extends this orbital model for time-varying orbitals based on an expansion around
equilibrium. I revisit the pathological cases observed in assembly of polymer-coated cubes where
shell deformation induces phase changes.
Chapter 4 presents the phases observed for various polyhedron colloids coated with deoxyri-
bonuclic acid (DNA). Short DNA enforces packing according to the shape of particle core, while
long DNA induces spherical-like packing. For cubes, we find that the system transitions from one

4
cubic phase to another by breaking symmetry into a tetragonal phase. This is due to deformation
of the colloids’ DNA shells.
Chapter 5 presents kinetic Wulff shapes obtained from growth of hexagonal AB2 type crys-
tals, which grow in long hexagonal prisms. Unlike usual kinetic products, the shape is highly
reproducible. We show that assembly into hexagonal rods happens due to energy barriers between
different surface layers with identical Miller indices.
Chapter 6 presents a study on colloid crystal size obtained as a function of salt concentration.
In particular, experiments find that the mean crystal size drastically increases when concentration is
raised to 1M. Based on simulation results, we find that this is due to an increase of the attachment
barrier between two colloids. This increase results in a slower attachment and nucleation rates,
which effectively means that diffusion is faster. The interface-limited to diffusion-limited transition
for individual colloids thus happens at a larger crystallite size, resulting in a faster growth of
individual colloids at constant nucleation rate.
Chapter 7 introduces the concept of metallic bonding in self-assembled crystals. Previously
studied crystals had defined positions for all colloids in the crystal. By mixing the usual colloids
with much smaller ones (≤ 2 nm), we find that these small particles stop holding defined crystallo-
graphic positions and instead roam the crystals, similar to electrons in a classical metal. We define
metallicity as translation entropy of small particles and explain system behavior with analogies
from band structure of solid-state physics. We also find that there is a Mott-like transition of these
particles with changes in temperature. At low temperatures, the electron condensates in defined
crystallographic positions corresponding to complex metal alloys or intermetallics.

5
Acknowledgments
First and foremost, I would like to acknowledge the continued support throughout the years
from my advisor, Prof. Monica Olvera de la Cruz. I have been very lucky in finding an advisor
with whom I could build such a good relation and explore many different aspect of physics. I also
want to thank the members of my committee, Prof. Erik Luijten and Prof. Chad A. Mirkin for
taking the time to review this document; and also the good collaborative works with Prof. Mirkin.
I had excellent experimental collaborators from the group of Prof. Mirkin who I would like
to acknowledge, in particular, Matthew O’Brien, Eileen Soyoung Seo, Anindita Das and Shunzhi
Wang. Working with them got me to look at very interesting problems that I wouldn’t had gotten
the chance otherwise. It also led to very interesting discussions on how to connect simulations with
experiments.
I would also like to thank the past and present members of the Olvera group, especially people
I had collaborative works with, Trung Dac Nguyen, Jaime Millan, Yaohua Li, Meng Shen and
Aykut Erbas. I also would like to acknowledge the early mentorship of Ting Li. A special mention
for Annaliese Ehlen for reviewing the English of this work.
Last, I would like to acknowledge my parents for continued support throughout the years.

6
Table of Contents
ABSTRACT 3
Acknowledgments 5
List of Tables 9
List of Figures 10
Chapter 1. Introduction 14
1.1. High-information polymers 15
1.2. Previous work in self-assembled systems 16
1.3. Electromagnetism and tailoring optical properties in periodic solids 19
1.4. Outline of this thesis 21
Part 1. Modeling polymer-coated anisotropic bodies 24
Chapter 2. Orbitals for classical arbitrary anisotropic colloidal potentials 27
2.1. Abstract 27
2.2. Introduction 28
2.3. Field representation of pairwise potentials 30
2.4. Results and discussion 39
2.5. Conclusion 45
Acknowledgement 47

7
A. Equivalence between multipole expansions 47
B. Field equations from stretched exponential functions 49
C. Vector fields 50
D. Excluded volumes and Van der Waals gas 51
E. Supplementary data for the liquid-gel transition 53
Chapter 3. Time dependent orbitals for coarse-grained polymer-coated colloids 56
1. Abtract 56
2. Introduction 57
3. Mathematical formalism 59
4. Numerical Implementation 62
5. Polymer-coated spheres as a model 65
6. Future work 66
Part 2. Physics of real self-assembled systems 69
Chapter 4. Exploring the zone of anisotropy and broken symmetries in DNA-mediated
nanoparticle crystallization 72
1. Abstract 72
2. Body 72
Chapter 5. Kinetically Controlled Non-Equilibrium Anisotropic Colloidal Single Crystal
Growth 84
1. Abstract 84
2. Body 85
3. Methods Summary 97

8
4. Acknowledgments 98
5. Supplementary information 99
Chapter 6. The Role of Salt and Repulsion in the Hybridization Kinetics of DNA-
Functionalized Nanoparticles 108
1. Abstract 108
2. Body 109
3. Associated content 119
4. Acknowledgements 120
5. Supplementary information 120
Chapter 7. Electron - atom duality of nanoparticles in DNA-guided assembly 128
1. Abstract 128
2. Body 128
Chapter 8. Conclusions and future work 137
References 140

9
List of Tables
5.1 Relative difference in surface energy values between different layers calculated for
DNA-gold nanoparticle superlattices 99
5.2 DNA Lengths and Equilibrated Lattices 100
5.3 Summary of Multiplicity of Different Set of Miller Indices 101
5.4 Effective Surface Energy Values Calculated AB2 Superlattice 102
5.5 Slab Calculation Values for Different Terminations 102
10
List of Figures
1.1 Schematic of the DNA sequences used in used in [1] 17
2.1 Representation of the surface function ρ(S) for two interacting particles of arbitrary
orientations, where blue indicates ρ = 0 and red indicates ρ = 1. 37
2.2 Strong scaling performance on the Titan XK7 supercomputer 40
2.3 Relative error of the average energy of the system as a function of the number of
tessellation points 41
2.4 Snapshots of the simulations in different morphologies for Janus particles 43
2.5 Regions of observed morphologies in simulations of charged Janus colloids 44
2.6 Snapshots of the simulations of charged Janus particles 54
2.7 Pair correlation functions for different temperatures for the asymmetric (θm = 1.40) Janus
particles for λ = 0.32. 55
3.1 Error as defined by equation 3.10 as a function of polymer length (left) and coating density
(right). Color indicate coating density and length respectively 66
3.2 Energy spectrum of fluctuations around a sphere grafted with varying number of polymers 67
3.3 Energy spectrum of the normal modes 67
4.1 Polyhedral nanoparticles with different symmetries can be functionalized with DNA and
used as building blocks to study nanoscale crystallization processes 74
11
4.2 Crystallization behavior of high symmetry polyhedra 76
4.3 Experimental investigation into cube crystallization 80
4.4 MD simulations of cube crystallization 81
5.1 Hexagonal prism microcrystals formed from DNA-functionalized nanoparticles 89
5.2 Hexagonal prisms with varying unit cell compositions 91
5.3 Surface features of hexagonal prism microcrystals 92
5.4 Hexagonal prisms produced upon addition of off-stoichiometric ratios of PAEs 94
5.5 Kinetics of epitaxial growth of alternating layers of A and B calculated using Monte-Carlo
simulations (e = 0.65kBT , ∆µ = −0.3kBT ) 96
5.6 Simulation snapshots of a, a perfect 3D crystal with 6 × 6 × 6 unit cells, and b and c,
surface slabs showing two different terminations of the (0001) plane. 100
5.7 Wulff polyhedra simulated for different systems 103
5.8 Wulff equilibrium shape is predicted for the case when the growth velocity of the
AB2(1010) is assumed to be very slow 104
5.9 Mean surface height of the thin film graphed as a function of time for the case
∆γAB = 0.198kBT . Even (odd) number of monolayers correspond to low (high) energy
surfaces. 106
5.10Mean time between sequential nucleation events and mean surface growth velocity 107
6.1 (A) A snapshot of two complementary PAEs at different salt concentrations in simulations.
The centers of the 15-nm nanoparticles are 370 apart in this snapshot. (B) Pair potential
energies between complementary PAEs were calculated across a range of interparticle
distances. PAEs exhibit a well-defined equilibrium interparticle distance at potential

12
minimum. At an interparticle distance of 380 A, the attachment barrier peaks; this
increases with increasing salt concentration. (C) Mean crystal size obtained without
coarsening as a function of the attachment rate to the surface. 112
6.2 Williamson-Hall analysis of SAXS data 114
6.3 Transmission electron microscopy (TEM) images of a thin (∼100 nm) section of
silica-encapsulated microcrystals 117
6.4 (A) The bcc unit cell lattice parameter at different salt concentrations. (B) The change in
lattice parameters induced by salt is reversible. Courtesy of Eileen Soyoung Seo 118
6.5 The distribution of normalized crystal size for attachment rates of 0.0016, 0.011 and 0.55.
Evolution towards a narrow negative-skew distribution for increasing attachment rates is
clearly seen. Histogram is obtained from raw data while curves are estimated from the
kernel density estimation. 125
6.6 (A) The number of crystals as a function of time for two values of kcoal, clearly showing
the initial growth and subsequent coarsening. (B) The distribution of crystal sizes during
the coarsening with kcoal = 10−6 for different times. The curve shows a second peak for
intermediate times. Attachment rate is set to 0.5456. 127
7.1 SAXS patterns and TEM of (A) BCC (B) FCC and (C) A15 lattices composed of DNA
conjugated AuNPs (10 nm diameter) and AuNCs. BCC to FCC transition with increasing
valency in (D) 10 nm- and (E) 15 nm- and (F) 20nm AuNP-AuNC systems. Courtesy of
Anindita Das 131
7.2 (A) Metallicity as a function of valency obtained from simulations of BCC (left), FCC
(middle) and A15 (right) phases at temperatures of kBT = 1.3. For PAE grafted with

13
a large number of strands minimums are clearly seen, corresponding to ideal compound
stoichiometric ratios (B) Metallicity as a function of temperature for BCC (valency of 6),
FCC (valency of 10) and A15 (valency of 5). The degree of metallicity increases with
temperature and is clearly controllable. 133
7.3 Boltzmann volumes constructed from four equally probable partitions of space as a
function of linker number and metal valency. Crystal lattices are reconstructed by taking
1/8th of individual unit cells and using the cubic mirror planes to obtain global symmetries
for BCC (left), FCC (center) and A15 (right) lattices. Position of large particles are
indicated in red but are not to scale. Temperature is set to kBT = 1.30. Images are
numerically smoothed by Gaussian blur for visualization purposes. Missing data indicates
numerically unstable phases. 134
7.4 Boltzmann volumes of compound lattices for AB6 lattice (BCC), A4B40 lattice (FCC),
A8B46 lattice (A15) and A8B80 lattice (A15), viewed from side (A) and top (B). Cubic
unit cell is drawn for clarity 135

14
CHAPTER 1
Introduction
The work in this thesis focuses on self-assembled crystals. We define these as structures that
spontaneously assembles upon some external change such as cooling the samples. This approach
is called bottom-up as we only design the colloids to be able to take a predefined structure. There
are a few benefits from this, notably that we are free of lithography and fabrication scales very well.
I explore various factors that influence the resulting crystals: particle shape, salt concentration in
the solution and grafting number. These factors can be used to drive the resulting crystal lattices,
habits or even to form metallic-like bonds. The tunability of our system let us continuously vary
quantities that are discrete in atomic crystals such as metallic valency.
Colloidal crystals are assemblies of colloids (particles of size 1− 100 nm) into structures with
a well defined periodicity. Colloids can be made out of many different materials, from metals
like gold to polymers like polystyrene to proteins. They may also be coated with ligands, such as
alkanes or other polymers.
While it is also possible to form glasses from these colloids, those are generally the result of
fast kinetic processes which are extremely hard to reproduce with high fidelity. On the simulation
side, glasses generally represent non-equilibrium systems with long relaxation times which are
very hard to simulate properly and even harder to correctly relate to experiments.
Before I head in detailed discussions, it is worthwhile to address the issue of why. After all,
colloidal crystals have been around for a long time, studied by Langmuir in [2] and evidently the
appearance of crystals is not the main discovery here. Rather, the main focus of high information

15
polymers is how, as we are interested in creating colloidal crystals with some specific properties.
These may be varied, but typically are composition, symmetry and lattice spacing. This kind
of problem, where we have prescribed an end result, is known as an inverse problem. They are
typically much harder than direct problems; figuring out if some colloids will assemble is easier
than determining which kind of colloid will assemble into a specified structure.
Overall, we can distinguish two general goals in building these crystals. The first is from an
engineering point of view and relates to where we can actually use these crystals. This is typically
tied to to optical properties, for which I provide a general description later on in this chapter. A
general statement is that optical properties of these crystals are dependent on the lattice and internal
composition. The second goal is much more fundamental and relates to understanding the physical
foundations of crystal formation. This is particularly true for the crystal lattices corresponding to
complex metal alloys or intermetallics. In the atomic variant of these systems, it is not clear at
all why they form in the first place. Considering that they appear in self-assembled systems, the
dna-guided assembly platform may be suitable as a testing platform. We can directly tune valency,
particle size, interaction strength in our system, while atomic systems are limited by the available
elements.
1.1. High-information polymers
This work focuses on assembled structures of colloids coated with high-information polymers,
but we still have to define what they are and why they are interesting. For the scope of this thesis,
we will define as high-information any polymer which is composed of multiple monomer types,
each of which has only a single other monomer type to which it can bind. We also require that each
of the monomers have at most a single bond at any given time. The classical case, DNA is a chain
of alternating sugars and phosphates. Each sugar unit is bonded to a nucleic base, denoted by A,
16
T, C or G, where the pairs AT and CG can form, but any other pair does not. The other archetypal
case is ribonucleic acid, a similar polymer where an extra hydroxyl group is present in the sugar
and the T base is replaced by U. We will exclude polypeptides, polymers composed of 21 different
amino acid monomers, as interactions between different monomers are not highly specific.
High information polymers are used for their specific interactions. The binding energy of
different colloids can be precisely controlled. For instance, in a ternary mixture of colloids A, B
and C grafted with different DNA sequences, we can independently tune the interactions A-B, B-C
and A-C. This control leads to tunable melting temperature as it is directly linked to the binding
energy.
With this in mind, we can use these polymer grafted colloids to either tackle the inverse prob-
lem of constructing crystals with specific properties or study the fundamentals of crystal forma-
tion. Control over interactions and lack of quantum behavior of the building blocks render high
information polymers a spectacular platform for looking at physics of crystals. In particular, we
demonstrate in chapter 7 that self-assembled systems can show behavior akin to Mott transitions
observed in regular solids. Unlike atomic metal-insulator transitions, this is a localization of col-
loids in specific lattice sites corresponding to intermetallic phases.
1.2. Previous work in self-assembled systems
As mentioned before, self-assembled systems of high-information polymers have been made
before. The first realization of single crystals is already a few years old [3], but it is worthwhile to
go over the basic science that allows us to assemble artifical crystals. In the DNA-guided assembly,
colloids are coated with DNA strands, which are composed of a double-stranded region in the
middle capped by two single-stranded regions (see figure 1.1).

17
Figure 1.1. DNA sequences used in used in [1]. AuNPs were functionalized with 58 ±5 (10-nm AuNPs) or 12 ± 3 (5-nm AuNPs) strands of DNA Sequence 1, linked via a5’ hexyl-thiol moiety. Crystals were formed via the addition of linker sequences with a3’ end complementary to the Au-bound DNA, a single flexor base used to increase DNAstrand flexibility, and a 5’ end that is either self-complementary (FCC crystals) or non-self-complementary (BCC crystals). Figure reproduced from [1]
The single-stranded sequence near the end (sticky end) can be chosen to be complementary to
itself (single component, self-complementary systems) or to another sequence (binary systems).
When the temperature is dropped below the melting point of the sticky end, strands from two dif-
ferent colloids hybridize leading to crystallization of the system. In order to obtain single crystals,
the cooling rate has to be slow enough to allow for rearrangements of building blocks [3]. Rapid
cooling leads to either multigrain aggregates or glassy materials. Single crystals made of building
blocks differing only by the sequence of their sticky ends form shapes dictated by equilibrium
Wulff construction. This construction method is a minimization of the surface energy of a crystal
at a fixed volume. For instance, the binary system of [3] forms BCC lattices which crystallizes in
rhombic dodecahedrons.
Self-complementary spheres do not show much tunability as only the ratio between DNA
length and particle core size can be changed. Nevertheless, two distinct regimes are observed.
For short DNA, the spheres crystallize into close packed structures (FCC) to maximize enthalpy.

18
For long and flexible DNA chains, the structure assembled is controlled by the entropy of chains
grafted. This entropy corresponds to a maximization of the free volume of the chains and keeps
the DNA brush on the surface as spherical as possible. This induces a transition from FCC to BCC
[4]. This regime has not been fully explored for the binary systems at this point.
The phase diagram for binary spherical nucleic acid coated particles is published [5]. Un-
like self-complementary particles, binary system offer control over particle size ratios as well as
DNA grafting number ratio. Phases obtained are generally understood through maximization of
hybridization in the system. For this reason, binary systems can assemble into a variety of different
crystal phases ranging from BCC to Cr3Si. One should note that all binary phases obtained from
spherical particles are of very high symmetry: with the exception of AB2 type lattices, they are all
cubic.
In order to further expend the number of available lattices, the next step is to use anisotropic
building blocks. This has been made possible by advances in synthesis of monodisperse particles
[6, 7]. Early experiments using gold particles have shown potential control over crystal lattice by
use of these anisotropic building blocks [8]. A systematic study of polyhedral anisotropic building
blocks constitutes a chapter presented further on in this thesis. Other types of anisotropic building
blocks include proteins where very specific sites on the surface can be coated with DNA[9].
Epitaxy is another technique that we can borrow from atomic crystal growth. In regular crys-
tals, this refers to growth of a crystal on top of another crystalline substrate. Many variants of the
technique exists (see [10] for a complete description), but the relevant ones are liquid phase epitaxy
and molecular beam epitaxy. The first is a fairly old technique, commonly used in industry to grow
ternary or quaternary compounds on top of gallium arsenide substrate. The second achieves growth
by flowing atoms onto a substrate at very low pressure. While the assembly of colloids is done in
liquid phase (water), the concentration of particles in solution is low and thus the process is similar

19
to molecular beam epitaxy (MBE). For instance, pressure can be controlled by the concentration
of colloids in water just as in MBE but, as in liquid phase epitaxy, temperature of the substrate
and colloids cannot be controlled independently. In our colloidal system, our substrates can be
patterned with posts emulating a crystal surface and coated with DNA strands. Regular particles
with complementary strands can then be added to the solution, enabling a layer-by-layer growth
in liquid phase [11]. This makes epitaxy a convenient tool to study crystallization processes as
dynamics of the colloids are much slower and easier to probe than regular atoms. However, ad-
ditional differences arises due to the soft coating. The resulting crystal tolerates very high lattice
mismatch, for instance in [12], and requires films to be “stapled” to achieve growth of multiple
layers (see [11]).
On the simulation side, my predecessors and others have built viable coarse-grained models
for these systems [13, 14] and conducted many simulations showing quantitative agreement with
experimental results [14, 3], yielding a high degree of confidence in these models. For systems
containing explicit ions (well defined positions for ions), other developed models can be used with
high confidence in the results [15, 16]. I did not have to develop any force-fields since existing
models were sufficiently good for our purposes.
1.3. Electromagnetism and tailoring optical properties in periodic solids
These crystals can be made relevant for many applications by tailoring interactions with light.
Optical modes are usually calculated in the first cell of reciprocal space, the Brillouin zone, as it
is sufficient to describe all available modes. Any strong interaction between light and the periodic
lattice must take place near a high symmetry point, excluding the limit ω → 0 near the Γ point. For
light propagating in periodic solids we can distinguish two relevant regimes. Denoting the light
wavelength by λ and lattice spacing Λ, these regimes are Λ ≪ λ and Λ ∼ λ/2.

20
The regime Λ ≪ λ produces what is known as effective materials. In this regime, the Bril-
louin zone is infinite and light does not interact with the lattice, only with the mean value of the
constituents. The whole systems behaves just as if the permittivity, ϵ(r), is constant throughout the
crystal. For visible light wavelengths (λ ∼ 800 nm), atomic crystals fall in this category as they
have lattice spacing on the order of a few angstroms. In this regime, defects are not important un-
less they have correlation lengths on the order of λ. The actual value of ϵ (or µ) can be tailored by
the individual responses of the building blocks as was demonstrated by Pendry in [17], who used
open ring resonators to build a material where µ takes negative values. In self-assembled systems,
individual building block shapes that have been produced experimentally are limited to somewhat
regular polyhedrons and are relatively far from the complex shapes required to obtain resonant
building blocks. Usage of multicomponent crystals with complex lattices could be used to repli-
cate the resonant building blocks, but this would require a significant expansion of the available set
of crystal lattices.
The other available regime, Λ ∼ λ/2 corresponds to photonic crystals. In this regime, the opti-
cal response can be fully tailored, even forbidding entire frequency bands from propagating in the
solid (optical bandgap). The system responds to any defect of the lattice, which can be engineered
to further alter light-matter response by making them concentrate optical fields (resonant defect).
However, this comes at the cost of extreme sample delicacy during fabrication. A misplaced build-
ing block also acts as a defect, which means that the phonons in these systems are problematic due
to the small spring constant. At the time of writing this thesis, I have not found any highly resonant
defect used for light-matter interactions in self-assembled crystals. However, usage of high density
of states near band edges has been used in colloidal systems [18].
The final crystal shape (crystal habit) can further be used as a resonator. This resonance has
been demonstrated experimentally in DNA-guided assembly [19] from metallic building blocks

21
(plasmonic response). Rod shaped crystal habits are suitable targets as they support whispering
gallery modes, which typically have high quality factors. In chapter 5, we demonstrate assembly
of a hexagonal rod which should support similar modes. This path should be further explored,
particularly in combination with tailoring the dielectric constant.
1.4. Outline of this thesis
In this thesis, I study two classes of problems relating to colloidal crystals: those arising in
the modeling itself and those related to physics of self-assembly. The first class of problems relate
to simplifying the description of interactions to increase calculation speed. For example, a set of
interacting DNA-coated spheres might be treated as possessing a single radial interaction between
different spheres. This process, which is known as coarse-graining, must be done carefully in
order to avoid spurious results arising from oversimplification. Good coarse-graining schemes are
a requirement for efficient calculation of physical and experimental systems. One article and one
work in progress will be presented on this topic. One deals with coarse-graining anisotropic bodies.
The other deals with strong deformation of the polymer shell due to interactions between colloids,
which leads to strong multi-body effects [20, 21].
The second class of problems is related to physical phenomenon. In this thesis, these problems
are tackled in collaboration with experimentalists from the group of Prof. C. A. Mirkin. I will
present four articles in this part that address some of the issues mentioned earlier in this chapter.
These articles explore changes in properties related to particle shape, salt concentration and number
of grafted strands.
The first article is a systematic study of self-assembled regular polyhedrons for various DNA
coating lengths. As expected, short strands produce compact lattices dictated by particle anisotropy,

22
while long strands induce spherical-like behavior of the colloids. For cubes, we find that the transi-
tion goes through a broken symmetry regime. Both the short strand phase (simple cubic) and long
strand phase (face-centered cubic) as well as the particle core possess cubic symmetry. Near the
transition however, this is broken into a tetragonal lattice. This is investigated by a combination of
experiments and molecular dynamics simulations.
The second article presents kinetic Wulff shapes, which are out of equilibrium but highly re-
producible. These appear due to significant energy barriers between different crystal planes with
identical Miller indices. This is probed using experiments and molecular dynamics and kinetic
Monte Carlo simulations. The paper is in preparation to be submitted to Nature Communications.
The third article relates an increase in mean crystal size to salt concentration in water. Using
molecular dynamics simulations we show that there is an increase in attachment barriers between
colloids at elevated salt concentrations. This barrier causes a slowdown of the attachment process
in crystal growth. Using classical nucleation theory, we show that this slowdown causes each
crystal to undergo the interface- to diffusion-limited transition at larger crystal size and thus that
average crystal size increases. This paper is in preparation to be submitted to ACS central.
The last chapter presents work done in mixtures of small and large particles. In this system,
there is a very large size different between the colloids (5:1 ratio). In regular systems, each colloid
has a relatively large number of linkers grafted to it (≥30). This leads individual colloids to behave
as the average, due to the central limit theorem. For our small colloids (< 2 nm, < 10 strands),
the very low number of strands grafted on them means that the number of hybridized strands can
be very far from the average value of hybridized strands on small colloids. They can thus be
completely dissociated and move from site to site in the crystal. Unlike the previously formed
compounds, these are metallic in nature. As the temperature is lowered, the smaller particles

23
crystallize in specific lattice sites corresponding to intermetallic lattices. We intend to submit this
work to Science.
A general conclusion will follow the presentation of the articles.
Part 1
Modeling polymer-coated anisotropic bodies
25
Modeling physical systems using simulations requires calculations to be done on the scale of
the physical system. For instance, if we want to compute properties of a self-assembled system
of 10 nm colloids, the system size needs to be somewhat larger than a few crystal periods. This
can require representation of millions of atoms. Computing properties from ab-initio quantum
mechanics is simply not feasible. The first approximation one will do is to remove electrons and
represent atoms based on their bonding state. For example, a free carbon atom will not behave in
the same way a carbon in a propane chain does. Further reductions in the number of degrees of
freedom can be achieved by grouping atoms together. The first removed atoms are hydrogens: they
are small and oscillate around their bonds much faster than heavier atoms, thus requiring smaller
timesteps to capture their motion. This leads to united atoms models, where non-polar hydrogens
are grouped on their carbon. At this point, the calculations are still called atomic.
One enters the coarse-grained regime upon further grouping of atoms. This can be done in var-
ious ways. For simple polymers like polystyrene sulfonate (carbon chain with sulfonated benzene
sidegroups), individual degrees of freedom (DoF) can be chosen to represent two carbons, benzene
rings and sulfonates [22], while the solvent (water) is not included explicitely in the model. The
DoF obtained in this way are usually called beads. The removed DoF are the fast ones, hydrogens,
internal bonds in the beads and so forth, while the leftover DoF are slow, representing movement
of multiple atoms. There are multiple techniques that currently allow one to go from atomic to
coarse-grained descriptions which can be found in the literature [23, 24] and the reader might be
wondering why we want to revisit coarse-graining schemes. When one coarse-grains at very high
levels, for say spherical colloids, the interaction is assumed to be spherically symmetric [3]. This
is usually called a potential of mean force or effective potential and can be derived in various ways.
However, if the polymer coverage is fairly low, the coating can deform during assembly, leading
to multibody interactions [21, 20]. Currently, there are no coarse-grained methods to calculate this

26
deformation efficiently in simulations. The typical solution is to include all the ligands, which is
fairly slow to simulate. We are interested in large-scale deformations, which are slow compared to
movement of individual beads or chains of beads and the question is whether we can we approxi-
mate the interaction between colloids as a spherical interaction, plus a few anisotropic corrections.
For this to happen, we first need a description of general interacting anisotropic bodies. This is
shown in the chapter 2 of this thesis, which is a paper published in Physical Review E. In chapter
3, we demonstrate the full multibody interaction potentials. This is currently a draft in progress.

27
CHAPTER 2
Orbitals for classical arbitrary anisotropic colloidal potentials
Authors : Martin Girard, Trung Dac Nguyen, Monica Olvera de la Cruz
2.1. Abstract
Coarse-grained potentials are ubiquitous in mesoscale simulations. While various methods to
compute effective interactions for spherically symmetric particles exist, anisotropic interactions
are seldom used, due to their complexity. Here, we describe a general formulation, based on a
spatial decomposition of the density fields around the particles, akin to atomic orbitals. We show
that anisotropic potentials can be efficiently computed in numerical simulations using Fourier-
based methods. We validate the field formulation and characterize its computational efficiency
with a system of colloids that have Gaussian surface charge distributions. We also investigate
the phase behavior of charged Janus colloids immersed in screened media, with screening lengths
comparable to the colloid size. The system shows rich behaviors, exhibiting vapor, liquid, gel and
crystalline morphologies, depending on temperature and screening length. The crystalline phase
only appears for symmetric Janus particles. For very short screening lengths, the system undergoes
a direct transition from a vapor to a crystal upon cooling; while, for longer screening lengths, a
vapor-liquid-crystal transition is observed. The proposed formulation can be extended to model
force fields that are time- or orientation-dependent, such as those in systems of polymer-grafted
particles and magnetic colloids.

28
2.2. Introduction
Efforts to synthesize and assemble anisotropic particles such as Janus particles [25, 26, 27, 28,
29], patchy colloids [30, 31], polyhedral particles [32] and functionalized polyhedral nanoparticles
[33] have led to materials with diverse structures and functionalities. Systems described by and
modeled on anisotropic interactions also include proteins [34, 35, 36, 37] and polyhedral colloids
[38, 39, 40, 41]. The anisotropy of the interaction field is akin to that of the electron orbitals of
individual atoms or molecules, and could enhance control of structural properties such as that of
the crystal lattices formed [37, 33].
Simulations can guide experimental attempts to self-assemble systems with anisotropic inter-
actions. While state of the art simulations are often effective at both the micro (particle-based
description) and macro (continuum) scales, they frequently fail at the mesoscopic scale, where
macroscopic equations become invalid and the number of particles is too large for efficient compu-
tation. Coarse-graining circumvents this problem by reducing the number of degrees of freedom.
For instance, the interactions of spherical colloids are generally rewritten as a function of the dis-
tance between the spheres only, discarding fine details such as surface roughness and the explicit
nature of grafted chemical components. For non-spherical colloids of arbitrary nature, one must
take into account the relative orientation of the colloids. The single degree of freedom for two
spherically symmetric colloids then becomes six degrees of freedom.
All-atom molecular force fields encounter similar problems for rigid molecules, where fast
calculation of interaction potentials is sought [42]. An expansion into spherical harmonics for
potentials of the form r−a was explored, which yields products of spherical harmonics and hy-
pergeometric functions. Sack attacked the problem of arbitrary interactions between sites [43],

29
but could not obtain any explicit form. Ruedenberg used properties of Fourier transforms to re-
formulate the problem as an integral representation [44]; however, in numerical implementations,
calculating hypergeometric functions is prohibitively expensive. A few other approaches that do
not involve spherical harmonics have been attempted, such as expressing excluded-volume inter-
actions in liquid crystals using the Gay-Berne potential and subsequent refinements [45, 46], and
using potential decomposition for lock-and-key systems [47]. However, a general description of
arbitrary potentials remains elusive. The common solution is to use brute force calculation, where
the surface is tessellated with particles and some not necessarily physical interaction is used be-
tween surface particles.
Here, we revisit this problem for the general case of arbitrary bodies. We expand interactions
into orbital-like interactions which are efficiently evaluated by Fourier transforms in the spirit of
Ruedenberg [44]. Previous approaches aimed at obtaining analytical formulations require solving
an integral and evaluating computationally expensive functions. We avoid explicitly computing
these integrals by relying on tabulations of Fourier integrals and their full derivatives. Our ap-
proach is equivalent to ab initio Molecular Dynamics (AIMD) where the amplitudes are replaced
by densities [48]. The numerical implementation avoids the Pulay forces which plague traditional
AIMD. This orbital expansion is truncated at some appropriate level, which effectively smooths
the particle description and produces expressions closely related to classical multipole expansions.
We implement this potential in the LAMMPS software package [49] and provide a simple imple-
mentation for the uniaxial case (See Supplemental Material at [URL will be inserted by publisher]
for implementation details).
The method requires two conditions: 1) that the orbital expansion of a particle is time invariant
(that is, the particle shape does not change over time), which is a reasonable approximation for
colloids grafted with a very dense brush and for rigid bodies with charges on the surface, and

30
2) that the interaction potential possesses a Fourier transform. A large set of potentials satisfy
this second requirement, including Coulomb, Yukawa and Gaussian potentials; whereas the well-
known Lennard-Jones potential does not, due to its rapidly divergent excluded volume term at
r = 0. Excluded volume interactions can be resolved, for example, by using a Gaussian force, a
technique used in mean field theories [50, 51, 52].
We first introduce the method and a numerical implementation (Section 2.3). We derive the
field representation for a system of colloids interacting through a Gaussian surface charge distri-
bution and for a system of charged Janus particles in a screened environment. For the Gaussian
charged particles, for which the multipole expansion terminates, we show that this method is ex-
act and thus has improved accuracy compared with a naive tessellation of the surface (Section
2.4.1). For the charged Janus particles (Section 2.4.2), which was previously examined using a
Kern-Frenkel potential valid only at very short screening lengths [53], we extend the calculation
to higher screening lengths, which is a regime typically difficult to access numerically. The limita-
tions of the method are also discussed (Section 2.4.3).
2.3. Field representation of pairwise potentials
2.3.1. Motivating example
Consider a system of charged particles interacting through a screened Yukawa potential. We as-
sume that particle i is located at ri with orientation Ri. Let ρ(r, R) be the distribution of inter-
acting particles and χ(r) their interaction potential. χ(r) must possess a Fourier transform; other-
wise, it has no restriction. In the case of charged particles interacting through a Yukawa potential,
ρi(r − ri, Ri) is the charge distribution and χes(r) = r−1 exp(−κr). The interaction is given by
the integral:

31
(2.1) U esij (ri, Ri, rj, Rj) =
∫V
ρi(r, Ri)dr
∫V ′
χes(|(r − r ′ − rij|)ρj(r ′, Rj)dr′,
where rij = rj − ri and the coordinates are centered around the two colloids i and j. The second
integral in Eq. 2.1 is a convolution of ρj with χes, which we introduce as the auxiliary field Φρ,
(2.2) Φρj(r, Rj) =
∫V ′
χes(|r − r′|)ρj(r′, Rj)dr′ = ρj(r, Rj) ∗ χes(r),
where ∗ denotes the convolution operation. The electrostatic potential energy between the colloids
is then rewritten as the overlap integral of the auxiliary field with the density field as:
(2.3) U esij (ri, Ri, rj, Rj) =
∫V
ρi(r − ri, Ri)Φρj(r − rj, Rj)dr,
where we expanded the auxiliary field around the center of the colloid j for symmetry considera-
tions that will become clear later. While the density ρ(r, R) and interaction χ(r) fields are scalar,
generalization to tensor fields is straightforward, as shown for the vector case in Appendix C.
2.3.2. Field equations
We now derive the general formalism for forces based on overlaps of fields. We consider two
arbitrary fields Φi(r− ri, Ri) located near colloid i and Φj(r− rj, Rj) located near colloid j as we
did in the previous section. In the case of electrostatic interactions, Φi(r− ri, Ri) = ρi(r− ri, Ri)
and Φj(r − rj, Rj) = Φρj(r − rj, Rj) = (ρj(r − rj, Rj) ∗ χes(r)). The overlap integral in which
we are interested is given by

32
(2.4) Uij(ri, Ri, rj, Rj) =
∫V
Φi(r − ri, Ri)Φj(r − rj, Rj)dr.
We first rewrite the left-hand side of Eq. 2.4. Without making any assumptions on the particular
shape of each particle or field, we have six degrees of freedom, three for the relative position of
the second particle with respect to the first one, and three for the rotation of the second particle. To
obtain completely symmetric forms suitable for molecular dynamics (MD), we treat the potential
energy as having nine degrees of freedom, three for the center to center vector r, three for the
rotation of the first particle and three for the rotation of the second particle.
Without loss of generality, we can assume that the particle i is located at the origin. We note
that Eq. 2.4 is very similar to the convolution integral treated by Fourier transforms [54]. Denoting
the difference in colloid position by rij = rj − ri and geometrical inversion of f(r) by f(r) such
that Φj(r − r ′) = Φj(r′ − r), we cast equation 2.4 as the convolution of Φi and the inversion of
Φj:
(2.5) Uij(rij, Ri, Rj) =
∫V
Φ(r)Φj(rij − r)dr = Φi(r) ∗ Φj(r)∣∣r=rij
Within the spherical harmonics transform framework [54], this operation is straightforward
in reciprocal space, where r → ρ, Φ(r, θ, ϕ) → Φ(ρ, θw, ϕw) is the Fourier transform operation,
and Uij(ρ, Ri, Rj) = Φi(ρ, Ri)Φj(ρ, Rj). We introduce the Wigner functions Dlm,µ(R) to treat the
rotation of spherical harmonics, resulting in the full expressions for Φi and Φj given by:

33
Φi(ρ) =∑
li,mi,µi
Dlimi,µi
(Ri)Ymili
(θw, ϕw)Fmili
(ρ),(2.6)
Φj(ρ) =∑
lj ,mj ,µj
Dljmj ,µj
(Rj)(−1)ljYmj
lj(θw, ϕw)F
mj
lj(ρ).(2.7)
The usual spherical harmonics Y ml (θ, ϕ) are defined by
Y ml (θ, ϕ) =
√(l −m)!
(l +m)!Pml (cos θ) exp(imϕ),
where Pml (x) is the associated Legendre polynomial of degree l and order m, such that
∫ΩY ml (θ, ϕ)
Y m′
l′ (θ, ϕ)dΩ = δl,l′δm,m′ . A useful representation of the Wigner Dlm,µ function is based on quater-
nion representation of rotations as developed in [55]:
(2.8)
Dlm,µ =
√(l +m)! (l −m)!
(l + µ)! (l − µ)!|Ra|2l−2mRm+µ
a Rm−µb
∑ρ
(l + µ
ρ
)(l − µ
l − ρ−m
)(−|Rb|2
|Ra|2
)ρ
where Ra = qw + iqz and Rb = qy + iqx and q = (qw, q) is a normalized quaternion describing the
orientation. The quantities Fml are the lth order spherical Fourier-Bessel transforms of Φ(r) given
by:
Fmili
= 4π(−i)li∫
Φi(r)Ymili
(θ, ϕ)jli(ρr)r2dr(2.9)

34
where jl(z) is the lth order spherical Bessel function of the first kind. Multiplying Eqs. (2.6) and
(2.7) and inverting back the transform yields the potential:
(2.10)
Uij(rij, Ri, Rj) =∑
li,mi,µilj ,mj ,µj ,L
8(−i)LYmi+mj
L (θij, ϕij)Dlimi,µi
(Ri)Dljmj ,µj
(Rj)Fmi,mj
L,li,lj(rij)C
mi,mj
L,li,lj,
where
Fmi,mj
L,li,lj(rij) =
(ili+lj
(4π)2
∫ ∞
0
Fmili
(ρ)Gmj
lj(ρ)jL(ρr)ρ
2dρ
)r=rij
,(2.11)
Cmi,mj
L,li,lj=
√(2li + 1)(2lj + 1)
4π(2L+ 1)⟨li, 0, lj, 0, L, 0⟩⟨li,mi, lj,mj, L,mi +mj⟩(2.12)
and ⟨li,mi, lj,mj, L,M⟩ is a Clebsh-Gordan coefficient. This definition of Cmi,mj
L,li,ljis equivalent to
the Slater coefficients of [54]. In the general case, there is no known analytical representation of
F(r), and it must be tabulated.
2.3.3. Numerical implementation
The coefficients Fmi,mj
L,li,lj(rij) are precomputed and compiled into tables. This can be done using
known software packages (see provided files) or by fast Fourier-based methods [56]. For Monte
Carlo simulations, potential energy given by Eq. 2.10 is sufficient for sampling. In order to time
evolve the system in MD simulations, we must compute forces and torques. In Eq. 2.10, the
position and rotation components are fully decoupled. Forces are given by spatial derivatives,
while torques are given by angular derivatives of the Wigner functions. We tabulate the derivative
of F using:

35
(2.13)∂Fmi,mj
L,li,lj
∂r=
ili+lj
(4π2)
(∫ ∞
0
Fmili
(ρ)Gmj
lj(ρ)
(LjL(rρ)
r− ρj1+L(rρ)
)ρ2dρ
)r=rij
.
Additional forces arise from the derivatives of the spherical harmonics. Their projection along
direction k is calculated by using partial derivatives,
(2.14) Fk ∼∂Y M
L (θ, ϕ)
∂θ
∂θ
∂k+
∂Y ML (θ, ϕ)
∂ϕ
∂ϕ
∂k.
Partial derivatives of the spherical harmonics are obtained by either multipling by iM or taking
the derivative of the associated Legendre polynomial. In practice, since spherical harmonics are
polynomials of cos(θ), we simply calculate
(2.15) Fk ∼
√(l −m)!
(l +m)!exp(iMϕ)
∂Pml (cos θ)
∂ cos θ
∂ cos θ
∂k+ iMY M
L (θ, ϕ)∂ϕ
∂k.
The force can then be computed by addition of all individual contributions. For instance, the x
component is given by
(2.16) Fx =∂Fmi,mj
L,li,lj
∂r
x
r+
∂U
∂ cos θ
−2xz
r3+
∂U
∂ϕ
−y
x2 + y2.
In order to compute torques, we must take derivatives with respect to infinitesimal rotations
along some set of axes. The composition of two rotations, R1 and R2, with corresponding quater-
nions q1 and q2, is given by the quaternion product q2 · q1. This relation is used to obtain the
36
variation of the quaternion of a particle with respect to a rotation axis. For instance, a rotation
along the x axis of the referential frame, ux, will cause a variation in quaternion given by
(2.17)∂q
∂ux
=1
2(0, 1, 0, 0) · (qw, qx, qy, qz).
The result is multiplied by the partial derivatives of Dljmj ,µj(Rj) in order to obtain the full
derivative. For instance, the derivative of Dljmj ,µj(Rj) against a rotation along the axis x is given by
(2.18)∂Dl
m,µ
∂ux
=∑k
∂Dlm,µ
∂qk
∂qk∂ux
= −qx∂Dl
m,µ
∂qw+ qw
∂Dlm,µ
∂qx− qz
∂Dlm,µ
∂qy+ qy
∂Dlm,µ
∂qz.
The Wigner coefficients Dljmj ,µj(Rj) are calculated directly from quaternions (see Eq. 2.8), pro-
viding straightforward implementations in MD packages. Since these coefficients and their deriva-
tives are only dependent on individual particle orientations, they are updated once per timestep
and not for each pair interaction. In principle, one can invert the multiplication order to obtain
the torques in the body frame. This removes the µi index from the summation in Eq. 2.10 but
requires calculating the Wigner functions once per pair interaction, instead of once per particle. It
is not done in the supplied code as it would complicate the LAMMPS implementation without any
obvious benefit in computational performance.
2.3.4. Gaussian patchy particles
To test the method’s accuracy, we consider a case where the series in Eq. 2.10 terminates and does
not require truncation, resulting in a spherical harmonic representation that is exact. In particular,
we examine colloids with surfaces interacting through a Gaussian potential χG(r) = a exp(−br2),

37
where a and b are parameters of the potential. In order for the series to terminate, we use a surface
density ρS(r) = δ(|r|−1)(1+ cos θ), that is, a distribution located on the surface of a particle with
radius R = 1. The interaction energy between two colloids is written as
(2.19) U sphij = a
∫ρi(Si)ρj(Sj) exp(−br2Si,Sj
)dSidSj,
where Si is the surface of particle i and ρSiis a continuous function on the surface of particle i.
We compare the cases where this integral is evaluated using a numerical quadrature with the
case where the exact field method is used. Using a numerical quadrature, the integrand is evaluated
at N points on each surface, yielding
(2.20) U sphij = a(4π)2N−2
N∑i
N∑j
ρ(ri)ρ(rj) exp(−b|(ri − rj)|2) +O(N−2).
Figure 2.1. Representation of the surface function ρ(S) for two interacting particles ofarbitrary orientations, where blue indicates ρ = 0 and red indicates ρ = 1.
Eq. 2.20 can be directly evaluated in standard MD packages by tessellating the surface of
a sphere and assigning charges to each point proportional to q = (1 + cos θ)/N , where N is
the number of points per sphere, as sketched by Fig 2.1. The points are chosen according to

38
a Fibonacci mapping in order to obtain an approximately equal area for each point [57]. The
interaction between points of the tessellation is taken as U tessij = aqiqj exp(−br2).
For the field representation, the integral in Eq. 2.4 can be written using the product of two
equal fields due to special properties of Gaussian functions (see Appendix B). These two fields are
given by Φi(r) = ΦG ∗ ρi, where ΦG = a1/223/2π−3/4b3/4 exp(−2br2), obtained by inverting the
square root of the Fourier transform of χG(r). The overall field for this case is then given by
(2.21) Φi(ρ) = ΦG ∗ ρi =8a1/2π7/4 exp(−ρ2
8b)
b3/4
(√πY 0
0 (θ, ϕ)j0(ρ) +
√π
3Y 01 (θ, ϕ)j1(ρ)
).
2.3.5. Screened Janus particles
Using this method, we can now extend our recent study of charged Janus particles immersed in an
ionic solution [53] to the cases where the screening length is on the order of the particle radius.
Janus particles possess two sides with equal, but opposite charge density. The cap angle, θm,
dictates the fraction of the surface covered by each charge. This system was previously simulated
using a Kern-Frenkel potential, which is valid for very small Debye lengths, that is, λ ≪ R, where
λ is the Debye length and R is the particle radius.
In electrostatically screened environments, the coupling is non-trivial. For instance, dipole-
dipole and charge-charge interactions generate terms with the same distance dependence [58].
These effects are included in our method.
To calculate interactions between colloids when λ ∼ R, we use Eq. 2.3. The charge density is
given by the series:
(2.22)
q(ρ) = −8π3/2R2
(cos θmj0(ρR)Y 0
0 (θ, ϕ) +∞∑l=1
√1 + 2l
P 1l (cos θm) sin θm
l(l + 1)jl(ρR)Y 0
l (θ, ϕ)
).

39
In reciprocal space, the potential χes(r) is convolved with the charge density by a multiplication
using χes(ρ) = 8π3/2(λ−2 + ρ2)−1. The series is truncated at lmax = 3 in order to be evaluated
numerically and a purely repulsive truncated Lennard-Jones potential (i.e. the Weeks-Chandler-
Anderson potential) is added to represent the solid cores of the colloids.
One quickly notices the similarity between Eq. 2.22 and the usual multipole expansion for
charges. A proof of equivalence for λ → ∞ is found in Appendix A. Using tabulated integrals
over traditional multipoles presents a major advantage since the integral is well-defined in the
overlapping regime when |rij|< Ri +Rj .
2.4. Results and discussion
2.4.1. Accuracy and computational performance
We first characterize the computational efficiency and accuracy of the field respresentation for
the Gaussian charged particles. We implement the field representation and the Gaussian charge
potential as new force fields in LAMMPS. The benchmark runs are performed with equilibrated
systems at similar thermodynamic state points, i.e., number of particles, temperature and density.
LAMMPS is built with the stable 31Mar17 release.
Both the coarse-grained (Gaussian charge) and the spherical harmonic (field) representations
achieve strong scaling performance for our numerical implementations, as seen in Figure 2.2. The
spherical harmonic representation is generally faster than the surface bead representation by a
factor of 2.0-3.5, depending on the resolution of the latter. Finer resolution of the surface bead
representation increases the computational overhead as N2, where N is the number of beads dis-
cretizing the surface. Furthermore, the spherical harmonic representation exhibits a parallel effi-
ciency as high as 55% at 125 particles per MPI process. The particularly high parallel efficiency at
low particle counts per MPI process, compared to other conventional pairwise potentials (such as

40
100
101
102
103
104
1 2 4 8 16 32 64 128
Tim
este
ps p
er s
econ
d
No. of nodes
Linear scaling slopeSpherical harmonicsSurface bead, N = 8Surface bead, N = 15
Figure 2.2. Strong scaling performance on the Titan XK7 supercomputer. The number ofparticles in each run is 32000. There are 16 MPI processes launched on each node.
Lennard-Jones and Yukawa potentials), implies that the field representation is computationally in-
tensive and thus should further benefit from finer-grained parallelisms including GPU acceleration,
as observed with Gay-Berne potentials [59].
For Gaussian patchy particles, the spherical harmonic representation is exact. Fig. 2.3 com-
pares the average energies of the coarse-grain and field calculations as a function of the number of
quadrature points N for a particle with radius R = 1 and volume fraction v ≈ 0.077, using four
sets of the potential parameters a, b. The slopes are approximately −2, indicating that the error of
the coarse-grain simulation scales as 1/N2, consistent with Eq. 2.20.
Since the calculation speed of the coarse-grained simulations also scales as N2, accuracy and
computational efficiency must be balanced. For this specific system, very few points on the sur-
face are required for accurate simulations. An accuracy of 1% of the mean energy of the system
requires approximately 20 beads per surface. Even for this level of precision, however, the spher-
ical harmonic potential method is faster than the coarse-grained representation. The calculation
speeds become comparable only when N ≈ 6 − 8. Finally, for the a = 0.2, b = 2, N = 37 case,

41
10-4
10-3
10-2
10-1
5 10 15 20 30 40 50
(Usp
h - U
CG
)/U
sph
N
a = 0.15, b = 1a = 0.15, b = 2a = 0.20, b = 1a = 0.20, b = 21/N2
Figure 2.3. Relative error of the average energy of the system as a function of the num-ber of tessellation points of the coarse-grained representation. Curves are plotted fora = (0.15, 0.20) and b = (1, 2). The system is in a liquid state with these parameters.An additional curve proportional to 1/N2 is drawn for comparison.
coarse-grained models achieve a calculation speed around 33 timesteps per second, compared to
652 timesteps per second for the spherical harmonic representation.
2.4.2. Janus particles morphologies
To characterize the phase behavior of Janus particles, we simulated particles with two opening
angles (θm = π/2 and θm = 1.40) previously calculated using a Kern-Frenkel potential [53].
The simulations were run with 4000 colloids of radius R = 1 and a constant volume fraction of
v = 0.10. The Debye length is varied over the range 0.16 ≤ λ ≤ 0.32. The reduced temperature
T ∗ = πϵkBTR/2q2 is varied independently within 1.0 ≤ T ∗ ≤ 2.0, where ϵ is the permittivity and
q is the charge on one of the hemispheres of the balanced θm = π/2 Janus particle. The system is
equilibrated over 3× 10⁶ timesteps.

42
We observe four morphologies shown in Fig. 2.4. At very high temperatures, the system is
in a vapor phase, labeled V . The system also exhibits a liquid state, labeled L, which seems to
correspond to what we previously called a worm-like glass state in [53]. This liquid phase forms
either very small droplets near the V / L boundary or elongated structures. This behavior is similar
to that of hard dipole dumbbell systems [60], where it was observed that, while dumbbells with
explicit charge or point dipoles exhibit a vapor-liquid transition, point dipole spheres do not [61].
Our simulations suggest that explicit charge representations of spheres also exhibit a vapor-liquid
transition.
One should be careful making comparisons between Kern-Frenkel and the present orbital po-
tentials. While they are both approximating the Yukawa potential, it is not the same approximation.
Kern-Frenkel assumes that the charge density is locally constant (in a region which size depends
on λ). The present orbital representation approximates it using a series. At the opening angle,
Kern-Frenkel approximates the mean charge density as either +1 or −1 while the orbital gives
a sine polynomial dependance. This has strong consequences for crystalline phases, which are
very sensitive to the type of interaction used. For instance, crystal formed by colloids interacting
through repulsive inverse power laws (1/rn) will exhibit FCC-BCC transition around an exponent
of n ≈ 6 [62]. Due to these differences, we do not find that the crystal lattice match the previous
calculations based on Kern-Frenkel. Nevertheless, the melting temperature of the crystal phase for
θm = π/2, λ = 0.16R, is around T ∗ ≈ 0.8, which is similar to the critical temperature found in
the work using the Kern-Frenkel approximation [53], where T ∗ = 0.75.
Interestingly, in the θm = π/2 case, the liquid morphology only emerges for sufficiently large
Debye lengths (λ ≳ 0.20) and sufficiently high temperatures. This phase was absent in our Kern-
Frenkel simulations conducted at λ = 0.16. For very small Debye lengths or very low tempera-
tures, it is replaced by a crystalline morphology. In all observed cases, the system first condenses

43
a) b)
c) d)
Figure 2.4. Snapshots of the simulations in different morphologies observed for symmetric(θm = π/2) Janus particles a) Vapor V state at T ∗ = 1.81, λ = 0.24, b) Liquid L stateat T ∗ = 1.50, λ = 0.24, c) Crystalline C state at T ∗ = 1.20, λ = 0.24, d) Gel state atT ∗ = 1.0, λ = 0.32. Arrows indicate north pole of the Janus particles.

44
a) b)
Figure 2.5. Regions of observed morphologies in simulations of charged Janus colloids foropening angles of a) θm = 1.40 and b) θm = π/2. The different morphologies indicatethe main morphology observed. The phase is deemed as vapor by a clustering analysis ifmore than half the colloids are in clusters of size less than 50. Other morphologies aredetermined by visual inspection of the trajectories. A morphology is deemed crystalline ifit forms at least one crystalline domain. Morphologies are determined for five values of λand six (θm = 1.40) or nine (θm = π/2) values of temperature, totaling 30 simulated statepoints for θm = 1.40 and 45 for θm = π/2. Boundaries are obtained by drawing splines inbetween grid points of different morphologies and should be treated as a guide for the eyes.Coexistence of morphologies is often found along the boundaries.
to the L phase and then crystallizes. Consequently, multiple crystalline domains form on the elon-
gated L structures, instead of single crystals. At large Debye lengths and low temperatures, the
systems starts supporting thinner lines of colloids and the system forms a branched structure, even-
tually coalescing into a gel-like structure. Whether such a phase is thermodynamically stable or
the result of kinetic traps is unknown. However, when θm = 1.40, the system is liquid near the L /
G boundary, which suggests a stable phase. We have performed additional simulations runs at this
state point to confirm this hypothesis. More information on the liquid-gel morphology transition
can be found in Appendix E.

45
2.4.3. Limitations of the method
As mentioned earlier, the current method has two limitations. First, the interaction potentials
χ must possess a Fourier transform. A common source of soft potentials is excluded volumes,
which diverge when the volumes overlap. While this is clear from the mathematical equations, the
underlying physical reason lies with the fact that series truncation produces a spatial averaging of
the densities. This averaging is inconsistent with systems that respond to infinite frequencies. To
overcome this limitation, one may be able to represent excluded volumes by expanding Eq. 2.3
into a summation of integrals of powers of ρ(r, R) or by regularizing the potential function (see
Appendix D for further details and derivations).
The second limitation is that density fields must be static in time, which makes the description
unsuitable for system with strong deformations. Typical cases include colloids grafted with a low
amount of flexible polymers. In such systems, when colloids come close to each other, the polymer
coating may deform. In systems of DNA coated polyhedra, this has been shown to strongly affect
broken symmetry regimes, driving transitions between different crystal lattices [33]. These defor-
mations have been the starting point of the orbital topological model, which for polymer coated
spheres predicts different equilibrium structures than a regular non-deformable potential [63]. In
order to model such a system with our description, one would have to use a time-dependent density
field and advance the field over time. We are currently working on such a model, which will be the
subject of a future publication.
2.5. Conclusion
We have developed a field representation for describing the anisotropic interactions between
colloids at mesoscopic scales based on an orbital-like decomposition. Using the field representa-
tion, several use cases are derived, including patchy particles and charged Janus particles. With

46
this approach, we demonstrate that charge-neutral Janus particles show qualitative agreement with
studies of dipolar hard dumbbell systems. Interestingly, the vapor-liquid transition is supplanted
by the liquid-crystal transition for very short screening lengths, yielding similar results from the
Kern-Frenkel potentials. The liquid phase has previously been shown to be absent for point dipole
spheres [61], which raises the question of whether it arises from inclusion of higher order hexapole
terms or disapears at large Debye lengths. Addition of isotropic dispersion forces to systems of
point dipole spheres has been shown to cause the liquid phase to appear, provided the dispersion
force is sufficiently strong [64]. In our system, the additional hexapole force is entirely determined
by the shape of the charges at the surface of the Janus particle. These particles are usually thought
of as dipoles and whether the phase diagram can actually be controlled by the surface charge dis-
tribution remains an interesting question.
This technique enables simulations in solutions with screening lengths comparable to the size
of the colloids without resorting to expensive and often inaccessible explicit ions simulations. The
modest requirements for the type of potentials that can be used, make this field coarse-graining
approach applicable to many types of interactions. With this flexibility, the technique could po-
tentially be employed to calculate interactions between globular proteins of various shapes and
surface compositions stemming from a combination of electrostatics and hydrophobicity. Indeed,
our approach has the inherent capability of including position-orientation coupling of particles. It
can in principle describe any anisotropic potential, as long as the potential has proper behavior in
reciprocal space, and, in the present form, as long as the particles shape and surface composition
remain constant as the particles interact.
In order to relax the assumptions made in the present study, namely that the density represent-
ing particle shapes is constant and that the surface composition does not change as the particles
interact, the field coarse-graining approach has to be extended to directional and time-dependent

47
force fields. While the complexity of the derived field depends on the original interactions and
increases with the target accuracy, the performance gain due to finer-grained parallelization can
be significant and will be the focus of future studies. A major refinement is to include dynamic
densities, which is necessary to efficiently simulate very soft colloids such as polymer-coated par-
ticles where the shape of the particle changes when two colloids interact [63]. This refinement is
necessary also to make comparison between our approach and results of conventional approaches
that include grafted chains such as DNA to nanoparticles explicitly [33].
Acknowledgement
This work was supported by the Center for Bio-Inspired Energy Science (CBES), which is an
Energy Frontier Research Center funded by the U.S. Department of Energy, Office of Science, Of-
fice of Basic Energy Sciences under Award Number DE-SC0000989. MG acknowledges support
from the Natural Sciences and Engineering Research Council of Canada (NSERC) for a graduate
fellowship (grant PGS-D #6799-459278-2014).
A. Equivalence between multipole expansions
Eq. 2.22 expands the charge into spherical harmonics. Arbitrary rotations of this multipole are
treated by Wigner D functions :
(2.23)
qi(ρ) = −8π3/2R2i
(cos θmj0(ρRi)Y
00 (θ, ϕ)
+∑l=1,m
Dm,0l (Ri)
√1 + 2l
P 1l (cos θm) sin θm
l(l + 1)jl(ρRi)Y
0l (θ, ϕ)
).
When convolved with other charge distributions and the interaction potential, we get
48
(2.24) Uij =∑L,M
8iL−li−ljY ML (θ, ϕ)
∑li,mi,lj ,mj
Dmili(Ri)D
mj
lj(Rj)Cmi,mi,0
li,li,0Cmi,mj
L,li,lj8π3/2clicljIL,li,lj ,
where I is an integral defined by
(2.25) IL,li,lj =
∫ ∞
0
jlj(ρRj)jli(ρRi)ρ2
ρ2 + λ−2jL(ρr)dρ.
To the best of our knowledge, this integral only has a known solution for r > Ri + Rj and
λ = ∞. Physically, this is two finite size multipoles without any overlap between their charge
distributions for unscreened electrostatic interactions. In this specific case, the integral can be
written as [65]
(2.26) IL,li,lj =π3/2
23
Rli+ljr−1−li−ljΓ(
1+li+lj+L
2
)Γ (li + 3/2) Γ (lj + 3/2) Γ
(1 +
L−li−lj2
)× F4
(li + lj − L
2,1 + li + lj + L
2; li +
3
2, lj +
3
2;R2
i
r2,R2
j
r2
),
where F4 is the Appell hypergeometric function of the fourth kind. Due to Γ(1+(L−li−lj)/2)
in the denominator and the Clebsch-Gordan coefficient of 2.24, it is only evaluated when L =
li + lj .
To see this, consider that maxL = li+ lj , for which the Clebsch-Gordan coefficient is non-zero
and the integral coefficient is non-zero. For L = li + lj − (2n + 1), n ∈ N, the symmetries are
incompatible and the Clebsch-Gordan coefficient is zero. For L = li + lj − (2n), n ∈ N, the
Gamma function evaluates to a negative integer, which is a pole of the function.

49
Since the first coefficient of the function is zero, it is trivial F4(0, β; γ, γ′;x, y) = 1, yielding
the usual powers of r for multipole expensions. For instance the L = li = lj = 0 contribution,
which is the monopole-monopole term, yields the usual
(2.27) UL=li=lj=0ij =
QiQj
r,
where Qi = −4πR2i cos θm. Note that we defined the energy between charges to be qiqj/r in
χes(r), so this result is consistent with the unit system used 4π/ϵ = 1.
B. Field equations from stretched exponential functions
In equation 2.3, we have defined the auxiliary field as an convolution between the pairwise
interaction χ(r) and the density field ρj(r). In, equation 2.5, we relate the total energy to the
convolution of the auxiliary field with the density field ρi(r), which is written as
(2.28) Uij(rij, Ri, Rj) = ρi(r, Ri) ∗ χ(r) ∗ ρj(r, Rj).
This triple convolution is then related to products in reciprocal space,
(2.29) Uij(ρ, Ri, Rj) = ρi(ρ, Ri)χ(ρ)ρj(ρ, Rj) =(ρi(ρ, Ri)χ(ρ)
1/2)(
χ(ρ)1/2ρj(ρ, Rj)).
If there exists a well-defined inverse transform of χ1/2(ρ) and assuming that ρi(r) = ρj(r),
then we can define an new auxiliary field such that Φρiχ(ρ, Ri) = ρi(ρ, Ri)χ(ρ)1/2. The energy is
then defined as a self-convolution

50
(2.30) Uij = Φρiχ(ri, Ri) ∗ Φρiχ(rj, Rj)
The well-defineness of inverting χ(ρ)1/2 is quite limiting as we have only found that stretched
exponentials χ(r) = exp(−rq) with 1/2 ≤ q ≤ 2 fit this criteria.
C. Vector fields
In Section 2.3 we describe directional interactions under the assumption that energy can be
expressed as an overlap of scalar fields. However, the approach is generalizable to tensor fields.
For simplicity, let us look at an interaction that stems from the inner product of the vector field of
two distinct particles Φi and Φj ,
(2.31) Uij =
∫V
Φi · ΦjdV.
This type of interaction can be used to describe electrostatic interactions through electric fields,
(2.32) UEij =
1
2
∫V
ϵ|E|2dV =1
2
∫V
ϵ(|Ei|2+|Ej|2+2Ei · Ej
)dV,
where the first two terms are constants and the last term is in the same form as equation 2.31. In
order to evaluate 2.31, we separate the field into multiple components such that
(2.33) Φi = Φxx+ Φyy + Φz z.

51
in the reference frame of the particle. The additional difficulty stems from the fact that once
the particle is rotated, Φz may now point in the x direction. This is resolved by considering the
overlap of 9 fields, by taking rotation of unit vectors
(2.34) Uij =∑k,k′
∫V
ΦkiΦ
k′
j Rik · Rj k′dV,
where k, k′ = x, y, z and Ri is the rotation operator of the ith particle. Unlike the expansion done
for interacting charges in equation 2.22, direct use of an electric field permits the use of charge
distributions interacting in non isotropic media, that is, ϵ only has the restriction that it needs to be
constant throughout the volume. This could be used for instance, to calculate charge interactions
of colloids suspended in liquid crystal media, where ϵ is a tensor.
D. Excluded volumes and Van der Waals gas
In coarse-grained models, one generally uses Lennard-Jones forces to model interactions. This
includes a short-ranged repulsive part which shows a r−12 dependance. This would suggest use of
χ(r) ∼ (σ/r)12 − (σ/r)6. However, the Fourier transform of such a function does not exists. One
could regularize it by changing r to r + δ, or adding other short ranged potentials to remove the
divergence, but this hides a major problem in that we truncate the Fourier series or equivalently
use spatial filtering. While Eq. 2.3 is strictly physical and exact, after truncation it is akin to
(2.35) Uij =
∫V
⟨ρi(r)⟩⟨Φρj(r)⟩,

52
where ⟨⟩ is some kind of spatial average consistant with the Fourier series truncation. If one
plots the pair distribution function for a Lennard-Jones system, it becomes trivial to see that no
overlap is present for small values of r (or large χ(r)). In order to evaluate the excluded volumes,
we will need to use some spatial average of the Lennard-Jones interactions. As an approximation,
one can still use regularization, but it has to be done carefully as it may impact the system behavior.
Instead of using a soft repulsive term, one can start with the Van der Walls equation of state,
which writes the average enthalpy per particle of a gas of hard spheres of volume b as
(2.36) HV dW/N = kBT
(1
1− ρb+
3
2
).
Here we assume that we can treat all excluded volume interactions as Van der Waals gas and
write the overall energy as the integral of the spatially filtered enthalpy. We also assume that
local density can be written as pairwise densities, such that ρ = ρi + ρj in the local enthalpy.
Disregarding the constant 3/2 term, this leads to a local enthalpy defined by
(2.37) H localV dW = kBT
1
1− (ρi + ρj)b.
In the present formalism, we cannot treat arbitrary potential in ρ. However, we can expand in
power series,
(2.38) H localV dW ≈ kBT
(1 + b(ρi + ρj) + b2(ρi + ρj)
2 + b3(ρi + ρj)3 + ...
).

53
Given that powers of strictly ρi and ρj are not part of pairwise potentials of colloid, we do not
have to deal with them. We are then left with the following interaction
(2.39)βHV dW = 2b2
∫V
ρi(r − ri, Ri)ρj(r − rj, Rj) + 3b3∫V
ρ2i (r − ri, Ri)ρj(r − rj, Rj)
+ ρi(r − ri, Ri)ρ2j(r − rj, Rj) + ...
One can then produce fields for ρ(r, R), ρ2(r, R), ..., for all colloids and trucate the series at
some power of ρ.
E. Supplementary data for the liquid-gel transition
The liquid-gel morphology transition of asymmetric charged Janus particles is in appearance a
continuous transition where the branches of the gel are thick near the liquid phase. This can be seen
on Fig. 2.6. The transition is characterized by gradual changes of the pair correlation function, as
shown on Fig.2.7.

54
a) b)
c) d)
Figure 2.6. Snapshots of the simulations of charged Janus particles (θm = 1.40) for differ-ent temperatures. a) T = 1.62, b) T = 1.42, c) T = 1.20, d) T = 1.0. Arrows indicate thenorth pole of the Janus particles

55
Distance
1.5 2 2.5 3 3.5 4 4.5 5 5.5 6
Pa
ir c
orr
ela
tio
n f
un
ctio
n
0
5
10
15
20
25
30
35
T = 2.00
T = 1.82
T = 1.62
T = 1.42
T = 1.20
T = 1.00
T = 0.77
T = 0.65
Figure 2.7. Pair correlation functions for different temperatures for the asymmetric (θm =1.40) Janus particles for λ = 0.32.

56
CHAPTER 3
Time dependent orbitals for coarse-grained polymer-coated colloids
Authors : Martin Girard, Trung Dac Nguyen, Monica Olvera de la Cruz
1. Abtract
Nanoparticles including proteins functionalized with thiols, polymers or DNA self assemble
into one-, two-and three-dimensional structures or amorphous aggregates depending on the config-
urational changes of the grafted chains upon association. In these systems is often desire to reduce
the degrees of freedom of the chains with a few collective variables that capture the effective in-
teraction between the particles. We develop here an orbital model for coarse-graining anisotropic
colloids including the deformation of the grafted chains. Pair interactions between the colloids
induce the time-dependent deformation of the chain density fields, yielding implicit many-body
effects. Using this model, we revisit some of the recently published work on deformation of the
shell of grafted chains around nanoparticles. We show that for spherical particles, the energy of
deformation increases with angular number, consistent with previously published results includ-
ing the grafted chain explicitly. Unlike spherical models, however, this coarse-graining method is
applicable to any anisotropic colloid.
Nanoparticles including proteins functionalized with thiols, polymers or DNA self assemble
into one-, two-and three-dimensional structures or amorphous aggregates depending on the config-
urational changes of the grafted chains upon association. In these systems is often desire to reduce

57
the degrees of freedom of the chains with a few collective variables that capture the effective in-
teraction between the particles. We develop here an orbital model for coarse-graining anisotropic
colloids including the deformation of the grafted chains. Pair interactions between the colloids
induce the time-dependent deformation of the chain density fields, yielding implicit many-body
effects. Using this model, we revisit some of the recently published work on deformation of the
shell of grafted chains around nanoparticles. We show that for spherical particles, the energy of
deformation increases with angular number, consistent with previously published results includ-
ing the grfted chain explicitly. Unlike spherical models, however, this coarse-graining method is
applicable to any anisotropic colloid.
2. Introduction
Functionalizing nanoparticles and colloids with short ligands, polymers and complementary
DNAs has been recognized as a promising approach to engineering nanostructures with desirable
complexity such as higher-order assemblies and colloidal crystals [66, 67]. With the characteristic
dimension of the assembling building blocks varies from 5-100 nm, the primary driving forces for
the formation of the assembled nanostructures come from non-covalent interactions such as elec-
trostatics, hydrophobicity and van der Waals attractions [68, 69]. The fact that these interactions
are little sensitive to the atomic and molecular details of the building blocks inspires the devel-
opment of generic computational models as long as they capture the most relevant physics of the
phenomena of interest. Clearly, the geometry and physical properties of the polymer shell are the
vital factors that determine the interactions between the polymer functionalized nanoparticles and
colloids.

58
Coarse-grained models for colloids and nanoparticles coated with a soft corona of polymers
or DNA strands have been developed and used extensively in the literature. To improve the com-
putational efficiency of studies that involve a large number of particles, it is highly desirable to
represent the degrees of freedom of the polymer chains with a few collective variables that im-
plicitly capture the effective interaction between the particles. For colloids with arbitrary shapes,
the collective variables need to handle relative orientations of the bodies using techniques such
as the recently developed orbital expansion method [70]. While such approach in many cases
provide sufficient fidelity, it is limited because it neglects any internal degree of freedom that the
grafted chains may possess. For chain-coated colloids, the hidden variable is the deformation of
the grafted shell of chains around the particle, which gives rise to multibody effects. We have
recently observed these effects in DNA-coated cubes [33], where deformation of the DNA shell
induces symmetry breaking from cubic to tetragonal symmetry. Multibody interactions in spheres
coated with chains were also observed in Refs. [71] and [72] but discarded as being weak. Strong
effect of shell deformation was observed in binary hydrocarbon-grafted gold particle assemblies
[21]. In particular, the system shows strong deviation from the hard sphere packing considerations
(see [73] for a discussion of packing of soft spheres), which can be explained by deformation of
the shell of grafted chains [20]. It was demonstrated that the shell of a colloid only deforms if it has
fewer than six nearest neighbors. Usage of three-body correction as done in [74] was nonetheless
insufficient to reproduce the crystal lattices observed in [21]. Moreover, extension of three-body
potentials or the approach of [20] to anisotropic bodies is obviously not straightforward.
Herein, we address the limitation of existing coarse-grained models by incorporating collective
degrees of freedom representing the shell of grafted chains in terms of orbitals, in a similar fashion
of our previous description of anisotropic bodies [70]. The approach is conceptually similar to
the development of [75] but goes beyond the calculation of phonons. It is also close in spirit to

59
other normal mode techniques developed in [76], but makes use of localized basis sets. While
the approach is mathematically exact only for small deformations, it captures general behaviors of
these deformable systems and is applicable to arbitrary anisotropic bodies. We revisit the binary
superlattice systems comprised of chains grafted colloids, validate the regimes in which the six
neighbor rule is valid and provide means to evaluate whether deformation should be considered.
3. Mathematical formalism
The mathematical basis on which we rely has been described in our previous paper [70]. We
relate the potential energy between two colloids i and j, located at coordinates ri and rj , with
orientation Ri and Rj with particle density ρi and ρj and interaction χ(r) through :
(3.1) Uij(ri, Ri, rj, Rj) =
∫V
ρi(r − ri, Ri)Φρj(r − rj, Rj)dr
Where Φρj is an auxiliary field given by:
(3.2) Φρj(rj, Rj) = ρj(rj, Rj) ∗ χ(r)
In our previous paper, we had described the field using Fourier transforms, which describe a
transform into an continuous basis. This is unsuitable for time variant fields as we would have to
update all the reciprocal space values of all colloids at every time step. Here we want to use a finite
basis such that the density around a colloid can be written as :
ρi(r) =∑nlm
cnlmYmℓ (θ, ϕ)F ℓ
n(r) = cnlm |nlm⟩

60
Where we have introduced Ket notation for convenience and to highlight the similarities with
quantum mechanical expressions. In order to obtain convergence and tractable calculation, we
require that the basis form a complete and orthogonal set such that ⟨nlm | n′l′m′⟩ = δn′
n δl′
l δm′m and
any spatial function can be exactly represented by equation 3. The vector of all coefficients cnlm is
written as c. In order to treat rotations, we introduce Wigner functions Dlm,µ. A rotation operator
R takes a state |nlm⟩ and transforms it such that :
R |nℓm⟩ =∑µ
Dℓm,µ(R) |nlµ⟩
For simplicity of the notation, we write a set of indices n, l,m as k, so that |nℓm⟩ = |k⟩ . We
expend the density such that ρi(t) = ρ0i +∆ρi(t), which then yields a time dependent density for
any colloid i:
(3.3) ρi(r, Ri) =∑
n,ℓ,m,µ
(c0k + ck(t)
)Dℓ
m,µ
(Ri
)Y mℓ (θ, ϕ)F ℓ
n(r)
For isolated colloids the interactions between the internal degrees of freedom yields the self
energy Uii, given by:
(3.4) Uii =(ρ0i +∆ρi(t)
)∗ χ(r) ∗
(ρ0i +∆ρi(t)
)Which can be expended into :
(3.5) Uii = ρ0i ∗ χ ∗ ρ0i + 2ρ0i ∗ χ ∗∆ρi(t) + ∆ρi(t) ∗ χ ∗∆ρi(t)

61
Up to now, the development is entierly general, and we are free to choose any function for ρ0i
in equation 3.4. If we choose ρ0i to be the time averaged value for an isolated colloid then the time
varying density ∆ρi(t) can be viewed as fluctuations around the mean. If these fluctuations are
sufficiently small, we have at first order∫VΦρ0i
∆ρi(t) = 0. Since ρ0 ∗ χ ∗ ρ0 is time independant,
it does not contribute to forces. The only term which is not static in time is given by :
(3.6) Uii =
∫V
∆ρiχ∆ρi = cTM c
Where the interaction matrix M is given in a shape analogous to quantum mechanics :
(3.7) Mk,k′ =
∫V
∆ρkχ∆ρk′ = ⟨k |χ| k′⟩
The eigenvectors of Mk,k′ are normal modes of the colloid as one would expect from linear
theory. They can be represented by a set of independent oscillators: Uii =∑
K 1/2uKc2K . The
time evolution of cK is then given by a Langevin equation:
(3.8) cK = − dU
dcKmK − γK cK + ηK
where mK has units of mass and represents a collective mass of the Kth eigenmode, γK is the
associated friction and ηK a random force consistent with fluctuation-dissipation theorem. This
sets the method apart from usual Car-Parrinello approaches, as here the temperature is not zero.
While one might ponder on the significance of collective masses of the internal degrees of freedom,
calculation of any realistic system where monomers experience friction will lead to an overdamped

62
equation of motion for relevant degrees of freedom. Therefore, choice of the collective mass is of
no importance for calculations. Nevertheless, as we show later, one can extract a value for this
parameter when coarse-graining the system.
4. Numerical Implementation
4.1. From explicit chain models to orbitals
In order to compute time evolving orbitals, the series coefficients c0k and ck(t) must be obtained
from single colloid MD simulations. For this purpose, we run simulations consisting of a single
colloid pinned to the center of the simulation box. Since MD simulations only record coordinates
of the center of beads, we need to replace every individual “atom” with a gaussian function. The
with of this function is chosen to match bead diameter. For every frame, we then need to integrate
the basis ⟨k| against the density |ρ(t)⟩ . Since this is a very expensive operation we use a few
approximations. First, we define a grid in space on which we can define |k⟩ at every point. For
every frame, we then pin every MD bead to the closest point on that grid. The whole grid is then
convolved with a gaussian kernel, which is identical to replacing every bead by a gaussian function
centered around the center of mass of each bead. We then take the conjugate of |k⟩ and multiply it
pointwise against the density grid and sum the result. This produces the approximation of :
ck(t) =∑i
⟨k | 1
σi
√2π
exp(−|r − ri|2/2σ2i )⟩
Where σi is the diameter of the ith bead and ri it’s position. For this calculation, we ignore
any contribution coming from inside the colloid rigid core. We then obtain the average density
vector components by a simple average: c0k = ⟨ck(t)⟩t. The matrix Mk,k′ is then computed di-
rectly from fluctuations: Mk,k′ = ⟨k − c0k | k′ − c0k′⟩. The matrix is then diagonalized, which

63
provides the eigenmode. The spring constant of each mode can be found either by the eigen-
value or mean occupancy ⟨c∗KcK⟩ which are equivalent. An estimate for the collective friction
γK can be found by the frequency response of the oscillators to a damped oscillator with profile
aK(ω) ∝ ω20/(ω
√(2ω0γK)2 + ω−2(ω2
0 − ω2)2), where ω0 is the intrinsic frequency of the Kth
collective oscillator.
4.2. Choosing an appropriate F ln(r) function set
As discussed in the previous section, the choice of F ℓn(r) is arbitrary, with the requirement that it
forms a complete orthogonal basis. If one uses an infinite number of basis function, results are
independent on the exact form. However, we wish to truncate the series to only keep the lowest
order modes, which implies that some functions are better than others.
Truncation of the series at n = 1 (a single spherical term in the series) yields a few interest-
ing results. If fluctuations are completely discarded we have ∆ρi(t) = 0. The density is thus
spherically symmetric and time-independent. Error on the density can be minimized by choosing
a set such that F 01 (r) = ρ0i (r). Furthermore, interactions between two colloids depends only on
the distance between them and is completely determined by χ(r), which assumes the role of the
potential of mean force. Standard approaches to determination of effective interactions can thus be
viewed as a severe truncation of equation 3 to a single non-fluctuating internal degree of freedom.
To obtain sets of suitable functions for F ℓn(r), one can take solutions to Sturm-Liouville prob-
lems which yield spherical harmonics for the angular part. In particular, the separable Laplace
equation in spherical coordinates is well studied and occurs frequently in quantum mechanics :
(3.9) − ∂2
∂r2F (r) +
(V (r) +
ℓ(ℓ+ 1)
r2
)F (r) = −λF (r)

64
Where V (r) is an arbitrary smooth potential function. The typical boundary conditions as-
sociated with this problem in quantum mechanics is F (∞) = 0. Some solutions are known for
specific forms of V (r). For instance, V (r) = −Z/r yields solutions in the form of hydrogenoid
wavefunctions. For coarse-graining purposes, one may wish to use V (r > rm) = ∞. For the sake
of simplicity, we restrict the study to hydrogenoid wavefunctions.
While the general form of V (r) is fixed, we have to choose a “good” value of Z, which re-
quires minimization of some error. This procedure must also be done for general optimization (not
restricted to Z) of the basis set. For this purpose, we define the error on the density field as:
(3.10) Err =||ρ(r, R)− ρ(r, R)||1/22
||ρ(r, R)||1
, where ρ(r, R) is the true density measured from MD simulations and ||·||N is the LN -norm.
One can see the close connections between equation 3.1 and the usual ab initio molecular
dynamics (AIMD) potentials, with a few differences. Here, we expend the density ρ(r) instead of
the complex amplitude into fields. Obviously, the particles are classical so that we do not have to
enforce fermion behavior such as parity of wavefunctions.
4.3. Implementation into an existing Molecular Dynamics simulation code
We implement our approach into LAMMPS [49], a massively parallel Molecular Dynamics code.
The BODY package in LAMMPS provides a flexible framework for particles with user-defined
internal degrees of freedom. The implementation involves three components: 1) a new data struc-
ture that stores the time-dependent eigenmodes as the internal degrees of individual particles; 2) a
new force field that describes the interaction between the colloids, and 3) an integrator to evolve
the eigenmodes over time. At a given time step, the force and torque between two colloids are

65
computed from their orbitals (Equation 3.7). The eigenmodes are evolved along with the colloids
(3.8) in the velocity Verlet scheme. Our code is available for download at [url].
5. Polymer-coated spheres as a model
Spherical particles are ideal to study how this model performs. First, unlike our previous
reserach on DNA-coated cubes in [33], we do not have to worry about a cube-like to sphere-like
mean grafting density. The spherical symmetry results in modes with well defined orbitals that can
be labeled by their atomic counterparts, S(ℓ = 0), P(ℓ = 1), D(ℓ = 2), ... .
The system we are interested in are spheres of diameter d = 6σ, grafted with ngr chains each
comprised of L beads of diameter σ = 1. These beads are connected by a harmonic springs with
potential energy Us = ks(r − rs0)2/2, with rs0 = σ and ks = 5kBT/σ
2, where kBT is the thermal
energy. Non-connected beads interact through a WCA potential (12-6 Lennard-Jones with cutoff
set to 21/6σ), corresponding to polymer chains in a good solvent.
Error analysis based on optimized hydrogenoid wavefunction yield small typical RMS errors
(see Fig. 3.1). The error decreases with either increased grafting density or polymer length.
5.1. Spectral analysis
A notable prediction in ref [20] is the limit on topological charge qT ≤ 4 or equivalently a re-
striction in angular number ℓ ≤ 3. This limited should be captured in the spectrum. In order to
decompose the fluctuations into series of modes, we use a cutoff of n = 5 (55 modes), which
should allow for modes with ℓ = 4.
Three sets of data are considered, varying ngr from 5 to 55 with L = 15 and varying L from 1 to
25 with either ngr = 5 or ngr = 20. The results, shown in Fig. 3.2, reveals interesting properties of
the energy spectrum. Under reasonable grafting (ngr ≲ 36), hairy particles L > d, fluctuations are
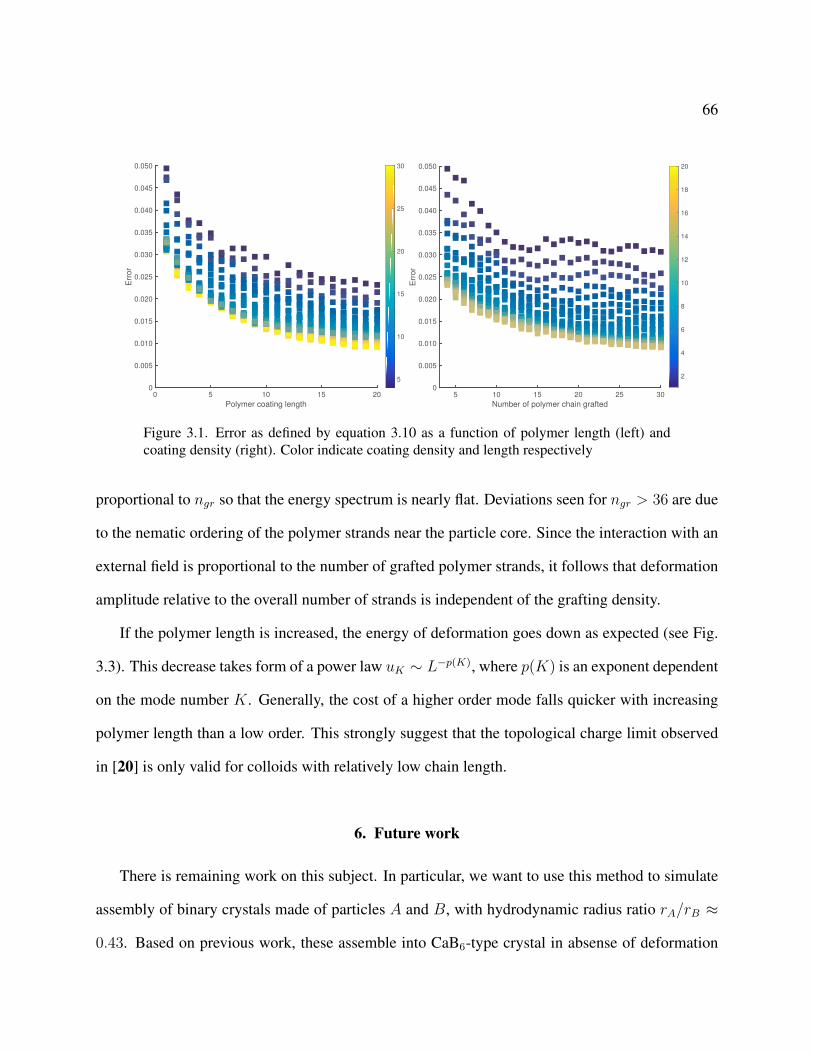
66
Polymer coating length
0 5 10 15 20
Err
or
0
0.005
0.010
0.015
0.020
0.025
0.030
0.035
0.040
0.045
0.050
5
10
15
20
25
30
Number of polymer chain grafted
5 10 15 20 25 30
Err
or
0
0.005
0.010
0.015
0.020
0.025
0.030
0.035
0.040
0.045
0.050
2
4
6
8
10
12
14
16
18
20
Figure 3.1. Error as defined by equation 3.10 as a function of polymer length (left) andcoating density (right). Color indicate coating density and length respectively
proportional to ngr so that the energy spectrum is nearly flat. Deviations seen for ngr > 36 are due
to the nematic ordering of the polymer strands near the particle core. Since the interaction with an
external field is proportional to the number of grafted polymer strands, it follows that deformation
amplitude relative to the overall number of strands is independent of the grafting density.
If the polymer length is increased, the energy of deformation goes down as expected (see Fig.
3.3). This decrease takes form of a power law uK ∼ L−p(K), where p(K) is an exponent dependent
on the mode number K. Generally, the cost of a higher order mode falls quicker with increasing
polymer length than a low order. This strongly suggest that the topological charge limit observed
in [20] is only valid for colloids with relatively low chain length.
6. Future work
There is remaining work on this subject. In particular, we want to use this method to simulate
assembly of binary crystals made of particles A and B, with hydrodynamic radius ratio rA/rB ≈
0.43. Based on previous work, these assemble into CaB6-type crystal in absense of deformation
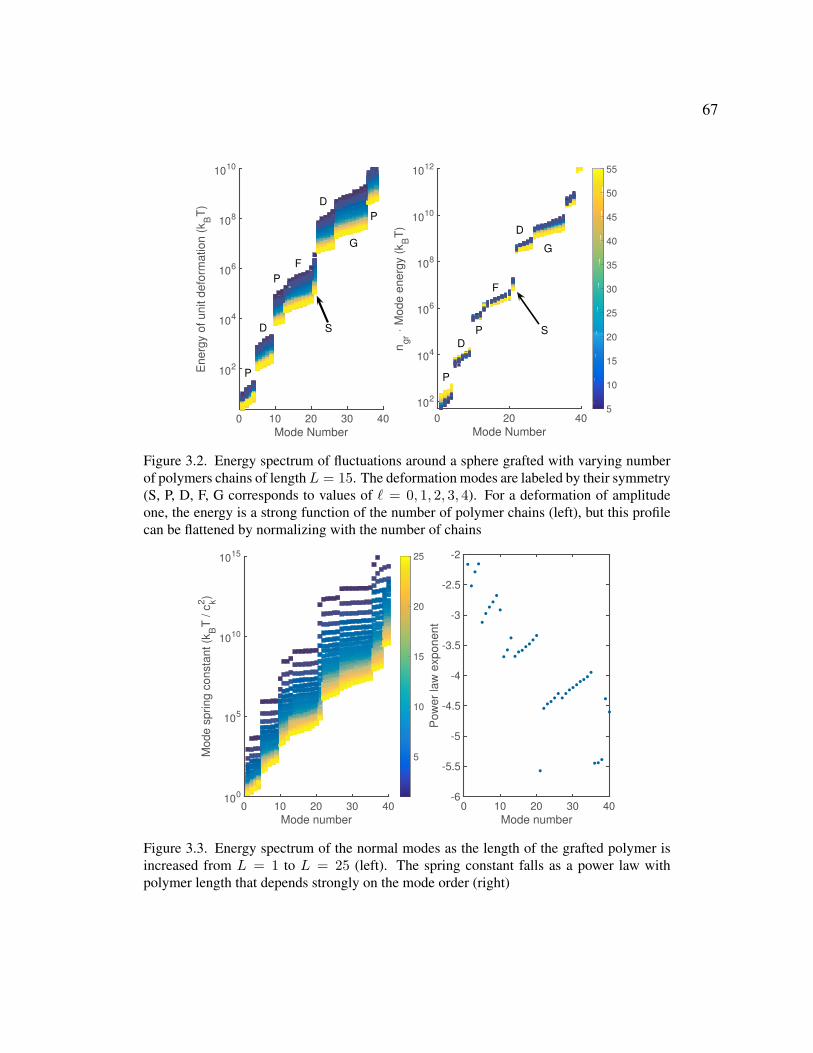
67
Mode Number
0 10 20 30 40
Energ
y o
f unit d
efo
rmation (
kBT
)
102
104
106
108
1010
P
P
D
D S
G
F
P
Mode Number
0 20 40
ng
r · M
ode e
nerg
y (
kBT
)10
2
104
106
108
1010
1012
5
10
15
20
25
30
35
40
45
50
55
P
P
F
S
D
D
G
Figure 3.2. Energy spectrum of fluctuations around a sphere grafted with varying numberof polymers chains of length L = 15. The deformation modes are labeled by their symmetry(S, P, D, F, G corresponds to values of ℓ = 0, 1, 2, 3, 4). For a deformation of amplitudeone, the energy is a strong function of the number of polymer chains (left), but this profilecan be flattened by normalizing with the number of chains
Mode number
0 10 20 30 40
Mo
de
sp
rin
g c
on
sta
nt
(kBT
/ c
k2)
100
105
1010
1015
5
10
15
20
25
Mode number
0 10 20 30 40
Po
we
r la
w e
xp
on
en
t
-6
-5.5
-5
-4.5
-4
-3.5
-3
-2.5
-2
Figure 3.3. Energy spectrum of the normal modes as the length of the grafted polymer isincreased from L = 1 to L = 25 (left). The spring constant falls as a power law withpolymer length that depends strongly on the mode order (right)

68
and bccAB6 in presence of deformation. This would produce an elegent confirmation that the
method is able to match previous predictions.
We also intend to study spectral features of anisotropic particles such as cubes. Unlike spheres,
their modes are not symmetrically pure. This means that the lowest eigenmode is not of type S
but rather a sum of S, G, I , ... symmetries. This complicates analysis, but we intend to relate the
energy of deformation to our previous results on DNA-coated cubes.

Part 2
Physics of real self-assembled systems

70
While the mean-field model developed captures information about colloid shape and deforma-
tion of polymer brushes, it is not entirely suitable for high-information polymers. The problem lies
in the depletion of available binding sites: each base can only form a single bond. The mean-field
approach assumes linearity with the density, so that if we have two types of DNA binding together,
doubling the amount of each type quadruples the overall binding energy instead of doubling it. The
progress made towards representing deformable polymer coated particles in the previous sections
is thus not sufficient to fully model experimental systems. It also does not allow for inclusion of
details such as ion-strand interactions.
For the experimental systems we are interested in, we used detailed models with explicit chains.
In the following chapters, multiple different systems will be presented, each of which is described
in a single paper either published or in preparation.
The first work concerns crystals assembled from anisotropic building blocks. The shapes stud-
ied have high symmetry: rhombic dodecahedrons, octahedrons and cubes. For very short strands,
the crystal lattice is given by the close packing of the shapes: FCC, BCC and SC. For extremely
long strands, the lattice is given by packing of spheres, FCC, and the particles are randomly ori-
ented. Interestingly, we find symmetry breaking for cubic particles at intermediate DNA lengths.
The second work models growth of AB2-type lattices (P6/mmm with filled 2d sites). Since
the base unit cell contains three unique points, each set of Miller indices can represent up to three
different planes. This has a unique effect on crystal growth as the final crystal habit can expose
high energy planes instead of the low energy planes predicted by the Wulff construction. This is
due to high energy barriers between different planes with the same Miller indices.
The third article looks at crystal growth at different salt concentrations in water. Addition of
salt ions in the solution induces increased barriers to attachment of colloids to the crystal and slows
down crystal growth. From the viewpoint of the crystal, the long ranged mass diffusion is faster
71
and each grain undergoes the interface-limited to diffusion-limited regime change at larger grain
size, thus producing larger crystals.
The last article models a system assembled from a binary mixture of large (∼10 nm) and
small particles (∼2 nm). The latter particles have a small amount of DNA strands grafted onto
them. Large colloids have a number of bound strands approximately equal to the average binding
fraction due to the law of large numbers. For smaller particles however, individual colloids have
only a few strands and can even have all their strands unbound. This leaves them free to roam the
crystal, behaving as electrons rather than atoms.

72
CHAPTER 4
Exploring the zone of anisotropy and broken symmetries in DNA-mediated
nanoparticle crystallization
Authors: Matthew N. O’Brien*, Martin Girard*, Hai-Xin Lin, Jaime A. Millan, Monica Olvera
de la Cruz, Chad A. Mirkin
1. Abstract
In this work, we present a joint experimental and molecular dynamics simulations effort to
understand and map the crystallization behavior of polyhedral nanoparticles assembled via the
interaction of DNA surface ligands. In these systems, we systematically investigated the interplay
between the effects of particle core (via the particle symmetry and particle size) and ligands (via
the ligand length) on crystallization behavior. This investigation revealed rich phase diagrams,
previously unobserved phase transitions in polyhedral crystallization behavior, and an unexpected
symmetry breaking in the ligand distribution on a particle surface. To understand these results, we
introduce the concept of a zone of anisotropy, or the portion of the phase space where the anisotropy
of the particle is preserved in the crystallization behavior. Through comparison of the zone of
anisotropy for each particle we develop a foundational roadmap to guide future investigations.
2. Body
Over the past decade, major advances in the control of nanoparticle interactions have led to
powerful methods to assemble colloidal crystals [66, 77, 78, 79, 80, 81, 82, 83, 84]. A high

73
degree of structural control can be achieved in these methods if surface-bound ligands are used
as nanoscale bonding elements to control the specificity, spacing, and strength of interactions.
DNA has emerged as a particularly versatile ligand whose chemically and structurally defined
nature can be used to program the symmetry, lattice parameters, and habit of colloidal crystals
[66, 77, 82, 85, 86, 87, 8, 5, 88, 89, 90, 91, 92]. The shape of the underlying nanoparticle influences
the directionality of DNA interactions, which can result in correlated nanoparticle orientations and
predictable crystal symmetries based on geometric considerations [82, 8, 89, 92, 41]. However,
predictive control can be lost if the DNA shell does not preserve the anisotropy of the particle
core [8], and thus key questions pertain to (i) the phase space over which predictable directional
interactions persist and (ii) the nature of the phase transitions that occur as the anisotropy of the
particle disappears. Identifying this “zone of anisotropy” and the broken symmetries that form are
critical to establish design rules for work with nonspherical particles and to develop nanostructured
materials with controlled properties.
Herein, we systematically investigate the phase space encoded by particle symmetry, particle
size (L), and DNA length (D) to understand and map where directional interactions persist (Fig.
4.1). We show that particle symmetry dictates the crystalline states that can be accessed and how
easily changes in L and D affect phase transitions between these states, which include transitions in
Bravais lattice (i.e., the symmetry of how the particles are arranged within the unit cell) and particle
orientation. The concepts introduced herein provide a roadmap to understand and predict particle
crystallization behavior toward the construction of functional nanoparticle-based materials.
To map the zone of anisotropy in DNA-mediated nanoparticle crystallization, three common
polyhedra were investigated: cubes, octahedra, and rhombic dodecahedra. These nanoparticles are
primarily bound by a single crystallographic plane repeated across the structure 6, 8, or 12 times,
respectively (Fig. 4.1A), and can be synthesized via a seed-mediated method that yields >95%

74
Figure 4.1. Polyhedral nanoparticles with different symmetries can be functionalized withDNA and used as building blocks to study nanoscale crystallization processes. (A) EMimages of cube (green), octahedron (red), and rhombic dodecahedron (blue) nanoparticlesused in this work shown in order of increasing particle symmetry. Below each image isa model of the particle shape and a corresponding ball-and-stick diagram to indicate thesymmetry. Nanoparticle edge length (L) is indicated next to each shape. (B) The phasespace encoded by DNA length (D) and nanoparticle surface area (SA) is depicted for eachsymmetry nanoparticle. The darker color region in each phase diagram indicates the zoneof anisotropy (ZoA). (C) The phase transition depicted by the dashed line in B, wherein Lis fixed as D is increased, is shown, wherein the anisotropy of the particle core is lost.

75
of the desired shape with <5% variation in size (Fig. 4.1A) [6]. Particle uniformity was rigor-
ously analyzed with a recently reported and freely available program that algorithmically analyzes
transmission electron microscopy (TEM) images to analytically determine nanoparticle structure
[7]. As-synthesized gold nanoparticles were densely functionalized with DNA, and subsequently
DNA “linkers” of programmable length (tuned in rigid 12-nm, double-stranded segments) were
hybridized to the surface-bound DNA. Each DNA linker possesses a short, single-stranded “sticky
end” with a self-complementary sequence that extends into solution (Table S1). Together, this de-
sign yields polyvalent building blocks that connect to each other through the collective hybridiza-
tion of many DNA sticky ends. To facilitate comparison between different shapes, surface area
(SA) was used instead of L, because this number correlates with the number of DNA strands given
a similar DNA density.
Crystals were formed by slowly annealing DNA-functionalized nanoparticles from high to
low temperature, which results in a slow increase in supersaturation that ensures nanoparticles
crystallize into their lowest free energy configuration [3]. These crystals were analyzed in solution
with small angle X-ray scattering (SAXS; Fig. S1 and Tables S2-S4) and in the solid state, after
encapsulation in silica, with EM (Fig. S2). Scattering data were modeled using the pseudolattice
factor approach (SI Materials and Methods) [89, 93, 94] and compared with experimental data
to determine crystal symmetry, lattice parameters, and particle orientation. Importantly, use of
a slow crystallization procedure and highly uniform building blocks minimizes the formation of
defects and kinetically trapped states, which enables increased crystalline domain sizes, crystalline
formation over a wider range of conditions, and more definitive assignments of thermodynamic
phase boundaries relative to previous reports [8].
To elucidate the zone of anisotropy for each particle shape, five SA and five D were investi-
gated, beginning with high-symmetry rhombic dodecahedra (Fig. 4.2 A and B, Fig. S1, and Table

76
Figure 4.2. The crystallization behavior of high symmetry polyhedra exhibits limited com-plexity as a function of D and L. (A) An FCC crystalline phase is observed for the majorityof the phase space investigated for rhombic dodecahedra. To-scale unit cells are shownat top, with lattice vectors, for small and large values of D. EM images corresponding tothe unit cells are provided below, with an inset from the unit cell to show particles in thesame lattice plane. Throughout this figure, turquoise represents the zone of anisotropy (i.e.,a crystalline phase), and purple represents a plastic crystal phase. (Scale bars, 200 nm.)(B) The experimental phase diagram for rhombic dodecahedra is shown as a function of Dand SA. The checkered region indicates an extrapolation for larger, more experimentallychallenging sizes of rhombic dodecahedra. (C) MD simulations confirm the same phasetransition observed for rhombic dodecahedra as experiments, for systems that have beenscaled to smaller, computationally more accessible sizes in a manner consistent with ex-periments. The spatial distribution of DNA sticky ends is shown at right for each phase,where the DNA is localized between particles for the crystalline phase and more isotropi-cally distributed for the plastic phase. (D) As D increases for the smallest L of octahedrainvestigated, a phase transition from a BCC crystalline phase to an FCC plastic crystal isobserved. (E) Experimental phase diagram over the same range of D and L shows that thezone of anisotropy occupies a smaller area of the phase space relative to the rhombic do-decahedra. (F) MD simulations (for particles with similar SA as the rhombic dodecahedra)confirm the observed phase behavior.

77
S2). Rhombic dodecahedra can pack with 100% efficiency when the 12 rhombus-shaped facets on
a given nanoparticle align face-to-face with their neighbors in a crystalline phase (i.e., both transla-
tional and orientational order) with face-centered cubic (FCC) symmetry [41, 38]. Soft interactions
similarly predict an FCC crystalline phase, due to the greater number of DNA hybridization events
that arise from face-to-face interactions [8]. As SA decreases in these experiments (for a fixed D),
one might expect that fewer DNA strands per facet would lead to a smaller enthalpic driving force
for the crystalline phase and thus a transition to a plastic crystal phase (i.e., translational order, but
orientational disorder) with FCC symmetry, as expected for spheres. Similarly, as D increases (for
a fixed SA), one might expect that the greater free volume available to each sticky end would lead
to an entropic driving force that decreases the directionality of interparticle interactions and results
in a plastic crystal transition. Contrary to these expectations, FCC crystalline phases (Fig. 4.2 A
and B) were observed for all but the sample with the smallest SA and largest D, and thus the zone
of anisotropy encompasses nearly the totality of the investigated phase space. A linear increase in
the lattice parameter (a) with D supports the crystalline phase assignment, and the slope of ∼ 0.28
nm per base pair agrees with previous work for face-to-face interactions (Table S2) [8, 89].
To further understand how nanoparticle symmetry affects the zone of anisotropy, the crystal-
lization of octahedra was similarly investigated (Fig. 4.2 D and E, Fig. S1, and Table S3). The
dense packing of hard octahedra varies based on corner truncation or rounding [95, 96, 97], where
body-centered cubic (BCC) or body-centered tetragonal (BCT) crystalline phases are favored for
truncated octahedra [38, 97], and BCC or FCC plastic crystals are favored for rounded octahedra
[96, 98]. In experimental systems, the hydrodynamic particle shape deviates from an ideal octa-
hedron in favor of a BCC crystalline phase [8]. Similar to the rhombic dodecahedra described
above, the zone of anisotropy for octahedra (i.e., a crystalline phase with BCC symmetry) fills the
majority of the investigated phase space (Fig. 4.2E). Unlike the rhombic dodecahedra, however,
78
a phase transition and lattice compression occurred for larger SA octahedra at shorter D - from a
BCC crystalline phase to a FCC plastic crystal, as D increased (Fig. 4.2D).
To understand the origin of these phase transitions, nanoparticles were modeled with molecular
dynamics (MD) simulations. These simulations build upon previous work that has been shown
to accurately predict the DNA-mediated crystallization behavior of spherical particles [3, 14, 4,
13, 99, 100]; however, the broken symmetry of polyhedra requires additional considerations (SI
Discussion and Tables S5-S7). Although the experimentally investigated samples are too large to
model exactly, SA and D were scaled to a computationally accessible size regime in a manner
consistent with experiments, and DNA density was set based on experiments (Fig. S3 and Tables
S8 and S9). In these simulations, a collection of particles was fixed into a lattice with a specified
symmetry then allowed to relax at a temperature slightly below the crystal melting temperature to
evaluate stability (i.e., whether the structure reaches equilibrium). Through comparison of different
lattices for each particle symmetry and size (e.g., a BCC crystalline phase and an FCC plastic
crystal), one can evaluate the thermodynamically preferred phase and extract structural parameters
from the system, including lattice parameters, the fraction of DNA strands hybridized per particle
(F, enthalpic contributions), and the closest average distance between two adjacent DNA strands
on a single particle (entropic contributions).
As observed with experiments, the crystalline phase for rhombic dodecahedra was preferred
for smaller SA and larger D compared with octahedra (Fig. 4.2 C and F), with both shapes even-
tually transitioning to plastic FCC crystals. Furthermore, a linearly increased with D for all sizes
of rhombic dodecahedra (Table S8) and lattice compression was observed for octahedra in plastic
FCC crystals (Table S9), consistent with experiments. Calculations show that the observed transi-
tions originate from ligand-based entropic and enthalpic contributions. In particular, an increased
average inter-DNA spacing on the particle and lattice compression both indicate a wider range of

79
less-oriented DNA states, and thus an increased free volume accessible to each DNA sticky end [4].
This flexibility also allows for more DNA connections to be made between particles, as indicated
by a greater F.
Based on these results, it was hypothesized that a further reduction in particle symmetry should
lead to a smaller zone of anisotropy with a phase transition at larger SA and shorter D. More specif-
ically, the increased sphericity of high-symmetry particles should result in a more diffuse DNA
distribution (i.e., reduced number of DNA strands per facet) and a greater free volume available to
each DNA strand. Thus, as D increases, the resultant increase in charge repulsion and free volume
should not contribute as significantly as they do for lower-symmetry particles.
To test this hypothesis, the crystallization of cubes with comparable SA and D was investigated
(Fig. 4.3, Figs. S1 and S2, and Table S4). Cubes densely pack into a simple cubic (SC) crystalline
phase, with slight distortions in orientation for mildly truncated or rounded corners, or a plastic or
crystalline FCC phase for high degrees of imperfection [41, 95, 96, 97, 98, 39, 101, 102]. Indeed, a
smaller zone of anisotropy was observed for cubes relative to octahedra and rhombic dodecahedra,
consistent with the above hypothesis. Outside of this zone, two phase transitions were observed
as SA decreases and D increases that involve a change of Bravais lattice: a first-order transition
from an SC crystalline phase to a BCT crystalline phase, followed by a continuous transition
to a BCT plastic crystal (Fig. 4.3). The presence of an intermediate crystalline phase with an
interaction symmetry distinct from the nanoparticle shape represents an unexpected observation.
Interestingly, despite the change from cubic to tetragonal for the first transition, a (i.e., the minor
dimension in the square plane for the BCT phase and the only dimension for the cubic phases)
increases linearly with D for all investigated SA, with the same rise per base pair as observed for
rhombic dodecahedra and octahedra (Fig. 4.3). This result suggests that nanoparticles consistently
hybridize to one another along two axes, the (100) and (010) as defined by the symmetry of the final

80
Figure 4.3. Experimental investigation into cube crystallization behavior shows two con-tinuous phase transitions as a function of D and L. (A) As D increases for a given L (shownhere as L = 57 nm), cubes crystallize with (from left to right) SC (crystalline), BCT (crys-talline), and FCC (plastic) symmetries. For each symmetry, a unit cell is given, with the lat-tice parameters a and c indicated. Next to each unit cell is a TEM image of silica-embeddedlattices sectioned along a particular crystallographic plane. Below each unit cell is an SEMimage of silica-embedded lattices, with the lattice vectors indicated at bottom left. (Scalebars, 200 nm.) (B) Phase diagram for cubes as a function of D and SA, colored based onthe symmetry - SC (turquoise) or BCT (purple) - where each box is centered on a singleexperimental data point. (C) For the smallest cube size investigated (L = 42 nm), the datafor BCT phases are shown as a function of D. As D increases, c/a decreases and f increases.(D) The lattice parameter, a, increases linearly with D for all L investigated.
lattice, whereas symmetry breaks along the third axis, the (001). The continuous nature of the latter
transition can be seen from an orientational order factor (f, ranges from 0 for perfectly oriented to
1 for randomly oriented) determined from comparison between experimental and modeled SAXS
data (Fig. 4.3C and Table S4). This change in f occurs as the c/a ratio for the tetragonal unit cell
decreases from ∼ 1.7 to ∼ 1.4 (consistent with an FCC symmetry) (Fig. 4.3C). These results are
consistent with our hypothesis that lower-symmetry particles would possess a smaller crystalline
region of the phase space, but with more complexity than expected.

81
Figure 4.4. MD simulations of cube crystallization reveal that phase transitions occur due toa novel symmetry breaking of the ligand distribution. (A) As D increases in these systems,the distribution of DNA ligands breaks symmetry along the (001). Specifically, the DNAoriginally on the (001) splits apart and begins to points toward the edges of the (001),such that it can attach to four cubes. As D is increased further, these four interactionsbecome increasingly spaced apart due to electrostatic and free volume arguments. A model(Left) and image from an MD simulation (Right) are shown to indicate the distribution ofDNA sticky ends. (B) MD simulations along particular crystallographic planes reveal thedistribution of DNA sticky ends between particles. Planes shown are (100) for SC, (100)for BCT, and (110) for the plastic BCT. (C) A phase diagram based on simulation resultsconfirms the same trends in phase and particle orientation as observed in experiment. Thecolors are consistent with Fig. 4.3 and the checkered region indicates an extrapolation. (D)DNA angle (θ) with respect to an ideal angle of 0 (perpendicular to the surface) shows abroken symmetry for the DNA on the (001) of the BCT crystalline phase only (red). (E)Distance between DNA sticky ends (d) similarly shows that symmetry breaking for theBCT phase occurs away from the particle surface (red). Comparison between the threesymmetries further shows that as DNA length increases, the distribution of DNA distancesalso increases due to the greater free volume accessible.
To understand the origins of these phase transitions, cubes were simulated with MD (Fig. 4.4,
Figs. S4-S8, and Table S10). Importantly, phase transitions and lattice parameters consistent with

82
experiments were observed as a function of SA and D (Fig. 4.4). Close inspection of the spatial
distribution and angles of DNA engaged in hybridization shows that the symmetry breaking from
SC to BCT phases originates from an unexpected symmetry breaking in the ligand distribution
(Figs. S5 and S6). More specifically, the distances between DNA sticky ends are greater on
the BCT (001), relative to the BCT (100) and (010), whereas all faces possess equivalent DNA
distances in the SC and plastic BCT phases. Similar behavior is observed in the orientation angle
of DNA molecules with respect to the nanoparticle surface, wherein larger angles on the BCT
(001) indicate reduced face-to-face interactions. Interestingly, the broken symmetry of the DNA
distribution becomes more pronounced away from the particle surface, where the DNA can explore
a greater free volume. This occurs, in part, because the dense DNA shell near the surface of the
particle restricts the position of the DNA. Simulations with and without a dense DNA shell near the
surface indeed show that this dense shell is necessary to observe the transition to a BCT symmetry
(Fig. S8).
Collectively, these deviations allow each cube in the crystalline BCT lattice to hybridize to
four neighbors in a face-to-face fashion along the BCT (100) and (010), similar to SC lattices, but
to four neighbors above and four below along the BCT (001). Simulations indicate that the ob-
served transitions predominantly originate from the enthalpy and entropy of the DNA, rather than
the packing entropy of the particle shape (Fig. 4.4) [41, 98]. In particular, we hypothesize that
the DNA shell breaks symmetry as D increases to (i) reduce the electrostatic repulsion associated
with a longer DNA backbone, (ii) increase the free volume available to the DNA, especially at
the sticky ends (as discussed above), and (iii) ultimately increase the number of DNA hybridiza-
tion events that connect nanoparticles within the lattice. The lack of a corollary symmetry in the
nanoparticle, or preferred orientation of the (001) with respect to the experimental environment or
crystallization conditions, suggests that symmetry breaks upon addition to the lattice, driven by

83
the local DNA environment. These hypotheses are consistent with the transition from crystalline
BCT to plastic BCT, and the decrease in the plastic BCT c/a ratio, as D further increases - both of
which coincide with an increase in the distance between DNA strands and DNA angle. This unique
behavior highlights the importance of considering both particle and ligand effects in nanoparticle
crystallization.
This work defines the phase space where directional interactions persist for programmable
atom equivalents consisting of anisotropic nanoparticle cores as “atoms” and DNA ligands as
“bonds”. The understanding gained from this work establishes the range of conditions where
design rules based on geometric considerations can be used to predict crystal structure. If these
results were extended to lower-symmetry particles (e.g., tetrahedra), one would imagine an even
smaller zone of anisotropy and richer phase diagram, including the possibility of quasicrystal or
diamond lattices [41, 98, 39, 103]. Due to the highly modular and programmable nature of nucleic
acids, the location of these phase transitions can likely be tuned depending on the desired structure,
via modulation of the design (e.g., flexibility) [104] or the type of nucleic acid used (e.g., locked
nucleic acid or RNA) [105]. Beyond defining the zone of anisotropy, this work also establishes a
strategy to assemble nonspherical building blocks into a rich set of different phases based on the
interplay of the particle and ligand structure.

84
CHAPTER 5
Kinetically Controlled Non-Equilibrium Anisotropic Colloidal Single
Crystal Growth
Authors: Soyoung E. Seo*, Martin Girard*, Monica Olvera de la Cruz, Chad A. Mirkin
1. Abstract
Anisotropic colloidal crystals are materials with novel optical and electronic properties. How-
ever, experimental observations of colloidal single crystals have been limited to relatively isotropic
habits. Here, we show that DNA-mediated crystallization of two types of nanoparticles with dif-
ferent hydrodynamic radii leads to the formation of highly anisotropic, hexagonal prism micro-
crystals with AB2 crystallographic symmetry. We find that the DNA directs the nanoparticles to
assemble into a kinetic Wulff crystal structure that is enclosed by the highest surface energy facets
(AB2(1010) and AB2(0001)), an observation supported by molecular dynamics and Monte-Carlo
simulations. This behavior is a consequence of the large energy barriers between different ter-
minations of the AB2(1010) facet, which results in a significant deceleration of the (1010) facet
growth rate. In addition to describing a hexagonal crystal habit, which has high enhancement of
electromagnetic fields for applications in nonlinear optics and photocatalysis, this work represents
an advance where the interface kinetics control the formation of the experimentally observed habit
of colloidal microcrystals.

85
2. Body
The crystal shape (habit) of atomic systems is an external expression of internal structure.
The shape that a set of atoms adopts is largely dictated by the configurations of valence electrons
unique to each atom and crystallization conditions. In general, an equilibrium shape emerges from
the anisotropy of the surface energy, where preferential growth of the lowest surface energy facet
is thermodynamically favored[106, 107]. Various factors (e.g., pressure, temperature, concentra-
tions) can be used to generate single crystals with different structures and properties[108], which
inform their use in a variety of applications, including solar cells[109, 110] and optical devices[111,
112]. For colloidal crystals, recent a priori findings on the properties of three-dimensional (3D)
microcrystals composed of inorganic nanoparticles suggest that the use of shape anisotropy is
a promising path to designing and controlling optical responses in metamaterials[113, 114, 19].
In particular, nano- and microstructures with hexagonal cross-section (e.g., hexagonal wires),
which occur naturally in GaN, are interesting because these structures support whispering gallery
modes that exhibit low power loss and high quality factors[115, 116]. These crystals can be used
for nonlinear optics[117], an area where nanocomposites excel due to enhancement of nonlinear
susceptibility[118], or for photocatalysis[119]. For colloidal crystals, recent a priori findings on the
properties of three-dimensional (3D) microcrystals composed of inorganic nanoparticles suggest
that the use of shape anisotropy is a promising path to designing and controlling optical responses
in metamaterials[117, 118, 119]. However, despite significant interest in emergent properties asso-
ciated with such structures, this is, as of yet, done empirically because little is known about ways to
control mesoscale crystal shape and morphology. Although atomic crystals with unique geometric
features have been synthesized by kinetically controlling the growth, kinetic structures in colloidal
crystal engineering have been avoided because they are usually random and have many defects.
86
There are experimental studies reporting unique optical properties of noble metal nanoparticle-
based metamaterials. However, these materials are produced through drying and sedimentation
techniques that prevent the controllable formation of specific crystal habits[120, 121, 122].
To this end, the use of programmable atom equivalents (PAEs) generated from nanoparti-
cles and synthetically tunable DNA ligand shells is a promising route for making ordered, crys-
talline structures with diverse crystallographic symmetries in a manner that is analogous to atomic
crystallization[5, 87]. Here, particle interactions driven by the DNA bond afford deliberate archi-
tectural control with tunable bond length and strength[117, 123, 124, 82, 125]. Indeed, one of
the attractive features of this approach is that design rules have been established that allow one
to control crystal symmetry, lattice parameter, and habit, independent of particle composition but
dependent on particle size and shape[126, 127, 9]. Using a slow cooling approach, high-quality
3D single crystals can be produced[3, 128]. This strategy has been used to prepare several types
of single crystalline architectures, including rhombic dodecahedra, cubes, and octahedra.[3, 128]
Importantly, all single crystal systems studied thus far have been limited to structures with cu-
bic symmetry, and therefore the high symmetry internal packing provides access to only a small
number of isotropic crystalline shapes.
Experimental observations of single crystals have been restricted to PAEs with similar hydro-
dynamic radii (a combination of the nanoparticle radius and the DNA length). Here, we show that
combining nanoparticles of different sizes can alter the interface kinetics in the system, leading
to the formation of highly anisotropic single crystals. The AB2 (isostructural with the intermetal-
lic phase aluminum diboride) structure yields elongated hexagonal prism microcrystals upon slow
cooling. Importantly, these anisotropic microcrystals can be realized from the AB2 structure with
different lattice parameters. The experimental results are corroborated with theoretical studies and
suggest that the formation of highly anisotropic single crystals is facilitated by anisotropy in the

87
interface kinetics, where the fast-growing facets “grow out” and disappear, and the slow-growing
facets, AB2(1010) and AB2(0001) (the facet normal to the AB2(1010)), are present in the final
shape. It is important to note that based on molecular dynamics (MD) simulation results, the
facets enclosing the crystals have the highest surface energies contrary to usual equilibrium Wulff
constructions. Such crystal growth behavior stems from the nucleation barrier between each termi-
nation of AB2(1010), which significantly decelerates the growth rate due to the energetic penalty
involved in nucleation of a layer with a high surface energy atop a layer with a low surface energy.
The results shown in this work present a solution to a synthetic and materials challenge in colloidal
crystal engineering that had not been addressed previously, where the deviation from minimal en-
ergy shapes and the broken bond model picture enables the synthesis of anisotropic colloidal crys-
tals, and suggest that external parameters, such as ionic strength, temperature, and stress, could be
used to control colloidal crystallization. The ability to design and generate colloidal crystals with
desired crystal shape is crucial for the fabrication of next-generation optoelectronic devices since
optical modes are dependent on crystal shape. [113, 19]
In order to realize colloidal crystals with a highly anisotropic shape, three main principles were
identified: (i) the combination of two types of particles should form lattices with a crystallographic
symmetry other than cubic (e.g., the hexagonal single crystals can only be generated from hexag-
onal lattices), (ii) the selected structure should have no competing structures to minimize defects
which will inhibit single crystal growth, and (iii) the difference in growth rates of different planes
should be large enough to favor the dominant growth of a specific surface facet(s) and, therefore,
one preferred type of single crystal. DNA-mediated assembly of nanoparticles represents an ideal
means to control the internal packing because the assembly behavior of PAEs is well-understood
based on the complementary contact model[5] and potential energy calculations[129]. PAEs en-
able one to deliberately and independently toggle nanoparticle size, composition, bond strength,

88
and interparticle spacings, while maintaining a desired crystal symmetry in a controllable fashion.
Specifically, the ratio between the hydrodynamic radii of the building blocks was used as a design
parameter to produce the microcrystals presented in this work. To test our principles for the as-
sembly of highly anisotropic microcrystals, superlattices with crystallographic symmetry identical
to AlB2 were chosen as a model system as this structure meets our criteria.
In order to make colloidal crystals with AB2 symmetry, pairs of PAEs (with hydrodynamic
radius ratios between 0.5 and 0.8) were synthesized based upon the previously established colloidal
crystal engineering design rules[5]. The slow cooling of two sets of PAEs with complementary
DNA linker strands produces microcrystals with the AB2 packing when hydrodynamic radius ratio
(β/α) of the PAEs falls within this range (Fig. 5.1a). The hydrodynamic radius of each PAE
was determined by calculating the DNA length and adding it to the core radius (Supplementary
Eq. 1). The internal ordering of the PAE superlattices was confirmed by 1D radial line averages
of the small angle X-ray scattering (SAXS) patterns (Fig. 5.1b). The surface features and the
overall crystal shape were determined by scanning electron microscopy (SEM), where images of
the hexagonal prismatic microcrystals reveal uniform single crystals defined by six rectangular-
shaped faces and two hexagonal-shaped bases (Fig. 5.1c, d(i)). In addition, high-resolution SEM
images show extraordinarily well-formed crystals with smooth crystal facets, consisting of highly
ordered nanoparticles (Fig. 5.1d(ii)).
Faceted hexagonal prism microcrystals were obtained with ten different unit cells that are
isostructural with the AlB2 lattice, but with different a and c values (Fig. 5.2). The AB2 col-
loidal crystal superlattice (space group 191) is a hexagonal unit cell with two distinct types of
particles, where the structure consists of layers of hexagonally arranged large particles with small
particles in every trigonal prismatic interstice (Fig. 5.1b bottom). Unlike the AlB2 structure found
in atomic systems where the c/a ratio is fixed to 1.08, the c/a ratio for PAE superlattices is tunable

89
Figure 5.1. Hexagonal prism microcrystals formed from DNA-functionalizednanoparticles. a, Scheme of a set of DNA-functionalized gold nanoparticles with a hy-drodynamic radius ratio (β/α) between 0.5 and 0.8 used to produce superlattices with AB2
crystallographic symmetry. α and β denote hydrodynamic radii of particles A and B. b,Representative one-dimensional (top) and two-dimensional (bottom, right) SAXS data forAB2 superlattices assembled from the slow cooling approach. Different views of the AB2
unit cell (bottom, left) are shown for reference. SAXS data are shown as plots of the overallscattering intensity from a crystal domain (I(q), in arbitrary units) versus scattering vector(q, in units of -1). c, SEM images of hexagonal prism microcrystals in different orientations.d, SEM images of a representative microcrystal with visible faceting (i) where constituentnanoparticles can be seen (ii). Scale bars are 1 µm. Courtesy of Eileen Soyoung Seo
and controlled by the hydrodynamic radius of each component, which can be varied by changing
either the nanoparticle size or DNA length (Fig. 5.2). The rationale for achieving a range of c/a
ratios with identical crystallographic symmetries can be described using a basic principle in DNA-
driven nanoparticle superlattice engineering: colloidal crystals generated from rigid nanoparticles
and soft, DNA ligand shells can tolerate unfavorable repulsive interactions if the system can access
a more thermodynamically stable structure (i.e., the PAEs can elastically compress along the c-axis
or across the ab-plane if they can be in more thermodynamically favorable positions)[129, 130, 12].
Importantly, the fact that the c/a ratio is tunable suggests that the relative strength of attractive and

90
repulsive forces between PAEs can be varied using individual PAE structure as a design parame-
ter. Furthermore, we show that salt concentration can alter the c/a ratio. The DNA shells around
the nanoparticle core can be compressed with the addition of salt, which decreases the repulsion
between DNA strands within the overlap region and results in compression of the superlattice.
Significantly, this is not isotropic since the lattice itself is not symmetric. With these observations,
one can choose PAEs and salt conditions to produce microcrystals with structural parameters that
favor the Wulff shape.
To fully understand why such crystals form, one needs to understand the growth kinetics of
such structures. Indeed, the formation of hexagonal prisms from an AB2 packing of nanoparti-
cles can be explained by the kinetic growth of the exposed facets, where the crystal is enclosed
by the slowest-growing facets. In other words, kinetic anisotropy in the growth rates can dictate
shape selection, as described by the kinetic Wulff construction[131]. Wulff made a direct corre-
lation between the surface energy and growth rate[106]. This assumption led to the conclusion
that the lowest surface energy facet, which has the slowest growth rate in simple systems, is ex-
posed in the final shape. Previously observed Wulff polyhedra were formed from one-component
systems[3, 128], where all particles are equivalent from a kinetic standpoint, and thus the surface
energy can be directly correlated to the growth rate to predict the thermodynamic shape. This corre-
lation does not hold in all cases, specifically in multicomponent crystallization. In a binary system
such as an AB2 lattice, the diffusion and attachment kinetics of each component (A and B) are
expected to be different, and this can significantly contribute to the observed crystal shape, result-
ing from either diffusion-limited or interface-limited growth[131, 132, 133]. Furthermore, unlike
one-component cubic lattices, the same Miller indices can be assigned to different planes. Indeed,
unlike previously observed Wulff polyhedra[3], the lowest surface energy facet is not exposed in
these AB2 crystals (Fig. 5.7). Based on the calculation of relative effective surface energies (γ§)

91
Figure 5.2. Hexagonal prisms with varying unit cell compositions. a-c, SEM images(middle) and one-dimensional SAXS patterns (right) of hexagonal prism microcrystals froman AB2 lattice synthesized from different sets of PAEs to achieve a range of (β/α): (a)0.67, (b) 0.73, and (c) 0.80 (scheme shown on left). The systems shown in (a) and (b) eachconsist of a pair of nanoparticles; one has an Au core diameter of 15 nm and the other is5 nm. In the case of the small particle, the hydrodynamic radius was deliberately changedby changing the thickness of the DNA shell so that the β/α in (b) is greater than in (a).The system in (c) used the same 15 nm Au core PAEs that were used in (a) and (b), but thehydrodynamic radius was varied by changing the Au core diameter of the small particle (10nm in diameter) so that the β/α in (c) is greater than in (a). In the SAXS patterns, the blacktrace is the experimentally obtained scattering pattern, and the red trace is the predictedscattering pattern for a model lattice. The lattice parameters from SAXS results were usedto calculate the c/a ratio of each unit cell. Scale bars are 1 µm. Courtesy of Eileen SoyoungSeo
for different AB2 facets (Table 5.4), the AB2(1120) plane has the lowest surface energy. The equi-
librium crystal structure predicted from a Wulff construction is not the experimentally observed
elongated hexagonal prism morphology, confirming that the observed hexagonal prismatic crystals
are kinetic products (Fig. 5.7, 5.8). Consistent with this conclusion, SEM analysis of the surface
of the microcrystal reveals that the hexagonal prisms are enclosed by the highest surface energy

92
Figure 5.3. Surface features of hexagonal prism microcrystals. a, Scheme of a hexago-nal prism (top) and SEM images (bottom) of (i) a rectangular face with a (1010)SL (inset)and (ii) a hexagonal base with a (0001)SL (inset) of a hexagonal prism. For clarity, rect-angular faces and a hexagonal base are color coded as blue and purple both in schemeand SEM images, respectively. b, Scheme of an AB2 unit cell and the projections of the(1120)SL, (0001)SL, and (1010)SL planes. The plane multiplicity can be determined bycounting the number of different planes (green slabs) that correspond to the same Millerindices. Nanoparticles in different colors may occupy different layers of a plane with iden-tical Miller indices. Grey and purple lines in the model lattice denote the edges of the unitcell and the bonds that connect complementary particles, respectively. Top-down views ofdifferent planes of the (1010)SL facet is shown for clarity. Courtesy of Eileen Soyoung Seo
facets: the rectangular faces are (1010) facets (Fig. 5.3a(i), b, c(i)) and the hexagonal ends are
(0001) facets (the facet normal to the (1010) facet; Fig. 5.3a(ii), b, c(ii)).
The crystal growth rate is dependent upon many variables (e.g., PAE diffusion rate, chemical
potential, termination effect) that vary as a function of both particle and facet type[131, 132]. For
the PAE system where the crystals are grown by slow cooling over several days through the melt-
ing temperature (i.e., particles were given enough time to equilibrate), we hypothesize that single
crystal formation is less likely to be diffusion-limited. To explore whether the difference between

93
the chemical potentials of each component plays a role in crystal growth, off-stoichiometry (i.e., a
ratio of A:B particle mixtures not equivalent to 1:2) experiments were carried out with 1:3 and 1:6
molar ratios of A:B. The observed crystal habits in these systems are the same as those observed
in the stoichiometric system, suggesting that the chemical potential difference has a negligible in-
fluence on crystal shape (Fig. 5.4). For multicomponent systems, the composition of the particle
(type) terminating the crystal surface can affect the overall growth kinetics, as described by termi-
nation effects observed in atomic crystals, for example, III-V semiconductors such as GaAs36. For
an AB2 lattice, each crystal plane corresponding to a set of identical Miller indices can exhibit a
multiplicity up to three; that is, the number of distinct planes with the same Miller indices is three
(Fig. 5.3b). For example, the AB2(1010) plane has a multiplicity of three (blue, red, or yellow)
while the AB2(1120) plane has a multiplicity of one as it intersects all particles within a unit cell
(Fig. 5.3b, Fig. 5.2). We therefore calculated the actual surface energies for different surface
terminations using molecular dynamics simulations. These calculations reveal that different sur-
face terminations have different surface energies when a set of Miller indices exhibits a multiplicity
greater than one, and this difference in surface energy, which is the largest for the AB2(1010) plane,
creates a nucleation barrier for the growth of the subsequent layer (Table 5.1). This is especially
true when a layer with a higher surface energy nucleates atop of a layer with a lower energy.
For the typical kinetic Wulff shape construction, the growth of layers occurs through the for-
mation of a terrace, which then forms a complete monolayer before the subsequent growth of
the next layer (Fig. 5.5a top). For such growth, the growth rate, r, can be expressed as r =
f0 exp(−E/kBT ), where f0 is the prefactor and E is the nucleation barrier (E = −π(γe)2/∆µ;
γe is the edge energy per atom of a terrace and ∆µ is the bulk chemical potential drive, which is
negative for crystal growth)[131]. For facets with a multiplicity greater than one, the nucleation
of an additional particle results in a change in the overall surface energy akin to a change in the

94
Figure 5.4. Hexagonal prisms produced upon addition of off-stoichiometric ratios ofPAEs. a-b, Scheme (top) and SEM images (bottom) of hexagonal prism microcrystalswhen different molar ratios of A:B particles, (a) 1:3 and (b) 1:6, were added. In both cases,AB2 lattices have a similar c/a ratio to the one formed using a stoichiometric ratio of PAEs(1:2). Scale bars are 1 µm. Courtesy of Eileen Soyoung Seo
bulk chemical potential (Table 5.1). When the growth of a layer is energetically unfavorable, the
nucleation of a subsequent layer may occur before growth of the initial layer is complete, resulting
in multi-terrace type growth (Fig. 5.5a bottom). To better understand the growth mechanism rele-
vant to our system, we derived equations for a simple two-layer system, where layer “A” has lower
surface energy than layer “B”. The energy barrier E for the growth of A on B and B on A are given

95
by EA/B = −π(γe)2/(∆µ + ∆γAB) and EB/A = −π(γe)
2/(∆µ − ∆γAB), respectively, where
∆γABis the difference in surface energy of layers A and B (measured per particle). Based on this
model, when |∆µ| is same as |∆γAB|,there is no thermodynamic driving force for the nucleation of
the higher surface energy layer B. In this case, the crystal growth proceeds through the growth of
a BA bilayer as the growth of A on B occurs significantly faster than the growth of B on A. There-
fore, EBA can be written as−2π(γe)2/∆µ. If this is the growth mechanism that the PAEs undergo,
one would expect to recover the thermodynamic Wulff shape, however, this is not experimentally
observed (Supplementary Fig. 5.3). Therefore, we hypothesize that the growth mechanism that
leads to the formation of hexagonal prism microcrystals from an AB2 packing of nanoparticles is
layer-by-layer growth, as described in the kinetic Wulff construction.
To investigate this hypothesis, we used a solid-on-solid model in kinetic Monte-Carlo simu-
lations to evaluate the effect of a nucleation barrier on the growth kinetics for the plane with a
multiplicity of two. Here, layer growth can proceed through two different pathways as illustrated
in Fig. 5.5c-h (see Section 5.2 for additional discussion). At lower values of ∆γAB (below 0.3
kBT in Fig. 5.5b), layer growth is significantly slowed but still proceeds in a layer-by-layer fash-
ion. Whereas, when the ∆γAB value is above ∼0.24 kBT (where the curve starts to plateau), we
observe the formation of BA terraces (Fig. 5.5a bottom, e, h). Thus, for the microcrystals ex-
perimentally observed, the PAEs are expected to exhibit a layer-by-layer growth behavior, which
results in a kinetic Wulff crystal (Fig. 5.5c). The strong parallels between the energy barrier cal-
culations and simulation results indicate that the plane with the largest ∆γAB is present in the final
shape through a layer-by-layer growth mechanism. Importantly, the kinetic Wulff shape, a hexag-
onal prismatic crystal bounded by the (1010) and (0001) facets, is predicted by setting the growth
speed of the AB2(1010) (the facet with the greatest ∆γAB in our system) to zero (Supplementary
Fig. 4).

96
Figure 5.5. Kinetics of epitaxial growth of alternating layers of A and B calculatedusing Monte-Carlo simulations (e = 0.65kBT , ∆µ = −0.3kBT ). a, Representativescheme of layer growth mechanisms in the presence of a minimal or no energy barrier(top) and a substantial energy barrier between A and B layers (bottom). b, The mean timebetween nucleation events and the mean surface growth velocity plotted as a function of theenergy barrier between layer growth. Error bars indicate 95% confidence interval. c, d, e,Typical surface profiles for ∆γAB = 0 kBT , 0.12 kBT and 0.29 kBT , respectively. f, g,h, The same surface profiles colored with the low energy layer in blue and the high energylayer in red. The color scheme presented in f, g, h allows one to clearly view the placementof the high energy layer. As the energy barrier increases between layers, the presence oflayer B is suppressed and is eventually only found near the terrace edges.
In conclusion, this work is important for the following reasons. First, this work documents the
first example of non-equilibrium colloidal single crystals with uniform shapes. We have further elu-
cidated a guide for designing and synthesizing crystal habits via kinetic control, which can in turn

97
lead to rational design of colloidal single crystals with better optical properties. Moreover, it shows
for the first time how DNA programmable assembly can be used to synthesize highly anisotropic,
hexagonal prisms. Importantly, different nanoparticle sizes and oligonucleotide lengths can be used
to realize crystals that are isostructural on the mesoscale but with deliberately varied nanoscale
interiors. The combination of experiment, theory, and simulation convincingly shows that the ob-
served anisotropic products are a consequence of kinetically controlled crystal growth, exposing
the highest surface energy planes. Collectively, this work expands the design space of colloidal
crystal engineering where macroscopic control over crystal habit is possible, thereby potentially
resulting in structures that have potential for a wide range of applications, spanning sensing and
single crystal optics.
3. Methods Summary
All oligonucleotides used in this work were synthesized on a solid-support MM12 synthesizer
using phosphoramidites purchased from Glen Research. Sequences can be found in the Supple-
mentary Information. DNA-functionalized nanoparticles were synthesized and assembled accord-
ing to published literature protocols[5, 123]. A solution containing PAE aggregates were slow
cooled to room temperature in a temperature cycler (Life Technologies) at a starting temperature
above the aggregate melting temperature and at a rate of 0.01 C min−1. Structures of superlattices
were characterized by synchrotron SAXS experiments conducted at the Advanced Photon Source
at Argonne National Laboratory. For visualization by SEM (Hitachi SU8030), superlattices were
embedded in silica for transfer to the solid state[134]. More experimental and simulation details,
and surface energy calculation values can be found in the Supplementary Information.

98
4. Acknowledgments
We thank Prof. Laurence Marks and Prof. Michael Bedzyk for their helpful discussions
about crystal growth. This work was supported by the following awards: the Center for Bio-
Inspired Energy Science, an Energy Frontier Research Center funded by the U.S. Department of
Energy, Office of Science, Basic Energy Sciences Award DE-SC0000989 (oligonucleotide synthe-
ses and purification, simulations and theory); the Air Force Office of Scientific Research Award
FA9550-17-1-0348 (DNA-functionalization of gold nanoparticles); the Asian Office of Aerospace
Research and Development Award FA2386-13-1-4124 (nanoparticle superlattice assembly); and
the National Science Foundations Materials Research Science and Engineering Center program
(DMR-1121262) and made use of its Shared Facilities at the Materials Research Center of North-
western University (SEM characterization). SAXS experiments were carried out at beamline 5-ID
of the DuPont-Northwestern-Dow Collaborative Access Team at the Advanced Photon Source.
Use of the Advanced Photon Source at Argonne National laboratory was supported by the U.S.
Department of Energy, Office of Science, Office of Basic Energy Sciences, under Contract No.
DE-AC02-06CH11357 (SAXS characterization). S.E.S. acknowledges partial support from the
Center for Computation and Theory of Soft Materials Fellowship. We thank Prof. Laurence Marks
and Prof. Michael Bedzyk for their helpful discussions about crystal growth. Author Contributions
S.E.S. and C.A.M. designed experiments and analyzed data. M.G. developed the theoretical model
and performed simulation. M.G. and M.O.d.l.C analyzed simulation data. All authors contributed
to writing the manuscript.

99
Layer type ∆γp(1120) ∆γp(0001) ∆γp(1010) ∆γp(1121) ∆γp(1011)1 - 0.093 -0.079 -0.030 0.0222 - -0.093 -0.122 0.030 -0.1423 - - 0.201 - 0.120
Table 5.1. Relative difference in surface energy values between different layers calculatedfor DNA-gold nanoparticle superlattices
5. Supplementary information
5.1. Surface energy calculations and Wulff shape prediction
To explore the contribution of surface energies of different facets on the shape selection, molecular
dynamics simulations were carried out to understand the origin of facet yield changes. The coarse-
grained approach used in this work is the same as the one demonstrated in previous literature,
which used a model first developed by Knorowski et al[13] and then adapted for double-stranded
DNA (dsDNA) by Li et al[14]. MD simulations used a PAE design similar to the one used in
experiments.
To calculate the surface energies of a unit cell, we used two different systems, a perfect 3D
crystal and a slab of finite thickness in the z−direction, with a defined surface plane (Fig. 5.6).
Distances between the nanoparticles were determined from the equilibrated lattices. To equilibrate
a lattice, we initialized colloids in a perfect crystal and let the system relax using the isobaric-
isothermal ensemble (NpT). We equilibrated systems of 4 × 4 × 4 and 6 × 6 × 6 unit cells with
relative differences in mean energy and lattice parameters of less than 10−3. We considered a few,
different systems with varying DNA lengths to find the system similar to the experimental one,
while keeping the particle sizes constant. The double-stranded portion was fixed for all systems
while the single-stranded segment (ssDNA), which represents the PEG linker region in our DNA
design, was varied. Table 5.2 summarizes the values used for lattice equilibration.

100
System dsDNA length Particle A Particle B a c c/assDNA length ssDNA length
(# of bases) (# of bases) (# of bases) (nm) (nm)A 16 10 4 40.52 36.51 0.901B 20 10 4 44.34 39.56 0.892C 16 10 10 42.31 37.00 0.875D 16 14 14 44.50 38.82 0.872
Table 5.2. DNA Lengths and Equilibrated Lattices
Figure 5.6. Simulation snapshots of a, a perfect 3D crystal with 6× 6× 6 unit cells, and band c, surface slabs showing two different terminations of the (0001) plane.
As for our previous surface energy calculations[128], we did not fix the positions of the col-
loids. This allows the surfaces to undergo simple reconstructions where the colloids are displaced
with respect to the bulk crystal lattice. Each crystal slab has at least six crystal periods in the
z−direction and 4 periods in the x− and y−directions. Crystal slabs typically have 112 to 160
colloids of type A and 256 to 320 colloids of type B, yielding a typical 650k to 1M beads in the
system. Since the unit cell of an AB2 crystal has three distinct points, we have up to three dif-
ferent surface terminations. The three different terminations were evaluated for all Miller indices,
including the ones that are equivalent to confirm that the surface energies calculated herein are

101
Plane (1120) (0001) (110) (1121) (1011)Multiplicity 1 2 3 2 3
Table 5.3. Summary of Multiplicity of Different Set of Miller Indices
reproducible. Calculations were performed twice for each set of Miller indices. Tools to gener-
ate initial configurations can be found online (https://bitbucket.org/NUaztec/hoobas). The number
of distinct surface terminations for a given set of Miller indices depends on the number of points
crossed in the unit cell (Fig. 5.3). Multiplicity numbers for different planes are given in Table S5.3.
5.1.1. Surface Energies. The surface energy of a given crystal plane was obtained using the dif-
ference in enthalpy between the crystal slab with exposed facets (Fig. S5.6) and a perfect crystal.
The surface enthalpy is given by:
(5.1) γp =Up − UAnA − UBnB
Ap
where γp is the surface energy of a given plane, Up is the enthalpy of the crystal slab with
exposed plane p, UA (or UB) is the mean energy of colloids of type A (or B) in a perfect crystal,
and nA (or nB) is the number of colloids of type A (or B) in the crystal slab. The mean of the
relative variation between repeat calculations of the surface enthalpy is around 4%.
Simulations are performed in the NVT ensemble using a Langevin thermostat (friction coeffi-
cients of 1.0). The crystal structure is thermally equilibrated over 1.5×10⁶ timesteps, while energy
is measured with 500 values taken over 2.5 × 10⁶ timesteps with a timestep of ∆t = 3 × 10⁻³δt
and δt = (mσ2/ϵ)1/2.
5.1.2. Wulff shape identification. The thermodynamic equilibrium shape of a lattice is governed
by the stability of crystal surfaces, and thus the shape can be computationally predicted based on

102
Name γ§(1120) γ§(0001) γ§(110) γ§(1121) γ§(1011) Ratio of surface energiesA 0.508 0.721 0.529 0.534 0.510 1:1.42:1.04:1.05:1B 0.411 0.571 0.431 0.424 0.404 1:1.39:1.05:1.03:0.98C 0.474 0.649 0.485 0.487 0.470 1:1.37:1.02:1.03:0.99D 0.425 0.590 0.440 0.445 0.434 1:1.39:1.04:1.05:1.02Table 5.4. Effective Surface Energy Values Calculated AB2 Superlattice. γ§ representseffective surface energies (in kJ/mol/nm2), which is the lowest surface energy value amongvalues calculated for different terminations
Name Termination type γp(1120) γp(0001) γp(110) γp(1121) γp(1011)A 1 0.508 0.814 0.651 0.534 0.652A 2 0.721 0.529 0.564 0.510A 3 0.730 0.630B 1 0.411 0.614 0.546 0.424 0.528B 2 0.571 0.431 0.451 0.404B 3 0.576 0.495C 1 0.474 0.717 0.612 0.487 0.608C 2 0.649 0.485 0.539 0.470C 3 0.685 0.569D 1 0.425 0.662 0.573 0.445 0.547D 2 0.590 0.440 0.472 0.434D 3 0.597 0.518
Table 5.5. Slab Calculation Values for Different Terminations. γp represents surface energyvalues (in kJ/mol/nm2) for different terminations of a plane with identical Miller indices.Termination type 1 always has the large particles on the surface.
surface energy values. Using surface energy values estimated from the MD simulations, we cal-
culated the ratio of surface energies and used the WulffMaker software to predict corresponding
Wulff polyhedra[135]. Fig. 5.7 shows the corresponding thermodynamic Wulff polyhedra pre-
dicted from the surface energies for the lattice with experimentally determined lattice parameters.
5.2. Kinetic Monte-Carlo simulations
5.2.1. Methods. To probe the termination effect on the growth speed of facets, we performed a
kinetic Monte-Carlo simulation of epitaxial growth of a surface with alternating layers of A and B.

103
Figure 5.7. Wulff polyhedra simulated for different systems (Table 5.2) exhibit similarcrystal habits and deviate from the experimental results. All crystals are truncated by theAB2(1120) blue, AB2(0001) purple, AB2(1010) yellow, AB2(1121) green, and AB2(1011)magenta facets.
As a toy model, we used a square lattice for the growth of a 160×160 unit cell. The bulk chemical
potential of each layer was set to ∆µ = −0.30kBT , with an edge energy of γe = 0.65kBT . The
surface energy difference ∆γAB was varied from 0 to 0.29 kBT and the mean surface height (as a
function of time) was recorded to generate a graph shown in Fig. 5.9. This allowed us to calculate
the mean growth rate of a system with different energy barriers. We recorded the mean time spent
on low energy layers, discarding the results where multiple growth events occurred at the same
time. A clear increase in the mean time is observed when ∆γAB > 0.15. This indicates that beyond
certain amount of ∆γAB, the epitaxial growth transitions from a monolayer to a multilayer growth
(Fig. 5.5). In the case where a very low number of layers is grown for large ∆γAB (2− 3 layers),
it generates a large confidence interval. For small values of ∆γAB, particle nucleation proceeds
quickly and can be faster than the time it takes for a terrace to fully grow, yielding no plateau.
These values are discarded from the fitting process. Confidence intervals for the mean surface
growth is determined by splitting the mean surface height in 10 different bins and calculating their
standard deviation.
5.2.2. Choice of parameters and growth mechanism. As illustrated in Fig. 5c, at ∆γAB = 0,
the ∆µ and γe values considered in these simulations results in rough surface. For the Wulff

104
Figure 5.8. Wulff equilibrium shape is predicted for the case when the growth velocity ofthe AB2(1010) is assumed to be very slow. Because the Wulffmaker software can onlygenerate the shape based on the surface energy values, the surface energy of the AB2(1010)was set as the lowest value, which is equivalent to the slowest growth velocity). Hexagonalprism is truncated by blue (1010) and purple (0001) faces.
equilibrium crystal structures observed in previous experiments[97, 3], all colloids are equivalent
to each other, and thus ∆γAB = 0. Therefore, the simulation results displayed do not agree well
with the experimental results. Although the parameters chosen in this study are not ideal values to
model experiments, we will discuss several reasons why these parameters were chosen.
105
Based on the equations derived in the main text, for small values of ∆γAB the mean growth
velocity is predicted to be inversely proportional to EA/B + EB/A. For large values of ∆γAB,
it should be inversely proportional to EBA. These values can be directly correlated to the mean
time between nucleation events shown in Fig. 5.5b; yet, a more dramatic change is observed for
the mean time than the growth velocity. This is because multiple nucleation events are occurring
within the time frame of a monolayer growth. For the expected layer-by-layer growth, these two
curves should display stronger correlations.
Using either a smaller value of ∆µ (in magnitude) or a greater value of γe in the simulations
leads to a smooth surface (Fig. 5.10) as observed in previous experiments. However, in this
case, the growth is significantly slowed, especially with large ∆γAB and poor statistics, resulting
in growth of only a few layers in the simulations. Nevertheless, Fig. 5.10 illustrates that the
calculations performed in this work exhibit an anticipated trend where the growth is dramatically
slowed and the mean time between nucleation events increases. The full curve beyond ∆γAB =
0.3kBT cannot be obtained.

106
Figure 5.9. Mean surface height of the thin film graphed as a function of time for the case∆γAB = 0.198kBT . Even (odd) number of monolayers correspond to low (high) energysurfaces.

107
Figure 5.10. a, Mean time between sequential nucleation events. b, Mean surface growthvelocity. For both a and b, green points represent γe = 0.80kBT and purple points representγe = 0.95kBT . c, Typical surface profile at ∆γAB = 0 (left; γe = 0.80kBT and right;γe = 0.95kBT ).

108
CHAPTER 6
The Role of Salt and Repulsion in the Hybridization Kinetics of
DNA-Functionalized Nanoparticles
Authors: Soyoung E. Seo*, Martin Girard*, Monica Olvera de la Cruz, Chad A. Mirkin
1. Abstract
Colloidal crystallization with programmable atom equivalents (PAEs) composed of DNA-
modified spherical nanoparticles allows one to program in a sequence-specific manner crystal
symmetry, lattice parameter, and, in certain cases, crystal habit. Despite the high level of structural
control afforded by this approach, less is known about ways to control the size of the resulting mi-
crocrystals. Here, we explore the possibilities of using salt and the electrostatic properties of DNA
as a polyelectrolyte brush to regulate the attachment kinetics between PAEs. Counterintuitively,
simulations and theory show that at high salt concentrations (1 M NaCl), the hybridization kinet-
ics increase by over an order of magnitude compared to low concentration (0.3 M), resulting in a
transition from interface-limited to diffusion-limited crystal growth at larger crystal sizes. Remark-
ably, at elevated salt concentrations, well-formed rhombic dodecahedron-shaped microcrystals up
to 21 µm in size grow, whereas at low salt concentration, the crystal size typically does not exceed
2 µm. Simulations show an increased barrier to hybridization between complementary PAEs at
elevated salt concentrations, consistent with previous simulations linking long-range interactions
to ionic clustering. These clusters are involved in compensating the charge of the PAEs, but they
sterically impact hybridization. Therefore, although one might intuitively conclude that higher salt

109
concentration would lead to less electrostatic repulsion and faster PAE-to-PAE hybridization ki-
netics, the opposite is the case, especially at larger inter-PAE distances. This ion clustering effect
becomes most pronounced at salt concentrations greater than 0.5 M. These observations provide
an understanding of how solution ionic strength can be used to control the attachment kinetics of
colloids coated with charged polymeric materials in general and DNA in particular.
2. Body
Colloidal crystals composed of nanoparticles are structures that can be designed to have in-
teresting optical and electronic properties, based upon nanoparticle composition, crystal lattice
symmetry and spacing, and mesoscopic crystal habit and size [113, 19, 136, 137, 138]. Be-
cause of their chemical programmability and sequence-specific interactions, oligonucleotides have
emerged as versatile ligands to direct the assembly of nanoparticles into higher order crystalline
architectures[125, 85, 87, 5]. Indeed, nanoparticles functionalized with a dense shell of upright
and oriented DNA behave as “programmable atom equivalents” (PAEs) that can be assembled into
a diverse set of crystalline structures following well-established design rules[125, 85, 5, 3, 11, 86].
The size of colloidal crystals is an important design parameter for the preparation of device ar-
chitectures, particularly those requiring control over the optical path length (i.e., the distance that
light travels across the crystal in the orientation of interest)[113, 19, 139]; however, methods for
realizing single crystals with tunable sizes have yet to be developed using this approach. The size
of three-dimensional single crystals generated by slow cooling is typically 2 µm or less[3]. Pre-
viously, molecular intercalators were introduced to post-synthetically modulate the strength of the
DNA bonds within these crystals[140, 123], which were used as seeds for controlling the extended
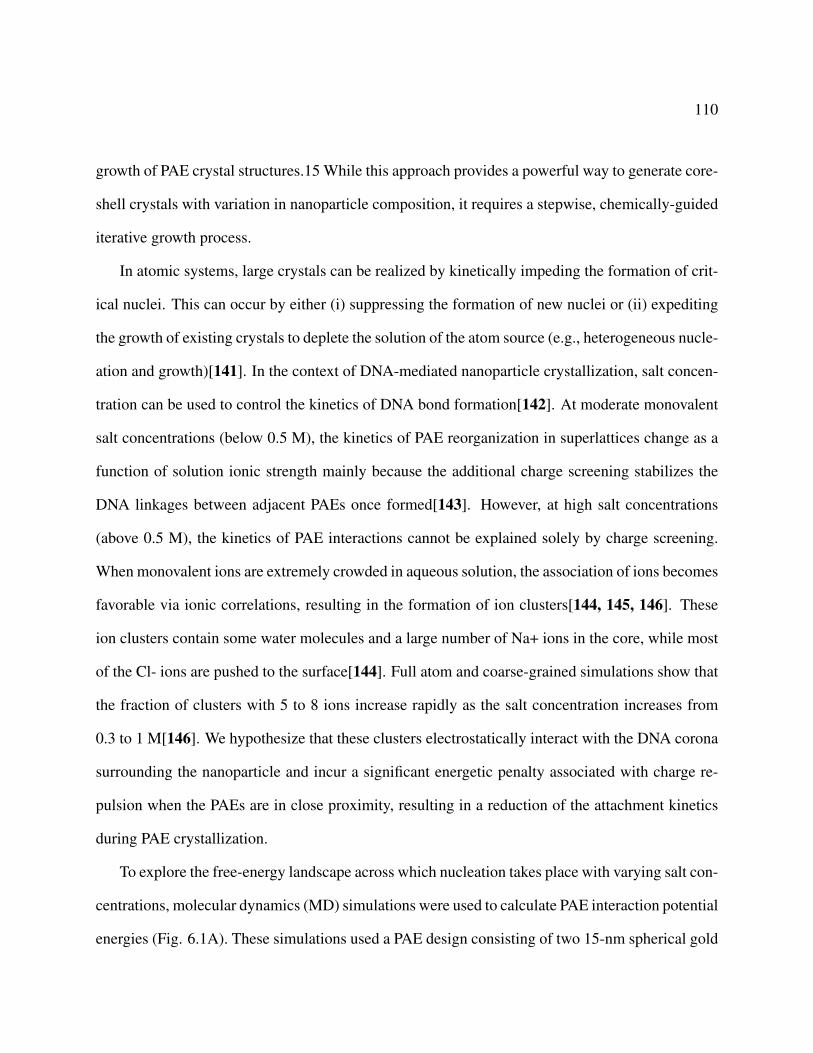
110
growth of PAE crystal structures.15 While this approach provides a powerful way to generate core-
shell crystals with variation in nanoparticle composition, it requires a stepwise, chemically-guided
iterative growth process.
In atomic systems, large crystals can be realized by kinetically impeding the formation of crit-
ical nuclei. This can occur by either (i) suppressing the formation of new nuclei or (ii) expediting
the growth of existing crystals to deplete the solution of the atom source (e.g., heterogeneous nucle-
ation and growth)[141]. In the context of DNA-mediated nanoparticle crystallization, salt concen-
tration can be used to control the kinetics of DNA bond formation[142]. At moderate monovalent
salt concentrations (below 0.5 M), the kinetics of PAE reorganization in superlattices change as a
function of solution ionic strength mainly because the additional charge screening stabilizes the
DNA linkages between adjacent PAEs once formed[143]. However, at high salt concentrations
(above 0.5 M), the kinetics of PAE interactions cannot be explained solely by charge screening.
When monovalent ions are extremely crowded in aqueous solution, the association of ions becomes
favorable via ionic correlations, resulting in the formation of ion clusters[144, 145, 146]. These
ion clusters contain some water molecules and a large number of Na+ ions in the core, while most
of the Cl- ions are pushed to the surface[144]. Full atom and coarse-grained simulations show that
the fraction of clusters with 5 to 8 ions increase rapidly as the salt concentration increases from
0.3 to 1 M[146]. We hypothesize that these clusters electrostatically interact with the DNA corona
surrounding the nanoparticle and incur a significant energetic penalty associated with charge re-
pulsion when the PAEs are in close proximity, resulting in a reduction of the attachment kinetics
during PAE crystallization.
To explore the free-energy landscape across which nucleation takes place with varying salt con-
centrations, molecular dynamics (MD) simulations were used to calculate PAE interaction potential
energies (Fig. 6.1A). These simulations used a PAE design consisting of two 15-nm spherical gold

111
nanoparticles each functionalized with one of two DNA sequences bound to linker strands with
complementary “sticky ends” (Fig. 6.1). These PAEs assemble into bcc superlattices. The foun-
dation for these simulations is based on the assumptions that: (i) the interaction between the com-
plementary PAEs is the main driving force for crystallization, (ii) the interaction with the second
nearest neighbors (i.e., non-complementary PAEs) are negligible, and (iii) similar trends in the free
energy are observed at room temperature (25C) and elevated temperatures. Effective pair potential
energies were calculated by modeling two complementary PAEs at 25C with the 3SPN force-field,
which included DNA-hybridization attraction, stacking interactions, excluded volume repulsion,
and electrostatic interactions between phosphate groups and explicit ions[15, 16]. The strong par-
allels between the modeled and experimental results (DNA melting temperature increases with salt
concentration) indicate that the binding energy between the PAEs increases with salt concentration
(Fig. 6.1B).
The impact of salt concentration on the interaction potential between a pair of PAEs was stud-
ied by calculating the potential energies as a function of interparticle distance (i.e., core-to-core
distance) ranging from 30 to 40 nm. Previous studies on nanoparticles with non-complementary
DNA strands exhibit repulsion forces between nanoparticles that are longer range than the repul-
sion predicted by DLVO theory when the salt concentration increases above 0.3 M[146], which
is in agreement with experiments on repulsion between charged surfaces at high monovalent salt
concentrations[147]. For colloids grafted with strongly charged polymer chains (e.g., PAEs), the
effective screening length was measured to be between 2 to 5 nm as opposed to the sub-nm length
predicted by DLVO[146]. Consistently, above certain salt concentrations, simulations that include
hybridization interactions show short-range attraction from hybridization interactions at distances
where the DNA coronae overlap and longer range repulsion extending to distances where the DNA
coronae do not overlap (Fig. 6.1B). This results in an energetic barrier greater than the thermal
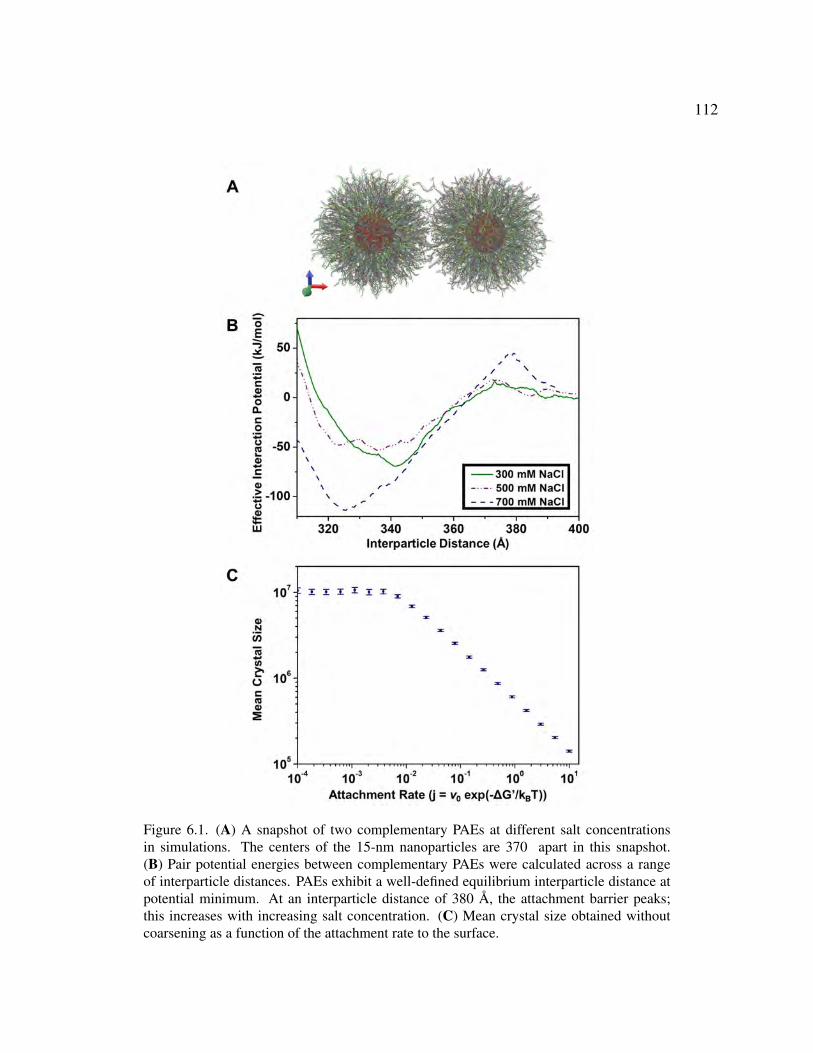
112
Figure 6.1. (A) A snapshot of two complementary PAEs at different salt concentrationsin simulations. The centers of the 15-nm nanoparticles are 370 apart in this snapshot.(B) Pair potential energies between complementary PAEs were calculated across a rangeof interparticle distances. PAEs exhibit a well-defined equilibrium interparticle distance atpotential minimum. At an interparticle distance of 380 A, the attachment barrier peaks;this increases with increasing salt concentration. (C) Mean crystal size obtained withoutcoarsening as a function of the attachment rate to the surface.

113
energy (kBT ) (i.e., the thermal fluctuation of the system must cross over the nucleation barrier to
initiate crystallization), which slows the attachment kinetics between complementary PAEs. Thus,
we hypothesize that the PAEs assemble to form larger crystals at higher solution ionic strengths
due to this nucleation barrier (Fig. 6.1C, 6.5, 6.6).
To investigate whether PAE assembly at elevated salt concentrations leads to the growth of
larger microcrystals, two sets of 15-nm spherical PAEs with complementary DNA sequences were
prepared. Each sample was assembled in solution at three different salt concentrations (0.3, 0.5,
and 1 M NaCl) and then slow cooled. This process enables DNA-driven crystallization that favors
the formation of single crystalline rhombic dodecahedra with the gold nanoparticles in a bcc crys-
tallographic symmetry (over a polycrystalline assembly)[5, 3]. Single crystals were chosen as the
subject of this study because crystal domain size is easier to identify and quantify. Superlattices
were then characterized by small-angle X-ray scattering (SAXS), electron microscopy (EM), and
selected area diffraction (SAD).
First, SAXS lineshape analysis was used to deconvolute peak broadening arising from grain
size and microstrain, and the grain sizes were compared using a Williamson-Hall analysis (Figs.
6.2A). Stokes-Wilson strain broadening can be combined with Scherrer size broadening in scat-
tering peaks to extract information about grain size (Eq. S12-13)[148]. Consistent with both the
hypotheses and the calculations of interaction potentials, a significant increase in average grain
size is observed when the salt concentration was increased from 0.5 to 1 M (Fig. 6.2A). Although
the grain size generally increases with increasing salt concentration, it decreases with increasing
particle concentration. A decrease in mean crystal size with increasing particle concentration can
be attributed to the increase in chemical potential (Eq. S2). Since the nucleation rate is strongly
dependent on the chemical potential of the system, increasing the chemical potential leads to a
faster nucleation rate (i.e., a greater number of nuclei forms) and thus, the formation of smaller

114
Figure 6.2. (A) Williamson-Hall analysis of SAXS data can be used to deconvolute peakbroadening arising from grain size (intercept) and microstrain (slope). (B) Scheme (top)showing the dimension that was measured for the statistical analysis of crystal size distri-bution using SEM images. (i), (ii), and (iii) are schematic representations of three differentorientations of the microcrystals commonly observed on the substrate. The length a (edgelength) was measured and mathematically converted to convey the length shown in the topdrawing. Size analyses of approximately 150 microcrystals, assembled at (C) 0.3, (D) 0.5,and (E) 1 M NaCl, show an increase in average crystal size with increasing salt concentra-tion. SEM images of silica-encapsulated bcc gold nanoparticle microcrystals, interlinkedwith DNA and assembled at (F) 0.3, (G) 0.5, and (H) 1 M NaCl confirm faceted rhombicdodecahedra. Scale bars are 2 µm. Courtesy of Eileen Soyoung Seo

115
microcrystals is expected. Note that the chemical potential difference is a thermodynamic driving
force for crystallization.
To further examine the effect of salt on crystal size along with crystal habit (e.g., facet), we
used SEM to determine the size distribution of approximately 150 microcrystals for each salt con-
centration. Since the formation of microcrystals mediated by the slow cooling approach is similar
to conventional homogeneous nucleation (i.e., the crystallization starts from dispersed precursors),
a broad range of crystal sizes is expected. To prepare samples for SEM imaging, slow-cooled sam-
ples were encapsulated in silica using a sol-gel process[134], dispersed in 50% EtOH in water, and
slowly dried on a silicon substrate. Remarkably, microcrystals generated in solution of different
salt concentrations are all consistent with the rhombic dodecahedron crystal habit (Fig. 6.2F-H),
and the overall crystal size increases with increasing salt concentration (Fig. 6.2C-E). Because
the microcrystals dried on a substrate lie in different orientations on the substrate, mathematical
corrections on each measurement of a (edge length) were performed (Fig. 6.2B). SEM results
show similar size distributions for the 0.3 and 0.5 M salt concentration samples with mean sizes
of 3.6 ± 1.6 and 3.5 ± 1.3 µm, respectively (Fig. 6.2D, E). However, similar to the conclusions
drawn based on the SAXS data, a noticeable increase in the crystal size distribution is observed for
the 1 M NaCl sample with a calculated mean size of 4.9± 2.6 µm (Fig. 6.2F). Remarkably, these
crystals can grow up to 21 µm (the length shown in Fig. 6.2B, top) when the PAEs are assembled
in high solution ionic strength (Fig. 6.2H).
The crystallization process is usually described by the formation of critical nuclei (i.e., nu-
cleation) followed by subsequent growth. Generally, the nucleation rate is dependent on both the
energy barrier of nanoparticle cluster formation and the attachment rate of the interacting nanopar-
ticles. An emergence of long-range repulsion at high salt concentration, as shown in Fig. 6.1B,

116
results in a reduction of the attachment rate A, which can be understood from the following rela-
tionship:
j = ν0 exp(−∆G′/kBT )
where j is the frequency at which two nanoparticles come together, ν0 is the trial rate (con-
stant, units in 1/time), and ∆G′ is the repulsion barrier that nanoparticles must overcome to initiate
crystallization (see Simulation section in the SI for detailed discussion). Thus, from this equa-
tion, one can extract that the frequency of nanoparticle attachment events decreases exponentially
with increasing energy barrier. In the case where the long-range diffusion is required, two rate-
limiting processes, interface- and diffusion-limited, affect the growth rate. The initial stage of
crystal growth is limited by interfacial attachment barriers. In this regime, crystal size increases
linearly with time (crystal size ∼ At, where A is the growth rate proportional to j and t is the
time)[149]. In the case where the nanoparticle attachment occurs extremely fast (i.e., nanoparti-
cle interactions are extremely favorable), no interface-limited regime is present, and this results in
crystals with irregular shapes and disordered nanoparticles[131]. However, in our case, j is very
small and we observe faceted microcrystals. When most of the nanoparticles are consumed, dif-
fusion can no longer sufficiently transport materials to the crystal-solution interface. Beyond this
regime, crystal growth is limited by diffusion, where the growth rate is significantly slowed (crystal
size ∼ t1/2)[108]. The growth rate in this regime is entirely determined by the diffusion constant
and the supersaturation, given by c−ceq, where c and ceq are current and equilibrium concentrations
of the free nanoparticles in solution, respectively. The transition between the interface-limited to
diffusion-limited regimes has been reported for colloidal crystals using MD simulations[150].

117
Figure 6.3. (A) and (B) Transmission electron microscopy (TEM) images of a thin (∼100nm) section of silica-encapsulated microcrystals, initially crystallized in 1 M NaCl. (C)Well-defined SAD patterns were obtained by subjecting a parallel beam of high-energyelectrons to a thin section of one of the large microcrystals shown in (B). Scale bars are 5µm, 200 nm, and 100 µm−1 for (A), (B), and (C), respectively. Courtesy of Eileen SoyoungSeo
The combination of MD simulations and experiments suggests that the reduction in the PAE
attachment rate at 1 M NaCl likely impedes the formation of stable clusters/critical nuclei and
drastically slows the interface-limited regime, meaning the system at high salt conditions enters
the diffusion-limited regime much later than the other two systems. Thus, by suppressing the nu-
clei formation, large single crystals are realized. We presume that a similar trend will be observed
when the rate of cooling is changed. It is worth noting that there is a possibility of large crystal
growth occurring through coalescence and restructuring processes, where two or more stable crys-
tals merge to form a single crystal. In atomic systems, coarsening typically occurs by Ostwald-like
ripening processes; however, this process is very slow and unlikely to be observed in colloidal
systems. On the other hand, it has been shown that the coarsening in colloidal systems could hap-
pen by grain-rotation induced coalescence[151]. Similar coarsening has been observed for PAE
systems in MD simulations (see Simulation section in the SI for further discussion)[150].
Because defects and inhomogeneity in the superlattice can affect the optical response of these
materials, it is crucial to produce high-quality crystals[152]. Each SAXS pattern shows, regardless
of the solution ionic strength, a high degree of single-crystalline ordering of nanoparticles arranged

118
Figure 6.4. (A) The bcc unit cell lattice parameter at different salt concentrations. (B) Thechange in lattice parameters induced by salt is reversible. Courtesy of Eileen Soyoung Seo
into a bcc crystallographic symmetry. The crystallinity was further characterized by performing
SAD using a transmission electron microscope (TEM) (Fig. 6.3). This characterization technique
provides a diffraction pattern of a thin crystalline specimen within a selected area, which can be
used to identify local crystal structures and examine defects, such as twinning and dislocations.
Here, we used SAD to qualitatively evaluate the crystallinity of local areas within these microcrys-
tals. Indeed, the appearance of distinct spots in the diffraction patterns of a large single crystals
indicates high-quality crystals and that the microstrain is mostly isotropic without random defects
(Fig. 6.3C).
Furthermore, it is important to have independent control over the interparticle distance, while
retaining crystallinity and habit, because each structural control can be used to dictate the material
properties. A uniform shift in peak position, however, indicates that there is a 5% decrease in the
DNA bond length as the salt concentration is raised from 0.3 to 1 M (Fig. 6.4A). However, since
the interactions between the DNA bonds and ions are electrostatic in nature, the lattice parameters
of these superlattices can be altered simply by salt exchange (Fig. 6.4B). By changing the salt
concentration after the crystals are grown, the salt-induced transition in interparticle spacing is

119
fully reversible and SAXS patterns collected before and after salt exchange do not show noticeable
changes in the SAXS peak widths (Fig. 6.4). A uniform shift in peak position, however, indicates
that there is a 5% decrease in the DNA bond length as the salt concentration is raised from 0.3 to 1
M (Fig. 6.4A). However, since the interactions between the DNA bonds and ions are electrostatic
in nature, the lattice parameters of these superlattices can be altered simply by salt exchange (Fig.
6.4B).
Taken together, the conclusions presented here reveal the properties of polyelectrolyte brushes
of nanoparticle-based DNA bonds and provide a powerful approach to alter the attachment kinet-
ics of PAEs to control mesoscale crystal size. Importantly, PAE crystallization at elevated salt
concentrations can be used to synthesize colloidal single crystals over a significantly larger length
scale. Furthermore, through post-synthetic salt exchange process, the salt-induced transition is
fully reversible. The extension of this work to different annealing conditions, multivalent cations,
and DNA loading should enhance our fundamental understanding of tuning kinetics to control
materials properties and lead to new possibilities for the realization of kinetically-controlled su-
perlattice structures. The high-level of structural control over colloidal single crystals will enable
researchers to probe the effect of crystal size on the optoelectronic and mechanical properties of
these materials.
3. Associated content
Supporting Information. Experimental procedures, including simulation details, oligonucleotide
sequences, nanoparticle functionalization and assembly, and characterization/analysis techniques
(SAXS, SEM, and TEM), and additional figures are available in the SI.

120
4. Acknowledgements
We thank Dr. Andrew J. Senesi for his helpful discussion on SAXS data analysis. This work
was supported by the following awards: the Center for Bio-Inspired Energy Science, an Energy
Frontier Research Center funded by the U.S. Department of Energy, Office of Science, Basic En-
ergy Sciences Award DE-SC0000989 (oligonucleotide syntheses and purification, simulations);
the Air Force Office of Scientific Research Award FA9550-17-1-0348 (DNA-functionalization of
gold nanoparticles); and the National Science Foundation’s Materials Research Science and En-
gineering Center program (DMR-1121262) and made use of its Shared Facilities at the Materials
Research Center of Northwestern University (EM characterization). SAXS experiments were car-
ried out at beamline 5-ID of the DuPont-Northwestern-Dow Collaborative Access Team at the
Advanced Photon Source. Use of the Advanced Photon Source at Argonne National laboratory
was supported by the U.S. Department of Energy, Office of Science, Office of Basic Energy Sci-
ences, under Contract No. DE-AC02-06CH11357 (SAXS characterization). S.E.S. acknowledges
partial support from the Center for Computation and Theory of Soft Materials Fellowship.
5. Supplementary information
5.1. Molecular dynamics simulations
Effective pair potentials, including electrostatic repulsion and short-range attraction between the
colloids, were calculated via molecular dynamics (MD) simulations to study the crystallization of
charged colloids. In previous studies, colloidal models were extended to predict the shape of grains
of DNA-coated nanoparticle crystals[3]. Here, MD simulations were carried out to understand the
change in interaction between nanoparticles as the salt concentration is increased above the regime
where the Debye-Huckel theory is valid. The DNA model that we used previously[14] is not
121
detailed enough to provide attachment barriers, which is critical in nucleation theory. For this
reason, we implemented the 3SPN model from the de Pablo group with point ions[15, 16] in the
HOOMD-blue molecular dynamics engine[99, 100].
5.1.1. Calculating Potential of Mean Force for DNA-Coated Nanoparticles. Initial configu-
rations were generated using HOOBAS [33], which uses X3DNA software [153]. The simula-
tion size is set to dx = dy = 60 nm for the x− and y−dimensions and dz = 120 nm for
the z−dimension. Simulations were carried out in the canonical ensemble using Langevin dy-
namics with a drag coefficient γ of the ith particle which was set to γi = σi/2 (σi is the diam-
eter of the ith particle). These coefficients were chosen to be smaller than the value expected
from the Stokes law and water dynamical viscosity for numerical equilibration times. With this
setup, simulations contain up to 3.85 × 10⁵ ions. Nanoparticles were constrained to move along
the z direction only. An additional spring was added between the two nanoparticles with po-
tential energy Ubias = Kbias(z − z0)2, with Kbias = 0.25 kJ/mol/A2. Each simulation ran at
a given value of z0 which represents one window for umbrella sampling. Each window was
sampled for 5 × 10⁶ timesteps of ∆t = 0.07δt, where δt is the time unit, which is approxi-
mately equal to 10−13 s. Windows were separated by at most 3 A. In the barrier region around
380 A, the potential of mean force was sampled more finely with distances between windows
around 1 A. The final potential is reconstructed by Multistate Benett Acceptance Ratio (MBAR)
method in the molecular analysis package from the Computational Biophysics Research Team
at RIKEN (http://www.riken.jp/TMS2012/cbp/en/research/software/index.html, package available
online: https://github.com/ymatsunaga/mdtoolbox).
An additional biasing potential was added between complementary bases of the linker DNA
strand attached to different nanoparticles. This biasing takes the form of a Morse potential:

122
(6.1) Umorse = De (1− exp(−α(r − r0)))2 −De
with α = 0.33 A−1, De = B2.65 kJ/mol for G-C pair, and De = B4.18 kJ/mol for the A-T pair.
The quantity B is the amount of biasing introduced in the simulation. We used Hamiltonian replica
exchange to exchange configurations between 4 different replicas that have B = 0, 0.5, 1 and 1.5
to overcome the long diffusion times between two complementary sticky ends finding each other.
The system was equilibrated for 3 × 10⁴ timesteps after each swap. The data for the potential of
mean force was gathered over 5×10⁴ timesteps before another swap attempt was made. Swapping
probabilities vary from 30% for close separations up to 100% for large separations as the biasing
force only acts between complementary linker strands.
5.2. Crystal growth
The number of crystals growing at any point, k, increases at a rate given by:
(6.2)dk
dt= j exp(
−16πγ3
3∆µ2)
where γ is the surface energy, ∆µ is the chemical potential given by ∆µ = ∆µ0 + log(c/c0),
where c is the current concentration and ∆µ0 is the drive at concentration c0. We assumed the
Zeldovitch factor to be 1. Two different rates of crystal growth can be derived. In interface-limited
regimes, the rate of growth of the number of atoms of the ith crystal is given by:

123
(6.3)dni
dt= j∆µn
2/3i τ
where τ is a proportionality constant and ni is the number of atoms in the ith crystal. In
diffusion-limited regimes, the growth rate is given by:
(6.4)dni
dt= 3VmΩDn
1/3i
where Ω is the supersaturation given by Ω = (c− ceq) for spherical particles, ceq is the equilib-
rium concentration, Vm is the molar volume, and D is the diffusion constant. For small values of
ni, the growth is interface-limited while for the large values of ni, the growth is diffusion-limited.
While one would generally assume a mixture of rates when the growth is neither limited by diffu-
sion or interface, in this study, we assumed that the growth rate is at its minimum of the diffusion
or interface-limited rates. The evolution of concentration of the solution is given by:
(6.5)dc
dt= −
k∑i
dni
dt
1
V
where V is the total volume. Since numerical integration requires the number of dimensions
of the differential equations to be an integer, we used stochastic integration for Eq. 6.2. During
a timestep, the chance of increasing the number of dimensions by one (forming a new nuclei) is
given by:
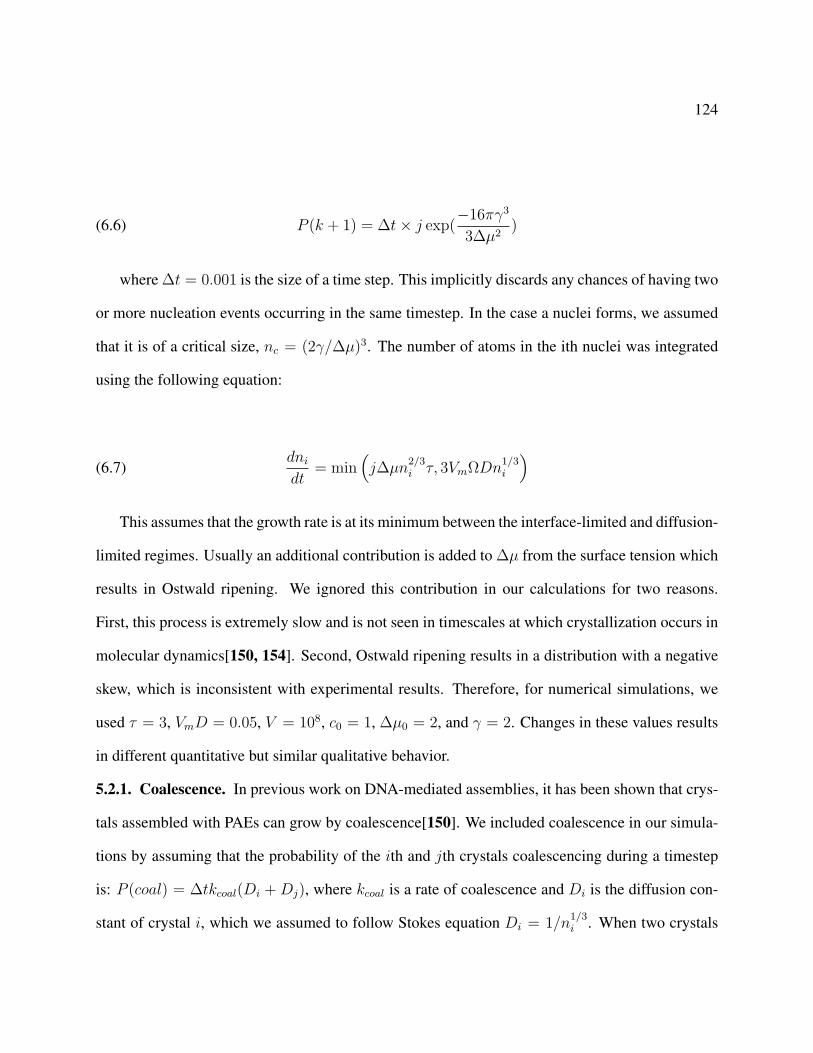
124
(6.6) P (k + 1) = ∆t× j exp(−16πγ3
3∆µ2)
where ∆t = 0.001 is the size of a time step. This implicitly discards any chances of having two
or more nucleation events occurring in the same timestep. In the case a nuclei forms, we assumed
that it is of a critical size, nc = (2γ/∆µ)3. The number of atoms in the ith nuclei was integrated
using the following equation:
(6.7)dni
dt= min
(j∆µn
2/3i τ, 3VmΩDn
1/3i
)This assumes that the growth rate is at its minimum between the interface-limited and diffusion-
limited regimes. Usually an additional contribution is added to ∆µ from the surface tension which
results in Ostwald ripening. We ignored this contribution in our calculations for two reasons.
First, this process is extremely slow and is not seen in timescales at which crystallization occurs in
molecular dynamics[150, 154]. Second, Ostwald ripening results in a distribution with a negative
skew, which is inconsistent with experimental results. Therefore, for numerical simulations, we
used τ = 3, VmD = 0.05, V = 108, c0 = 1, ∆µ0 = 2, and γ = 2. Changes in these values results
in different quantitative but similar qualitative behavior.
5.2.1. Coalescence. In previous work on DNA-mediated assemblies, it has been shown that crys-
tals assembled with PAEs can grow by coalescence[150]. We included coalescence in our simula-
tions by assuming that the probability of the ith and jth crystals coalescencing during a timestep
is: P (coal) = ∆tkcoal(Di +Dj), where kcoal is a rate of coalescence and Di is the diffusion con-
stant of crystal i, which we assumed to follow Stokes equation Di = 1/n1/3i . When two crystals

125
Figure 6.5. The distribution of normalized crystal size for attachment rates of 0.0016, 0.011and 0.55. Evolution towards a narrow negative-skew distribution for increasing attachmentrates is clearly seen. Histogram is obtained from raw data while curves are estimated fromthe kernel density estimation.
coalesce, we assumed that they instantly equilibrate to a spherical shape with ni = (ni + nj) and
nj = 0. While not entirely physical, it produces reasonable results provided kcoal is low and the
surface diffusion of the PAE is sufficiently large.
5.2.2. Size distributions. The distribution of crystal size is an interesting quantity to compare
simulations to experiments. The distributions generated with kcoal = 0 provide crystal size distri-
butions with mostly negative skew (Fig. 6.5). For crystals via nearly fully interface-limited growth,
the skew is small. However, crystals grown mostly in the diffusion-limited regimes show highly
negative skew. For instance, using an attachment rate of 0.0016, we find a skew of -0.16, while
an attachment rate of 0.54 shows a skew of -0.67. Neither of these distribution match the positive
skew, doubly-peaked experimental distributions shown in Fig. 6.2C-E.
None of these distributions characterize the experimental results which is a doubly peaked dis-
tribution. Setting a non-zero value to kcoal produces interesting results. For sufficiently low values

126
of kcoal, we observe an initial growth phase followed by a coarsening phase (Fig. 6.6). During
coarsening, the distribution exhibits two maximums akin to what is observed in experiments. Fur-
thermore, the skewness initially drops during growth, but grows during coarsening, eventually
settling at a value slightly above 1.5, even for systems with high attachment rates.
This would suggest that some coarsening of crystals happen in our experiments. However,
the coarsening process is typically very slow. Moreover, TEM images show quenched, coalesced
crystals, which were ignored in our statistics. This is in agreement with prediction from previ-
ous simulations[150], which were calculated at finite undercooling. It is unknown whether the
observed quenched states on TEM images are created during coalescence events during the crys-
tallization process at elevated temperatures or afterwards. Furthermore, the elevated melting tem-
peratures at higher ionic strengths could promote higher diffusion on crystal surfaces and favor
relaxation of coalesced crystals.

127
Figure 6.6. (A) The number of crystals as a function of time for two values of kcoal, clearlyshowing the initial growth and subsequent coarsening. (B) The distribution of crystal sizesduring the coarsening with kcoal = 10−6 for different times. The curve shows a secondpeak for intermediate times. Attachment rate is set to 0.5456.

128
CHAPTER 7
Electron - atom duality of nanoparticles in DNA-guided assembly
Authors: Martin Girard, Monica Olvera de la Cruz
Collaborative work with: Anindita Das, Shunxi Wang, Chad A. Mirkin
This is part of a collaborative work that is still going on and where experiments are trying to
measure simulation predictions.
1. Abstract
Surface functionalization of colloids has led to crystalline compounds with various symmetries
and functions. In particular, DNA-guided assemblies based on spherical colloids grafted with
complementary DNA have yielded phases that can be directly compared to atom equivalents. Here
we show that in mixtures of large and small DNA functionalized nanoparticles, the smaller particles
when grafted with few DNA strands roam the crystal acting as classical electrons in metals, with
an adjustable metal valency. As the number of strands on the smaller particles is increased or
temperature is decreased, the smaller particles localize yielding a phase transition from metal to
compounds, including intermetallics. The metallic nature of these crystals thus has new design
rules that add degree of freedoms based on metal valency.
2. Body
DNA-mediated assembly has emerged as a powerful tool in colloid science to obtain crystal
lattices with controllable symmetries, lattice parameters and crystal habits [3, 5, 128]. In this par-
adigm, colloids grafted with DNA become equivalent of atoms in regular crystal and are called

129
particle atom equivalent (PAE). The original design rules obtained by MacFarlane based on DNA
and particle size ratios for binary systems of spheres predict only a handful of phases[5]. Other ap-
proaches also include anisotropic DNA coverage of proteins [155], usage of like-charge attractions
by ionic correlations [156] and incorporating DNA scaffold structures[157].
In all of these approaches, crystals formed are always of ionic nature where the stoichiometric
ratio between different particles is fixed and their position in the lattice well defined. One can
interpret the DNA linkers of the PAE as equivalent to the atomic orbitals of atoms, where bonding
between atoms occurs in regions of DNA overlap. In this picture of atomic systems, electrons are
confined the neighboring regions of atoms and cannot form extended states in the crystal due to
their lack of wave properties. In contrast to ionic compounds, metallic crystals allow for formation
of complex alloys, with the well-known example of the Ho-Mg-Zn quasicrystal which led to the
2011 physics Nobel prize [158]. In classical metals, ions are interacting with a sea of electrons. In
order to replicate this behavior in PAE systems, one needs to have highly mobile PAEs. The DNA
bonds in PAE systems is dynamical and the fraction of linkers bound at any given time is relatively
low [159]. Due to the large number of linkers per particle (> 30), the number of DNA bonds per
particle do not differ much from the average. We hypothesize that for colloids grafted with very
few DNA strands (< 10), individual particles can have their DNA linkers unbound and diffuse in
the crystal, behaving like classical electrons in metals.
Here, we use a model system consisting of DNA-functionalized nanoparticles varying dras-
tically in size and DNA surface density to test our hypothesis. In this scheme, commercially
available AuNPs (10 nm-20 nm diameter) were densely functionalized with propylthiolated DNA
to yield conjugates modified with 190 strands (ssDNA). To achieve maximum particle size differ-
ence and DNA loading densities, ultra-small gold nanoparticles (≤ 2 nm diameter), henceforth
referred to as gold nanoclusters (AuNCs), were chosen as the second particle core. In particular, a

130
structurally well-characterized Au102 nanocluster was functionalized with 8 DNA strands. Comple-
mentary DNA “linkers” were then hybridized to the surface-bound DNA of each particle, yielding
PAEs bearing a rigid, double-stranded DNA (dsDNA) region and an exposed, non-self comple-
mentary 5’ overhang “sticky end” to drive PAE assembly. Combining complementary AuNPs
with significantly higher amounts of AuNC conjugates (≥ 5 times) in 0.5 M NaCl solution led to
formation of aggregates.
Previous experiments with similar but larger particles predict AB2 or AB6 (Cs6C60) phases [5].
In the AB2 phases, the large A particle occupy positions of a hexagonal lattice, while the smaller B
PAE occupy the 2d Wyckoff positions. In the AB6 crystal, the large A PAE occupy positions of a
BCC lattice and the smaller B PAE occupy the 12d Wyckoff positions. SAXS measurements reveal
that the position of the larger PAE can take the positions of either BCC, Frank-Kasper (FK) A15
or FCC crystal lattices (Fig. 7.1C). Further characterization by means of transmission electron
microscopy reveal that the smaller particles are disordered in the lattice of large particles. This
suggests that the smaller particles are in a phase akin to a liquid, freely moving between crystal
cells. The smaller PAEs are behaving as electron in classical metals with a valency prescribed by
the incorporated small PAEs in the lattice.
Unlike previous ionic-like crystals, the stoichiometric ratio between large and small particles
is continuously tunable. Indeed, crystal grown using a ratio of 8:1 yields large A particles still
occupying BCC positions even if there are only six crystal sites available, without any measurable
nascent phase left. As valency is raised to 10, competition between the BCC and FCC lattices is
seen on SAXS patterns, with only FCC measured at higher valencies (see Fig. 7.1D-F). A15 phase
is obtained when the number of ssDNA on AuNC is ≥ 10. The average number of linkers on the
Au102 NC is 6.

131
Figure 7.1. SAXS patterns and TEM of (A) BCC (B) FCC and (C) A15 lattices composedof DNA conjugated AuNPs (10 nm diameter) and AuNCs. BCC to FCC transition withincreasing valency in (D) 10 nm- and (E) 15 nm- and (F) 20nm AuNP-AuNC systems.Courtesy of Anindita Das
In simulations, the A15 phase doesn’t possess a trivial geometrical relation with either BCC
or FCC and are always stable at kBT = 1.30. Elevating temperatures to compare relative stability
reveals that melting temperatures of both phases are very close. For systems with a low number of
duplexed strands on the small B particles BCC phase is more stable than A15. For a large number
of duplexed strands, the A15 is more stable, suggesting that there is a relation between observed
phases and the overall number of linkers on the small particles, an effect not observed in previously
established design rules.
We carried molecular dynamics simulations using previously established coarse-grained model
[14, 13] to verify stability of the crystal phases. Just as in experiments, BCC, FK A15 and FCC
phases can be stabilized by tuning the stoichiometric ratio between A and B particles (Fig. 1E). A
weak dependence on the number of duplexed strands on the smaller B particles is also observed.

132
By discretizing space and counting the visitation frequency of the smaller particles, fk, the value
for the degree of delocalization of the colloids, which we termed the metallicity can be computed.
We treat fk as a probability function and use the information entropy (Shannon entropy) given by
S = −∑k
fk log(fk)
The entropy is minimized if all colloids are localized and maximized for a uniform distribution.
We then define metallicity as available volume per B particle using:
M = S + log(Vcell/NB)
Where Vcell is the volume of a unit cell and NB the number of B particles per unit cell. For a
classical metal electron with a uniform distribution in space, Shannon entropy is maximized, while
localization into specific regions is minimized. PAE design allows for control of the metallicity
(Fig. 7.2A and B). Increasing the number of duplexed strands on the small PAE tends to form a
more ionic crystal, confirming the initial hypothesis that delocalization is based on probability
of unbinding PAEs. Furthermore, delocalization increases with temperature as the number of
sticky ends hybridized falls. The metallicity can be controlled by changing the valency (i.e., the
stoichiometry). Increasing the number of small particles results in a more ionic crystal until a
certain stoichiometric ratio is attained and then falls.
In order to demonstrate the duality in the bonding from metallic to compound decreasing tem-
perature, we draw an analogy with the nearly free electron models, where the band structure is com-
prised of a valence and a conduction band separated in energy by a bandgap which is proportional
to the atom electron interaction. From this picture, by increasing valency we “fill” the valency
states, which decreases conductivity until the valency band is completely filled. Further increasing

133
Figure 7.2. (A) Metallicity as a function of valency obtained from simulations of BCC(left), FCC (middle) and A15 (right) phases at temperatures of kBT = 1.3. For PAE graftedwith a large number of strands minimums are clearly seen, corresponding to ideal compoundstoichiometric ratios (B) Metallicity as a function of temperature for BCC (valency of 6),FCC (valency of 10) and A15 (valency of 5). The degree of metallicity increases withtemperature and is clearly controllable.
valency fills the conduction band and thus increases conductivity again. The amount of thermal
excitations in our case is given by Boltzmann statistics and a probability P ∼ exp(−Eg/kBT ),
where Eg is the bandgap energy, rather than Fermi-Dirac statistics. Reducing the number of link-
ers on small PAE reduces the binding energy. In this picture of nearly-free electrons, this leads
to a vanishing bandgap and thermally filled conduction band. Conversely, in strongly interacting
PAEs, this leads to a large bandgap and a transition to an insulator state.
In PAE systems, the small particles, which behave as nearly free electrons, have energies close
to room temperature and therefore, the Fermi liquid approach is invalid. While the crystals show
a metallic character, not all the volume is accessible to small particles. Since many PAEs can
occupy similar energy states, the Fermi surface is not a relevant concept to employ to study the

134
Figure 7.3. Boltzmann volumes constructed from four equally probable partitions of spaceas a function of linker number and metal valency. Crystal lattices are reconstructed bytaking 1/8th of individual unit cells and using the cubic mirror planes to obtain global sym-metries for BCC (left), FCC (center) and A15 (right) lattices. Position of large particlesare indicated in red but are not to scale. Temperature is set to kBT = 1.30. Images arenumerically smoothed by Gaussian blur for visualization purposes. Missing data indicatesnumerically unstable phases.
metal-insulator transition. Rather, the localization is characterized by isoprobable volumes, which
we call Boltzmann volumes as opposed to Fermi surfaces of quantum solids. We can probe the
changes in metallicity in terms of Boltzmann volumes and the real space localization of PAEs in
the system. Indeed on Fig. 7.3A, we can clearly see the localization into the AB6 lattice. As
valency is increased past the ideal value of six, the Boltzmann volume forms more extended states
as a classical analogue of metal-insulator transitions of solids.
When PAEs are fully localized and assume their building block ground state, we recover com-
pound lattices. The BCC lattice correspond to a previously observed AB6 lattice (Fig. 7.4A).
Other lattices have not been previously observed in PAE systems. The compound lattice of the

135
A
B
Figure 7.4. Boltzmann volumes of compound lattices for AB6 lattice (BCC), A4B40 lattice(FCC), A8B46 lattice (A15) and A8B80 lattice (A15), viewed from side (A) and top (B).Cubic unit cell is drawn for clarity
FCC structure is a fully filled high temperature Cu2Se lattice (Fig. 7.4B, A4B40 structure, Fm3m,
Wyckoff positions 8c and 32f), while the A15 shows two possible lattices, either clathrate type I
(Fig. 7.4C, A8B46 structure, equivalent to Ba8Si46) or an unobserved crystal (Fig. 7.4D, A8B80
lattice, Pm3n, Wyckoff positions: 6c, 12f, 16i, 24j and 24k). Appearance of metallic phases open
new avenues even for ionic crystal structures. By changing the binding energy of DNA strands
one could attempt to form a metal lattice at elevated temperatures followed by a transition into an
insulator compound.
Interestingly, the last two compounds both correspond to thermoelectric intermetallic struc-
tures. The appearance of complex metallic alloys (CMA) phases is also highly relevant to under-
standing and probing fundamentals of crystal formation. A currently open question in the CMA
field is: “why do they form ?” (see[160] for further reading on the subject). In particular, CMA are
stabilized by formation of a pseudogap and a depletion of the density of states around the Fermi en-
ergy, which is strikingly similar to the solid state analogy we described with a nearly free electron
model. Moreover, we also find that metallicity, which should correlate with mobility, increases

136
with temperature just as electronic conductivity in CMA. We thus believe this system could be
used as a platform to further study complex atomic systems.
As they are outside the previously established literature on spherical DNA-mediated assem-
blies they open a whole new design space. In particular, they should allow for studies of metallic
alloys by using ternary A-B-C mixtures of PAEs. Equivalent to atomic electronegativity, interac-
tions between electrons and different metallic ions can be tuned by changing the A-C and A-B
hybridization energies independently, a parameter which cannot be finely controlled in atomic sys-
tems, but dictates metal solubilities and CMA phases obtained. Furthermore, electron core shells
of the metallic ions can be controlled by particle shape. In previous works, PAE shape was referred
to as an equivalent to atomic orbitals[33]. In retrospective, PAE shape dictates valence orbitals for
ionic systems, while for metals it should dictate core orbitals.
In conclusion, this work shows that metallic crystals can be self-assembled using DNA pro-
grammable building blocks. The smaller PAEs can behave as electrons in metals or as building
blocks of ionic crystals, which can be continuously tuned. Specifically, their metallic character
can be tailored for specific applications by choosing appropriate DNA sticky end sequences. The
tunable fundamental character of the building blocks is also relevant to other disciplines than PAEs
as they can be used to probe fundamentals of complex systems. As we have shown, CMA arise
naturally in these systems without involving quantum mechanics.

137
CHAPTER 8
Conclusions and future work
In the first part of this thesis, I presented work on orbital representations of colloids. This
method is able to handle any colloid described by a density of particles oscillating around some
mean density as long as the potential energy function possesses a Fourier transform. It is highly
suitable for polymer-grafted particles of arbitrary shapes. While the method is able to deal with
deformation of the shell during assembly processes, it is still not suitable for use with DNA sys-
tems. This is due to the depletion of available free bases of the sticky ends. While the discussion
would suggest that it only plagues our mean-field approximation, we have to realize that all of the
currently used coarse-graining schemes that remove explicit chains suffer from the same problem.
For instance, in [161], an interaction potential is assigned to every bead that constitutes the surface
of the colloids, which can be mapped to a time-static orbital representation. This is a problem that
needs to be addressed in the coarse-graining community. At this point, the only solution I have
envisioned is a separation of the orbitals into free and bound components. Yet, this does not solve
the problem as they are physically coupled. This needs to be studied in much greater detail.
In the second part, I have discussed four different experimental systems. In the first, I simulated
the phase diagram of polyhedrons. The phases correspond to close packed structures for short DNA
and sphere-like phases for long DNA. There is a crossover regime for cubes in which symmetry
of the lattice is broken with respect to the underlying particles. This is an interesting regime as
it can be used to extend the available crystal lattices and symmetries. The regime is extremely
sensitive to changes in the DNA grafting density, and shows a variety of lattices from tetragonal
138
lattice down to triclinic lattices. Changing the DNA grafting density may be a potential challenge
in experiments that will require exploration.
In the second article, I have shown that hexagonal crystals formed by binary PAEs exhibit
large energy barriers between different planes with identical Miller indices. This results in a long
hexagonal rod crystal habit exposing high energy facets, a consequence of the kinetic Wulff shape
construction. This shape is highly reproducible and can be externally controlled, for instance by
the salt concentration. As mentioned very early on, this is suitable for optical properties control.
There are remaining binary compounds to be looked at, namely Cr3Si and Cs6C60. Those are cubic
lattices but it would be interesting to look at the degree of control one has over their crystal habit.
In the third article, I have shown that increasing salt concentration in water during assembly
results in a slowdown of the attachment process and formation of larger crystals. Enabling control
over kinetics enables tailoring of the crystal sizes, which is important for many applications.
The last article of this part deals with mixtures of large particles (atom-equivalents) with small
particles (electron-equivalents). In this work, we have found that the system assembles into various
lattices corresponding to metals. By reducing the temperature, electron-equivalent particles take
specific sites in the crystals, an emulation of Mott transitions in atomic systems. These lattices
then correspond to complex metal alloys or intermetallics. This is highly interesting from a fun-
damental point of view. As mentioned early on, we have limited knowledge of these systems in
the atomic world. This soft system can be used as a testing platform to see why complex metal
alloys form in the first place. For this purpose, ternary systems could be employed, with DNA
binding strength playing the role of electronegativity. In this representation, the system is free of
quantum behavior, which should simplify interpretation. Moreover, the equivalent metal valency
can be chosen arbitrarily and independently of the atom-equivalent, something that is impossible
in natural elements.
139
Yet, there remains some unfilled gaps that should be explored. In particular, how closely related
our intermetallic phases are with the atomic equivalent phases. The similarity between solid-state
physics and behavior of the system is striking, but the Mott transition is not identical in nature. Our
electrons transition towards atoms instead of localized electrons. The quantum nature of electrons
is likely to be the source of this difference, but a more in-depth study is warranted.
Moreover, I introduced early on how defects can be used to concentrate electric fields. How-
ever, there is another approach that is tempting in these self-assembled materials: defect engi-
neering. These defects can be made by introducing an additional type of building block nearly
identical to one of the blocks used to build the crystal. With small changes, for instance to the
DNA length, the interaction between defects may be tailored. Each of these defects would repre-
sent a single optical resonator. Collections of broad optical resonances may lead to formation of
sharp spectral features through the interaction of different resonators and formation of the so-called
Fano-Feshbach resonances [162]. While the exact origin of these modes is still up to debate (see
[163] for Mie-resonance based description and [164] for radiation-less based description), they
could provide easy access to tailoring resonant properties.

140
References
1. R. J. Macfarlane, B. Lee, H. D. Hill, A. J. Senesi, S. Seifert, and C. A. Mirkin, “Assembly andorganization processes in dna-directed colloidal crystallization,” Proceedings of the NationalAcademy of Sciences, vol. 106, no. 26, pp. 10493–10498, 2009.
2. I. Langmuir, “The role of attractive and repulsive forces in the formation of tactoids,thixotropic gels, protein crystals and coacervates,” The Journal of Chemical Physics, vol. 6,no. 12, pp. 873–896, 1938.
3. E. Auyeung, T. I. N. G. Li, A. J. Senesi, A. L. Schmucker, B. C. Pals, M. O. de la Cruz, andC. A. Mirkin, “DNA-mediated nanoparticle crystallization into Wulff polyhedra,” Nature,vol. 505, p. 73, Nov. 2013.
4. R. V. Thaner, Y. Kim, T. I. N. G. Li, R. J. Macfarlane, S. T. Nguyen, M. Olvera de la Cruz,and C. A. Mirkin, “Entropy-Driven Crystallization Behavior in DNA-Mediated NanoparticleAssembly,” Nano Letters, vol. 15, pp. 5545–5551, Aug. 2015.
5. R. J. Macfarlane, B. Lee, M. R. Jones, N. Harris, G. C. Schatz, and C. A. Mirkin, “Nanopar-ticle Superlattice Engineering with DNA,” Science, vol. 334, p. 204, Oct. 2011.
6. M. N. O’Brien, M. R. Jones, K. A. Brown, and C. A. Mirkin, “Universal noble metal nanopar-ticle seeds realized through iterative reductive growth and oxidative dissolution reactions,”Journal of the American Chemical Society, vol. 136, no. 21, pp. 7603–7606, 2014. PMID:24830921.
7. C. R. Laramy, K. A. Brown, M. N. O’Brien, and C. A. Mirkin, “High-throughput, algorithmicdetermination of nanoparticle structure from electron microscopy images,” ACS Nano, vol. 9,no. 12, pp. 12488–12495, 2015. PMID: 26588107.
8. M. R. Jones, R. J. Macfarlane, B. Lee, J. Zhang, K. L. Young, A. J. Senesi, and C. A.Mirkin, “DNA-nanoparticle superlattices formed from anisotropic building blocks,” NatureMaterials, vol. 9, p. 913, Oct. 2010.

141
9. J. D. Brodin, E. Auyeung, and C. A. Mirkin, “DNA-mediated engineering of multicompo-nent enzyme crystals,” Proceedings of the National Academy of Sciences, vol. 112, no. 15,pp. 4564–4569, 2015.
10. T. Kuech, Handbook of Crystal Growth: Thin Films and Epitaxy. Handbook of CrystalGrowth, Elsevier Science, 2014.
11. M. X. Wang, S. E. Seo, P. A. Gabrys, D. Fleischman, B. Lee, Y. Kim, H. A. Atwater, R. J.Macfarlane, and C. A. Mirkin, “Epitaxy: Programmable Atom Equivalents Versus Atoms,”ACS Nano, vol. 11, pp. 180–185, Jan. 2017.
12. P. A. Gabrys, S. E. Seo, M. X. Wang, E. Oh, R. J. Macfarlane, and C. A. Mirkin, “LatticeMismatch in Crystalline Nanoparticle Thin Films,” Nano Letters, vol. 18, pp. 579–585, Jan.2018.
13. C. Knorowski, S. Burleigh, and A. Travesset, “Dynamics and statics of dna-programmablenanoparticle self-assembly and crystallization,” Phys. Rev. Lett., vol. 106, p. 215501, May2011.
14. T. I. Li, R. Sknepnek, R. J. Macfarlane, C. A. Mirkin, and M. Olvera de la Cruz, “Model-ing the Crystallization of Spherical Nucleic Acid Nanoparticle Conjugates with MolecularDynamics Simulations,” Nano Letters, vol. 12, pp. 2509–2514, May 2012.
15. D. M. Hinckley and J. J. de Pablo, “Coarse-Grained Ions for Nucleic Acid Modeling,” Jour-nal of Chemical Theory and Computation, vol. 11, pp. 5436–5446, Nov. 2015.
16. D. M. Hinckley, G. S. Freeman, J. K. Whitmer, and J. J. de Pablo, “An experimentally-informed coarse-grained 3-site-per-nucleotide model of DNA: Structure, thermodynamics,and dynamics of hybridization,” The Journal of Chemical Physics, vol. 139, p. 144903, Oct.2013.
17. J. B. Pendry, A. J. Holden, D. J. Robbins, and W. J. Stewart, “Magnetism from conductors andenhanced nonlinear phenomena,” IEEE Transactions on Microwave Theory and Techniques,vol. 47, pp. 2075–2084, Nov 1999.
18. J. E. G. J. Wijnhoven and W. L. Vos, “Preparation of photonic crystals made of air spheres intitania,” Science, vol. 281, no. 5378, pp. 802–804, 1998.
19. D. J. Park, C. Zhang, J. C. Ku, Y. Zhou, G. C. Schatz, and C. A. Mirkin, “Plasmonic pho-tonic crystals realized through DNA-programmable assembly,” Proceedings of the NationalAcademy of Sciences, vol. 112, no. 4, pp. 977–981, 2015.
20. A. Travesset, “Soft skyrmions, spontaneous valence and selection rules in nanoparticle su-perlattices,” ACS Nano, vol. 11, no. 6, pp. 5375–5382, 2017. PMID: 28514592.

142
21. M. A. Boles and D. V. Talapin, “Many-body effects in nanocrystal superlattices: Departurefrom sphere packing explains stability of binary phases,” Journal of the American ChemicalSociety, vol. 137, no. 13, pp. 4494–4502, 2015. PMID: 25773648.
22. C. Li, J. Shen, C. Peter, and N. F. A. van der Vegt, “A chemically accurate implicit-solventcoarse-grained model for polystyrenesulfonate solutions,” Macromolecules, vol. 45, no. 5,pp. 2551–2561, 2012.
23. E. Brini, E. A. Algaer, P. Ganguly, C. Li, F. Rodriguez-Ropero, and N. F. A. van der Vegt,“Systematic coarse-graining methods for soft matter simulations - a review,” Soft Matter,vol. 9, pp. 2108–2119, 2013.
24. W. G. Noid, Systematic Methods for Structurally Consistent Coarse-Grained Models,pp. 487–531. Totowa, NJ: Humana Press, 2013.
25. F. Sciortino, A. Giacometti, and G. Pastore, “Phase diagram of janus particles,” Phys. Rev.Lett., vol. 103, p. 237801, 2009.
26. Q. Chen, S. C. Bae, and S. Granick, “Directed self-assembly of a colloidal kagome lattice,”Nature, vol. 469, no. 7330, pp. 381–384, 2011.
27. J. Zhang, B. A. Grzybowski, and S. Granick, “Janus particle synthesis, assembly, and appli-cation,” Langmuir, vol. 33, no. 28, pp. 6964–6977, 2017.
28. J. Yan, M. Han, J. Zhang, C. Xu, E. Luijten, and S. Granick, “Reconfiguring active particlesby electrostatic imbalance,” Nat Mater, vol. 15, no. 10, pp. 1095–1099, 2016.
29. M. Han, J. Yan, S. Granick, and E. Luijten, “Effective temperature concept evaluated in anactive colloid mixture,” Proceedings of the National Academy of Sciences, vol. 114, no. 29,pp. 7513–7518, 2017.
30. S. Sacanna, M. Korpics, K. Rodriguez, L. Colon-Melendez, S.-H. Kim, D. J. Pine, and G.-R.Yi, “Shaping colloids for self-assembly,” Nature Communications, vol. 4, p. 1688, Apr 2013.
31. X. Zheng, M. Liu, M. He, D. J. Pine, and M. Weck, “Shape-shifting patchy particles,” Ange-wandte Chemie International Edition, vol. 129, no. 20, pp. 5599–5603, 2017.
32. H. R. Vutukuri, A. Imhof, and A. vanBlaaderen, “Fabrication of polyhedral particles fromspherical colloids and their self-assembly into rotator phases,” Angewandte Chemie Interna-tional Edition, vol. 53, pp. 13830–13834, 2014.
33. M. N. O’Brien, M. Girard, H.-X. Lin, J. A. Millan, M. Olvera de la Cruz, B. Lee, andC. A. Mirkin, “Exploring the zone of anisotropy and broken symmetries in dna-mediated

143
nanoparticle crystallization,” Proceedings of the National Academy of Sciences, vol. 113,no. 38, pp. 10485–10490, 2016.
34. S. Mann, “Self-assembly and transformation of hybrid nano-objects and nanostructures underequilibrium and non-equilibrium conditions,” Nat Mater, vol. 8, pp. 781–792, 2009.
35. J. J. McManus, P. Charbonneau, E. Zaccarelli, and N. Asherie, “The physics of protein self-assembly,” Current Opinion in Colloid & Interface Science, vol. 22, pp. 73–79, 2016.
36. E. Lindahl and M. S. P. Sansom, “Membrane proteins: molecular dynamics simulations,”Current Opinion in Structural Biology, vol. 18, pp. 425–431, 2008.
37. M. X. Wang, J. D. Brodin, J. A. Millan, S. E. Seo, M. Girard, M. Olvera de la Cruz, B. Lee,and C. A. Mirkin, “Altering dna-programmable colloidal crystallization paths by modulatingparticle repulsion,” Nano Letters, vol. 17, pp. 5126–5132, 2017.
38. U. Agarwal and F. A. Escobedo, “Mesophase behaviour of polyhedral particles,” NatureMaterials, vol. 10, p. 230, Feb. 2011.
39. S. Torquato and Y. Jiao, “Dense packings of the Platonic and Archimedean solids,” Nature,vol. 460, p. 876, Aug. 2009.
40. J. de Graaf, R. van Roij, and M. Dijkstra, “Dense regular packings of irregular nonconvexparticles,” Phys. Rev. Lett., vol. 107, p. 155501, 2011.
41. P. F. Damasceno, M. Engel, and S. C. Glotzer, “Predictive Self-Assembly of Polyhedra intoComplex Structures,” Science, vol. 337, p. 453, July 2012.
42. J. Downs, K. Gubbins, S. Murad, and C. Gray, “Spherical harmonic expansion of the inter-molecular site-site potential,” Molecular Physics, vol. 37, pp. 129–140, 1979.
43. R. A. Sack, “Expansions in spherical harmonics. iv. integral form of the radial dependence,”Journal of Mathematical Physics, vol. 8, pp. 1774–1784, 1967.
44. K. Ruedenberg, “Bipolare entwicklungen, fouriertransformation und molekularemehrzentren-integrale,” Theoretica chimica acta, vol. 7, pp. 359–366, 1967.
45. J. G. Gay and B. J. Berne, “Modification of the overlap potential to mimic a linear sitesitepotential,” The Journal of Chemical Physics, vol. 74, pp. 3316–3319, 1981.
46. D. J. Cleaver, C. M. Care, M. P. Allen, and M. P. Neal, “Extension and generalization of thegay-berne potential,” Phys. Rev. E, vol. 54, pp. 559–567, 1996.

144
47. D. J. Ashton, R. L. Jack, and N. B. Wilding, “Self-assembly of colloidal polymers viadepletion-mediated lock and key binding,” Soft Matter, vol. 9, pp. 9661–9666, 2013.
48. D. Marx and J. Hutter, “Ab initio molecular dynamics: Theory and implementation,” Modernmethods and algorithms of quantum chemistry, vol. 13, pp. 301–449, 2000.
49. S. J. Plimpton, “Fast parallel algorithms for short-range molecular dynamics,” J. Comp.Phys., vol. 117, pp. 1–19, 1995.
50. W. Kung and M. O. de la Cruz, “Mediation of long-range attraction selectively betweennegatively charged colloids on surfaces by solvation,” The Journal of Chemical Physics,vol. 127, no. 24, p. 244907, 2007.
51. W. Kung, P. Gonzalez-Mozuelos, and M. O. de la Cruz, “A minimal model of nanoparticlecrystallization in polar solvents via steric effects,” The Journal of Chemical Physics, vol. 133,p. 074704, 2010.
52. Z.-G. Wang, “Fluctuation in electrolyte solutions: The self energy,” Phys. Rev. E, vol. 81,p. 021501, 2010.
53. J. M. Dempster and M. Olvera de la Cruz, “Aggregation of heterogeneously charged col-loids,” ACS Nano, vol. 10, pp. 5909–5915, 2016.
54. N. Baddour, “Operational and convolution properties of three-dimensional fourier transformsin spherical polar coordinates,” J. Opt. Soc. Am. A, vol. 27, pp. 2144–2155, 2010.
55. M. Boyle, “Angular velocity of gravitational radiation from precessing binaries and the coro-tating frame,” Phys. Rev. D, vol. 87, p. 104006, 2013.
56. M. Toyoda and T. Ozaki, “Fast spherical bessel transform via fast fourier transform andrecurrence formula,” Computer Physics Communications, vol. 181, pp. 277–282, 2010.
57. B. Keinert, M. Innmann, M. Sanger, and M. Stamminger, “Spherical fibonacci mapping,”ACM Trans. Graph., vol. 34, pp. 193:1–193:7, 2015.
58. R. Kjellander and R. Ramirez, “Yukawa multipole electrostatics and nontrivial coupling be-tween electrostatic and dispersion interactions in electrolytes,” Journal of Physics: Con-densed Matter, vol. 20, p. 494209, 2008.
59. W. M. Brown, T. D.Nguyen, MiguelFuentes-Cabrerab, J. D.Fowlkes, P. D.Rack, MarkBerger,and A. S.Bland, “An evaluation of molecular dynamics performance on the hybrid cray xk6supercomputer,” Procedia Computer Science, vol. 9, pp. 186–195, 2012.

145
60. J. C. Shelley and G. N. Patey, “A comparison of liquidvapor coexistence in charged hardsphere and charged hard dumbbell fluids,” The Journal of Chemical Physics, vol. 103,pp. 8299–8301, 1995.
61. M. E. van Leeuwen and B. Smit, “What makes a polar liquid a liquid?,” Phys. Rev. Lett.,vol. 71, pp. 3991–3994, 1993.
62. R. Agrawal and D. A. Kofke, “Thermodynamic and structural properties of model systems atsolid-fluid coexistence,” Molecular Physics, vol. 85, no. 1, pp. 23–42, 1995.
63. A. Travesset, “Topological structure prediction in binary nanoparticle superlattices,” SoftMatter, vol. 13, pp. 147–157, 2017.
64. Y. Levin, P. S. Kuhn, and M. C. Barbosa, “Criticality in polar fluids,” Physica A: StatisticalMechanics and its Applications, vol. 292, pp. 129–136, 2001.
65. I. S. Gradshteyn and I. M. Ryzhik, Table of integrals, series, and products. Elsevier/AcademicPress, Amsterdam, seventh ed., 2007.
66. C. A. Mirkin, R. L. Letsinger, R. C. Mucic, and J. J. Storhoff, “A DNA-based method forrationally assembling nanoparticles into macroscopic materials,” Nature, vol. 382, p. 607,Aug. 1996.
67. X. Ye, C. Zhu, P. Ercius, S. N. Raja, M. R. He, Bo amd Jones, M. R. Hauwiller, Y. Liu,T. Xu, and A. P. Alivisatos, “Structural diversity in binary superlattices self-assembled frompolymer-grafted nanocrystals,” Nat. Commun., vol. 6, p. 10052, Dec 2015.
68. J. N. Israelachvili, Intermolecular and Surface Forces, 3rd Edition. Academic Press, 2011.
69. K. J. Bishop, C. E. Wilmer, S. Soh, and B. A. Grzybowski, “Nanoscale forces and their usesin self-assembly,” Small, vol. 5, pp. 1600–1630, Jul 2009.
70. M. Girard, T. D. Nguyen, and M. O. de la Cruz, “Orbitals for classical arbitrary anisotropiccolloidal potentials,” Phys. Rev. E, vol. 96, p. 053309, Nov 2017.
71. B. M. Mladek, J. Fornleitner, F. J. Martinez-Veracoechea, A. Dawid, and D. Frenkel, “Proce-dure to construct a multi-scale coarse-grained model of dna-coated colloids from experimen-tal data,” Soft Matter, vol. 9, pp. 7342–7355, 2013.
72. X. P. Liu, Y. Ni, and L. H. He, “Molecular dynamics simulation of interparticle spacing andmany-body effect in gold supracrystals,” Nanotechnology, vol. 27, no. 13, p. 135707, 2016.
73. N. Horst and A. Travesset, “Prediction of binary nanoparticle superlattices from soft poten-tials,” The Journal of Chemical Physics, vol. 144, no. 1, p. 014502, 2016.

146
74. G. Bauer, N. Gribova, A. Lange, C. Holm, and J. Gross, “Three-body effects in triplets ofcapped gold nanocrystals,” Molecular Physics, vol. 115, no. 9-12, pp. 1031–1040, 2017.
75. E. M. Y. Lee, A. J. Mork, A. P. Willard, and W. A. Tisdale, “Including surface ligand effectsin continuum elastic models of nanocrystal vibrations,” The Journal of Chemical Physics,vol. 147, no. 4, p. 044711, 2017.
76. G. Zhang and T. Schlick, “Lin: A new algorithm to simulate the dynamics of biomoleculesby combining implicitintegration and normal mode techniques,” Journal of ComputationalChemistry, vol. 14, no. 10, pp. 1212–1233, 1993.
77. A. P. Alivisatos, K. P. Johnsson, X. Peng, T. E. Wilson, C. J. Loweth, M. P. Bruchez Jr,and P. G. Schultz, “Organization of ’nanocrystal molecules’ using DNA,” Nature, vol. 382,p. 609, Aug. 1996.
78. E. V. Shevchenko, D. V. Talapin, N. A. Kotov, S. O’Brien, and C. B. Murray, “Structuraldiversity in binary nanoparticle superlattices,” Nature, vol. 439, p. 55, Jan. 2006.
79. Y. Min, M. Akbulut, K. Kristiansen, Y. Golan, and J. Israelachvili, “The role of interparticleand external forces in nanoparticle assembly,” Nature Materials, vol. 7, p. 527, July 2008.
80. B. K. J. M., W. C. E., S. Siowling, and G. B. A., “Nanoscale forces and their uses in self-assembly,” Small, vol. 5, no. 14, pp. 1600–1630, 2009.
81. M. R. Jones, K. D. Osberg, R. J. Macfarlane, M. R. Langille, and C. A. Mirkin, “Templatedtechniques for the synthesis and assembly of plasmonic nanostructures,” Chemical Reviews,vol. 111, no. 6, pp. 3736–3827, 2011. PMID: 21648955.
82. M. R. Jones, N. C. Seeman, and C. A. Mirkin, “Programmable materials and the nature ofthe DNA bond,” Science, vol. 347, Feb. 2015.
83. C. A. Silvera Batista, R. G. Larson, and N. A. Kotov, “Nonadditivity of nanoparticle interac-tions,” Science, vol. 350, Oct. 2015.
84. C. L. Choi and A. P. Alivisatos, “From artificial atoms to nanocrystal molecules: Prepara-tion and properties of more complex nanostructures,” Annual Review of Physical Chemistry,vol. 61, no. 1, pp. 369–389, 2010. PMID: 20055683.
85. R. J. Macfarlane, M. N. O’Brien, S. H. Petrosko, and C. A. Mirkin, “Nucleic acid-modifiednanostructures as programmable atom equivalents: Forging a new “table of elements”,”Angewandte Chemie International Edition, vol. 52, no. 22, pp. 5688–5698, 2012.
86. S. Y. Park, A. K. R. Lytton-Jean, B. Lee, S. Weigand, G. C. Schatz, and C. A. Mirkin, “DNA-programmable nanoparticle crystallization,” Nature, vol. 451, p. 553, Jan. 2008.

147
87. D. Nykypanchuk, M. M. Maye, D. van der Lelie, and O. Gang, “DNA-guided crystallizationof colloidal nanoparticles,” Nature, vol. 451, p. 549, Jan. 2008.
88. L. D. Michele and E. Eiser, “Developments in understanding and controlling self assemblyof dna-functionalized colloids,” Phys. Chem. Chem. Phys., vol. 15, pp. 3115–3129, 2013.
89. M. N. O’Brien, M. R. Jones, B. Lee, and C. A. Mirkin, “Anisotropic nanoparticle comple-mentarity in DNA-mediated co-crystallization,” Nature Materials, vol. 14, p. 833, May 2015.
90. W. B. Rogers and V. N. Manoharan, “Programming colloidal phase transitions with DNAstrand displacement,” Science, vol. 347, p. 639, Feb. 2015.
91. Y. Kim, R. J. Macfarlane, M. R. Jones, and C. A. Mirkin, “Transmutable nanoparticles withreconfigurable surface ligands,” Science, vol. 351, p. 579, Feb. 2016.
92. W. Liu, M. Tagawa, H. L. Xin, T. Wang, H. Emamy, H. Li, K. G. Yager, F. W. Starr, A. V.Tkachenko, and O. Gang, “Diamond family of nanoparticle superlattices,” Science, vol. 351,p. 582, Feb. 2016.
93. A. J. Senesi and B. Lee, “Small-angle scattering of particle assemblies,” Journal of AppliedCrystallography, vol. 48, pp. 1172–1182, Aug 2015.
94. T. Li, A. J. Senesi, and B. Lee, “Small Angle X-ray Scattering for Nanoparticle Research,”Chemical Reviews, vol. 116, pp. 11128–11180, Sept. 2016.
95. J. Henzie, M. Grnwald, A. Widmer-Cooper, P. L. Geissler, and P. Yang, “Self-assembly ofuniform polyhedral silver nanocrystals into densest packings and exoticsuperlattices,” NatureMaterials, vol. 11, p. 131, Nov. 2011.
96. R. Ni, A. P. Gantapara, J. de Graaf, R. van Roij, and M. Dijkstra, “Phase diagram of colloidalhard superballs: from cubes via spheres to octahedra,” Soft Matter, vol. 8, pp. 8826–8834,2012.
97. A. P. Gantapara, J. de Graaf, R. van Roij, and M. Dijkstra, “Phase diagram and structuraldiversity of a family of truncated cubes: Degenerate close-packed structures and vacancy-rich states,” Phys. Rev. Lett., vol. 111, p. 015501, Jul 2013.
98. G. van Anders, N. K. Ahmed, R. Smith, M. Engel, and S. C. Glotzer, “Entropically PatchyParticles: Engineering Valence through Shape Entropy,” ACS Nano, vol. 8, pp. 931–940, Jan.2014.
99. J. A. Anderson, C. D. Lorenz, and A. Travesset, “General purpose molecular dynamics sim-ulations fully implemented on graphics processing units,” Journal of Computational Physics,vol. 227, no. 10, pp. 5342 – 5359, 2008.

148
100. J. Glaser, T. D. Nguyen, J. A. Anderson, P. Lui, F. Spiga, J. A. Millan, D. C. Morse, andS. C. Glotzer, “Strong scaling of general-purpose molecular dynamics simulations on GPUs,”Computer Physics Communications, vol. 192, pp. 97 – 107, 2015.
101. Y. Zhang, F. Lu, D. van der Lelie, and O. Gang, “Continuous phase transformation innanocube assemblies,” Phys. Rev. Lett., vol. 107, p. 135701, Sep 2011.
102. R. D. Batten, F. H. Stillinger, and S. Torquato, “Phase behavior of colloidal superballs: Shapeinterpolation from spheres to cubes,” Phys. Rev. E, vol. 81, p. 061105, Jun 2010.
103. M. A. Boles and D. V. Talapin, “Self-Assembly of Tetrahedral CdSe Nanocrystals: Effective“Patchiness” via Anisotropic Steric Interaction,” Journal of the American Chemical Society,vol. 136, pp. 5868–5871, Apr. 2014.
104. A. J. Senesi, D. J. Eichelsdoerfer, K. A. Brown, B. Lee, E. Auyeung, C. H. J. Choi, R. J.Macfarlane, K. L. Young, and C. A. Mirkin, “Oligonucleotide flexibility dictates crystal qual-ity in dna-programmable nanoparticle superlattices,” Advanced Materials, vol. 26, no. 42,pp. 7235–7240, 2014.
105. S. N. Barnaby, R. V. Thaner, M. B. Ross, K. A. Brown, G. C. Schatz, and C. A. Mirkin,“Modular and Chemically Responsive Oligonucleotide “Bonds” in Nanoparticle Superlat-tices,” Journal of the American Chemical Society, vol. 137, pp. 13566–13571, Oct. 2015.
106. G. Wulff, “On the question of speed of growth and dissolution of crystal surfaces,” Z. Kristal-logr, vol. 34, pp. 449–530, 1901.
107. R. F. Sekerka, “Equilibrium and growth shapes of crystals: how do they differ and whyshould we care?,” Crystal Research and Technology, vol. 40, no. 45, pp. 291–306, 2005.
108. R. W. Balluffi, S. Allen, and W. C. Carter, Kinetics of materials. John Wiley & Sons, 2005.
109. D. Shi, V. Adinolfi, R. Comin, M. Yuan, E. Alarousu, A. Buin, Y. Chen, S. Hoogland,A. Rothenberger, and K. Katsiev, “Low trap-state density and long carrier diffusion inorganolead trihalide perovskite single crystals,” Science, vol. 347, no. 6221, pp. 519–522,2015.
110. W. Nie, H. Tsai, R. Asadpour, J.-C. Blancon, A. J. Neukirch, G. Gupta, J. J. Crochet,M. Chhowalla, S. Tretiak, and M. A. Alam, “High-efficiency solution-processed perovskitesolar cells with millimeter-scale grains,” Science, vol. 347, no. 6221, pp. 522–525, 2015.
111. K. Watanabe, T. Taniguchi, and H. Kanda, “Direct-bandgap properties and evidence for ul-traviolet lasing of hexagonal boron nitride single crystal,” Nature materials, vol. 3, no. 6,p. 404, 2004.

149
112. T. Kessler, C. Hagemann, C. Grebing, T. Legero, U. Sterr, F. Riehle, M. J. Martin, L. Chen,and J. Ye, “A sub-40-mHz-linewidth laser based on a silicon single-crystal optical cavity,”Nature Photonics, vol. 6, no. 10, p. 687, 2012.
113. M. B. Ross, J. C. Ku, V. M. Vaccarezza, G. C. Schatz, and C. A. Mirkin, “Nanoscale formdictates mesoscale function in plasmonic DNAnanoparticle superlattices,” Nature nanotech-nology, vol. 10, no. 5, p. 453, 2015.
114. M. B. Ross, M. G. Blaber, and G. C. Schatz, “Using nanoscale and mesoscale anisotropy toengineer the optical response of three-dimensional plasmonic metamaterials,” Nature Com-munications, vol. 5, p. 4090, 2014.
115. H. Dong, Z. Chen, L. Sun, J. Lu, W. Xie, H. H. Tan, C. Jagadish, and X. Shen, “Whisperinggallery modes in indium oxide hexagonal microcavities,” Applied physics letters, vol. 94,no. 17, p. 173115, 2009.
116. C. Tessarek, G. Sarau, M. Kiometzis, and S. Christiansen, “High quality factor whisperinggallery modes from self-assembled hexagonal GaN rods grown by metal-organic vapor phaseepitaxy,” Optics express, vol. 21, no. 3, pp. 2733–2740, 2013.
117. S.-H. Gong, S.-M. Ko, M.-H. Jang, and Y.-H. Cho, “Giant rabi splitting of whispering gallerypolaritons in GaN/InGaN coreshell wire,” Nano letters, vol. 15, no. 7, pp. 4517–4524, 2015.
118. R. W. Boyd, R. J. Gehr, G. L. Fischer, and J. E. Sipe, “Nonlinear optical properties ofnanocomposite materials,” Pure and Applied Optics: Journal of the European Optical So-ciety Part A, vol. 5, no. 5, p. 505, 1996.
119. J. Zhang, X. Jin, P. I. Morales-Guzman, X. Yu, H. Liu, H. Zhang, L. Razzari, and J. P.Claverie, “Engineering the absorption and field enhancement properties of AuTiO2 nanohy-brids via whispering gallery mode resonances for photocatalytic water splitting,” ACS nano,vol. 10, no. 4, pp. 4496–4503, 2016.
120. A. Tao, P. Sinsermsuksakul, and P. Yang, “Tunable plasmonic lattices of silver nanocrystals,”Nature nanotechnology, vol. 2, no. 7, p. 435, 2007.
121. X. Ye, J. Chen, B. T. Diroll, and C. B. Murray, “Tunable plasmonic coupling in self-assembled binary nanocrystal superlattices studied by correlated optical microspectropho-tometry and electron microscopy,” Nano letters, vol. 13, no. 3, pp. 1291–1297, 2013.
122. A. S. Urban, X. Shen, Y. Wang, N. Large, H. Wang, M. W. Knight, P. Nordlander, H. Chen,and N. J. Halas, “Three-dimensional plasmonic nanoclusters,” Nano letters, vol. 13, no. 9,pp. 4399–4403, 2013.

150
123. S. E. Seo, M. X. Wang, C. M. Shade, J. L. Rouge, K. A. Brown, and C. A. Mirkin, “Modulat-ing the bond strength of DNAnanoparticle superlattices,” ACS nano, vol. 10, no. 2, pp. 1771–1779, 2015.
124. R. J. Macfarlane, M. R. Jones, A. J. Senesi, K. L. Young, B. Lee, J. Wu, and C. A. Mirkin,“Establishing the Design Rules for DNAMediated Programmable Colloidal Crystallization,”Angewandte Chemie, vol. 122, no. 27, pp. 4693–4696, 2010.
125. J. I. Cutler, E. Auyeung, and C. A. Mirkin, “Spherical nucleic acids,” Journal of the AmericanChemical Society, vol. 134, no. 3, pp. 1376–1391, 2012.
126. C. Zhang, R. J. Macfarlane, K. L. Young, C. H. J. Choi, L. Hao, E. Auyeung, G. Liu, X. Zhou,and C. A. Mirkin, “A general approach to DNA-programmable atom equivalents,” NatureMaterials, vol. 12, p. 741, May 2013.
127. Y. Zhang, F. Lu, K. G. Yager, D. van der Lelie, and O. Gang, “A general strategy for theDNA-mediated self-assembly of functional nanoparticles into heterogeneous systems,” Na-ture Nanotechnology, vol. 8, p. 865, Oct. 2013.
128. M. N. O’Brien, H.-X. Lin, M. Girard, M. Olvera de la Cruz, and C. A. Mirkin, “ProgrammingColloidal Crystal Habit with Anisotropic Nanoparticle Building Blocks and DNA Bonds,”Journal of the American Chemical Society, vol. 138, pp. 14562–14565, Nov. 2016.
129. S. E. Seo, T. Li, A. J. Senesi, C. A. Mirkin, and B. Lee, “The Role of Repulsion in Col-loidal Crystal Engineering with DNA,” Journal of the American Chemical Society, vol. 139,pp. 16528–16535, Nov. 2017.
130. M. Maye, D. Nykypanchuk, D. vanderLelie, and O. Gang, “DNA-Regulated Micro- andNanoparticle Assembly,” Small, vol. 3, pp. 1678–1682, Oct. 2007.
131. L. D. Marks and L. Peng, “Nanoparticle shape, thermodynamics and kinetics,” Journal ofPhysics: Condensed Matter, vol. 28, p. 053001, Feb. 2016.
132. W. F. Berg, “Crystal Growth from Solutions,” Proceedings of the Royal Society A: Mathe-matical, Physical and Engineering Sciences, vol. 164, pp. 79–95, Jan. 1938.
133. J. Villain, “The shape of crystals to come,” Nature, vol. 350, p. 273, Mar. 1991.
134. E. Auyeung, R. J. Macfarlane, C. H. J. Choi, J. I. Cutler, and C. A. Mirkin, “TransitioningDNA-Engineered Nanoparticle Superlattices from Solution to the Solid State,” AdvancedMaterials, vol. 24, pp. 5181–5186, Oct. 2012.
151
135. R. V. Zucker, D. Chatain, U. Dahmen, S. Hagege, and W. C. Carter, “New software tools forthe calculation and display of isolated and attached interfacial-energy minimizing particleshapes,” Journal of Materials Science, vol. 47, pp. 8290–8302, Dec 2012.
136. M. A. Boles, M. Engel, and D. V. Talapin, “Self-Assembly of Colloidal Nanocrystals: FromIntricate Structures to Functional Materials,” Chemical Reviews, vol. 116, pp. 11220–11289,Sept. 2016.
137. Z. Qian and D. S. Ginger, “Reversibly Reconfigurable Colloidal Plasmonic Nanomaterials,”Journal of the American Chemical Society, vol. 139, pp. 5266–5276, Apr. 2017.
138. N. J. Halas, S. Lal, W.-S. Chang, S. Link, and P. Nordlander, “Plasmons in Strongly CoupledMetallic Nanostructures,” Chemical Reviews, vol. 111, pp. 3913–3961, June 2011.
139. D. J. Park, J. C. Ku, L. Sun, C. M. Lethiec, N. P. Stern, G. C. Schatz, and C. A. Mirkin,“Directional emission from dye-functionalized plasmonic DNA superlattice microcavities,”Proceedings of the National Academy of Sciences, vol. 114, no. 3, pp. 457–461, 2017.
140. S. Pal, Y. Zhang, S. K. Kumar, and O. Gang, “Dynamic Tuning of DNA-Nanoparticle Su-perlattices by Molecular Intercalation of Double Helix,” Journal of the American ChemicalSociety, vol. 137, pp. 4030–4033, Apr. 2015.
141. J. J. De Yoreo, “Principles of Crystal Nucleation and Growth,” Reviews in Mineralogy andGeochemistry, vol. 54, pp. 57–93, Jan. 2003.
142. R. J. Macfarlane, R. V. Thaner, K. A. Brown, J. Zhang, B. Lee, S. T. Nguyen, and C. A.Mirkin, “Importance of the DNA bond in programmable nanoparticle crystallization,” Pro-ceedings of the National Academy of Sciences, vol. 111, no. 42, pp. 14995–15000, 2014.
143. Y. Okahata, M. Kawase, K. Niikura, F. Ohtake, H. Furusawa, and Y. Ebara, “Kinetic Mea-surements of DNA Hybridization on an Oligonucleotide-Immobilized 27-MHz Quartz Crys-tal Microbalance,” Analytical Chemistry, vol. 70, pp. 1288–1296, Apr. 1998.
144. E. M. Knipping, M. J. Lakin, K. L. Foster, P. Jungwirth, D. J. Tobias, R. B. Gerber, D. Dab-dub, and B. J. Finlayson-Pitts, “Experiments and Simulations of Ion-Enhanced InterfacialChemistry on Aqueous NaCl Aerosols,” Science, vol. 288, no. 5464, pp. 301–306, 2000.
145. P. Gonzlez-Mozuelos, M. S. Yeom, and M. Olvera de la Cruz, “Molecular multivalent elec-trolytes: microstructure and screeninglengths,” The European Physical Journal E, vol. 16,pp. 167–178, Feb. 2005.
146. Y. Li, M. Girard, M. Shen, J. A. Millan, and M. Olvera de la Cruz, “Strong attractions andrepulsions mediated by monovalent salts,” Proceedings of the National Academy of Sciences,vol. 114, no. 45, pp. 11838–11843, 2017.

152
147. A. A. Lee, C. S. Perez-Martinez, A. M. Smith, and S. Perkin, “Scaling Analysis of the Screen-ing Length in Concentrated Electrolytes,” Physical Review Letters, vol. 119, July 2017.
148. E. J. Mittemeijer and U. Welzel, “The state of the art of the diffraction analysis of crystallitesize and lattice strain,” Zeitschrift fr Kristallographie, vol. 223, Jan. 2008.
149. J. R. Kirkpatrick, “Crystal growth from the melt: A review,” American Mineralogist, vol. 60,pp. 798–614, 1975.
150. S. Dhakal, K. L. Kohlstedt, G. C. Schatz, C. A. Mirkin, and M. Olvera de la Cruz, “GrowthDynamics for DNA-Guided Nanoparticle Crystallization,” ACS Nano, vol. 7, pp. 10948–10959, Dec. 2013.
151. L. J. Moore, R. D. Dear, M. D. Summers, R. P. A. Dullens, and G. A. D. Ritchie, “DirectObservation of Grain Rotation-Induced Grain Coalescence in Two-Dimensional ColloidalCrystals,” Nano Letters, vol. 10, pp. 4266–4272, Oct. 2010.
152. M. B. Ross, J. C. Ku, M. G. Blaber, C. A. Mirkin, and G. C. Schatz, “Defect toleranceand the effect of structural inhomogeneity in plasmonic DNA-nanoparticle superlattices,”Proceedings of the National Academy of Sciences, vol. 112, pp. 10292–10297, Aug. 2015.
153. X. Lu and W. K. Olson, “3dna: a software package for the analysis, rebuilding and visual-ization of threedimensional nucleic acid structures,” Nucleic Acids Research, vol. 31, no. 17,pp. 5108–5121, 2003.
154. L. Ratke and P. W. Voorhees, Growth and coarsening: Ostwald ripening in material process-ing. Springer Science & Business Media, 2013.
155. J. R. McMillan, J. D. Brodin, J. A. Millan, B. Lee, M. Olvera de la Cruz, and C. A. Mirkin,“Modulating Nanoparticle Superlattice Structure Using Proteins with Tunable Bond Distri-butions,” Journal of the American Chemical Society, vol. 139, pp. 1754–1757, Feb. 2017.
156. S. Kewalramani, G. I. Guerrero-Garca, L. M. Moreau, J. W. Zwanikken, C. A. Mirkin,M. Olvera de la Cruz, and M. J. Bedzyk, “Electrolyte-Mediated Assembly of ChargedNanoparticles,” ACS Central Science, vol. 2, pp. 219–224, Apr. 2016.
157. Y. Tian, Y. Zhang, T. Wang, H. L. Xin, H. Li, and O. Gang, “Lattice engineering throughnanoparticleDNA frameworks,” Nature Materials, vol. 15, p. 654, Feb. 2016.
158. D. Shechtman, I. Blech, D. Gratias, and J. W. Cahn, “Metallic Phase with Long-Range Orien-tational Order and No Translational Symmetry,” Physical Review Letters, vol. 53, pp. 1951–1953, Nov. 1984.

153
159. T. I. N. G. Li, R. Sknepnek, and M. Olvera de la Cruz, “Thermally Active HybridizationDrives the Crystallization of DNA-Functionalized Nanoparticles,” Journal of the AmericanChemical Society, vol. 135, pp. 8535–8541, June 2013.
160. J.-M. Dubois and E. Belin-Ferr, eds., Complex metallic alloys: fundamentals and applica-tions. Weinheim: Wiley-VCH, 2011. OCLC: ocn655675976.
161. H. Lin, S. Lee, L. Sun, M. Spellings, M. Engel, S. C. Glotzer, and C. A. Mirkin, “Clathratecolloidal crystals,” Science, vol. 355, no. 6328, pp. 931–935, 2017.
162. J. S. T. Gongora, G. Favraud, and A. Fratalocchi, “Fundamental and high-order anapoles inall-dielectric metamaterials via fanofeshbach modes competition,” Nanotechnology, vol. 28,no. 10, p. 104001, 2017.
163. B. Stout and R. McPhedran, “Egocentric physics: Just about mie,” EPL (Europhysics Let-ters), vol. 119, no. 4, p. 44002, 2017.
164. A. E. Miroshnichenko, A. B. Evlyukhin, Y. F. Yu, R. M. Bakker, A. Chipouline, A. I.Kuznetsov, B. Luk’yanchuk, B. N. Chichkov, and Y. S. Kivshar, “Nonradiating anapolemodes in dielectric nanoparticles,” Nature Communications, vol. 6, p. 8069, 2015.