Embed Size (px)
Citation preview

Models of stochastic biperiodic oscillations and extended serial correlations in electroreceptorsof paddlefish
Alexander B. Neiman*Department of Physics and Astronomy, Ohio University, Ohio 45701, USA
David F. Russell†
Center for Neurodynamics, University of Missouri at St. Louis, St. Louis, Missouri 63121, USA�Received 3 February 2005; published 23 June 2005�
Two types of minimal models were used to study stochastic oscillations in sensory receptors composed oftwo coupled oscillators, as in the electroreceptors of paddlefish. They have populations of cells in sensoryepithelia undergoing �26 Hz oscillations. These are coupled unidirectionally via synaptic excitation to a fewafferent neurons, each of whose terminal contains a 30–70 Hz oscillator, expressed as a dominant peak in thepower spectra of spontaneous afferent firing, corresponding to the mean firing rate. The two distinct types ofinternal noisy oscillators result in stochastic biperiodic firing patterns of the primary afferent sensory neurons.However, the functions of the oscillations have remained elusive, motivating this study. The models we usedhere are based on the circle map, or on the Ermentraut-Koppell canonical phase �theta neuron� model. Param-eters were chosen according to experimental data. We used the models to demonstrate that the presence ofepithelial oscillations leads to extended negative correlations of afferent interspike intervals, and to show thatthe correlation structure depends crucially on the ratio of the afferent to epithelial oscillation frequencies, beingmost pronounced when this ratio is close to 2, as observed in experiments. Our studies of stochastic versionsof these models are of general interest for a wide range of coupled excitable systems, especially for under-standing the functional roles of noisy oscillations in auditory and other types of “hair cell–primary afferent”sensory receptors.
DOI: 10.1103/PhysRevE.71.061915 PACS number�s�: 87.19.La, 05.45.Xt, 87.17.Nn, 87.19.Nn
I. INTRODUCTION
Many sensory receptors possess a structure whereby de-tector cells in a sensory epithelium are synaptically coupledto one or more excitable primary afferent neurons. The sen-sory epithelia are composed of stimulus-sensitive hair cellsseparated by support cells. The afferent axon conducts actionpotentials, a receptor’s output, to the brain. Examples of such“hair cell–primary afferent” receptors include the auditoryand vestibular sensory receptors of vertebrates, and also theelectroreceptors of certain aquatic animals.
Prominent examples of spontaneous oscillations in haircells have been characterized, occurring without any stimu-lus being applied �1–4�. The oscillations are expressed asperiodic shifts of the membrane potential of a hair cell, or asperiodic motions of a hair cell’s mechanosensitive cilia. Thenatural frequency of oscillations correlates with the stimulusfrequency that a given hair cell is most sensitive to, thuscontributing to frequency selectivity �1,3�. It was proposedrecently that spontaneous oscillations in certain auditory haircells are “active,” in other words, are not simply driven bythermal noise �4,5�.
On the other hand, spontaneous oscillatory firing patternsof afferent neurons have been observed in several sensoryreceptors. For example, mammalian cold receptor afferentsproduce repetitive bursts of spikes when chilled �6�; the os-
cillations have been modeled as arising from slow ion chan-nels in the afferent terminals �7,8�.
In this paper, we use minimal models to characterize andexplore the possible function of two distinct types of oscil-lators embedded into the novel “biperiodic” organization ofelectroreceptors �ERs� of paddlefish �Polyodon spathula��9,10�. An ER of this freshwater fish offers an accessible andexperimentally advantageous biological model for studyingnonlinear phenomena such as self-sustained oscillations �9�,synchronization �11�, bursting, and noise-induced phenom-ena �12,13�. Thousands of electrosensitive organs are locatedon an elongated appendage called the rostrum, located infront of the head. The rostrum acts as an antenna for detect-ing weak electrical signals emitted by planktonic prey�12,14�. A single ER is a system consisting of a cluster of3–35 skin pores �Fig. 1�, each leading into a short canal �15�,which ends in a sensory epithelium containing �400 haircells. The hair cells of a cluster synaptically excite the ter-minals of a few �2–4� primary afferent sensory neurons,whose axons project to the brain. The population of epithelialcells generates stochastic oscillations at approximately26 Hz, expressed as a noisy oscillatory field voltage that canbe recorded from ER canals. Collectively we term this the“epithelial oscillator” �EO�. The EO is coupled unidirection-ally via synaptic excitation to another oscillator, residing ineach afferent’s terminal, and driving spikes. The latter “af-ferent oscillator” �AO� has a natural frequency in the30–70 Hz band, depending on the particular ER, and is ex-pressed as a dominant peak in power spectra of spontaneousafferent firing. Afferent spectra also show a noisy peak at the
*Electronic address: [email protected]†Electronic address: [email protected]
PHYSICAL REVIEW E 71, 061915 �2005�
1539-3755/2005/71�6�/061915�10�/$23.00 ©2005 The American Physical Society061915-1

EO frequency �9,10�, due to the hair-cell–to–afferent synap-tic input �15�. Both types of oscillators influence the patternof afferent firing, which, as a result, is stochastically biperi-odic or quasiperiodic.
A detailed study of cellular mechanisms of paddlefish ERsis not available yet, and thus a detailed ionic model of an ERsystem cannot be constructed at this time. Nevertheless, toinvestigate the functions of biperiodic organization, we pro-pose minimal formal models for the spontaneous stochasticoscillations and biperiodicity observed in paddlefish ERs.The first and most general model is a circle map. This modelhas been widely studied in the mathematical literature, and isa generic model for a periodically driven self-sustained os-cillator. The second model is based on the Ermentrout-Koppell canonical phase model, or so-called theta neuronmodel, which describes type-I spiking or excitability �16�.We include an additional noisy periodic modulation of a con-trol parameter, to incorporate the EO.
Using these models, we studied the impact of epithelialoscillators on the statistical properties of afferent firing, seek-ing to delineate possible advantages of internal oscillatorsand biperiodic organization for the operation of hair cell–primary afferent sensory receptors in general, as well aspaddlefish ERs. In particular, we explored possible origins ofthe extended negative correlations of afferent interspike in-tervals �ISIs� that have been observed in experimental data.Recently, in another type of ER found in weakly electric fish�17–19�, it was shown that anticorrelations of ISIs, lastingfor only a few ISIs, lead to regularity of P afferents on inter-mediate time scales ��200 msec� and give rise to increasedER sensitivity �17�. In general, ISI correlations have beenattributed either to internal dynamics of a neuron, such asslow adaptation currents, or to external correlated input
�20,21�. We observe ISI anticorrelations in the afferent firingof paddlefish ERs, but the anticorrelations are more ex-tended, continuing for up to 50 ISIs �9,10�. We show herethat the extended duration of ISI anticorrelations in a paddle-fish ER is due to its biperiodic structure, based on our ex-perimental evidence for the existence of epithelial and affer-ent oscillators �9,10�, and the known hair-cell–to–afferentcoupling �15�. Furthermore, we present experimental andmodeling results showing that the structure of the ISI serialcorrelations is determined by the ratio of the frequencies ofthe EO and the AO.
The paper is organized as follows. In Sec. II we reviewexperimental results on spontaneous activity of electrorecep-tors. Sections III and IV are devoted to the circle map and tothe phase models, respectively.
II. STATISTICAL PROPERTIES OF OSCILLATIONSIN PADDLEFISH ELECTRORECEPTORS
Epithelial oscillations result from the collective activity ofhundreds of cells in the epithelial layer at the bottom of acanal. Their summed voltage activity, as recorded using asingle pipet electrode inserted into a canal’s skin pore, werefer to as the EO. Remarkably, the fundamental frequencyof the EO in different canals and in different fish is verysimilar �26±1.6 Hz�, at the regulated temperature of 22 °C�10�. We will employ this fact further on, using the period ofthe EO, Te=1/ fe=1/26 sec, as a reference time scale formodeling of ERs. The EO processes in different canals of thesame ER are uncorrelated �10�. The epithelial oscillations areclosely akin to Gaussian narrowband or “harmonic” noise�22�. Since 3–35 epithelia converge synaptically onto a givenafferent, then the EO input to an afferent is a sum of 3–35uncorrelated stochastic oscillatory processes of similar fre-quency.
In contrast to the EO, the fundamental frequency of theafferent oscillator, estimated as the mean spontaneous firingrate or from the fundamental peak in power spectra of spon-taneous firing, was distributed over a wide range of30–70 Hz for different afferents in different fish �10�, at22 °C. For a given afferent, the smoothed firing rate wasrelatively fixed, and the probability density of interspike in-tervals had a �-like shape with a well-expressed single peak.The coefficient of variation �CV�, defined as the ratio of thestandard deviation of the ISI to the mean ISI, cv=���2�− ���2 / ���, was in the range of 0.1 to 0.38 �10�. How-ever, since CVs and probability density distributions of ISIsare invariant for simple shuffling of interspike intervals,these commonly used neuroscience metrics do not provideinformation about the correlation structure of afferent spik-ing.
Stimulation with external electric fields revealed anotherstriking feature of ERs. Only the AO frequency was affectedby weak external electric stimuli, while the frequency of epi-thelial oscillations was almost invariant �10�. Inhibitory stepstimuli of large enough amplitude can stop the afferent firing,which then returns �adapts� back to normal with a graduallyincreasing firing rate. During slow inhibitory linear rampstimuli, the firing rate can be gradually decreased down to
FIG. 1. Organization of electroreceptors �ERs� on the rostrum ofpaddlefish. They are of the ampullary cathodally excited type, likeERs in sharks and rays. Each short �0.2 mm� canal leads from a0.1 mm diameter pore on the skin to a sensory epithelium, contain-ing voltage-sensitive hair cells. The canals in a single receptive fieldform a cluster, approx. 2 mm in diameter. All of the epithelia in thecluster are innervated by 2–4 afferent sensory neurons, whose ax-ons conduct action potentials to the brain.
A. B. NEIMAN AND D. F. RUSSELL PHYSICAL REVIEW E 71, 061915 �2005�
061915-2

zero. These experimental observations suggest that the affer-ents conform to the so-called type-I neuronal spiking�16,23�.
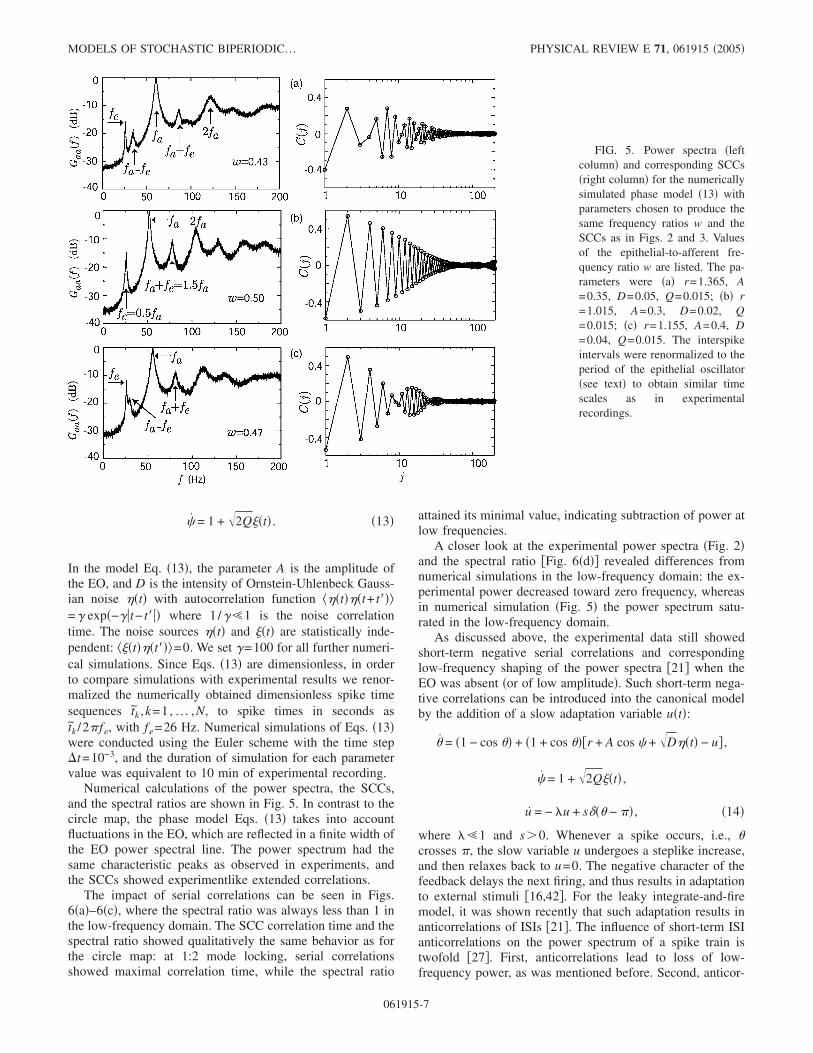
Power spectra of spontaneous afferent firing showed aspecific structure expected for a periodically driven nonlinearoscillator �see Fig. 2�. The main peak at fa corresponded tothe mean firing rate of the afferent. An independent peak atfe corresponded to the frequency of epithelial oscillations,since it matched the fundamental peak in the power spectrumof a canal signal from the afferent’s receptive field. Side-bands at fa± fe and higher harmonics of these peaks werealways present. The mean EO:AO ratio of their fundamentalfrequencies during spontaneous activity, w= fe / fa, was0.49±0.08, estimated from power spectrum peaks of 67 af-ferents �10�. This ratio was relatively fixed in a given affer-ent. That is, the EO and the AO were often close to being ina 1:2 rational frequency ratio.
In the absence of epithelial oscillations, e.g., in agedpreparations in which the EO amplitude had run down, af-ferent firing became nearly periodic �9�: its power spectrumshowed only a narrow sharp peak at the mean firing rate �andits higher harmonics�. Thus, epithelial oscillations can beconsidered as internal noise for the ER system. This noise,however, is narrowband, and leads to the existence of corre-lations between interspike intervals, as seen in the fe peakand sideband peaks in afferent power spectra.
An effective metric of correlations between sequentialISIs, �n= tn− tn−1, is the autocorrelation function of interspikeintervals, also known as the serial correlation coefficient�SCC�, defined as
C�j� =��k�k+j� − ��k�2
��k2� − ��k�2 , �1�
where j is the lag after a given ISI in terms of the number ofelapsed ISIs. The SCC �1� measures linear relations betweensequential interspike intervals, and ranges from −1 �anticor-relation� to +1 �complete correlation�. In the case of a re-newal point process, C�j�=� j,0, where � j,0 is the Kroneckersymbol. The SCC can be characterized by a single number,the correlation time �or correlation length� tcor �24�, which inour case can be calculated as
tcor = j=1
�
C�j� . �2�
The SCCs in Fig. 2 �right column� clearly illustrate the non-renewal character of the underlying stochastic point pro-cesses. The SCCs showed oscillatory character, since therewas usually a negative correlation between the duration ofsequential ISIs. That is, a long ISI tended to be followed bya short ISI, and vice versa �10,25,26�, such that the ISI vari-ability was reduced when considering pairs of spikes�17–19�.
A new result is illustrated in Fig. 2: the structure of theSCC depends on the ratio w of the fundamental frequenciesof the two oscillators. The longest correlations observed inFig. 2�b� corresponded to the ratio w�0.5 between the fre-quencies of the afferent and epithelial oscillators, that is, atthe rational mode locking ratio 1:2. In other examples, theSCC showed beating as in Fig. 2�c� when the frequency ratio
FIG. 2. Experimental datafrom paddlefish electroreceptorafferents. Left column: Powerspectra calculated from spiketrains recorded from three differ-ent primary afferents �a�,�b�,�c�.Values of the epithelial-to-afferentfrequency ratio w are listed. Rightcolumn: Serial correlation coeffi-cients �SCCs� of the same spiketrains.
MODELS OF STOCHASTIC BIPERIODIC… PHYSICAL REVIEW E 71, 061915 �2005�
061915-3
was slightly farther away from 0.5. At larger departures fromw=0.5 �Fig. 2�a��, the anticorrelations were briefer and alsosmaller in magnitude.
The anticorrelations of spontaneous afferent ISIs inpaddlefish ERs continue for an �10-fold larger number ofISIs �significant up to 50, sometimes more �9,10�� than thoseobserved in P receptors of weakly electric fish �17,18�, inwhich the anticorrelations propagate for only a few ISIs.Thus, we refer to the normal ISI anticorrelations in paddle-fish ERs as being “extended.” If the epithelial oscillations ofpaddlefish ERs were absent, as in aged preparations, the SCCof afferent ISIs still exhibited anticorrelations, but they van-ished for lags greater than 2–3 interspike intervals �9�, whichwe refer to as “short-term anticorrelations.” The latter areprobably an inherent property of the afferent terminal, andappear due to slow ionic currents, as in a model for P recep-tors of weakly electric fish �18�. In P receptors, these short-term anticorrelations act to decrease the spectral power atlow frequencies in afferent power spectra �21,27�.
Our experimental data showing that the tenfold extensionof ISI anticorrelations is due to interactions of the EO andAO include the following: �1� correlation between the pres-ence or absence of the EO and the presence or absence �re-spectively� of extended ISI anticorrelations; �2� dependenceof the structure and length of ISI anticorrelations on theEO:AO frequency ratio in different receptors; and �3� abilityto evoke prompt increases in the ISI correlation length byexperimentally increasing the EO amplitude �9�, or viceversa, in a given receptor. Based on results from P receptors,we expect the extension of ISI anticorrelations to have sev-eral functional effects: reduce higher-order variability, in-crease sensitivity, decrease in spectral power at low frequen-cies in afferent power spectra, and increase in effective“memory” in the stochastic point processes of paddlefish ERafferents.
III. PHASE RELATIONS BETWEEN THE TWOOSCILLATORS: CIRCLE MAP MODEL
The circle map is the generic model to study quasiperiod-icity and synchronization in periodically driven or coupledself-sustained oscillators �28–30�. The circle map establishesa correspondence between the phase of an oscillator at amoment of time t= t0 and the phase at t= t0+T, where T is theperiod of an external driving force �30�: �n+1=�n+2�f0T+KF��n�, where f0 is the unperturbed frequency of the os-cillator, F��� is a 2�-periodic function, and the parameter Krefers to the coupling �driving� strength. A generalization ofthe circle map model leads to the concept of the annulus map�30�, which was recently derived and studied in Ref. �31� fora periodically driven leaky integrate-and-fire model with athreshold fatigue.
Simultaneous recording from a paddlefish ER afferent anda canal in the afferent’s corresponding receptive field al-lowed the phase relations between them to be characterized�10,32�. The phase ��t� of a canal signal s�t� was estimatedusing the concept of an analytic signal �33�. The instanta-neous phase of canal oscillations can then be calculated atthe spike times tn of the afferent, �n=��t= tn�. The next step
was to build a map �n+1=F��n� which served as an analog ofthe circle map �28,29�. As further simplification, we can con-sider the EO as a periodic signal driving the AO, such that �nrepresents the phase of the EO at the moment of nth firing ofthe afferent neuron: �n=2�fetn, where fe is the fundamentalfrequency of the epithelial oscillator and tn is the firing timeof the nth afferent spike. The corresponding circle map reads
�n+1 = 2�� + �n + KF��n� . �3�
The parameter K corresponds to the amplitude of the epithe-lial oscillations. The parameter � determines the ratio of fre-quency of the unperturbed AO �e.g., when K=0� to the fre-quency of the EO: �= fe / fa
0, where fa0 is the frequency of AO
in the absence of driving from the EO. The resulting fre-quency ratio fe / fa is given by the winding number �30�:
w =fe
fa= lim
n→�
�n − �0
2�n. �4�
We can rewrite the circle map Eq. �3� explicitly for the af-ferent spike times tn:
fetn+1 = � + fetn +K
2�F�2�fet� , �5�
where tn are spike times in seconds. In terms of the dimen-sionless variable tn= fetn, we obtain
tn+1 = � + tn +K
2�F�2�tn� , �6�
where spike times are now measured in units of the period ofthe EO, Te=1/ fe. With the first two harmonics taken intoaccount, F���=sin���+� sin�2��, the circle map has theform
tn+1 = � + tn +K
2��sin�2�tn� + � sin�4�tn�� + Dn. �7�
In Eq. �7�, we introduced Gaussian white noise n with in-tensity D to account for stochastic variability in the AO �34�.The second harmonic was introduced to avoid a degeneracyof the period-2 cycle of the ISI �n= tn− tn−1 when �=0.5. Inthe following we will use �=−0.15 for all calculations.
A continuous-time afferent spike train can be constructedfrom a sequence tn generated by Eq. �7� as a�t�=n��t− tn�,where the spike times were renormalized back to dimensionunits tn=Tetn with Te=1/26 sec for comparison with experi-mental results. The power spectrum can be calculated in thesame way as for experimental data �10�: � functions wereapproximated by a rectangular pulse centered at tn, and witha width t=5�10−5 sec, corresponding to a sampling rate of20 kHz. Power spectra were then estimated using the fastFourier transform, with averaging over overlapping windowsof length t�218=13.1 sec.
Figure 3 shows three examples of power spectra and theSCCs calculated from the circle map �7�. The structure of themodel’s power spectrum closely resembles spectra from ex-perimental spike trains �see Fig. 2�: there are two fundamen-tal peaks at fe and fa, and sidebands. However, power spectrafrom the circle map always display � peaks at the EO fun-
A. B. NEIMAN AND D. F. RUSSELL PHYSICAL REVIEW E 71, 061915 �2005�
061915-4

damental frequency �fe� and its higher harmonics, instead offinite-width peaks as in experimental power spectra. This isbecause the circle map implies a pure periodic driving, andthus does not take into account fluctuations in the EO. It isimportant to note that the structure of the SCC is determinedby the frequency ratio w: the serial correlations are mostpronounced when w is equal to 0.5, the case of 1:2 phaselocking. For w close to 0.5, the SCC shows a beating struc-ture, just as in experimental data �Fig. 2�c��.
As mentioned, a corresponding renewal process could beconstructed from an ER afferent spike train by shuffling thesequence of ISIs, which destroys all correlations betweenintervals, while preserving the ISI distribution. Thus, thisrenewal process possesses the same mean ISI and CV as theoriginal process.
To characterize in the frequency domain the impact of ISIcorrelations, we introduced the spectral ratio S�f�, calculatedby dividing the afferent power spectrum Gaa�f� by the powerspectrum of the corresponding renewal process Gaa
shuf�f�:
S�f� = Gaa�f�/Gaashuf�f� . �8�
The spectral ratio at any given frequency is equal to 1 for arenewal process. The power spectrum at zero frequency canbe related to the long-term variability and the SCC as�21,35,36�
Gaa�f = 0� =cv
2
����1 + 2j=1
�
C�j�� . �9�
From the last formula, it is easy to see that the negative ISIcorrelations �C�j��0� lead to a loss of power at low fre-
quencies, and to a decrease of long-term variability, and thusimprove the performance of a sensory neuron for low-frequency �slow� stimuli �27�. The loss of power at low fre-quencies, due to ISI correlations, can be quantified by thevalue of the spectral ratio at zero frequency:
S0 = S�f = 0� = �1 + 2j=1
�
C�j�� . �10�
Thus, the spectral ratio characterizes the long-term variabil-ity of afferent firing as compared to a renewal process havingthe same mean firing rate and CV as the original spike train.
In the absence of periodic forcing �K=0�, the circle mapreduces to a linear discrete system, tn+1=�+ tn+Dn. In thecase of white noise, this model describes a renewal processwith cv=D /�. With K�0, the measures of variability be-come functions of both K and �, as well as the noise intensityD. In the absence of noise, D=0, the circle map possessesvarious mode-locking or synchronization regions �Arnoldtongues� on the parameter plane �� ,K� where the mode-locking m :n regimes are stable. The borders of the Arnoldtongues correspond to the saddle-node bifurcation transitionsfrom m :n periodic mode-locking cycles to a quasiperiodicmotion with irrational winding numbers �28,30�. The influ-ence of noise results in a shrinking of Arnold tongues �34�.However, the diffusion of an oscillator’s phase is minimizedinside the synchronization regions �30�, and thus should leadto extended correlations.
We concentrate on the parameter region corresponding toa frequency ratio w near 0.5, as observed for paddlefish ERs.First, in Fig. 4, we show the dependence of the CV, the
FIG. 3. Power spectra �leftcolumn� and corresponding SCCs�right column� for spike trainsgenerated by the circle map model�7� with parameters chosen tomimic experimental results as inFig. 2. Values of the epithelial-to-afferent frequency ratio w arelisted. The parameters were �a� �=0.429, K=0.4, D=0.04; �b� �=0.5, K=0.4, D=0.04; �c� �=0.471, K=0.4, D=0.04. Thespike times were renormalizedback to the dimension units tn
=Tetn.
MODELS OF STOCHASTIC BIPERIODIC… PHYSICAL REVIEW E 71, 061915 �2005�
061915-5

correlation time, and the spectral ratio S0 on the amplitude ofthe EO �parameter K� for various values of parameter �=0.5, and with fixed noise intensity. As in experimental data�9�, the EO enhances variability of ISIs, expressed in termsof the CV: the CV increases with increasing K �Fig. 4�a��. Onthe other hand, the EO reduces higher-order variability, sincethe ISI correlation time increases monotonically with K, andthe spectral ratio S0 decreases as the EO amplitude grows:both indicate that ISI correlations contribute to a loss ofpower at low frequencies.
Next, we vary the parameter �, keeping constant the EOand noise amplitudes. Both the correlation time �Fig. 4�e��and the spectral ratio �Fig. 4�f�� undergo sharp extrema when� and the frequency ratio w pass through 0.5, which corre-sponds to the center of the 1:2 synchronization region �twoafferent spikes per one cycle of epithelial oscillations�.
These results from circle map models predict that corre-lation measures of ER afferent spike trains may undergodrastic changes when passing through synchronization re-gions, with extreme ISI correlation corresponding to a maxi-mal loss of low-frequency power, occurring at w=0.5. Varia-tion in w could be evoked by slow �in comparison with theperiods of EO and AO� external stimuli, which could beintroduced in the circle map model as variation of the param-eter �.
IV. PHASE MODEL
A minimal model describing so-called type-I spiking andexcitability is given by a canonical model �also known as thetheta neuron model� �16,37,38�, in which the neuron is de-scribed by a single phase variable :
= �1 − cos � + �1 + cos �r , �11�
where r is the bifurcation parameter. For negative values ofr, the model is excitable: it possesses two equilibria, ±
= ±cos−1��1+r� / �1−r��, which are unstable and stable, re-spectively �see �39� for complete mathematical study�. Theequilibria ± merge at r=0, and for r�0 the model repre-sents periodic spiking with the frequency f0=�r /�. A spikeis generated every time �t� crosses the value of �. Theinfluence of white noise on the model was studied numeri-cally in �40�, and analytically in �41�.
In our case of epithelia-afferent electroreceptors, the ca-nonical model is used to mimic spontaneous firing of anafferent neuron, modulated by epithelial oscillations. To sim-plify consideration, we model the EO by a single stochasticself-sustained oscillator, and assume that it is described byonly its phase ��t�:
� = 2� f e + �2Q�t� , �12�
where f e is the �dimensionless� frequency of the EO, and �t�is zero-mean white Gaussian noise, with intensity Q, intro-duced to account for phase fluctuations. The EO signal isthen described as e�t�=cos���t��, with the autocorrelation
function �e�t�e�t���=exp�−t− t�Q�cos�2� f e�t− t���, and witha Lorentzian peak in its power spectrum, of width Q. Further
on, we assume f e=1/2�. Indeed, alternate models for the EOare possible. For instance, a Gaussian narrowband noise �har-monic noise� �22� produces similar results. We introduce an-other Gaussian colored noise term ��t� into Eq. �11� to ac-count for the variability of the afferent firing in the absenceof epithelial oscillations. Thus, our phase model is describedby the following dimensionless equations:
= �1 − cos � + �1 + cos ��r + A cos � + �D��t�� ,
FIG. 4. Numerical simulationsof the circle map �7�. The depen-dence of CV �a�, ISI correlationtime �b�, and the spectral ratio atzero frequency �c�, versus the am-plitude of the EO, K, at fixed �=0.5. �d�–�f� Dependence on theparameter � for the fixed values ofK=0.3. �d� The frequency ratio wversus �. The solid line shows thedeterministic case. Arrows pointto the synchronization region,which is a flat segment when thefrequency ratio equals 0.5. Dashedline corresponds to D=0.04. �e�ISI correlation time versus �. �f�Spectral ratio at zero frequencyversus �. Noise intensity D=0.04.
A. B. NEIMAN AND D. F. RUSSELL PHYSICAL REVIEW E 71, 061915 �2005�
061915-6
� = 1 + �2Q�t� . �13�
In the model Eq. �13�, the parameter A is the amplitude ofthe EO, and D is the intensity of Ornstein-Uhlenbeck Gauss-ian noise ��t� with autocorrelation function ���t���t+ t���=� exp�−�t− t�� where 1/��1 is the noise correlationtime. The noise sources ��t� and �t� are statistically inde-pendent: ��t���t���=0. We set �=100 for all further numeri-cal simulations. Since Eqs. �13� are dimensionless, in orderto compare simulations with experimental results we renor-malized the numerically obtained dimensionless spike timesequences tk ,k=1, . . . ,N, to spike times in seconds astk /2�fe, with fe=26 Hz. Numerical simulations of Eqs. �13�were conducted using the Euler scheme with the time stept=10−3, and the duration of simulation for each parametervalue was equivalent to 10 min of experimental recording.
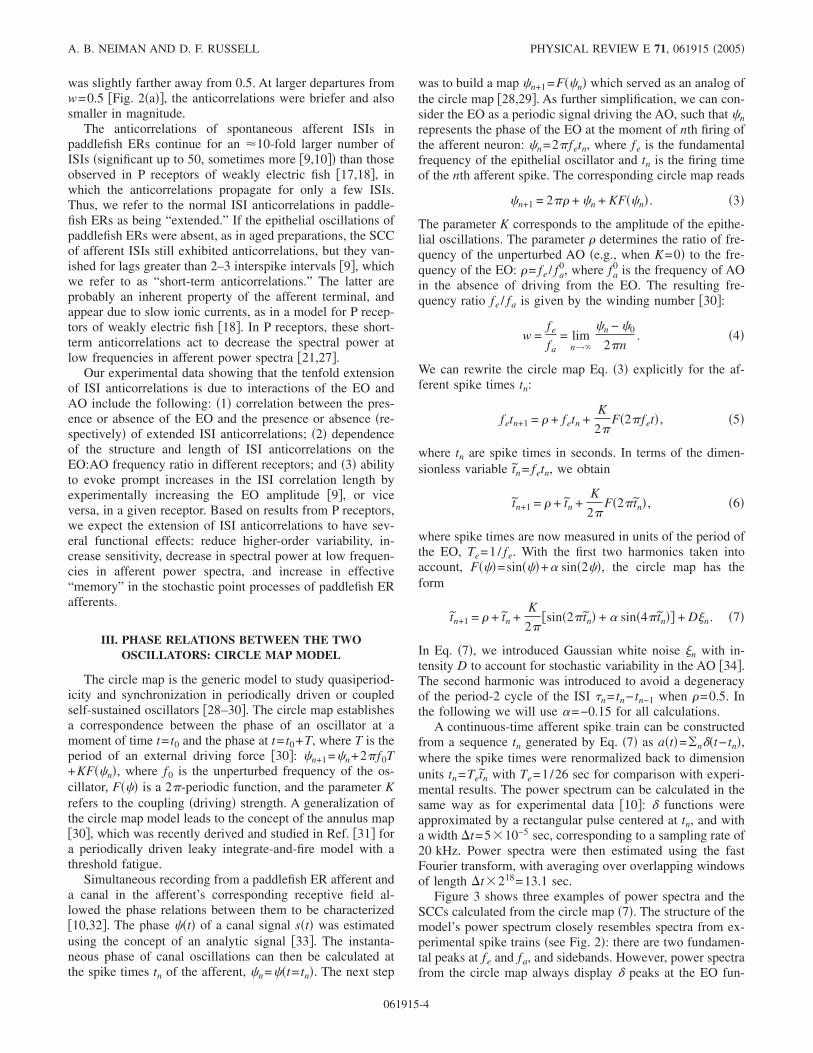
Numerical calculations of the power spectra, the SCCs,and the spectral ratios are shown in Fig. 5. In contrast to thecircle map, the phase model Eqs. �13� takes into accountfluctuations in the EO, which are reflected in a finite width ofthe EO power spectral line. The power spectrum had thesame characteristic peaks as observed in experiments, andthe SCCs showed experimentlike extended correlations.
The impact of serial correlations can be seen in Figs.6�a�–6�c�, where the spectral ratio was always less than 1 inthe low-frequency domain. The SCC correlation time and thespectral ratio showed qualitatively the same behavior as forthe circle map: at 1:2 mode locking, serial correlationsshowed maximal correlation time, while the spectral ratio
attained its minimal value, indicating subtraction of power atlow frequencies.
A closer look at the experimental power spectra �Fig. 2�and the spectral ratio �Fig. 6�d�� revealed differences fromnumerical simulations in the low-frequency domain: the ex-perimental power decreased toward zero frequency, whereasin numerical simulation �Fig. 5� the power spectrum satu-rated in the low-frequency domain.
As discussed above, the experimental data still showedshort-term negative serial correlations and correspondinglow-frequency shaping of the power spectra �21� when theEO was absent �or of low amplitude�. Such short-term nega-tive correlations can be introduced into the canonical modelby the addition of a slow adaptation variable u�t�:
= �1 − cos � + �1 + cos ��r + A cos � + �D��t� − u� ,
� = 1 + �2Q�t� ,
u = − �u + s�� − �� , �14�
where ��1 and s�0. Whenever a spike occurs, i.e., crosses �, the slow variable u undergoes a steplike increase,and then relaxes back to u=0. The negative character of thefeedback delays the next firing, and thus results in adaptationto external stimuli �16,42�. For the leaky integrate-and-firemodel, it was shown recently that such adaptation results inanticorrelations of ISIs �21�. The influence of short-term ISIanticorrelations on the power spectrum of a spike train istwofold �27�. First, anticorrelations lead to loss of low-frequency power, as was mentioned before. Second, anticor-
FIG. 5. Power spectra �leftcolumn� and corresponding SCCs�right column� for the numericallysimulated phase model �13� withparameters chosen to produce thesame frequency ratios w and theSCCs as in Figs. 2 and 3. Valuesof the epithelial-to-afferent fre-quency ratio w are listed. The pa-rameters were �a� r=1.365, A=0.35, D=0.05, Q=0.015; �b� r=1.015, A=0.3, D=0.02, Q=0.015; �c� r=1.155, A=0.4, D=0.04, Q=0.015. The interspikeintervals were renormalized to theperiod of the epithelial oscillator�see text� to obtain similar timescales as in experimentalrecordings.
MODELS OF STOCHASTIC BIPERIODIC… PHYSICAL REVIEW E 71, 061915 �2005�
061915-7
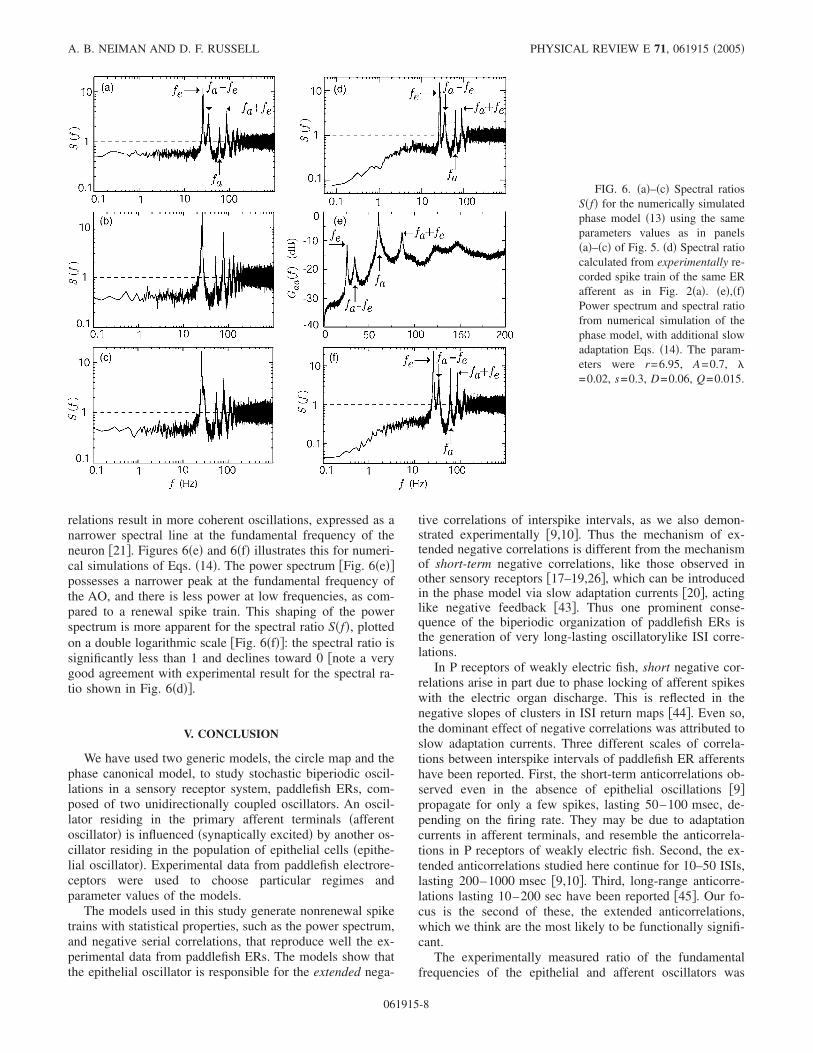
relations result in more coherent oscillations, expressed as anarrower spectral line at the fundamental frequency of theneuron �21�. Figures 6�e� and 6�f� illustrates this for numeri-cal simulations of Eqs. �14�. The power spectrum �Fig. 6�e��possesses a narrower peak at the fundamental frequency ofthe AO, and there is less power at low frequencies, as com-pared to a renewal spike train. This shaping of the powerspectrum is more apparent for the spectral ratio S�f�, plottedon a double logarithmic scale �Fig. 6�f��: the spectral ratio issignificantly less than 1 and declines toward 0 �note a verygood agreement with experimental result for the spectral ra-tio shown in Fig. 6�d��.
V. CONCLUSION
We have used two generic models, the circle map and thephase canonical model, to study stochastic biperiodic oscil-lations in a sensory receptor system, paddlefish ERs, com-posed of two unidirectionally coupled oscillators. An oscil-lator residing in the primary afferent terminals �afferentoscillator� is influenced �synaptically excited� by another os-cillator residing in the population of epithelial cells �epithe-lial oscillator�. Experimental data from paddlefish electrore-ceptors were used to choose particular regimes andparameter values of the models.
The models used in this study generate nonrenewal spiketrains with statistical properties, such as the power spectrum,and negative serial correlations, that reproduce well the ex-perimental data from paddlefish ERs. The models show thatthe epithelial oscillator is responsible for the extended nega-
tive correlations of interspike intervals, as we also demon-strated experimentally �9,10�. Thus the mechanism of ex-tended negative correlations is different from the mechanismof short-term negative correlations, like those observed inother sensory receptors �17–19,26�, which can be introducedin the phase model via slow adaptation currents �20�, actinglike negative feedback �43�. Thus one prominent conse-quence of the biperiodic organization of paddlefish ERs isthe generation of very long-lasting oscillatorylike ISI corre-lations.
In P receptors of weakly electric fish, short negative cor-relations arise in part due to phase locking of afferent spikeswith the electric organ discharge. This is reflected in thenegative slopes of clusters in ISI return maps �44�. Even so,the dominant effect of negative correlations was attributed toslow adaptation currents. Three different scales of correla-tions between interspike intervals of paddlefish ER afferentshave been reported. First, the short-term anticorrelations ob-served even in the absence of epithelial oscillations �9�propagate for only a few spikes, lasting 50–100 msec, de-pending on the firing rate. They may be due to adaptationcurrents in afferent terminals, and resemble the anticorrela-tions in P receptors of weakly electric fish. Second, the ex-tended anticorrelations studied here continue for 10–50 ISIs,lasting 200–1000 msec �9,10�. Third, long-range anticorre-lations lasting 10–200 sec have been reported �45�. Our fo-cus is the second of these, the extended anticorrelations,which we think are the most likely to be functionally signifi-cant.
The experimentally measured ratio of the fundamentalfrequencies of the epithelial and afferent oscillators was
FIG. 6. �a�–�c� Spectral ratiosS�f� for the numerically simulatedphase model �13� using the sameparameters values as in panels�a�–�c� of Fig. 5. �d� Spectral ratiocalculated from experimentally re-corded spike train of the same ERafferent as in Fig. 2�a�. �e�,�f�Power spectrum and spectral ratiofrom numerical simulation of thephase model, with additional slowadaptation Eqs. �14�. The param-eters were r=6.95, A=0.7, �=0.02, s=0.3, D=0.06, Q=0.015.
A. B. NEIMAN AND D. F. RUSSELL PHYSICAL REVIEW E 71, 061915 �2005�
061915-8

0.49±0.08 for 67 different paddlefish ERs �10�. Thereforethe two oscillators embedded into an ER system operate nearthe strong 1:2 mode-locking regime. Our models predict thatthe statistical properties of the spike trains depend cruciallyon the frequency ratio of the two oscillators: the correlationtime of the SCC is maximal when the ratio of the fundamen-tal frequencies of two oscillators attains the rational numberof 0.5. The increase of the correlation time corresponds to adecrease of ISI variability at low frequencies, seen as re-duced spectral power in the low-frequency domain. We notethat the frequency response of paddlefish ERs is maximal inthe low-frequency range of 1 to 10 Hz �10�, and thus a sup-pression of variability at low frequencies may enhance sen-sitivity of these ERs in an appropriate frequency range.
We can assume that spontaneous background activity ofelectroreceptors is used by the animal, in some unknownmanner, as a reference to compare with a stimulus-alteredspike train. While the frequency of the epithelial oscillator isinvariant to weak external stimulation, the frequency of theafferent oscillator is easily changed by weak stimuli. Forexample, recalling that paddlefish use electrosense to locatezooplankton prey such as Daphnia, an approaching Daphnia
passing along the rostrum with a constant speed generates atime-varying voltage gradient near an individual ER thatgenerally has a bipolar wave form �46� and thus results inslow biphasic changes of firing rate of the ER afferent. Thisslow variation of afferent firing rate can be expected to leadto time-varying changes in the frequency ratio w, resulting insignificant time-varying changes in the correlation statisticsof the afferent spike train during the stimulus. After thestimulus has ceased �e.g., the Daphnia has passed out ofrange�, the frequency ratio and ISI statistics return to theprestimulus state. We hypothesize that such prominentstimulus-induced changes in ISI statistics, resulting from thebiperiodic organization of paddlefish ERs, convey informa-tion about a stimulus to the animal’s brain for further pro-cessing.
ACKNOWLEDGEMENTS
We thank M. Chacron and B. Lindner for comments andvaluable discussions. This work was supported by NationalInstitutes of Health Grant No. DC04922.
�1� A. C. Crawford and R. Fettiplace, J. Physiol. �London� 364,359 �1985�.
�2� A. Rüsch and U. Thurm, Hear. Res. 48, 247 �1990�.�3� P. Martin, A. J. Hudspeth, and F. Jülicher, Proc. Natl. Acad.
Sci. U.S.A. 98, 14380 �2001�.�4� M. Ospeck, V. M. Eguiluz, and M. O. Magnasco, Biophys. J.
80, 2597 �2001�.�5� S. Camelet, T. Duke, F. Jülicher, and J. Prost, Proc. Natl. Acad.
Sci. U.S.A. 97, 3183 �2000�.�6� H. Bade, H. A. Braun, and H. Hensel, Pfluegers Arch. 382, 1
�1979�.�7� H. A. Braun, H. Wissing, K. Schäfer, and M. C. Hirsch, Nature
�London� 367, 270 �1979�.�8� H. A. Braun, M. T. Huber, M. Dewald, K. Schäfer, and K.
Voigt, Int. J. Bifurcation Chaos Appl. Sci. Eng. 8, 881 �1998�.�9� A. B. Neiman and D. F. Russell, Phys. Rev. Lett. 86, 3443
�2001�.�10� A. B. Neiman and D. F. Russell, J. Neurophysiol. 92, 492
�2004�.�11� A. Neiman, X. Pei, D. Russell, W. Wojtenek, L. Wilkens, F.
Moss, H. Braun, M. Huber, and K. Voigt, Phys. Rev. Lett. 82,660 �1999�.
�12� D. F. Russell, L. A. Wilkens, and F. Moss, Nature �London�402, 291 �1999�.
�13� A. B. Neiman and D. F. Russell, Phys. Rev. Lett. 88, 138103�2002�.
�14� L. A. Wilkens, D. F. Russell, X. Pei, and C. Gurgens, Proc. R.Soc. London, Ser. B 264, 1723 �1997�.
�15� J. M. Jørgensen, A. Flock, and J. Wersäll, Z. Zellforsch Mik-rosk Anat. 130, 362 �1972�.
�16� E. M. Izhikevich, Int. J. Bifurcation Chaos Appl. Sci. Eng. 6,1171 �2000�.
�17� R. Ratnam and M. Nelson, J. Neurosci. 20, 6672 �2000�.
�18� M. J. Chacron, A. Longtin, and L. Maler, J. Neurosci. 21,5328 �2001�.
�19� J. B. M. Goense and R. Ratnam, J. Comp. Physiol., A 189,741 �2003�.
�20� X.-J. Wang, J. Neurophysiol. 79, 1549 �1998�.�21� B. Lindner and A. Longtin, Proc. SPIE 5114, 209 �2003�.�22� L. Schimansky-Geier and C. Zülicke, Z. Phys. B: Condens.
Matter 79, 451 �1990�.�23� J. Rinzel and G. B. Ermentrout, Analysis of Neural Excitability
and Oscillations �MIT Press, Cambridge, MA, 1998�, pp. 313–360.
�24� R. L. Stratonovich, Topics in the Theory of Random Noise�Gordon and Breach, 1981�.
�25� K. Schäfer, H. A. Braun, R. C. Peters, and F. Bretschnider,Pfluegers Arch. 429, 378 �1995�.
�26� M. C. Teich and S. B. Lowen, IEEE Eng. Med. Biol. Mag. 13,197 �1994�.
�27� M. J. Chacron, B. Lindner, and A. Longtin, Phys. Rev. Lett.92, 080601 �2004�.
�28� S. H. Strogatz, Nonlinear Dynamics and Chaos �Addison-Wesley, Reading, MA, 1995�.
�29� L. Glass and M. C. Mackey, From Clocks to Chaos: TheRythms of Life �Princeton University Press, Princeton, NJ,1988�.
�30� A. S. Pikovsky, M. G. Rosenblum, and J. Kurths, Synchroni-zation: A Universal Concept in Nonlinear Sciences �Cam-bridge University Press, Cambridge, U.K., 2001�.
�31� M. J. Chacron, K. Pakdaman, and A. Longtin, Neural Comput.15, 253 �2003�.
�32� M. Zeller, M. Bauer, and W. Martienssen, Chaos, SolitonsFractals 5, 885 �1995�.
�33� J. S. Bendat and A. G. Piersol, Random Data: Analysis andMeasurement Procedures �J. Wiley and Sons, New York,
MODELS OF STOCHASTIC BIPERIODIC… PHYSICAL REVIEW E 71, 061915 �2005�
061915-9
2000�.�34� A. B. Neiman, U. Feudel, and J. Kurths, J. Phys. A 28, 2471
�1995�.�35� D. R. Cox and P. A. Lewis, The Statistical Analysis of Series of
Events �Methuren, London, 1966�.�36� J. W. Middleton, M. J. Chacron, B. Lindner, and A. Longtin,
Phys. Rev. E 68, 021920 �2003�.�37� G. B. Ermentrout and N. Kopell, SIAM J. Appl. Math. 46, 233
�1986�.�38� G. B. Ermentrout, Neural Comput. 8, 979 �1996�.�39� F. C. Hoppensteadt and E. M. Izhikevich, Weakly Connected
Neural Networks �Springer, Berlin, 1997�.�40� B. S. Gutkin and G. B. Ermentrout, Neural Comput. 10, 1047
�1998�.�41� B. Lindner, A. Longtin, and A. Bulsara, Neural Comput. 15,
1761 �2003�.�42� G. B. Ermentrout, Neural Comput. 10, 1721 �1998�.�43� J. H. Shin, Neurocomputing 44, 167 �2002�.�44� M. J. Chacron, A. Longtin, M. St-Hilaire, and L. Maler, Phys.
Rev. Lett. 85, 1576 �2000�.�45� S. Bahar, J. W. Kantelhardt, A. B. Neiman, H. Rego, D. F.
Russell, L. A. Wilkens, A. Bunde, and F. Moss, Europhys.Lett. 56, 454 �2001�.
�46� W. Wojtenek, M. H. Hofmann, and L. A. Wilkens, Neurocom-puting 38–40, 451 �2001�.
A. B. NEIMAN AND D. F. RUSSELL PHYSICAL REVIEW E 71, 061915 �2005�
061915-10