Embed Size (px)
Citation preview
Methodology
!"#$%&'()#*+&#,(-#+*&-()%$.$(+/, %&$(%01+2&(3/ ,%#&+)'(%/&#)4#/&%3/(+/,(*%5#($&'*#(03,%5%2+&%3/ 63
!!""##$$%%&&%%''%%(())
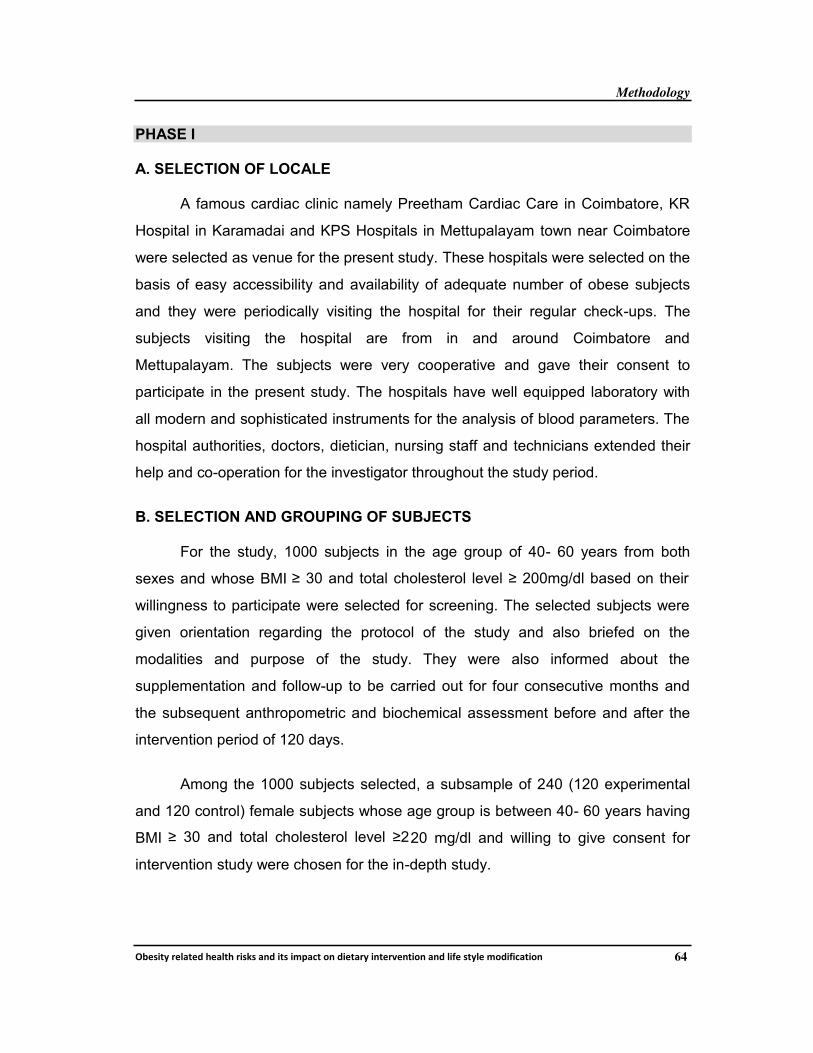
The research design pertaining to the study “OBESITY RELATED HEALTH
RISKS AND ITS IMPACT ON DIETARY INTERVENTION AND LIFE STYLE
MODIFICATION” is presented under the following headings.
Phase I
A. Selection of locale
B. Selection and grouping of subjects
C. Formulation of the tool for the conduct of the study
Phase II
A. Demographic profile of the selected subjects
B. Nutritional status of the selected subjects
a. Anthropometric measurements
b. Recording individual food and nutrient intake
c. Analysis of biochemical parameters
Phase III
A. Selection of the ingredients for the supplement
B. Formulation and organoleptic evaluation of the selected supplement
a. Formulation of the supplement
b. Organoleptic evaluation of the selected recipes
C. Analysis of the supplement
Phase IV
A. Orientation to the selected subjects on dietary intervention
B. Dietary intervention for the selected female subjects
C. Lifestyle modification for the selected female subjects
D. Evaluation of the effect of intervention among the selected female
subjects
E. Consolidation and analysis of data
6
Methodology
!"#$%&'()#*+&#,(-#+*&-()%$.$(+/, %&$(%01+2&(3/ ,%#&+)'(%/&#)4#/&%3/(+/,(*%5#($&'*#(03,%5%2+&%3/ 64
PHASE I
A. SELECTION OF LOCALE
A famous cardiac clinic namely Preetham Cardiac Care in Coimbatore, KR
Hospital in Karamadai and KPS Hospitals in Mettupalayam town near Coimbatore
were selected as venue for the present study. These hospitals were selected on the
basis of easy accessibility and availability of adequate number of obese subjects
and they were periodically visiting the hospital for their regular check-ups. The
subjects visiting the hospital are from in and around Coimbatore and
Mettupalayam. The subjects were very cooperative and gave their consent to
participate in the present study. The hospitals have well equipped laboratory with
all modern and sophisticated instruments for the analysis of blood parameters. The
hospital authorities, doctors, dietician, nursing staff and technicians extended their
help and co-operation for the investigator throughout the study period.
B. SELECTION AND GROUPING OF SUBJECTS
For the study, 1000 subjects in the age group of 40- 60 years from both
sexes and whose BMI ≥ 30 and total cholesterol level ≥ 200mg/dl based on their
willingness to participate were selected for screening. The selected subjects were
given orientation regarding the protocol of the study and also briefed on the
modalities and purpose of the study. They were also informed about the
supplementation and follow-up to be carried out for four consecutive months and
the subsequent anthropometric and biochemical assessment before and after the
intervention period of 120 days.
Among the 1000 subjects selected, a subsample of 240 (120 experimental
and 120 control) female subjects whose age group is between 40- 60 years having
BMI ≥ 30 and total cholesterol level ≥220 mg/dl and willing to give consent for
intervention study were chosen for the in-depth study.
!"#!$%&!'()*+,!-%.'
#/)-! %
Selection of locale
Selection and grouping
of the subjects for
in-depth study
(N-30 per group)
Group OB
Group OBD
Group OBHL
Group OBY
Corresponding control
Assessment ofNutritional Status
Anthropometricmeasurements
&
Biochemical Profile
[[
Formulation andorganolepticevaluation
Analysis of thesupplements
! Dietary fiber
! Active constituents
! Anti-nutritional
factors
Dietary intervention -
Supplementing with
high fiber breakfast
mix for a period of
120 days.
Impact of intervention
Biochemical
profileIndividual food &
nutrient intake
#/)-! %% #/)-! %%% #/)-! %0
Elicit background
information (N-1000)
Selection of ingredients
for dietary intervention
Health and nutrition
Education
Life Style
Modification –
Exercise
theraphy and
Yoga
Anthropometric
measurements
Intervention (N-240)
65
Methodology
!"#$%&'()#*+&#,(-#+*&-()%$.$(+/, %&$(%01+2&(3/ ,%#&+)'(%/&#)4#/&%3/(+/,(*%5#($&'*#(03,%5%2+&%3/ 66
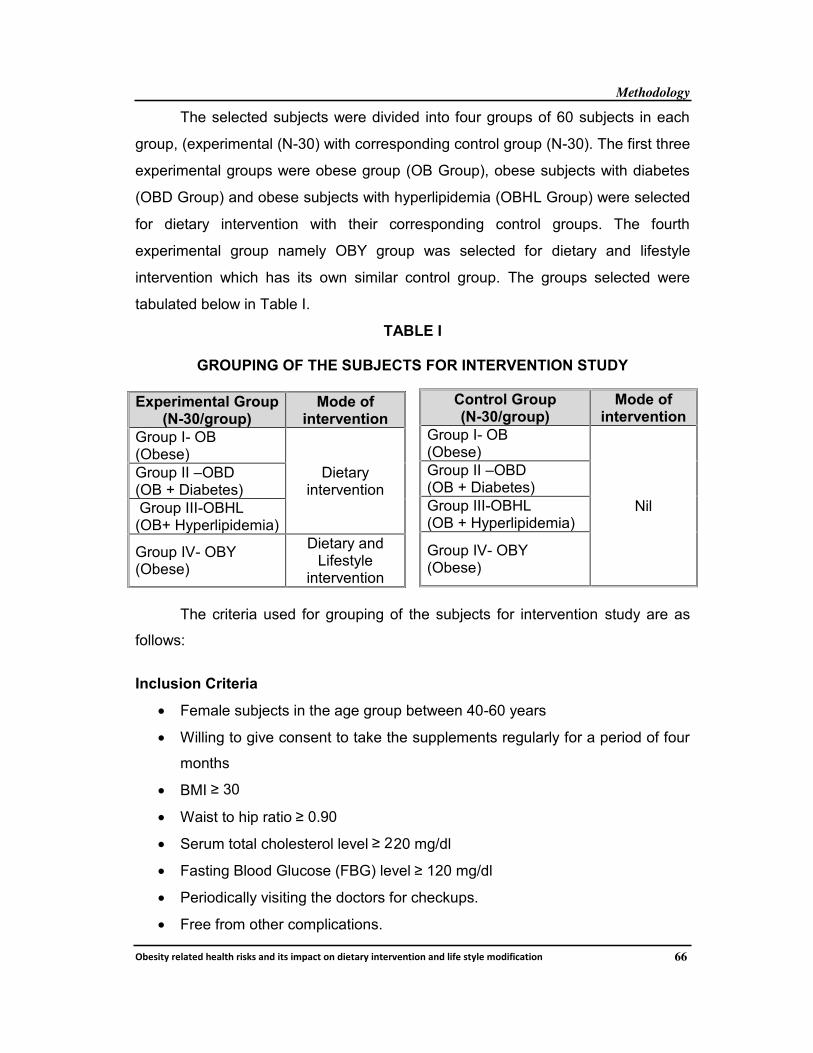
The selected subjects were divided into four groups of 60 subjects in each
group, (experimental (N-30) with corresponding control group (N-30). The first three
experimental groups were obese group (OB Group), obese subjects with diabetes
(OBD Group) and obese subjects with hyperlipidemia (OBHL Group) were selected
for dietary intervention with their corresponding control groups. The fourth
experimental group namely OBY group was selected for dietary and lifestyle
intervention which has its own similar control group. The groups selected were
tabulated below in Table I.
TABLE I
GROUPING OF THE SUBJECTS FOR INTERVENTION STUDY
Experimental Group(N-30/group)
Mode ofintervention
Group I- OB(Obese)
Dietaryintervention
Group II –OBD(OB + Diabetes)
Group III-OBHL(OB+ Hyperlipidemia)
Group IV- OBY(Obese)
Dietary andLifestyle
intervention
The criteria used for grouping of the subjects for intervention study are as
follows:
Inclusion Criteria
• Female subjects in the age group between 40-60 years
• Willing to give consent to take the supplements regularly for a period of four
months
• BMI ≥ 30
• Waist to hip ratio ≥ 0.90
• Serum total cholesterol level ≥ 220 mg/dl
• Fasting Blood Glucose (FBG) level ≥ 120 mg/dl
• Periodically visiting the doctors for checkups.
• Free from other complications.
Control Group(N-30/group)
Mode ofintervention
Group I- OB(Obese)
Nil
Group II –OBD(OB + Diabetes)
Group III-OBHL(OB + Hyperlipidemia)
Group IV- OBY(Obese)
Methodology
!"#$%&'()#*+&#,(-#+*&-()%$.$(+/, %&$(%01+2&(3/ ,%#&+)'(%/&#)4#/&%3/(+/,(*%5#($&'*#(03,%5%2+&%3/ 67
Exclusion Criteria
• Age group < 40 and more than 60 years
• Waist to hip ratio < 0.90 and more than1.4
• Serum total cholesterol level< 200 mg/dl
• Fasting Blood Glucose (FBG) level <120 mg/dl
• Presence of complications and disorders
• Taking too many medicines
• Having cholesterol levels > 320mg/dl
• Inpatients and out patients who are in need of immediate medical care.
• Irregular check-ups.
• Not willing to give consent to participate in the present study.
C. FORMULATION OF THE TOOL FOR THE CONDUCT OF THE STUDY
According to Kothari (2011) interview method of collecting data involves
presentation of oral –verbal stimuli and reply in terms of oral- verbal responses.
Personal interview is a survey method of data collection which employs a
questionnaire. The components of the personal interview are the researcher, the
interviewer, interviewee and the interview environment (Pannerselvam, 2006). A
well-structured interview schedule was formulated to elicit background information
about the selected subjects.
PHASE II
A. DEMOGRAPHIC PROFILE OF THE SELECTED SUBJECTS
The demographic profile, lifestyle pattern, dietary pattern and also personal
and family history were recorded for all the 1000 subjects using an interview
schedule.
The background information such as name of the subject, age, sex,
educational qualification, occupation, activity pattern, income level, type and
composition of the family was collected. The information on food habits and dietary
practices were recorded. A 24- hour recall method was used to record the dietary
intake of the subjects.
Methodology
!"#$%&'()#*+&#,(-#+*&-()%$.$(+/, %&$(%01+2&(3/ ,%#&+)'(%/&#)4#/&%3/(+/,(*%5#($&'*#(03,%5%2+&%3/ 68
The lifestyle pattern such as exercise pattern, smoking habits, alcoholic
habits, consumption of tea, coffee, health drinks, tobacco, and pan masala were
collected using the interview schedule. The details of family history, frequency of
diseases, symptoms and complications experienced were also recorded.
B. NUTRITIONAL STATUS OF THE SELECTED SUBJECTS
a. Anthropometric measurements
Anthropometry is the universally applicable, inexpensive and non-invasive
method available to assess the composition of fat distribution in the human body.
Combined with the dietary, questionnaire data, and the biochemical determinations,
anthropometry is essential to assist in describing the data collected from persons. It
reflects both health and nutritional status and predicts performance, health and
survival (Ray et al., 2011). Hence, it is used in various intervention programmes to
monitor health and nutrition status of the selected population. Among the various
anthropometric measurements, height, weight, body mass index and waist to hip
ratio were recorded for all the 1000 subjects to obtain reliable data.
i. Measurement of Height
The measurement of height is a standard component of most fitness
assessments. Subjects were asked to stand erect on a flat surface with heels
together and upper limbs hanging closely to the sides of the body. The investigator
stood on the left side of the subject. The anthropmeter rod (after assembling the
four pieces and the sliding head piece properly), held in the right hand, should be
placed at the back of the subject, touching heels, buttocks and back of the head.
The chin of the subject should be held by the left hand and the occipital
protuberance is supported by the little finger of the right hand, while holding the rod
with thumb and index finger. The head should be positioned such that the
imaginary line drawn from tragus of the ear to the infra-orbital margin i.e. lower
border of the socket of the eye (Frankfurt horizontal plane) is parallel to ground.
By holding the head in this position, a gentle upward pull is applied (taking
care that the subject does not lift his/her heels) to straighten any curvature in the
spinal cord. Then the sliding head piece of the rod was brought down so as to
Methodology
!"#$%&'()#*+&#,(-#+*&-()%$.$(+/, %&$(%01+2&(3/ ,%#&+)'(%/&#)4#/&%3/(+/,(*%5#($&'*#(03,%5%2+&%3/ 69
touch the crown firmly pressing the hair, taking care that the blade is in the sagital
plane (mid-line of the body). At this juncture, the height was read from the window
of the headpiece. This process was repeated thrice and the consistent reading was
obtained. Height was recorded in cms, up to the nearest mm (ICMR, 2011).
ii. Measurement of weight
Body weight is the most widely used simplest reproducible anthropometric
measurement for the evaluation of nutritional status of the population. It is a more
sensitive measure of nutritional adequacy than height and reflects recent nutritional
status. Weight also provides a crude evaluation of overall fat and muscle stores.
For reliability, weight was recorded in the morning (12 hours since eating).
Body weight can be affected by fluid in the bladder (weigh after voiding the
bladder). Other factors to consider are the amount of food recently eaten, hydration
level, the amount of waste recently expelled from the body, recent exercise and
clothing.
To record the actual body weight, the subjects were made to stand on the
platform of the digital electronic weighing balance without footwear with minimal
clothing, ensure that he/she does not hold any other person for support (Ray et al.,
2011). Weight was recorded in kg to the nearest 100g for the selected 1000 obese
subjects.
iii. Body Mass Index (BMI)
Several indexes and ratios can be derived from anthropometric
measurements. Perhaps the most well-known indicator of body fatness is the Body
Mass Index or “BMI. According to WHO, BMI is s simple index of weight and height
that is commonly used to classify underweight, over weight and obesity in adults.
The BMI was calculated to find out the grade of obesity of the selected subjects.
The body mass index (Quetelet index) was calculated by dividing the individual’s
weight in kilogram by the square of his or her height in meters.
After the computation of BMI, subjects were classified according to the
norms given by the ICMR (2011) as mentioned below in Table II.
Methodology
!"#$%&'()#*+&#,(-#+*&-()%$.$(+/, %&$(%01+2&(3/ ,%#&+)'(%/&#)4#/&%3/(+/,(*%5#($&'*#(03,%5%2+&%3/ 70
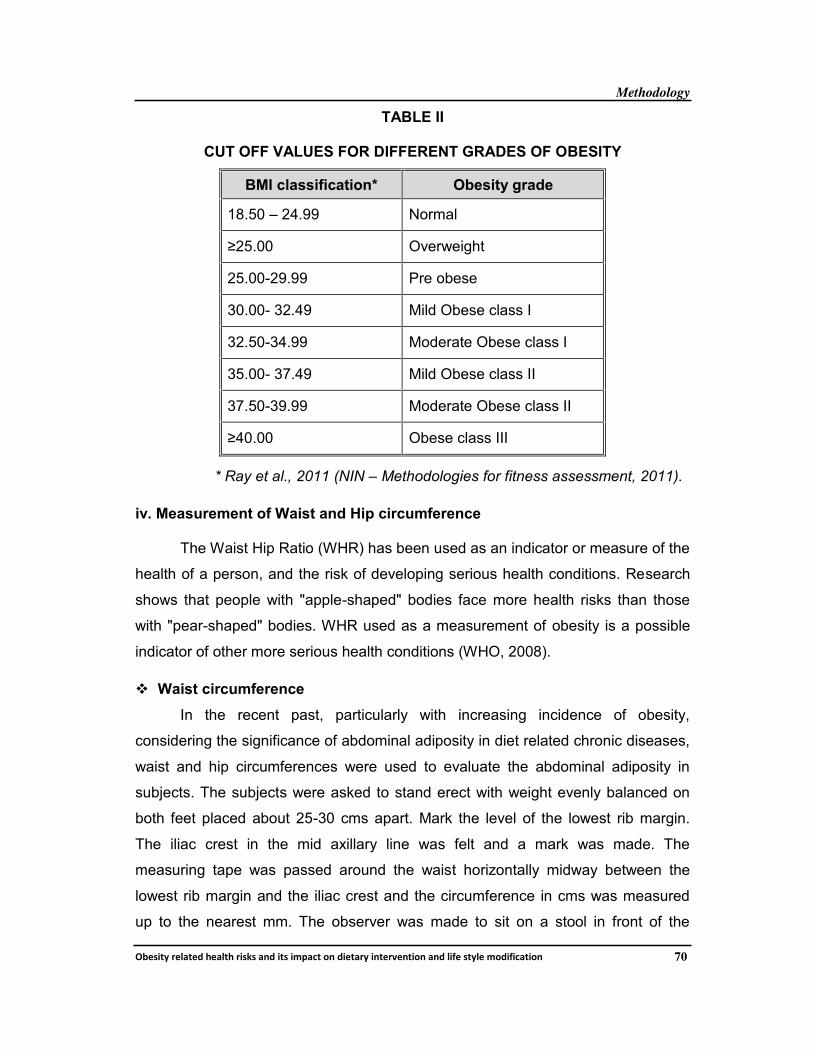
TABLE II
CUT OFF VALUES FOR DIFFERENT GRADES OF OBESITY
BMI classification* Obesity grade
18.50 – 24.99 Normal
≥25.00 Overweight
25.00-29.99 Pre obese
30.00- 32.49 Mild Obese class I
32.50-34.99 Moderate Obese class I
35.00- 37.49 Mild Obese class II
37.50-39.99 Moderate Obese class II
≥40.00 Obese class III
* Ray et al., 2011 (NIN – Methodologies for fitness assessment, 2011).
iv. Measurement of Waist and Hip circumference
The Waist Hip Ratio (WHR) has been used as an indicator or measure of the
health of a person, and the risk of developing serious health conditions. Research
shows that people with "apple-shaped" bodies face more health risks than those
with "pear-shaped" bodies. WHR used as a measurement of obesity is a possible
indicator of other more serious health conditions (WHO, 2008).
! Waist circumference
In the recent past, particularly with increasing incidence of obesity,
considering the significance of abdominal adiposity in diet related chronic diseases,
waist and hip circumferences were used to evaluate the abdominal adiposity in
subjects. The subjects were asked to stand erect with weight evenly balanced on
both feet placed about 25-30 cms apart. Mark the level of the lowest rib margin.
The iliac crest in the mid axillary line was felt and a mark was made. The
measuring tape was passed around the waist horizontally midway between the
lowest rib margin and the iliac crest and the circumference in cms was measured
up to the nearest mm. The observer was made to sit on a stool in front of the
Methodology
!"#$%&'()#*+&#,(-#+*&-()%$.$(+/, %&$(%01+2&(3/ ,%#&+)'(%/&#)4#/&%3/(+/,(*%5#($&'*#(03,%5%2+&%3/ 71
subject while taking the measurement. All the adult males with waist circumference
of ≥ 102cm and women with ≥ 80cm were identified as the abdominal obese
(ICMR, 2011).
! Hip circumference
For measuring the hip circumference, a tape was placed horizontally over
the buttocks and the circumference was measured at the point yielding the
maximum circumference in cms up to the nearest mm. The waist circumference
should be taken at the narrowest circumference between the ribs and hips
(Mrkedal, 2011).
All the adult men with the waist to hip ratio of ≥ 0.90 and women with ≥ 0.85
will be identified as obese. For all the selected 1000 subjects WHR was computed
by dividing subject’s waist circumference in cms by hip circumference in cms and
compared with the standard values.
b. Recording individual food and nutrient intake
Dietary survey constitutes an essential part of any complete study of
nutritional status providing essential information on nutrient intake, sources of
nutrients, food habits and attitudes. The aim of any dietary survey is to find out the
habitual nutrient intakes of individuals.
The 24-hour recall method has been widely used in population studies. It
was used to find out the quantity of foods consumed by the selected subjects.
Subjects are asked to recall all food and drink consumed over a specified period,
usually 24 hours. Questions are asked about each eating occasion, starting with
early morning going through the entire day and including night time. The raw
equivalents were calculated to find the food and nutrient intakes of the subjects
(ICMR, 2010). The cooked amount of each food item consumed by the subject was
then converted back into raw foodstuff using the formula given below. These raw
quantities of various food stuffs consumed through different food preparations were
calculated and summed up so as to obtain the total consumption of a particular
food item during the past 24-hour period.
Methodology
!"#$%&'()#*+&#,(-#+*&-()%$.$(+/, %&$(%01+2&(3/ ,%#&+)'(%/&#)4#/&%3/(+/,(*%5#($&'*#(03,%5%2+&%3/ 72
TR X Cl
Ri =
Where Ri = Raw amount of a particular foodstuff consumed by the
individual from a given preparation
TR = Total raw quantity of the foodstuff used in that preparation
CI = Intake of the cooked amount of that preparation
TC = Total cooked quantity of the food prepared
The nutrient intake of the subjects was computed for the experimental (N-15)
groups and control (N-15) groups using the food composition table as per Nutritive
Value of Indian Foods (2012) and compared with their recommended dietary
allowances.
c. Analysis of biochemical parameters
Davidson (1990) has reported that biochemical estimation is the most
sensitive indicator of the health condition of an individual.
! Blood glucose
Subjects selected for the intervention study were asked to come to the
biochemical laboratory in the respective hospital early morning around 7 o’ clock
after 12 hours of fasting to give the blood sample. A sample of five millilitre of blood
was collected with the help of a technician and analyzed for fasting blood glucose
level and glycosylated haemoglobin, and then the subjects were asked to consume
the breakfast. Two hours after the breakfast consumption, another sample of blood
was collected and analyzed for the post prandial blood glucose level. Blood glucose
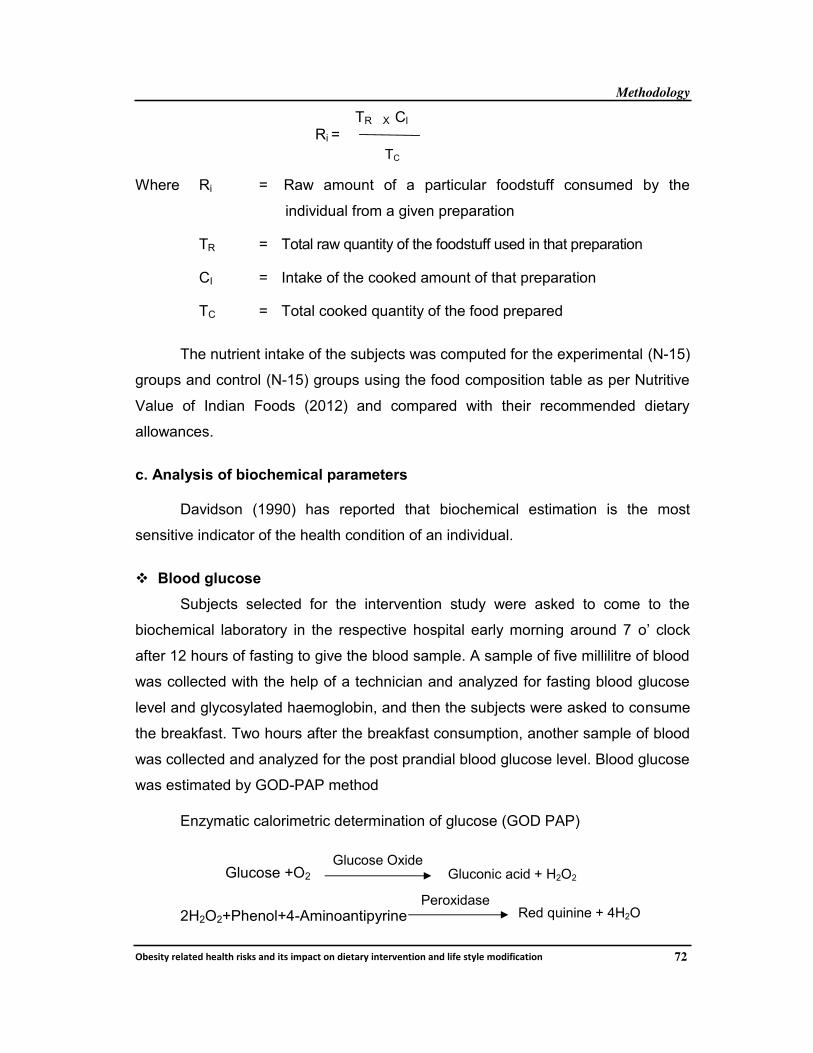
was estimated by GOD-PAP method
Enzymatic calorimetric determination of glucose (GOD PAP)
Glucose +O2
2H2O2+Phenol+4-Aminoantipyrine
Glucose OxideGluconic acid + H2O2
PeroxidaseRed quinine + 4H2O
TC
Methodology
!"#$%&'()#*+&#,(-#+*&-()%$.$(+/, %&$(%01+2&(3/ ,%#&+)'(%/&#)4#/&%3/(+/,(*%5#($&'*#(03,%5%2+&%3/ 73
! Glycosylated haemoglobin (HbA1C)
Sugar in the blood stream can become attached to the haemoglobin in red
blood cells. This process is called glycosylation. Once the sugar is attached, it
stays there for the life of the red blood cell, which is about 120 days. The higher the
level of blood sugar more is the sugar attached to red blood cells. The HbA1C test
measures the amount of sugar sticking to the haemoglobin in the red blood cells.
Thus the HbA1C test can measure the amount of glycosylation that has occurred
revealing the average blood glucose levels during the preceding three to four
months before the test. The important advantage of HbA1C testing is that the
sample can be drawn at any time, because it is not affected by short term changes
like food intake, exercise, stress and hypoglycemic agents. HbA1C can delay or
prevent the development of serious eye, kidney and nerve disease in people with
diabetes.
Glycosylated haemoglobin was estimated by chromatographic –
spectrometric ion exchange method for the experimental and control groups.
! Serum lipid profile
From each subject, five ml of blood sample was collected from the
antecubital vein preferably before breakfast to avoid the influence of food digestion
on blood composition. Care was taken to avoid hemolysis during the collection of
blood for serum separation. Blood was allowed to clot for nearly 3 hours at room
temperature. Then the clot was centrifuged and supernatant serum was removed
and stored in well stoppered bottles in a freezer and used for the analysis of lipids.
Estimation of Total Cholesterol (TC) and High Density Lipoprotein
Cholesterol (HDL-C) was done using the enzymatic method suggested by
Friedwald (1972). In this procedure, serum low density lipoprotein and very low
density lipoprotein are selectively precipitated by Mg2+ ions and phosphotungstate
and removed by centrifugation. Cholesterol associated with HDL fractions
remaining in the solution was carefully estimated by enzymatic method.
Methodology
!"#$%&'()#*+&#,(-#+*&-()%$.$(+/, %&$(%01+2&(3/ ,%#&+)'(%/&#)4#/&%3/(+/,(*%5#($&'*#(03,%5%2+&%3/ 74
Triglycerides were estimated using the enzymatic method, suggested by
Friedwald (1972). The intensity of the colour developed is directly proportional to
the triglyceride concentration and was measured photometrically at 540nm.
Very Low Density Lipoprotein (VLDL) cholesterol level was calculated from
the estimated triglyceride level using the following formula.
5
!"#$%&'()"$%')*+'",-"$+./0/ = where 5 is a constant factor
The Low Density Lipoprotein (LDL) cholesterol values were calculated from
high density lipoprotein cholesterol, total cholesterol and VLDL cholesterol values
using the following formula.
LDL cholesterol = Total cholesterol – (HDL cholesterol + VLDL cholesterol)
For all the selected 1000 obese subjects the above mentioned blood profile
were noted from the hospital record at the start of the study period to select the
subjects for the nutrition intervention.
The biochemical indices of metabolic control (Blood sugar- Fasting,
Postprandial, HbA1C and Total cholesterol, LDL Cholesterol, HDL Cholesterol,
VLDL Cholesterol and Triglycerides) of the selected 240 female obese subjects
(Experimental and control groups) were analyzed using the above procedure to find
out the effect before and after the intervention period.
PHASE III
A. SELECTION OF THE INGREDIENTS FOR THE SUPPLEMENT
Dietary fiber and whole grains contain a unique blend of bioactive
components including resistant starches, vitamins, minerals, phytochemicals and
antioxidants. As a result, research regarding their potential health benefits has
received considerable attention in the last several decades.
Methodology
!"#$%&'()#*+&#,(-#+*&-()%$.$(+/, %&$(%01+2&(3/ ,%#&+)'(%/&#)4#/&%3/(+/,(*%5#($&'*#(03,%5%2+&%3/ 75
Bran from a wide array of cereal grains have been shown to have an effect
on postprandial glucose levels, serum cholesterol, colon cancer, and body mass
(Ulmius et al., 2009). Keeping all this in mind the investigator selected the below
listed ingredients for the supplementation. The details about the foods selected for
the supplementation are given below.
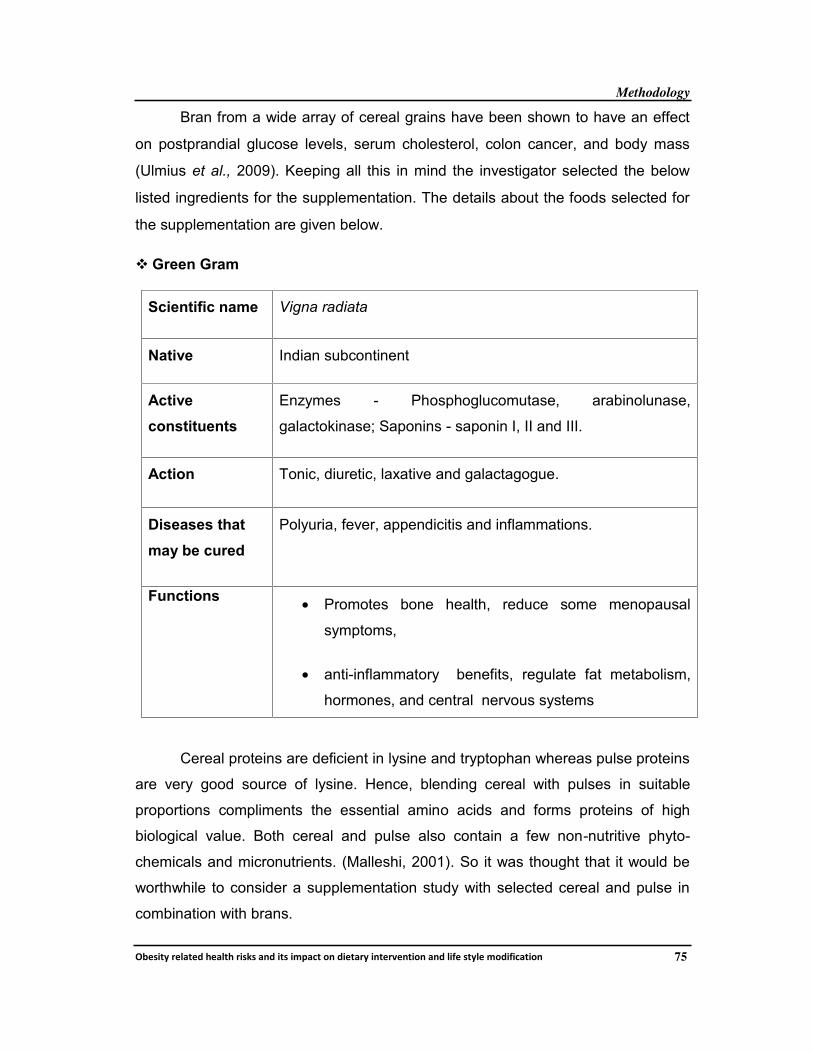
! Green Gram
Scientific name Vigna radiata
Native Indian subcontinent
Active
constituents
Enzymes - Phosphoglucomutase, arabinolunase,
galactokinase; Saponins - saponin I, II and III.
Action Tonic, diuretic, laxative and galactagogue.
Diseases that
may be cured
Polyuria, fever, appendicitis and inflammations.
Functions• Promotes bone health, reduce some menopausal
symptoms,
• anti-inflammatory benefits, regulate fat metabolism,
hormones, and central nervous systems
Cereal proteins are deficient in lysine and tryptophan whereas pulse proteins
are very good source of lysine. Hence, blending cereal with pulses in suitable
proportions compliments the essential amino acids and forms proteins of high
biological value. Both cereal and pulse also contain a few non-nutritive phyto-
chemicals and micronutrients. (Malleshi, 2001). So it was thought that it would be
worthwhile to consider a supplementation study with selected cereal and pulse in
combination with brans.
Methodology
!"#$%&'()#*+&#,(-#+*&-()%$.$(+/, %&$(%01+2&(3/ ,%#&+)'(%/&#)4#/&%3/(+/,(*%5#($&'*#(03,%5%2+&%3/ 76
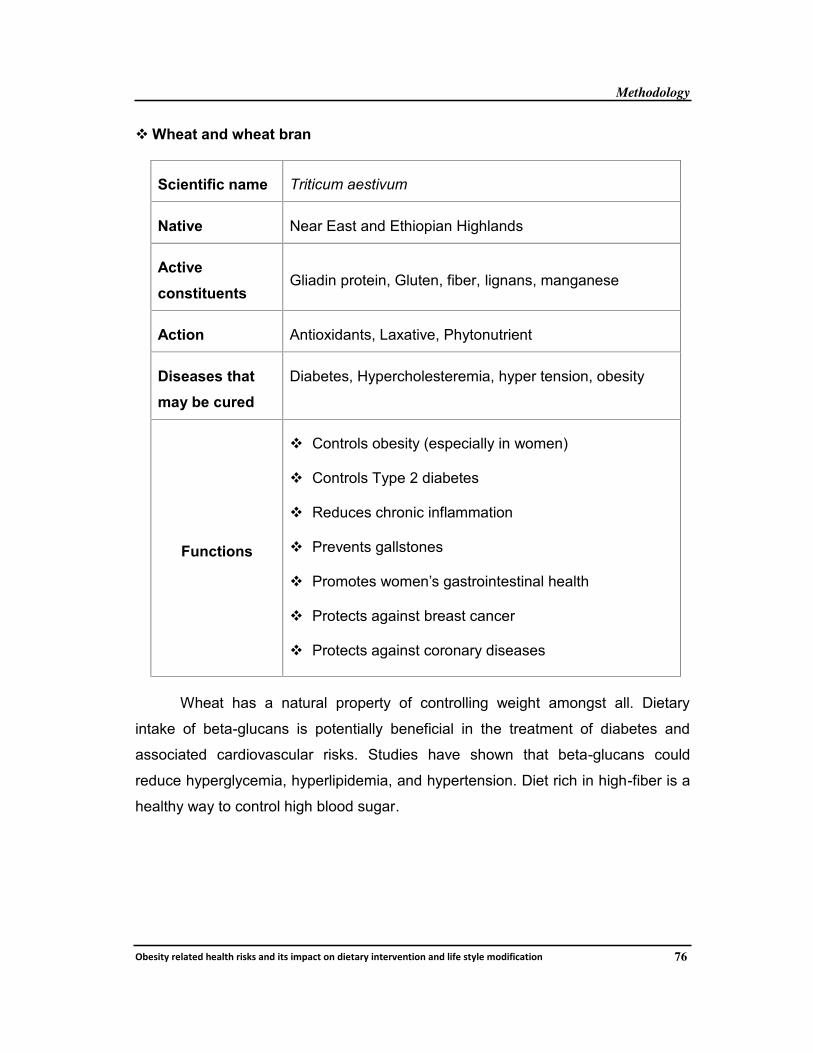
! Wheat and wheat bran
Scientific name Triticum aestivum
Native Near East and Ethiopian Highlands
Active
constituentsGliadin protein, Gluten, fiber, lignans, manganese
Action Antioxidants, Laxative, Phytonutrient
Diseases that
may be cured
Diabetes, Hypercholesteremia, hyper tension, obesity
Functions
! Controls obesity (especially in women)
! Controls Type 2 diabetes
! Reduces chronic inflammation
! Prevents gallstones
! Promotes women’s gastrointestinal health
! Protects against breast cancer
! Protects against coronary diseases
Wheat has a natural property of controlling weight amongst all. Dietary
intake of beta-glucans is potentially beneficial in the treatment of diabetes and
associated cardiovascular risks. Studies have shown that beta-glucans could
reduce hyperglycemia, hyperlipidemia, and hypertension. Diet rich in high-fiber is a
healthy way to control high blood sugar.
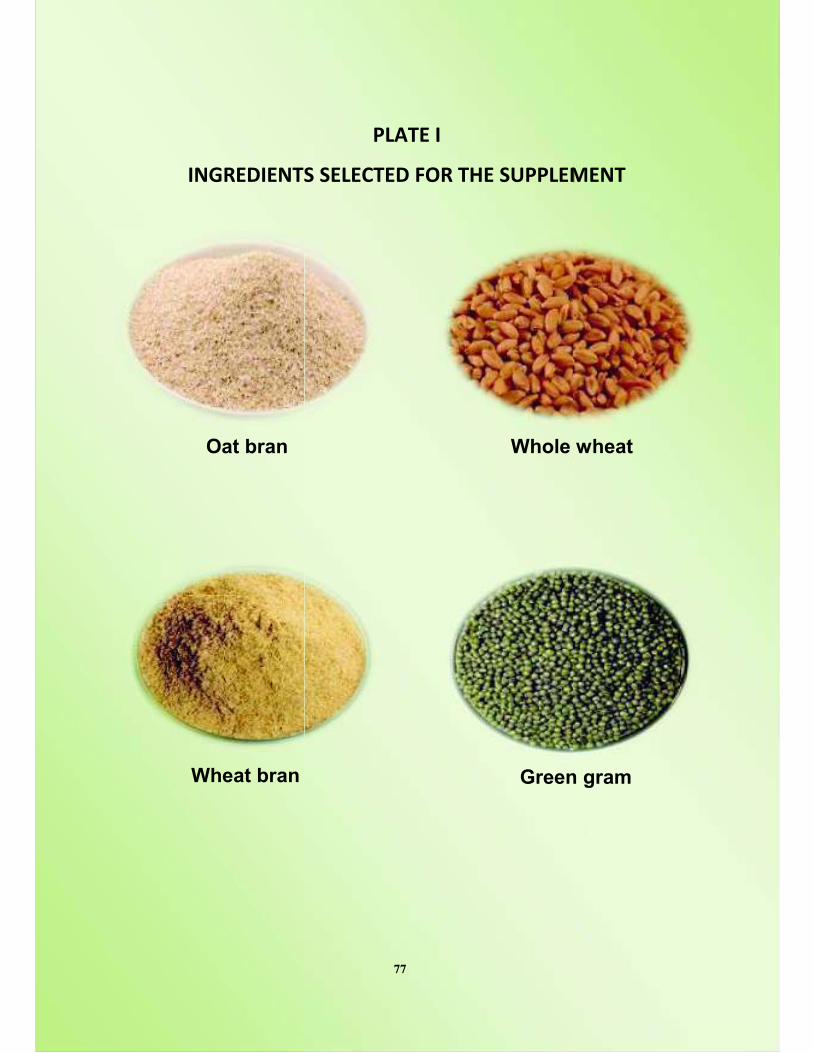
'()*%+'%($,
Oat bran
Wheat bran
!"#$%&'
($, ,%"%-$%+ ./*&$0%&,1!!"%2%
Whole
an Green
77
%2%($
e wheat
een gram
Methodology
!"#$%&'()#*+&#,(-#+*&-()%$.$(+/, %&$(%01+2&(3/ ,%#&+)'(%/&#)4#/&%3/(+/,(*%5#($&'*#(03,%5%2+&%3/ 78
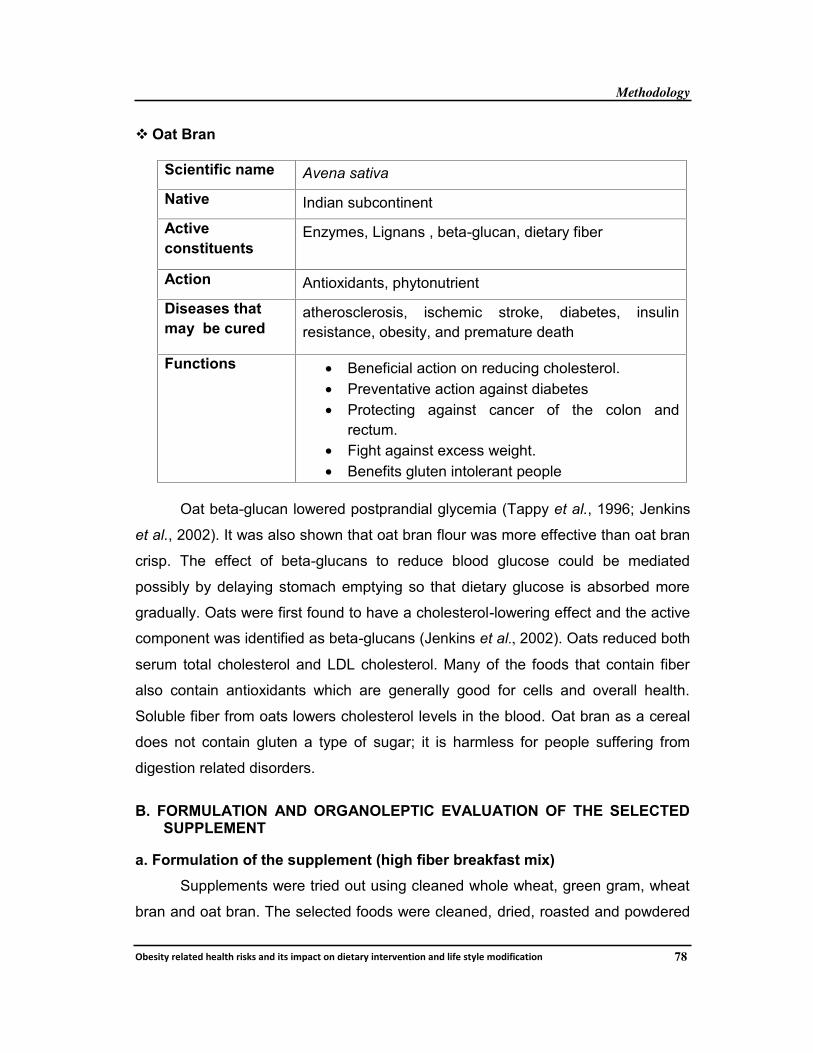
! Oat Bran
Scientific name Avena sativa
Native Indian subcontinent
Active
constituentsEnzymes, Lignans , beta-glucan, dietary fiber
Action Antioxidants, phytonutrient
Diseases that
may be curedatherosclerosis, ischemic stroke, diabetes, insulin
resistance, obesity, and premature death
Functions • Beneficial action on reducing cholesterol.
• Preventative action against diabetes
• Protecting against cancer of the colon and
rectum.
• Fight against excess weight.
• Benefits gluten intolerant people
Oat beta-glucan lowered postprandial glycemia (Tappy et al., 1996; Jenkins
et al., 2002). It was also shown that oat bran flour was more effective than oat bran
crisp. The effect of beta-glucans to reduce blood glucose could be mediated
possibly by delaying stomach emptying so that dietary glucose is absorbed more
gradually. Oats were first found to have a cholesterol-lowering effect and the active
component was identified as beta-glucans (Jenkins et al., 2002). Oats reduced both
serum total cholesterol and LDL cholesterol. Many of the foods that contain fiber
also contain antioxidants which are generally good for cells and overall health.
Soluble fiber from oats lowers cholesterol levels in the blood. Oat bran as a cereal
does not contain gluten a type of sugar; it is harmless for people suffering from
digestion related disorders.
B. FORMULATION AND ORGANOLEPTIC EVALUATION OF THE SELECTEDSUPPLEMENT
a. Formulation of the supplement (high fiber breakfast mix)
Supplements were tried out using cleaned whole wheat, green gram, wheat
bran and oat bran. The selected foods were cleaned, dried, roasted and powdered
Methodology
!"#$%&'()#*+&#,(-#+*&-()%$.$(+/, %&$(%01+2&(3/ ,%#&+)'(%/&#)4#/&%3/(+/,(*%5#($&'*#(03,%5%2+&%3/ 79
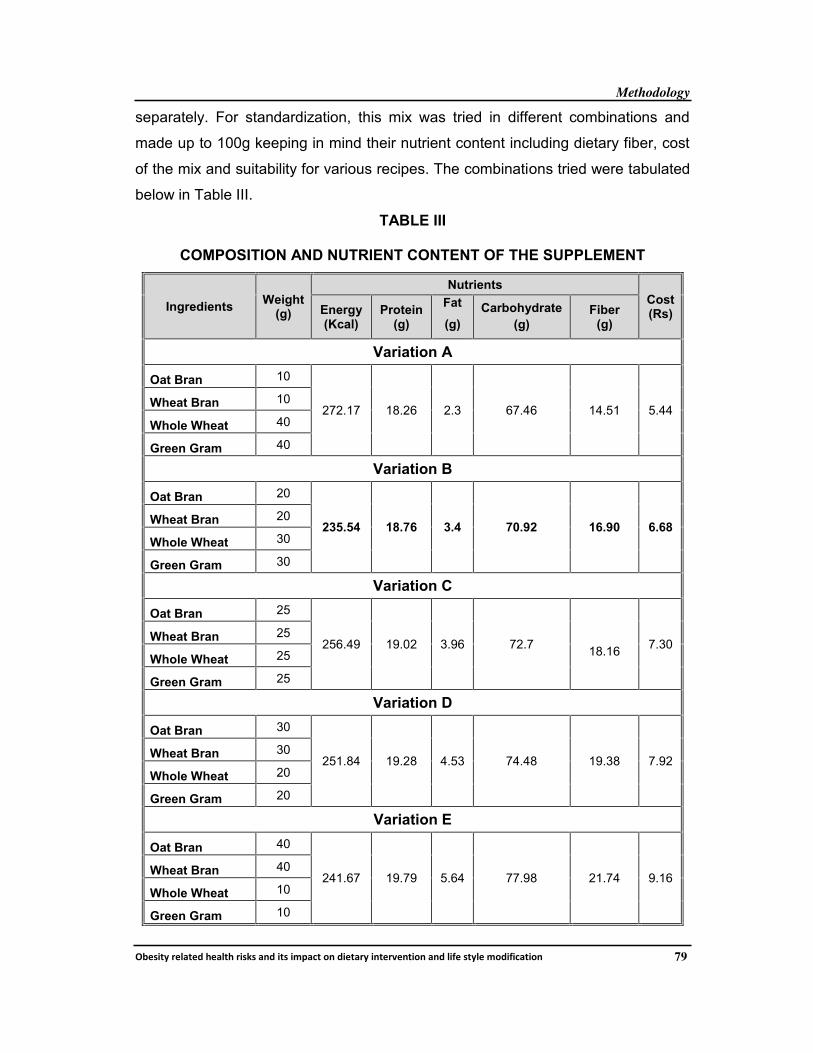
separately. For standardization, this mix was tried in different combinations and
made up to 100g keeping in mind their nutrient content including dietary fiber, cost
of the mix and suitability for various recipes. The combinations tried were tabulated
below in Table III.
TABLE III
COMPOSITION AND NUTRIENT CONTENT OF THE SUPPLEMENT
IngredientsWeight
(g)
Nutrients
Cost(Rs)Energy
(Kcal)Protein
(g)
Fat
(g)
Carbohydrate
(g)Fiber
(g)
Variation A
Oat Bran 10
272.17 18.26 2.3 67.46 14.51 5.44Wheat Bran 10
Whole Wheat 40
Green Gram 40
Variation B
Oat Bran 20
235.54 18.76 3.4 70.92 16.90 6.68Wheat Bran 20
Whole Wheat 30
Green Gram 30
Variation C
Oat Bran 25
256.49 19.02 3.96 72.718.16
7.30Wheat Bran 25
Whole Wheat 25
Green Gram 25
Variation D
Oat Bran 30
251.84 19.28 4.53 74.48 19.38 7.92Wheat Bran 30
Whole Wheat 20
Green Gram 20
Variation E
Oat Bran 40
241.67 19.79 5.64 77.98 21.74 9.16Wheat Bran 40
Whole Wheat 10
Green Gram 10
Methodology
!"#$%&'()#*+&#,(-#+*&-()%$.$(+/, %&$(%01+2&(3/ ,%#&+)'(%/&#)4#/&%3/(+/,(*%5#($&'*#(03,%5%2+&%3/ 80
From the above combinations tried, Variation A contains 272.17 kilocalories
of energy, 18.26 g of protein, 2.3 g of fat, 67.46 g of carbohydrate and 14.51g of
fiber but this combination was not accepted as it do not suit well for the recipes
tried. The nutritive value of 100g of the variation B mix reveals that it provides
235.54 kilocalories of energy, 18.76 g of protein, 3.4 g of fat, nearly 71 g of
carbohydrate and 16.9 g of fiber. It is clear that the mix provides one third of the
daily requirement recommended by ICMR (2011) for an Indian adult woman.
Variation C and D supplied more fiber ie 18.16g and 19.38 g respectively
and were unacceptable because of the texture and flavour of bran and these
combinations were not suitable for human consumption, similarly they provide more
calories and fat than the recommended allowances. The cost of the mix works out
around Rs 7.30 for variation C and Rs 7.92 for variation D. The investigator thought
that excess calorie and fat may induce weight gain and those combinations may
induce various side effects such as constipation and diarrhoea it was also quite
costly and it is difficult to afford per individual daily. Thus variation C and D were
rejected as they were not suitable for human consumption.
With regard to variation E, it provides 241.67 Kcal, 19.79g of protein, 5.64g
of fat, 77.98 g of carbohydrate and 21.74g of fiber. This combination provides more
fiber and more fat. Also the cost of this combination was Rs 9.16 per 100g which
was very high when compared with the other combinations and thus this
combination was eliminated. Finally the investigator decided that variation B would
be suitable for the selected obese subjects as that would supply required calorie
and fiber for an adult individual. Further this was also cost effective and suitable for
the selected recipe preparations.
b. Organoleptic evaluation of the selected recipes
Sensory evaluation is a multidisciplinary science that involves human
panelists and their senses of sight, smell, taste, touch and hearing to measure the
sensory characteristics and acceptability of food products. Thus the quality of food
is judged in terms of appearance, color, taste, texture and flavour (Chandrasekhar,
2002).
Methodology
!"#$%&'()#*+&#,(-#+*&-()%$.$(+/, %&$(%01+2&(3/ ,%#&+)'(%/&#)4#/&%3/(+/,(*%5#($&'*#(03,%5%2+&%3/ 81
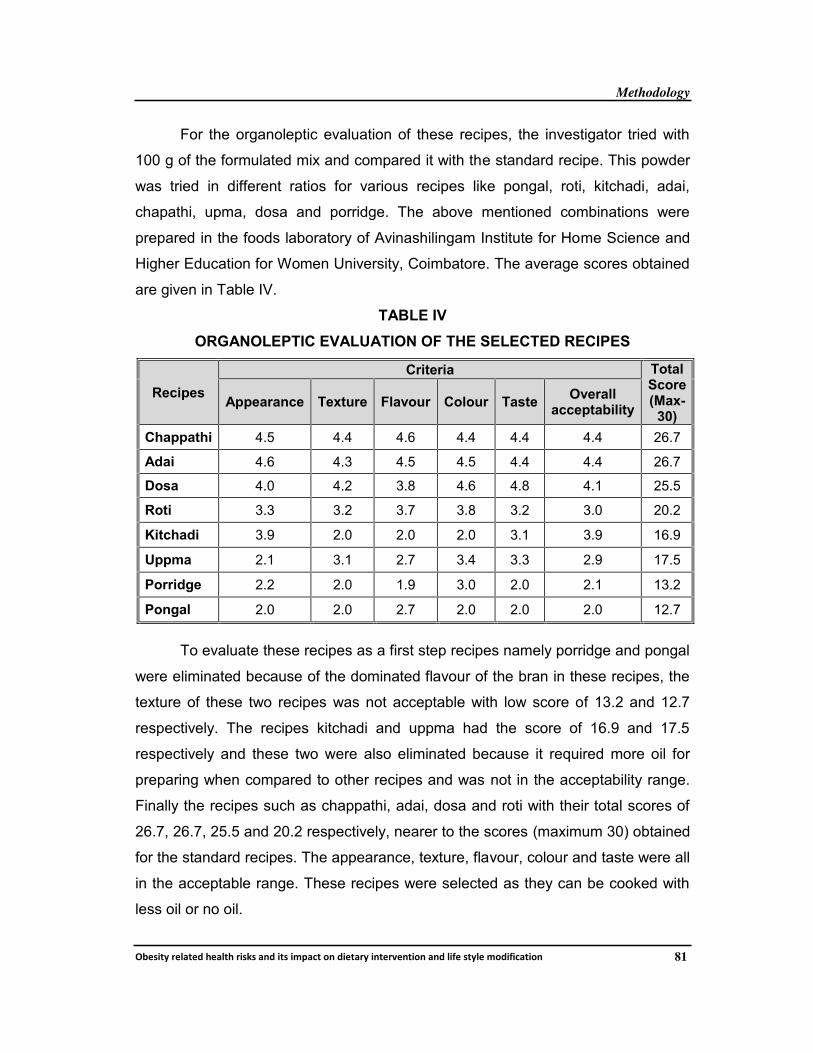
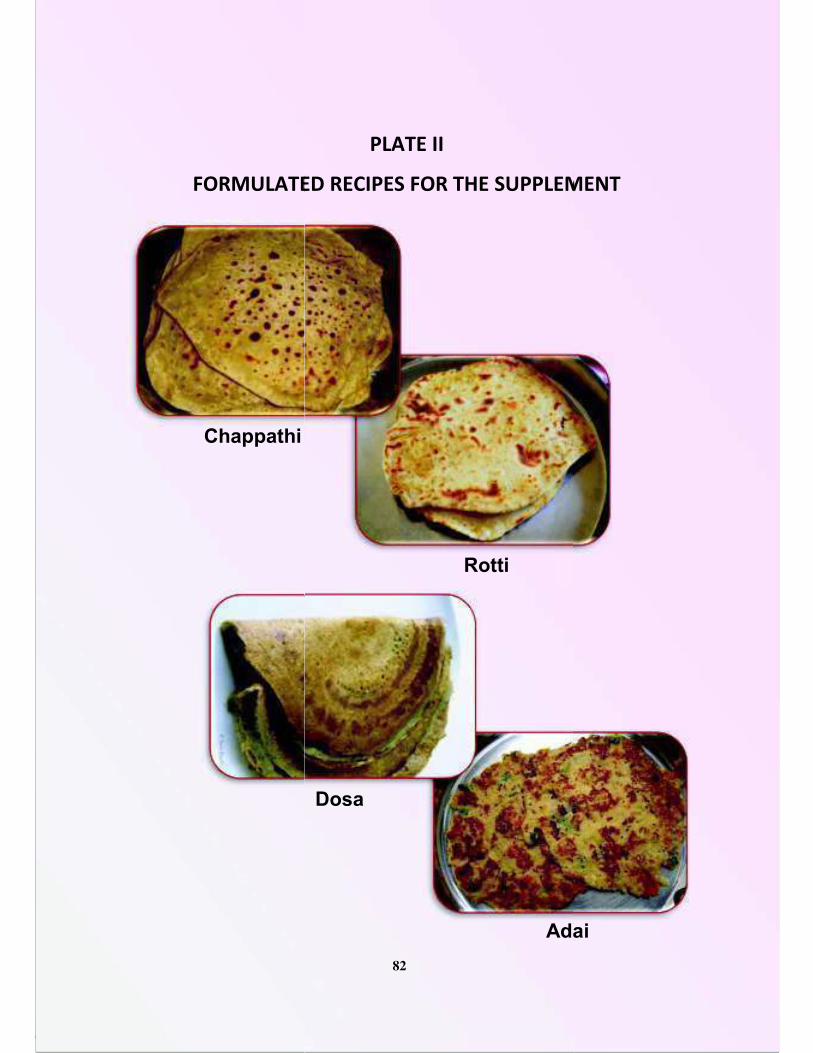
For the organoleptic evaluation of these recipes, the investigator tried with
100 g of the formulated mix and compared it with the standard recipe. This powder
was tried in different ratios for various recipes like pongal, roti, kitchadi, adai,
chapathi, upma, dosa and porridge. The above mentioned combinations were
prepared in the foods laboratory of Avinashilingam Institute for Home Science and
Higher Education for Women University, Coimbatore. The average scores obtained
are given in Table IV.
TABLE IV
ORGANOLEPTIC EVALUATION OF THE SELECTED RECIPES
Recipes
Criteria TotalScore(Max-
30)Appearance Texture Flavour Colour Taste
Overallacceptability
Chappathi 4.5 4.4 4.6 4.4 4.4 4.4 26.7
Adai 4.6 4.3 4.5 4.5 4.4 4.4 26.7
Dosa 4.0 4.2 3.8 4.6 4.8 4.1 25.5
Roti 3.3 3.2 3.7 3.8 3.2 3.0 20.2
Kitchadi 3.9 2.0 2.0 2.0 3.1 3.9 16.9
Uppma 2.1 3.1 2.7 3.4 3.3 2.9 17.5
Porridge 2.2 2.0 1.9 3.0 2.0 2.1 13.2
Pongal 2.0 2.0 2.7 2.0 2.0 2.0 12.7
To evaluate these recipes as a first step recipes namely porridge and pongal
were eliminated because of the dominated flavour of the bran in these recipes, the
texture of these two recipes was not acceptable with low score of 13.2 and 12.7
respectively. The recipes kitchadi and uppma had the score of 16.9 and 17.5
respectively and these two were also eliminated because it required more oil for
preparing when compared to other recipes and was not in the acceptability range.
Finally the recipes such as chappathi, adai, dosa and roti with their total scores of
26.7, 26.7, 25.5 and 20.2 respectively, nearer to the scores (maximum 30) obtained
for the standard recipes. The appearance, texture, flavour, colour and taste were all
in the acceptable range. These recipes were selected as they can be cooked with
less oil or no oil.
()*+,"#$%
Chappathi
!"#$%&''
$%-&*%.'!%/&()*&$0%&/,!!"%+%
i
Rotti
Dosa
Ada
82
+%1$
dai
Methodology
!"#$%&'()#*+&#,(-#+*&-()%$.$(+/, %&$(%01+2&(3/ ,%#&+)'(%/&#)4#/&%3/(+/,(*%5#($&'*#(03,%5%2+&%3/ 83
C. ANALYSIS OF THE SUPPLEMENT
The selected supplement was analysed for total dietary fiber, dietary fat,
active constituents, essential fatty acids, total sugars and anti-nutritional factors for
its suitability for human feeding trials in the Stanes Herbal Division and Phyto
Pharma Testing Lab, Coimbatore using standard procedures and just to confirm the
results one more sample was also analysed by the SGS India Pvt Ltd, Chennai
both are NABL accredited laboratories.
PHASE IV
A. ORIENTATION TO THE SELECTED SUBJECTS ON DIETARY
INTERVENTION
Education campaigns were conducted at the selected locale which enabled
the investigator to select 1000 subjects and also proceed with the supplementation
study. Awareness campaigns really helped the investigator to map out the subjects
and carry out the study in easy and quick manner. This method of conducting the
campaigns proved very effective and fast when compared to meeting the subjects
individually and explain them about the present study.
To conduct awareness campaigns to the participants the authorities of the
hospitals/ clinics helped by providing place and other facilities to the investigator.
As a first step an invitation for the conduct of educational campaign was sent to all
the selected obese subjects. This was done with the help of the doctors and their
assistants. Numerous pictures relating to concepts were collected from books,
journals, pamphlets and materials available with doctors and dieticians. Slides were
also developed with the help of collected resources. The developed slides
consisted of the following heads; Introduction to obesity, prevalence, symptoms,
classification, causes, diagnosis, risk factor, complications, role of the supplement
in reducing the weight and bad cholesterol, significance of dietary fiber,
management of diabetes by means of diet, drug, exercise, education and
monitoring of blood glucose.
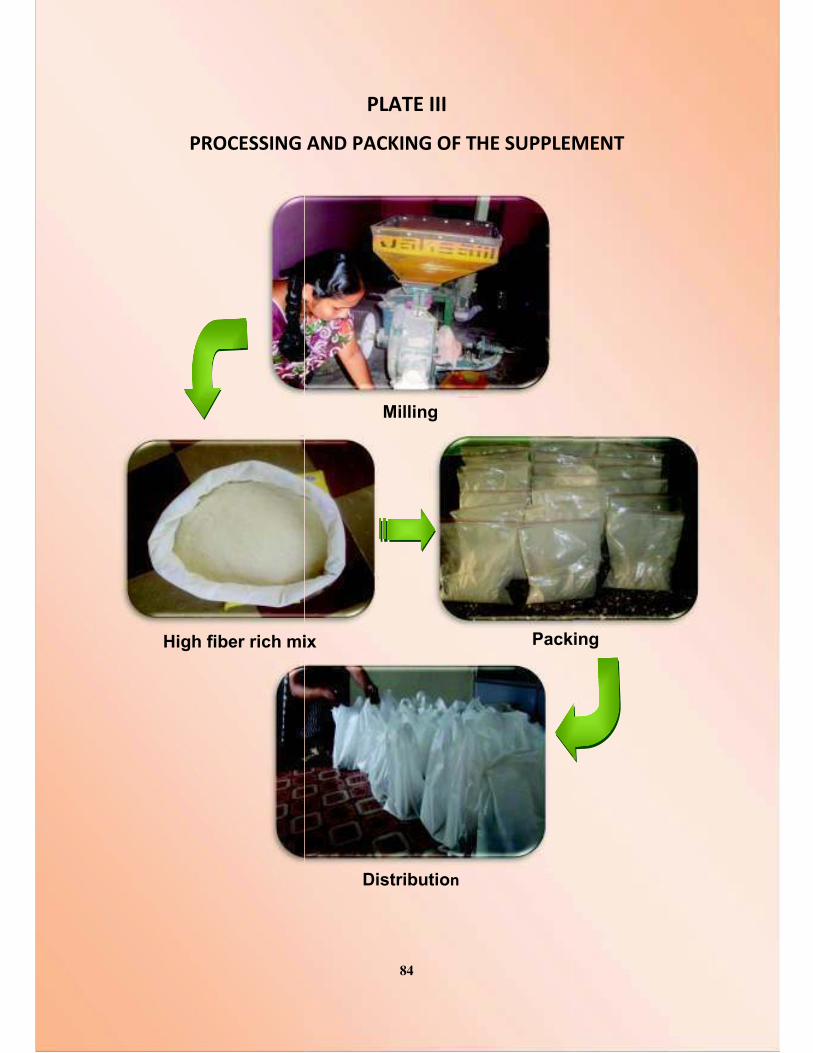
!()*%++',-&#
High fiber rich mi
!"#$%&'''
-&#,.&!#*/',-&)0&$1%&+2!!"%3%
Milling
ix Packi
Distributio4
84
%3%,$
acking
Methodology
!"#$%&'()#*+&#,(-#+*&-()%$.$(+/, %&$(%01+2&(3/ ,%#&+)'(%/&#)4#/&%3/(+/,(*%5#($&'*#(03,%5%2+&%3/ 85
The awareness campaign was well organized with the developed slides.
These campaigns gave the investigator an opportunity to:
! Provide general information on selection of foods for proper health and
adequate amount of food intake to maintain energy needs and the importance
of fiber rich diet.
! Educate on the nature of the disease and the possibility of development of
acute and long term complications like diabetes and hypercholesterolemia, if
weight, blood sugar and serum cholesterol are not kept under control.
! Create awareness and to explain the importance of good dietary habits,
exercise pattern, yoga practice for the management of obesity.
! Impart knowledge on nutritional significance and health benefits of foods
included for the supplementation study.
! The subjects who were willing to join the intervention programme were briefed
about the modalities of the study and written consent was obtained from them.
This was considered as a precautionary measure to make sure that the subjects
fully understood the nature of the study and their role in it.
They were also briefed during their regular visits about the blood test to be
taken before and after the supplementation period of 120 days. The subjects
selected for the human feeding trials visit the hospitals in the specified dates to
have their fasting blood glucose level and the total lipid profile level checked. After
their breakfast they stayed back to have their post prandial blood glucose check-up
done. During their visits they were given the supplements for the next consecutive
period of 15 days.
B. DIETARY INTERVENTION FOR THE SELECTED FEMALE SUBJECTS
Diet had a profound role in the control of obesity and its risk factors like
diabetes and hypercholesterolemia. A holistic approach to tackle obesity epidemic
needs an array of activities which includes dietary management which aims at
Methodology
!"#$%&'()#*+&#,(-#+*&-()%$.$(+/, %&$(%01+2&(3/ ,%#&+)'(%/&#)4#/&%3/(+/,(*%5#($&'*#(03,%5%2+&%3/ 86
weight maintenance or weight loss without compromising appropriate calorie
intake and normal nutrition. Due emphasis should be given to initiate and maintain
healthy eating patterns. After analyzing the selected supplements using various
parameters (dietary fiber, active constituents and antinutritional factors), three
different groups were subjected to study the effect of supplementation of high fiber
foods on obesity. For each group 60 obese subjects (Experimental-30 and control-
30) were selected for dietary intervention. To find out the individual acceptability by
the subjects dietary intervention trial was carried out for a period of one week and
the feed back was recorded to test the suitability of the supplement. The subjects
expressed some discomfort with regard to the digestion and elimination in the first
two days and later they became normal and they started consuming the
supplement with great enthusiasm.
The subjects in the experimental groups were supplemented with the mix
which fulfills the requirement of the breakfast as a whole for a period of 120 days.
The ingredients were cleaned, dried, powdered and neatly packed in air tight
packets of 100 g each. Each subject was given 15 packets at a time with the
request that the contents of each packet to be cooked daily and consumed for their
breakfast in the form of roti, chappathi, adai and dosa with no or less oil as per their
desire. During the intervention period the subjects were asked to drink 1.5 to 2.0
liters of water daily. They were asked to visit the hospitals every fifteen days for
review and to receive the supplement for the next fifteen days. The control group
did not receive any supplementation but they were asked to come to the regular
checkups.
C. LIFESTYLE MODIFICATION FOR THE SELECTED FEMALE SUBJECTS
The World Health Organization and the National Institutes of Health have
recommended that obese adults, as well as those who are overweight having co
morbid conditions, lose 10 per cent of their initial weight. A comprehensive program
of lifestyle modification is considered as the first option for achieving this goal.
Lifestyle modification, also referred to as behavioral weight control, includes 3
primary components: diet, exercise, and behavior therapy.
Methodology
!"#$%&'()#*+&#,(-#+*&-()%$.$(+/, %&$(%01+2&(3/ ,%#&+)'(%/&#)4#/&%3/(+/,(*%5#($&'*#(03,%5%2+&%3/ 87
Unfortunately obesity is a chronic condition and there is no 'quick fix' solution
or treatment that is effective for all overweight or obese individuals. Furthermore,
after following weight loss programs, relapses of weight gain are extremely
common. This emphasizes the importance of a lifetime commitment to healthy
eating and exercise practices. A range of different treatment options are available
for obesity. Lifestyle modification (with a reduction of energy intake and an increase
in physical activity) is essential in all treatment strategies. Positive changes in
eating and exercise behaviour are essential for sustained reductions in weight.
Yoga is a healthy life-style pattern widely used in India, as one of the traditional
heritage having immense role in mind and disease control. Keeping this in mind the
investigator opted to give yoga and relaxation therapy to the selected obese
subjects (OBY group (N-30)) along with the dietary intervention.
To conduct yoga classes for the subjects in the OBY group the investigator
approached the authorities of the yoga classes for providing experts to give training
and also the place and other required facilities to conduct the campaign for a period
of five weeks. The investigator also briefed about the date, time, duration and the
type of training appropriate to the selected obese subjects. The obese female
subjects who expressed their willingness to join the training programme were given
a printed consent form (developed by the investigator) in local language or in
English. This was considered as a precautionary measure to make sure that the
subjects fully understood the nature of the training, its importance in weight loss
and the biochemical parameters to be assessed before and after the intervention
period. Using the inclusion criteria and exclusion criteria 30 subjects were selected
for the training in yoga and relaxation therapy.
As the selected subjects were women and most of them were housewives
the convenient time for the training was fixed as per their desire. The subjects
usually visited the yoga centre on the specified dates between 11Am -12 Noon for
a period of five weeks. During their training period they were taught about the
different asanas, pranayama, cleansing practices and exercises to reduce their
weight and keep their mind and body relaxed and to modify their behaviour pattern.
')$%*(%)$
L
!"#$%&'(
)$'+) $+&$,%&-%"%.$%/&-012%
Dietary intervention
Lifestyle modification
88
2%.$-
Methodology
!"#$%&'()#*+&#,(-#+*&-()%$.$(+/, %&$(%01+2&(3/ ,%#&+)'(%/&#)4#/&%3/(+/,(*%5#($&'*#(03,%5%2+&%3/ 89
This campaign was well organised and the subjects were also very much
satisfied with the training given. At the end of five weeks feedback was obtained
from the subjects and they were asked to follow the asanas for a period of 120
days of intervention period. The formulated dietary supplement was also given for
all the subjects in the experimental group (OBY) and they were asked to consume
the same during the intervention period.
Selected subjects were asked to visit the yoga centre on the specified dates
of every fifteen days for review and to receive the supplement for the next fifteen
days. The fasting blood glucose, post prandial blood glucose levels, glycosylated
haemoglobin and total lipid profile were analysed for all the subjects initially and
finally after following the intervention practices for a period of 120 days to assess
the effect of training after the intervention period. The control group did not receive
any dietary supplement or yoga practice but they were asked to visit for their
regular checkups to be done initially at the onset of the study and at the end of the
study period.
D. EVALUATION OF THE EFFECT OF INTERVENTION ON THE SELECTED
SUBJECTS
To know the effect of supplementation, the anthropometry measurements,
diet recall and biochemical profile (Blood Glucose, HbA1C and serum Lipid profile)
of the experimental groups were recorded before and after intervention period of
120 days (Appendix II). Same procedure was followed for the control group so that
comparison was done effectively.
E. CONSOLIDATION AND ANALYSIS OF DATA
The data collected were systematically consolidated and statistically
analyzed using SPSS software version 20.0 for arriving at the results of the effect
of intervention on blood glucose and serum lipid levels among the selected obese
subjects and the findings are tabulated and discussed in Chapter IV Results and
Discussion.