Embed Size (px)
Citation preview

MODERN MAPPING
VOLU
ME 6
ISSU
E 2
MARCH/APRIL 2016
RESTORING FRANK LLOYD WRIGHT
What used to take weeks now takes days witheven more detail & the same level of accuracy
Laser scanning of the master architect’s UnityTemple for historical renovation documentation
Merrick & Co. is working with Maser Cons. & Xorail to provide hybrid LIDAR and Imagery data for PTC
LIDAR & POSITIVE TRAIN CONTROL
16
26
41
UAV TOPOGRAPHICAL SURVEYS
LIDARMAG.COMLIDAR
MAGAZINEVOLUME 6 ISSUE 2 // MARCH/APRIL 2016

POINTS& PIXELS
Mapping Large Limestone MineIn late 2014, Maptek surveyed the extensive underground
workings of the Lafarge Conco limestone mine near North
Aurora, Illinois. Lafarge needed a map of the workings to check
that the mine design was being followed and that the pillars
were not being undermined. Careful coordination with other
equipment operators ensured production was not impeded
and staff remained safe.
Laser scans registered together with pillar locations
The 125° scanning aperture of the Maptek™ I-Site™ 8200 laser
scanner gave good overhead coverage in the tunnels, which
range from 100 to 2,100 feet long. Setups averaged 90 feet apart,
using multiple point density settings for different purposes. Tripod
setups allowed instrument height and azimuth to be determined.
Higher resolution 360° scans provided extra detail. The scanner
was then transported on a bobcat to conduct stop-go scanning
at drift intersections. Lower resolution scans averaged 2 million
points, collecting about 1.3 billion raw points of data overall.
Point cloud data was registered to the survey data, and
a triangulated 3D surface was generated. Mid-rib contours,
showing areas that had been mined, were created at requested
elevations, and polylines exported for use in CAD software.
Other deliverables included scan coordinate locations in various
formats, 3D PDFs and field notes showing intersection names.
Screen captures with structural orientations as strike and dip
provide excellent detail for geotechnical analysis of large
structures, faults and bedding planes.
Lafarge now has a comprehensive 3D map of its underground
workings for planning, operations and future closure studies. Ten
days of data collection, plus 2-3 weeks for processing the point
Displayed with permission • LiDAR Magazine • Vol. 6 No. 2 • Copyright 2016 Spatial Media • www.lidarmag.com

cloud data, was a significant reduction on the 3 months estimated
for conventional survey.
Maptek is a leading provider of innovative software, hardware
and services for global mining. Maptek solutions are used at
more than 1700 sites in 75 countries, with applications across
the mining cycle. Maptek develops industry-leading software
for mine evaluation, planning, design, scheduling, operation
and rehabilitation. Integrated hardware and software for 3D
laser scanning, surveying and imaging collects spatial data
for geotechnical analysis, stockpile measurement, design
conformance and movement tracking.
For more information, please visit www.maptek.com.
GOT NEWS? Email [email protected]
A total of 676 I-Site laser scans and 1.3 billion points provided the detail for modelling underground works at the Lafarge Conco Mine.
I-Site 8200 laser scanner mounted on bobcat
Cross-section of underground drive
Displayed with permission • LiDAR Magazine • Vol. 6 No. 2 • Copyright 2016 Spatial Media • www.lidarmag.com
POINTS& PIXELS
Guided by Velodyne 3D LiDAR Sensor, Embry-Riddle Entry Takes First Place in RoboBoat Competition
Smart things come in small packages. Just
ask the RoboBoat team from Embry-Riddle
Aeronautical University (roboticsassociation.
org), which successfully defended its title as
champions in the eighth annual RoboBoat
Competition, held last summer in Virginia
Beach, Virginia.
Outfitted with Velodyne’s compact
16-channel 3D VLP-16 LiDAR Puck, the pilot-
less Embry-Riddle vessel crossed the finish
line ahead of the 15 other teams participat-
ing in the event, which was sponsored
by the Office of Naval Research (ONR),
the Association for Unmanned Vehicle
Systems International Foundation (AUVSI)
and several industry partners. The VLP-16
from Velodyne’s LiDAR Division (www.
velodynelidar.com) is part of a growing family
of solutions built around the company’s Light
Detection and Ranging technology.
A year ago, Embry-Riddle finished first
with a boat that incorporated Velodyne’s
32-channel HDL-32E LiDAR sensor. “Our
performance in the RoboBoat competition
was made possible for the second year in a
row by the amazing Velodyne sensor,” says
first-year student and team lead Kelsey Klein.
“The Velodyne VLP-16 puck is an integral part
of our autonomous vessel, and pairing it with
our robust identification and classification
algorithms gave us the edge to successfully
complete the aquatic obstacle course.”
Hailing from places as far-flung as
Indonesia, Taiwan, and South Korea, teams
were evaluated based on the performance
and designs of their student-built vessels. The
mandatory tasks measured vessel speed,
navigation and propulsion. Among the other
challenges: automated docking, obstacle
avoidance, launch and recovery from a
moving boat, return to dock, and acoustic
beacon positioning.
“The Embry-Riddle team’s success was
largely due to Velodyne’s continued support,
this time with the quick turnaround of a VLP-16
unit,” says Hitesh Patel, former team member
and now a consultant. “Last year, we were the
first team to debut the HDL-32E and this year,
with Velodyne’s state-of-the-art sensors, we
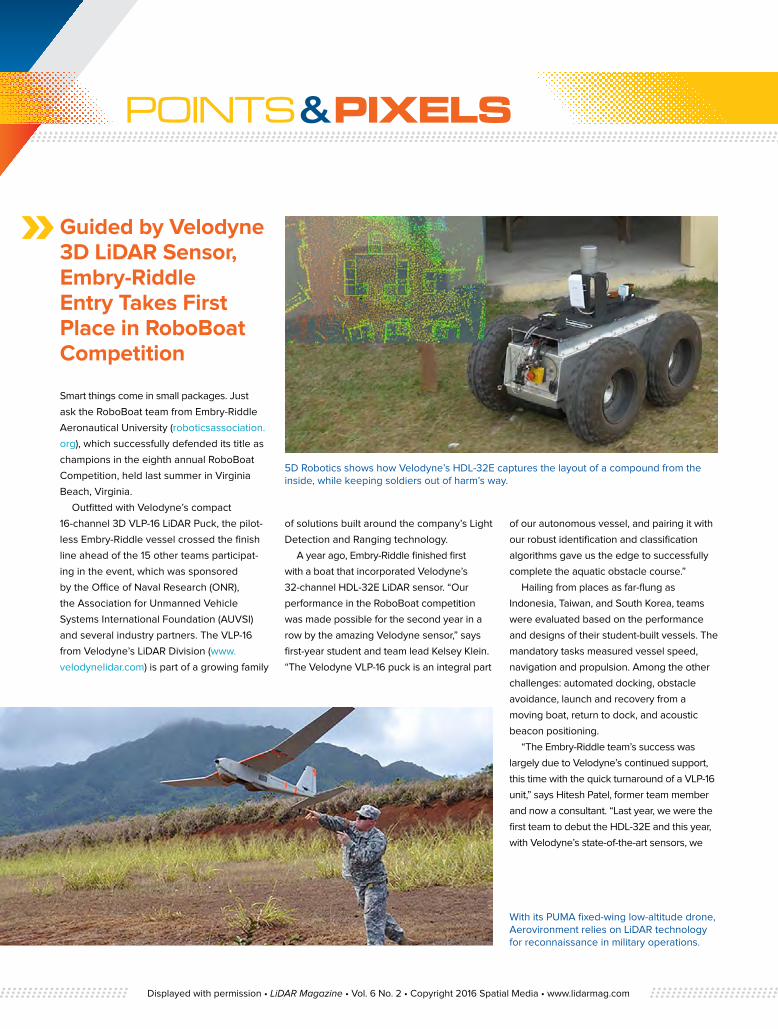
5D Robotics shows how Velodyne’s HDL-32E captures the layout of a compound from the inside, while keeping soldiers out of harm’s way.
With its PUMA fixed-wing low-altitude drone, Aerovironment relies on LiDAR technology for reconnaissance in military operations.
Displayed with permission • LiDAR Magazine • Vol. 6 No. 2 • Copyright 2016 Spatial Media • www.lidarmag.com

continue to prove the benefits of Velodyne
LIDAR products in today’s autonomous
technology applications. The team loved the
VLP-16 sensors just as much as they did the
HDL-32E. Having used the HDL-32E made
it easier for the team to integrate the VLP-16
onto the RoboBoat platform.”
“Our 3D LiDAR sensors guide autonomous
vehicles on land, on the seas and in air, and
our hats are off to Embry-Riddle University
for retaining its crown,” says Mike Jellen,
Velodyne president. “We’re recognized
worldwide for developing real-time LiDAR
sensors for all kinds of autonomous
applications, including 3D mapping and
surveillance. With a continuous 360-degree
sweep of its environment, the lightweight,
extremely affordable VLP-16 is scanning power
in a pint-size package—and is ideal for taking
on obstacle courses, wherever they may be.”
Adds Kelly Cooper, program officer, sea
warfare and weapons, ship systems and
engineering research division, Office of Naval
Research, “the [RoboBoat] course provides
students with realistic maritime environment
missions. The successes and challenges
students experience via the competition are
good preparation for a future in engineering.
From completing a run to making onsite
adjustments, RoboBoat offers students a
first-hand look at what real-life engineers go
through when developing and testing navy
technologies for our sailors and Marines.”
For more information, visit: www.velodynelidar.com
GOT NEWS? Email [email protected]
Phoenix Aerial demonstrates the superiority of LiDAR over photogrammetry.
True Reality GeoSpatial Solutions’s octocopter, equipped with Velodyne’s lightest and most affordable LiDAR sensor, the VLP-16 LiDAR Puck
Displayed with permission • LiDAR Magazine • Vol. 6 No. 2 • Copyright 2016 Spatial Media • www.lidarmag.com
POINTS& PIXELS
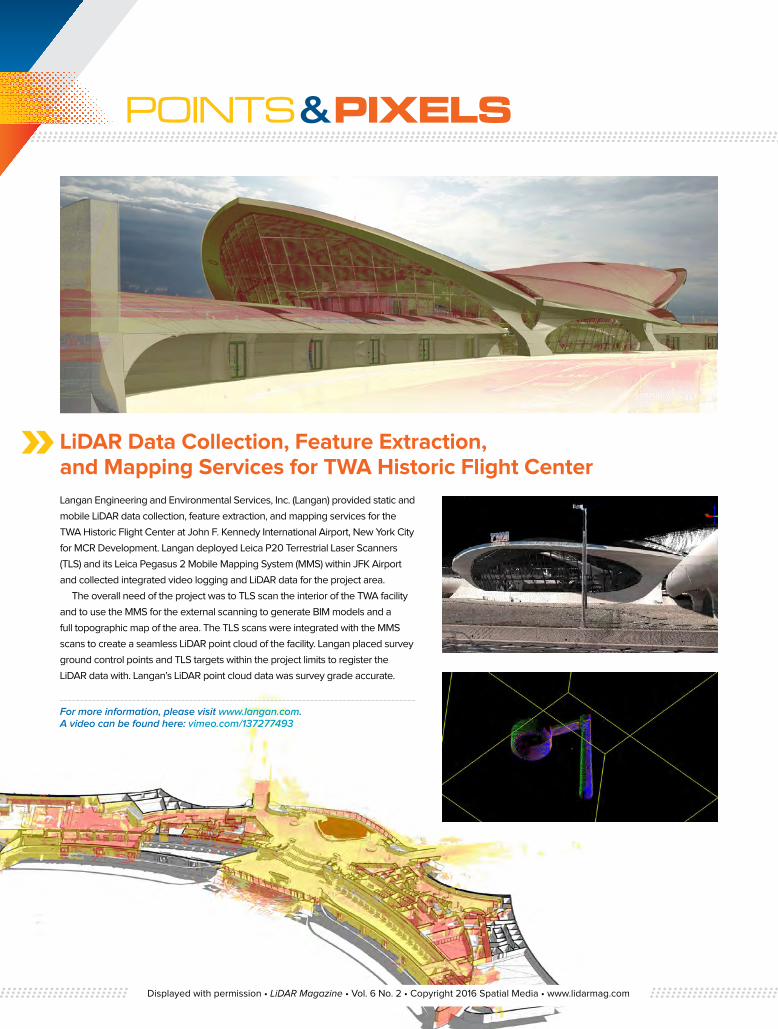
LiDAR Data Collection, Feature Extraction, and Mapping Services for TWA Historic Flight CenterLangan Engineering and Environmental Services, Inc. (Langan) provided static and
mobile LiDAR data collection, feature extraction, and mapping services for the
TWA Historic Flight Center at John F. Kennedy International Airport, New York City
for MCR Development. Langan deployed Leica P20 Terrestrial Laser Scanners
(TLS) and its Leica Pegasus 2 Mobile Mapping System (MMS) within JFK Airport
and collected integrated video logging and LiDAR data for the project area.
The overall need of the project was to TLS scan the interior of the TWA facility
and to use the MMS for the external scanning to generate BIM models and a
full topographic map of the area. The TLS scans were integrated with the MMS
scans to create a seamless LiDAR point cloud of the facility. Langan placed survey
ground control points and TLS targets within the project limits to register the
LiDAR data with. Langan’s LiDAR point cloud data was survey grade accurate.
For more information, please visit www.langan.com. A video can be found here: vimeo.com/137277493
Displayed with permission • LiDAR Magazine • Vol. 6 No. 2 • Copyright 2016 Spatial Media • www.lidarmag.com

Accurate Documentation of Danbury Ct Construction Site This Project is called “Rivington”, and is located in Danbury Ct. It
consists of over 250 residential units and a large clubhouse facility. The
Developer is Toll Brother Inc. based out of Pennsylvania. The project
consisted of many Geotechnical challenges. There was about 500,000
cubic yards of material to be moved on the site. About 200,000 yards
consisted of bedrock that would need to be blasted and processed on
site, and 300,000 yards of soil. The soil presented the biggest chal-
lenge on the project as its moisture content was elevated and it would
require augmenting a large percentage of this soil with lime to lower
its moisture levels to allow proper compaction of these materials. The
management and proper use of these various onsite earth materials
would be critical to the success of the overall project.
We started this project in 2012 and have flown it consistently for the
past 3 years. We fly the project as required to capture data. This data
has allowed us to accurately document how the site was progressing
as it related to mass earthwork calculations. This was critical in the
early stages of mass earthwork, as we were able to very quickly and
accurately see our progress and management of these materials and
also provide proof of earthmoving and soil augmentation quantities
completed within a billing cycle to our customer. This data created trust
between our customer and us and allows the billing and payment cycles
to flow easily throughout the project.
The data that we would capture consists of a high-resolution geo-
located image and point cloud: Resolution: 4 cm per pixel; Points per
Square Meter: 50. We found the accuracy to be on par with our typical
GPS rover and we could capture that in a couple hours as opposed
to the few days it would take to accurately topo the entire site. This
timesaving allowed us to easily and cost effectively topo the entire site
as often as we wanted.
3D Services is a 3D Laser Scanning and Aerial Topography company based in Hamden, Connecticut and is a branch of Sweeney Excavation. We started as Sweeney Excavations in house survey and topo department and have branched out to offer our services to other companies in the North East. 3D Services offers indoor, outdoor and underwater laser scanning as well as aerial imaging, topography and infrared imaging. For more information contact, Ryan Sweeney, www.ThreeD-Services.com.
POINTS& PIXELS
Displayed with permission • LiDAR Magazine • Vol. 6 No. 2 • Copyright 2016 Spatial Media • www.lidarmag.com

POINTS& PIXELS
CartoConsult Visibility Mapping Supports Successful Planning Application
A before and after photomontage, created by
CartoConsult, has helped to secure planning
permission for a quarry extension in Kent.
Working with DB Landscape Consultancy
(DBLC) on behalf of site owners Ferns,
CartoConsult prepared the high resolution
photomontage to illustrate the potential
visibility of the proposed extension to the
existing Wrotham Quarry.
Located within the Kent Downs Area of
Outstanding Natural Beauty (ANOB), and a
former Dr Who filming location, objection to
the extension from the AONB Management
Unit and various other parties was
considerable. Using the photomontage, DBLC
was able to demonstrate that the potential
visual impact of the proposed development
on people walking on the slopes of the Kent
Downs would not be as significant as claimed.
DBLC was originally commissioned to
design the working and restoration scheme for
the proposed—now approved—extension, by
the former site owners Hanson Aggregates,
before ownership of the quarry changed
to Ferns, who successfully completed the
planning application.
DBLC was also commissioned to prepare
a Landscape and Visual Impact Assessment
(LVIA), which included preparation of a Zone
of Theoretical Visibility (ZTV) plan. This
ZTV identified a number of key viewpoint
locations from which the source imagery for
CartoConsult’s photomontage was captured.
Once collated and georeferenced, the
photomontage, complete with detailed written
commentary, was submitted within the LVIA to
support the planning application.
“Working with CartoConsult, we were able
to provide easy to interpret, visual evidence
to support the site owner’s plans for expan-
sion and restoration,” commented David
Brittain, Director of DBLC. “The topography
of the landscape and the sensitivity of its
AONB location contributed to both the
importance of the project and some of the
difficulties encountered during the various
stages of the planning application.
“CartoConsult provided a first class
service throughout, responding in a
knowledgeable and timely manner to
both the initial scope of work as well as
feedback as the project commenced.”
CartoConsult provides geospatial services that include surveying, data capture, mapping and 3D modelling. The company employs some of the world’s most progressive GIS and 3D technology to create reliable, cost effective and visually stunning products that significantly enhance the planning, consultation and delivery of projects. For more information contact: Tim Hughes, tel +44 (0)7764759064 or [email protected], www.cartoconsult.co.uk.
Displayed with permission • LiDAR Magazine • Vol. 6 No. 2 • Copyright 2016 Spatial Media • www.lidarmag.com
GOT NEWS? Email [email protected]
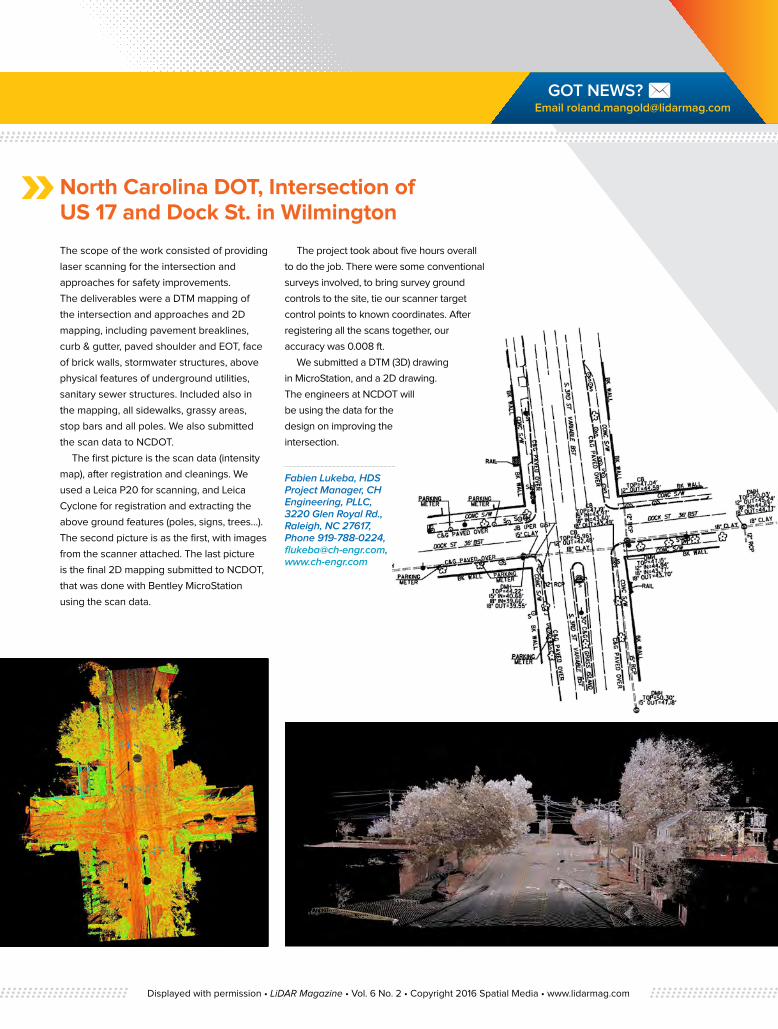
North Carolina DOT, Intersection of US 17 and Dock St. in Wilmington
The scope of the work consisted of providing
laser scanning for the intersection and
approaches for safety improvements.
The deliverables were a DTM mapping of
the intersection and approaches and 2D
mapping, including pavement breaklines,
curb & gutter, paved shoulder and EOT, face
of brick walls, stormwater structures, above
physical features of underground utilities,
sanitary sewer structures. Included also in
the mapping, all sidewalks, grassy areas,
stop bars and all poles. We also submitted
the scan data to NCDOT.
The first picture is the scan data (intensity
map), after registration and cleanings. We
used a Leica P20 for scanning, and Leica
Cyclone for registration and extracting the
above ground features (poles, signs, trees…).
The second picture is as the first, with images
from the scanner attached. The last picture
is the final 2D mapping submitted to NCDOT,
that was done with Bentley MicroStation
using the scan data.
The project took about five hours overall
to do the job. There were some conventional
surveys involved, to bring survey ground
controls to the site, tie our scanner target
control points to known coordinates. After
registering all the scans together, our
accuracy was 0.008 ft.
We submitted a DTM (3D) drawing
in MicroStation, and a 2D drawing.
The engineers at NCDOT will
be using the data for the
design on improving the
intersection.
Fabien Lukeba, HDS Project Manager, CH Engineering, PLLC, 3220 Glen Royal Rd., Raleigh, NC 27617, Phone 919-788-0224, [email protected], www.ch-engr.com
Displayed with permission • LiDAR Magazine • Vol. 6 No. 2 • Copyright 2016 Spatial Media • www.lidarmag.com

POINTS& PIXELS
Hohokam Baseball Stadium and Fitch Park, Mesa, AZThis spring training baseball stadium and
practice park in Mesa, Arizona used to be
owned by the Oakland A’s, but was taken
over by the Chicago Cubs. The new owners
wanted to make a few changes. W.E. O’Neil
Construction was contracted to perform
the renovations, and they hired WHPacific’s
Phoenix office to perform LiDAR and
surveying services on the two sites.
To perform the data extraction on this
project, color point cloud data was not strictly
necessary, but WHPacific made the decision
to collect all of it with color anyway. If you’ve
ever done any LiDAR digitizing, you know
that identifying objects in the point cloud is
much easier when it’s in color. And besides, it
makes for some very cool eye candy for the
marketing team!
On a professional baseball field, the grass
must be perfectly uniform across the entire
surface. If stepped on at just the right angle,
a clump in the grass can wreck a multi-million
dollar player’s ankle, and possibly their
career. Imagine a center-fielder running
to catch a pop-fly, watching the ball (as he
should) and not the ground. The data for the
entire expanse of playing surfaces had to
be scrutinized at one tenth of a foot to make
sure there were no traps waiting to retire an
unsuspecting player.
LiDAR technician, Luke Bingham and
surveyor Tony Slater scanned both sites
over 5 days. They started by picking the
best scanner for the job, and chose a Riegl
VZ-400 terrestrial scanner. Its range and
accuracy allows for target scanning over
very long distances, allowing them to tie in
control targets over a wide area. Another
deciding factor is its top-mounted Canon
camera, which can take enough images
to color a full 360 degree scan in about 2
minutes. It took three and a half days and 32
scans to capture the stadium site, which is
46 acres with several buildings, bleachers,
equipment barns, parking lots, trees, and,
of course grass—lots of grass. The practice
field (28 acres with far fewer obstructions,
but still had grass—lots of grass) took about
a day and a half and 19 scan setups.
For more information call 602.343.7851
Displayed with permission • LiDAR Magazine • Vol. 6 No. 2 • Copyright 2016 Spatial Media • www.lidarmag.com
GOT NEWS? Email [email protected]
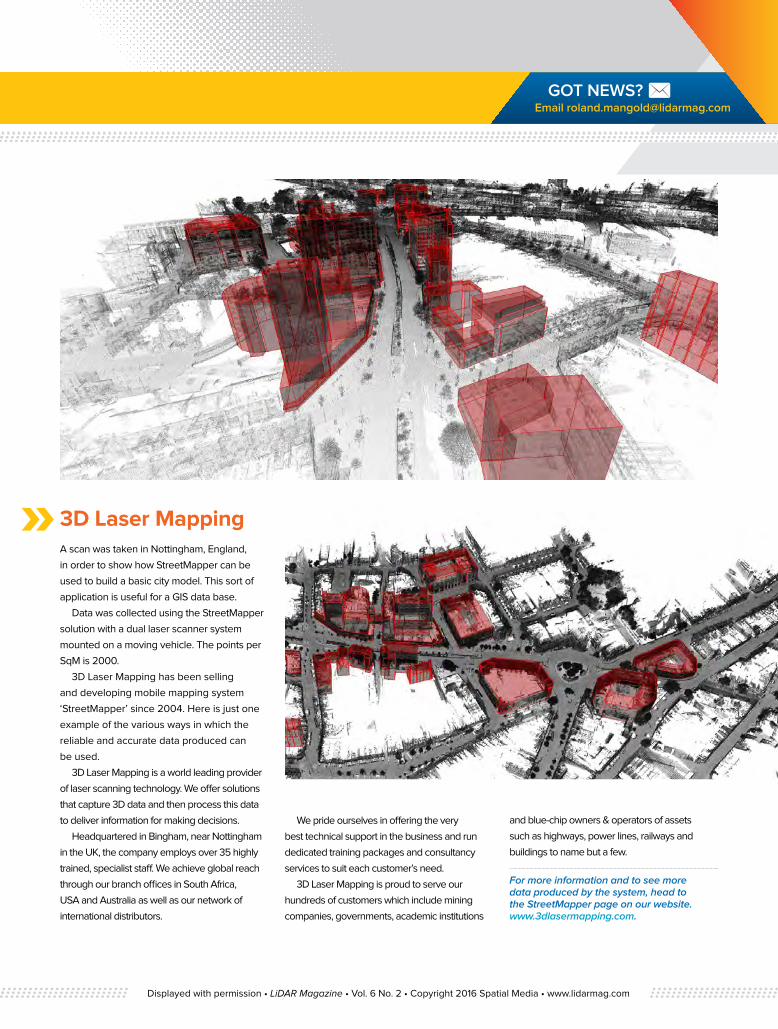
3D Laser MappingA scan was taken in Nottingham, England,
in order to show how StreetMapper can be
used to build a basic city model. This sort of
application is useful for a GIS data base.
Data was collected using the StreetMapper
solution with a dual laser scanner system
mounted on a moving vehicle. The points per
SqM is 2000.
3D Laser Mapping has been selling
and developing mobile mapping system
‘StreetMapper’ since 2004. Here is just one
example of the various ways in which the
reliable and accurate data produced can
be used.
3D Laser Mapping is a world leading provider
of laser scanning technology. We offer solutions
that capture 3D data and then process this data
to deliver information for making decisions.
Headquartered in Bingham, near Nottingham
in the UK, the company employs over 35 highly
trained, specialist staff. We achieve global reach
through our branch offices in South Africa,
USA and Australia as well as our network of
international distributors.
We pride ourselves in offering the very
best technical support in the business and run
dedicated training packages and consultancy
services to suit each customer’s need.
3D Laser Mapping is proud to serve our
hundreds of customers which include mining
companies, governments, academic institutions
and blue-chip owners & operators of assets
such as highways, power lines, railways and
buildings to name but a few.
For more information and to see more data produced by the system, head to the StreetMapper page on our website. www.3dlasermapping.com.
Displayed with permission • LiDAR Magazine • Vol. 6 No. 2 • Copyright 2016 Spatial Media • www.lidarmag.com