Embed Size (px)
Citation preview

Modern Multiresolution Techniques for
Fingerprint Recognition
تقنيات حديثة متعددة الحلول لنظام التعرف على بصمات األصبع
Waleed A. Abudalal
Supervised by
Dr.Mohammed Alhanjouri
Associate Prof. of Artificial Intelligence and Digital Signal
Processing
A thesis submitted in partial fulfilment
of the requirements for the degree of
Master of Computer Engineering
August 2016
زةــغ – ةــالميــــــة اإلســـــــــامعـالج
والدراسات العلياشئون البحث العلمي
الهندســـــــــــــــــــــــــــــــةة ليــــــك
هندسة الحاســـــــــــــوبماجستير
The Islamic University–Gaza
Research and Postgraduate Affairs
Faculty of Engineering
Master of Computer Engineering

II
إقــــــــــــــرار
أنا الموقع أدناه مقدم الرسالة التي تحمل العنوان:
Modern Multiresolution Techniques for Fingerprint
Recognition
تقنيات حديثة متعددة الحلول لنظام التعرف على بصمات األصبع
ن باستثناء ما تمت اإلشارة إليه حيثما ورد، وأأقر بأن ما اشتملت عليه هذه الرسالة إنما هو نتاج جهدي الخاص،
لنيل درجة أو لقب علمي أو بحثي لدى أي مؤسسة االخرين هذه الرسالة ككل أو أي جزء منها لم يقدم من قبل
تعليمية أو بحثية أخرى.
Declaration
I understand the nature of plagiarism, and I am aware of the University’s policy on
this.
The work provided in this thesis, unless otherwise referenced, is the researcher's own
work, and has not been submitted by others elsewhere for any other degree or
qualification.
:Student's name وليد عبد المالك أبودالل اسم الطالب:
التوقيع:Signature:
20/8/2016 التاريخ:Date:
III
Abstract
Using biometrics in recognition of persons has received more and more attention in
the last years, due to the necessity to improve the information security and access
restrictions of authentication systems. Fingerprint is considered the most practical
biometrics due to some specific features which make them widely accepted.
Reliable feature extraction from poor quality fingerprint images is still the most
challenging problem in fingerprint recognition system. So it needs a lot of pre-
processing steps to improve the quality of fingerprint images, then it needs a reliable
feature extractors to extract some distinctive features. Recently, multiresolution
transforms techniques have been widely used as a feature extractor in the field of
biometric recognition. These features can be used as an identification marks in
fingerprint recognition. The goal of this thesis is to develop a complete and an efficient
fingerprint recognition system that can deal with poor quality fingerprint images. To
deal with poor quality fingerprint image with various challenging, a reliable pre-
processing stage and an efficient feature extraction are needed. Segmentation is one of
the most important pre-processing steps in fingerprint identification followed by image
alignment, and enhancement. We improve a common enhancement technique based
on STFT analysis by replacing the used segmentation technique which based on
thresholding the energy map, with another one based on morphological operation. We
use modern multiresolution techniques; Curvelet, Wave Atoms, Shearlet transforms in
extracting distinctive features from the enhanced fingerprint images in a new
methodology. The selected features are matched through multiple classifier
techniques. We use the Minimum Distance Classifier, K-Nearest Neighbour, Self-
Organizing Map and Support Vector Machine. We compare between all these
classifiers with respect to the various feature extraction techniques. We test our
methodology in 114 subjects selected from a very challenges database; CASIA-
FingerprintV5; and we achieve a high recognition rate of about 99.5%.
Keywords: Fingerprint Recognition, Multiresolution Feature Extraction, Wave
Atoms, Shearlet, Curvelet, Real Noisy Database, Fingerprint Image Enhancement,
CASIA-FingerprintV5.

IV
الملخص
استخدام القياسات الحيوية في التعرف على األشخاص القى الكثير من االهتمام في السنوات األخيرة, ويرجع ذلك الى
ضرورة تطوير أمن المعلومات والقيود األمنية على أنظمة التحقق من الهوية. تعتير بصمة األصبع األكثر عمليا من
ة ان استخراج السمات الفارقدة جعلتها مقبولة على نطاق واسع. ضمن جميع القياسات الحيوية لما لها من مميزات محد
من صور بصمات األصابع ذات الجودة السيئة هي المشكلة األكبر تحديا في نظام التعرف على بصمة األصبع, لذلك
لسمات فعالة الستخراج بعض ا تقنيةفهي تحتاج الكثير من خطوات المعالجة لتحسين جودة الصورة, ومن ثم بحاجة الى
ج في اآلونة األخيرة على نظام واسع في استخراالحلول ة. لقد تم استخدام تقنيات التحليل المتعددالمميزة في الصورة
ة في الهويالسمات المميزة في أنظمة التعرف الحيوية, حيث من الممكن استخدام هذه السمات كعالمات فارقة لتحديد
هذه الرسالة هو تطوير نظام فعال ومتكامل للتعرف على بصمة األصبع الهدف من ان التعرف على بصمات األصابع.
مات ستطيع التعامل مع الجودة الرديئة لصور بصيوحتى لصور بصمات األصابع المنخفضةيستطيع التعامل مع الجودة
يحتوي .ةات الفارقاالصبع والمليئة بالعديد من التحديات, ال بد من توفر نظام معالجة قوي ونظام فعال الستخداج السم
نظام المعالجة على العديد من العمليات الضروية مثل : تعديل ازاحة الصورة, فصل أجزاء الصورة, وتحسين جودة الصورة.
المعتمدة على و لقد قمنا بتطوير تقنية مشهورة لتحسين جودة الصورة, حيث قمنا باستبدال عملية فصل أجزاء الصورة
الحلول ة, أيضا لقد قمنا باستخدام تقنيات التحليل المتعددتعتمد على عمليات الشكليات أخرى جديدةبتقنية خريطة الطاقة
, وتحويل القص المصغر (Wave Atomsتحويل موجة الذرة ) ,(Curveletى المصغر)ن: تحويل المنحمثل
(Shearlet) تصنيفات. باستخدام تقنيات الالستخراج سمات مميزة للصورة بطريقة جديدة, حيث يتم تصنيف هذه السمات
وتصنيف العدد ,(Minimum Distance Classifierتصنيف الحد األدنى للمسافات ) والتي قد استخدمنا منها:
(, Self-Organizing Map(, وتصنيف خريطة التنظيم الذاتي )K-Nearest Neighbourاألقرب للجيران )
لقد قمنا بالمقارنة بين تقنيات التصنيفات المستخدمة . و(Support Vector Machineوتصنيف دعم آلة المتجهات )
من قاعدة بيانات لصور ماختيارهوالذين تم شخص 114قمنا بفحص طريقتنا على ووبين تقنيات استخراج السمات.
وقمنا بتحقيق معدل التعرف بنسبة (, CASIA- FingerprintV5وتسمى ) دياتحبصمات األصابع مليئة بالت
99.5%
القص المصغر, وتحويلالمتعدد, استخراج السمات الفارقة, التعرف على بصمات األصبع, تقنيات التحليل كلمات مفتاحية:
., قاعدة بيانات سيئة لبصمات األصبع, تحسين جودة الصورةتحويل موجة الذرةتحويل المنحنى المصغر,

V
إن ﴿ وا عن سبيل الل موالهم لصد
ين كفروا ينفقون أ ال
ين كفروا إل ة ثم يغلبون وال فسينفقونها ثم تكون عليهم حسون ي ب ويجعل البيث (36)جهنم يش البيث من الط لمزي الل
ولئك هم بعض فيكمه جيعا فيجعله ف جهنم أ بعضه لع
ون ﴾الاس
36-37] :األنفال [

VI
Dedication
This thesis work is dedicated to the spirit of my dear Father, I ask God Almighty to
reward him richly rewarded, and to my dear Mother, who has been a constant source
of support and encouragement during the challenges of graduate school and life. I am
truly thankful for having you in my life. This work is also dedicated to my wife, who
have always loved me unconditionally and whose good examples have taught me to
work hard for the things that I aspire to achieve. Dedication is connected also to my
children who ask God to their benefit Islam and Muslims.

VII
Acknowledgment
First, I would like to thank ALLAH for his great support to me in
accomplishing this work.
I would like to express my deepest gratitude to Dr. Mohammed Alhanjouri
for suggesting of the point of research, and his great efforts revising the
thesis. I cannot express my thanks to him for his care and guidance that started
long time ago during my Master of Computer Engineering degree.
I would like also to thank the person who encourage me to join the master
degree Dr. Wesam Ashour, and his great efforts during the master study.
I would like also to express my deepest gratitude for my dear mother
for her patience, great support and encouragement during the most critical
stages of the thesis. I thank her for taking responsibility of my daughter
and my son providing me with full means of comfort to concentrate well
in my work.
Last but not least, I would like to thank my lovely wife for her care, patience,
and encouragement during the thesis development. In fact, I do not find
the words that would fairly express my thankfulness and gratitude to her
VIII
Table of Content
Declaration ................................................................................................................ II
Abstract ..................................................................................................................... III
Dedication ................................................................................................................. VI
Acknowledgment ..................................................................................................... VII
Table of Content .................................................................................................... VIII
List of Tables .............................................................................................................. X
List of Figures ........................................................................................................... XI
List of Abbreviations ............................................................................................ XIII
Chapter 1 Introduction .............................................................................................. 1
1.1 Background and Context .................................................................................... 2
1.1.1 Fingerprint Representation .............................................................................. 2
1.1.2 The Identification Processes ............................................................................ 4
1.1.2.1 Pre-processing Stage ..................................................................................... 4
1.1.2.2 Feature Extraction Stage ............................................................................... 4
1.1.2.3 Classification Stage ....................................................................................... 5
1.2 Scope and Objectives .......................................................................................... 6
1.3 Signification ........................................................................................................ 8
1.4 Limitations ........................................................................................................ 8
1.5 Benchmarks ....................................................................................................... 8
1.6 Overview of Thesis ............................................................................................. 9
Chapter 2 Literature Review ................................................................................... 11
2.1 Pre-processing Techniques for Fingerprint Image Recognition System .......... 12
2.1.1 Fingerprint Image Enhancement .................................................................... 12
2.1.2 Fingerprint Image Alignment ........................................................................ 17
2.1.3 Core Point Detection ...................................................................................... 19
2.2 Feature Extraction Techniques for Fingerprint Images Recognition System ... 21
2.3 Classification Techniques for Fingerprint Images Recognition System .......... 24
Chapter 3 Fingerprint Pre-processing Techniques ............................................... 29
3.1 Alignment Techniques ...................................................................................... 29
3.2 Fingerprint Enhancement Techniques .............................................................. 33
3.3 Core Point Detection ......................................................................................... 37
3.4 The Proposed Methodology of Fingerprint Pre-processing Stage .................... 39
Chapter 4 Feature Extraction Techniques ............................................................. 41

IX
4.1 Digital Curvelet Transform ............................................................................... 43
4.2 Wave Atoms Transform .................................................................................... 48
4.3 Shearlet Transform ........................................................................................... 53
4.3.1 Continuous Shearlet Transform ..................................................................... 53
4.3.2 Discrete Shearlet Transform .......................................................................... 55
4.5 The Used Methodology of Fingerprint Feature Extraction Stage ..................... 55
Chapter 5 Classification Techniques....................................................................... 58
5.1 Minimum Distance Classifier ........................................................................... 60
5.2 K-Nearest Neighbors ........................................................................................ 61
5.3 Self Organizing Map (SOM) ............................................................................ 61
5.4 Support Vector Machine (SVM)....................................................................... 65
Chapter 6 Results and Discussion ........................................................................... 69
6.1 Pre-processing Results ...................................................................................... 69
6.1.1 Alignment Results .......................................................................................... 69
6.1.2 Enhancement Process Results ........................................................................ 72
6.1.3 Core Point Result and Cropped Area ............................................................. 75
6.2 Feature Extraction Results ................................................................................ 78
6.3 Fingerprint Database: ........................................................................................ 79
6.4 Matching Techniques Results ........................................................................... 80
6.5 Comparison with Other Works ......................................................................... 84
Chapter 7 Conclusions and Future Work .............................................................. 89
7.1 Conclusions ....................................................................................................... 89
7.2 Future Work ...................................................................................................... 91
References .................................................................................................................. 94

X
List of Tables
Table (3.1): Pseudocode for locating the TFCP based on fingerprint mask image ... 32
Table (3.2): Pseudocode for determining the realignment direction of a rotated
fingerprint ................................................................................................................... 33
Table (3.3): Pseudocode for determining the realignment angle of a rotated
fingerprint. .................................................................................................................. 33
Table (3.4): Pseudocode for Fingerprint Image Enhancement using STFT
Analysis ...................................................................................................................... 37
Table (6.1): Features vector corresponding to the used multiresolution transform.. . 79
Table (6.2): Fingerprint recognition results ............................................................... 80
Table (6.3): Fingerprint recognition results after using the PCA .............................. 83
Table (6.4): Suggested Models for Fingerprint Recognition System ........................ 85
Table (6.5): Comparison between several works done in CASIA-FingerprintV5
database and ours ........................................................................................................ 86
XI
List of Figures
Figure (1.1): Overview over different features detectable in a fingerprint image…...3
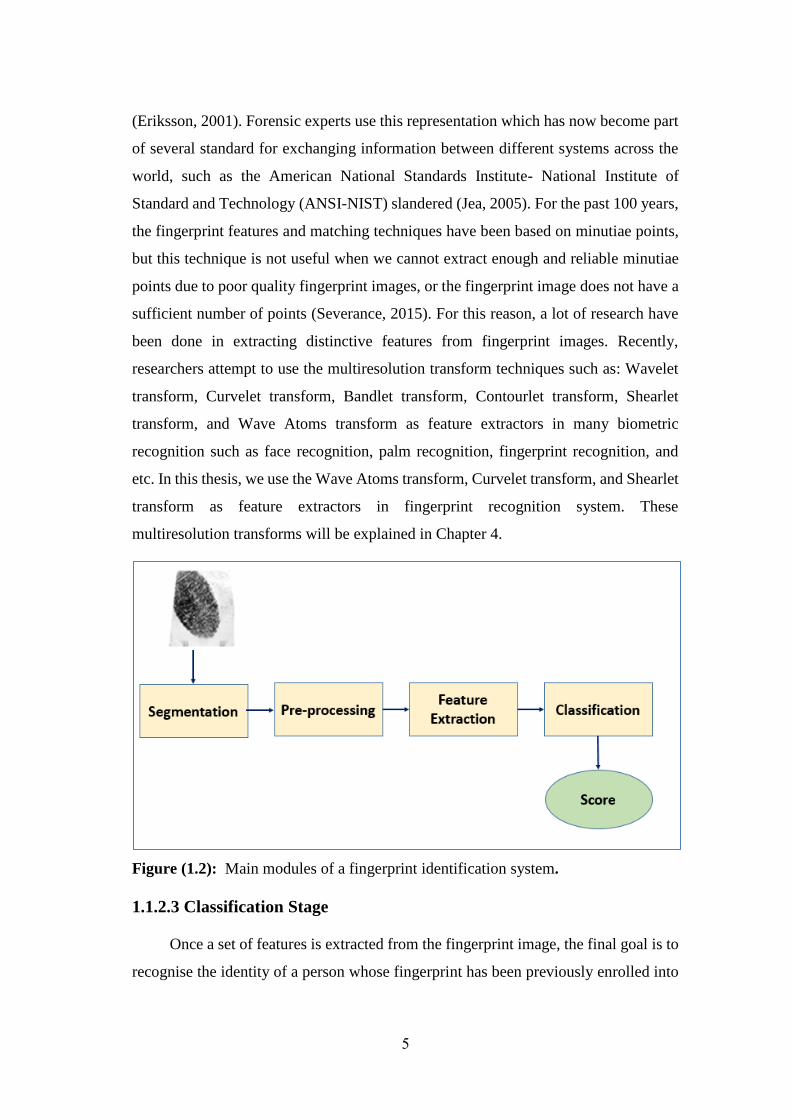
Figure (1.2): Main modules of a fingerprint identification system. ........................... 5
Figure (3.1): Fingerprint segmentation. ................................................................... 31
Figure (3.2): Determining the re-alignment angle. ................................................... 32
Figure (3.3): Local region in a fingerprint image and its surface wave approximation
and its fourier spectrum of the real fingerprint and the surface wave. ....................... 34
Figure (3.4): The Spectral Window parameters. ..................................................... 35
Figure (3.5): The six major fingerprint classes: (a) Arch, (b) Tented Arch, (c) Left
Loop, (d) Right Loop, (e) Whorl, and (f) twin loop. .................................................. 37
Figure (3.6): Core point locations in some fingerprint classes .................................. 38
Figure (3.7): Complex Filter Patterns. ....................................................................... 39
Figure (3.8): The Proposed Methodology of Pre-processing stage of AFIS ............. 39
Figure (4.1): Approximation schemes with isotropic and anisotropic basis
elements. ..................................................................................................................... 42
Figure (4.2): Curvelets in Fourier frequency and spatial domain. ............................. 43
Figure (4.3): Curvelet Frequency Tilling. ................................................................. 44
Figure(4.4): Alignment of curvelets along curved edges. ........................................ 46
Figure (4.5): Discrete localizing window before and after Wrapping. ...................... 48
Figure (4.6): Wave Atoms Transform in spatial space and in frequency space. ....... 50
Figure (4.7): Identification of various transforms as (𝜶, 𝜷) families of wave
packets. ....................................................................................................................... 51
Figure(4.8): Frequency support of shearlets for various values of a and s. .............. 54
Figure(4.9): Tilling of frequency domain induced by discrete shearlets. ................. 55
Figure(4.10): The Proposed Methodology of Feature Extraction stage of AFIS ...... 56
Figure (5.1): Common forms of SOM lattice. ........................................................... 62
Figure (5.2): Training process of hexagonal SOM. ................................................... 65
Figure (5.3): Support vector machine with linear separable data .............................. 66
Figure (6.1): Image Rotation result according to image segmentation in the original
algorithm. .................................................................................................................... 70
Figure (6.2): Image Rotation result according to image segmentation in the modified
algorithm. .................................................................................................................... 71
Figure (6.3): Enhancement result of both the original technique and the modified
one. .............................................................................................................................. 73
Figure (6.4): Enhancement result of some dry fingertip samples for both the original
technique and the modified one. ................................................................................. 74
XII
Figure (6.5): Enhancement result of the humidity in some fingerprint samples for
both the original technique and the modified one. ...................................................... 75
Figure (6.6): The results of detection the core point. ................................................ 76
Figure (6.7): The results of detection the core point in left loop and right loop
fingerprint image classes. ........................................................................................... 77
Figure (6.8): The results of detection the core point in whorl fingerprint class. ....... 77
Figure (6.9): The results of cropping 128x128 region around the core point. ........... 78
Figure (6.10): Fingerprint recognition results of cropped size of 128x128. .............. 81
Figure (6.11): Fingerprint recognition results of cropped size of 64x64. .................. 82
Figure (6.12): Fingerprint recognition before and after using PCA. ......................... 84

XIII
List of Abbreviations
2DPCA Two-Dimensional principal components analysis
AFIS Automatic Fingerprint Identification Systems
ANSI-NIST The American National Standards Institute- National
Institute of Standard and Technology
ATM Automated Teller Machine
BPNN Back Propagation Neural Network
BMP Bitmap Images
B2DPCA Bidirectional Two-Dimensional Principal Component
Analysis
CASIA Chinese Academy of Sciences' Institute of Automation
CLAHE Contrast Limited Adaptive Histogram Equalization
DWT Discrete Wavelet Transform
DCT Discrete Cosine Transform
ERR Equal Error Rate
ELM Extreme Learning Machine
EBFNN Ellipsoidal Basis Function Neural Network
FAR False Acceptance Rate
FFT Fast Fourier Transform
FRR False Rejection Rate
FVC Fingerprint Verification Competition
GGD Generalized Gaussian density
KNN K-Nearest Neighbour
HMM Hidden Markov Model
LL Left Loop fingerprint class
MI Mutual Information
MLP Multilayer Perceptron
NIST National Institute of Standards and Technology
PA Plain Arch fingerprint class
PCA Principle Component Analysis
PPI Pixel Per Inch
PSO Particle Swarm Optimization
PZM Pseudo-Zernike Moments
ROI Region Of Interest
RL Right Loop fingerprint class
RBFN Radial Basis Function Network
STFT Short Time Fourier Transform
SVM Support Vector Machine
SVD Singular Value Decomposition
TA Tented Arch fingerprint class
TFCP True Fingerprint Centre Point

XIV
Chapter 1
Introduction
1
Chapter 1
Introduction
As our everyday life is getting more and more computerized, the authentication
systems are getting more and more important. Authentication is the determination of
the identity or the role that someone has. This determination can be done in a number
of different ways, but it is usually based on a combination of something the person has
(like a smart card), something the person knows (like a password), or something the
person is (like a human with a fingerprint). The current user's authentication models
are divided into three categories: knowledge-based authentication, token-based
authentication, and the biometric authentication. The knowledge-based authentication
can be a text-based password or a graphical password, which both depends on
something the user knows (i.e. PIN, or password), so it suffers from many problems,
such as it can be forgotten or stolen or guessed. The token-based authentication may
be a physical device that an authorized user of the computer services is given to make
the authentication easier. An example of the token is the bank cash card. Tokens can
be easily stolen and used for malicious purposes. The biometric authentication includes
behavioural biometrics such as the keystroke latency or signature dynamics, and
physiological characteristics that study physical characteristics such as the fingerprint,
voice or vein pattern. The biometrics cannot be easily changed and they are easy to
manage (Hamad & Abudalal, 2016).
A biometrics system is a pattern recognition system that establishes the
authenticity of a specific physiological or behavioural characteristic possessed by a
user (Eriksson, 2001). However, each biometric has its strengths and weakness, and
the choice depends on the used application. No single biometric is expected to meet
the requirement of all applications. The various biometrics are compared in many
researches, and the fingerprint recognition has a very good balance of all the desirable
properties (Jalutharia, 2010).
Recently, using biometrics in recognition of persons is an emerging phenomenon
in modern society, due to the wide need of security in many applications.
2
1.1 Background and Context
Scientific studies in the mid-1800’s proved two critical characteristics of
fingerprint: the uniqueness and the persistence. The uniqueness means that every
fingerprint from different fingers has its own ridge pattern. The persistence means that
the fingerprint ridge patterns do not change throughout the life. These studies led to
the use of fingerprints for criminal identification, and with the development of
technology, an Automatic Fingerprint Identification Systems (AFIS) are deployed
widely throughout the world, and used for many applications.
Fingerprint has several advantages over the other biometrics, such as: high
university, high distinctiveness, high performance, easy collectability, high
permanence, and wide acceptability (Jalutharia, 2010). The popularity of fingerprint
recognition system is due to the low price of fingerprint sensors, simplicity to use, and
good performance. Today, fingerprint identification system is included in Apple’s
latest iPhone, which is an important step in bringing biometrics to the mainstream
(Lewis, 2014).
1.1.1 Fingerprint Representation
There are three levels of information which can be collected from fingerprint,
which are categorised as: level 1, Level 2, and Level 3 (Rawat, 2009). Level 1 is the
global level, and exhibits the regions where the ridge lines make distinctive ridge
shapes, such as: singular points which contain arch, loop, and whorl structures, ridge
orientation map which is the local direction of the ridge-valley structure, and ridge
frequency map which is the inter-ridge distance. The information or the features
gathered from this type cannot be used to identify the fingerprints, but it can be useful
for fingerprint classification. The second level is named the local level or Galton
characteristics or minutiae, which are the ridge endings and the ridge bifurcations, as
shown in Figure 1.1. The ridge endings is the points where a ridge ends, and the ridge
bifurcations is the points where a ridge forks or diverges into branch ridges. Minutiae
are the most prominent features that can be used to uniquely identify the fingerprints,
but the location and direction of minutiae alone are not sufficient to achieve high
recognition rate, because of the variations caused by the flexibility and the elasticity
of fingerprint skin, furthermore the minutiae is sensitive to rotation and translation of

3
fingerprint (Wu., 2007). The third level is the fine intra ridge details level, which are
the sweat pores and the ridge contour. The features gathered from this level are highly
distinctive, but they rarely used since extracting this information requires very high
resolutions, and good quality fingerprint images, but they rarely used since extracting
this information requires very high resolutions, and good quality fingerprint images.
Figure (1.1): Overview over different features detectable in a fingerprint image.
Quoted from (Pober, 2010)
Depending on the application context, a fingerprint recognition system may be
called either a verification system or an identification system (Amira, 2011):
1. A verification system authenticates a person’s identity by comparing the
captured fingerprints with his own pre-stored biometric templates in the
system. It conducts one-to-one comparison to determine whether the
identity claimed by the individual is true.
2. An identification system recognizes an individual by searching the entire
template database for a match. It conducts one-to-many comparisons to
establish the identity of the individual.
In this thesis, we will deal with the identification problem using fingerprint. The
identification process contains two modules; the first one is the enrolment module, in
which the fingerprint image is captured, processed, some features will be extracted,
and finally these features are stored in the database. The second one is the
authentication module, in which the fingerprint image is captured, processed, some

4
features will be extracted, and finally the features are compared with all features in the
database to match or mismatch.
1.1.2 The Identification Processes
The identification process contains several stages, which are common in
construction and organization as all biometric systems. After collecting the data, the
fingerprint images, the process of identification can be divided into the following
stages as shown in Figure 1.2:
1.1.2.1 Pre-processing Stage
Fingerprint image quality is an important factor in the performance of AFIS.
Extracting reliable features from poor quality fingerprint images is not an easy task.
Major causes for degradation of fingerprint image quality include the physiological
condition of fingers friction skin, performance of the capture devices (device
reliability, consistency, degradation of sensing elements, image resolution, signal-to-
noise ratio, etc.), acquisition environment (external light, temperature and humidity
weather conditions), user/device interaction, cleanliness of device surface, acquisition
pressure, and contact area of the finger with the scanner. Thus, current fingerprint
recognition technologies are vulnerable to poor quality images (Wu., 2007).
In most cases this stage contains the alignment and the enhancement processes.
The alignment process deals with the problems of image transition, image orientation,
and image scale. The enhancement process contains several processes to enhance the
clarity and the structure of the fingerprint image, and eliminate the noise. This stage
will be explained in Chapter 3. In this thesis we will deal with a very poor, and a very
challenges fingerprint database.
1.1.2.2 Feature Extraction Stage
In this stage, we need to use a sufficient feature extractor algorithm to give
distinctive features. There are over 150 known local ridge characteristics in fingerprint,
which can be used for identification process. The most popular characteristics are
called minutiae points which are the ridge endings, and the ridge bifurcations. A good
quality fingerprint typically contains somewhere in between 40 and 100 minutiae
5
(Eriksson, 2001). Forensic experts use this representation which has now become part
of several standard for exchanging information between different systems across the
world, such as the American National Standards Institute- National Institute of
Standard and Technology (ANSI-NIST) slandered (Jea, 2005). For the past 100 years,
the fingerprint features and matching techniques have been based on minutiae points,
but this technique is not useful when we cannot extract enough and reliable minutiae
points due to poor quality fingerprint images, or the fingerprint image does not have a
sufficient number of points (Severance, 2015). For this reason, a lot of research have
been done in extracting distinctive features from fingerprint images. Recently,
researchers attempt to use the multiresolution transform techniques such as: Wavelet
transform, Curvelet transform, Bandlet transform, Contourlet transform, Shearlet
transform, and Wave Atoms transform as feature extractors in many biometric
recognition such as face recognition, palm recognition, fingerprint recognition, and
etc. In this thesis, we use the Wave Atoms transform, Curvelet transform, and Shearlet
transform as feature extractors in fingerprint recognition system. These
multiresolution transforms will be explained in Chapter 4.
Figure (1.2): Main modules of a fingerprint identification system.
1.1.2.3 Classification Stage
Once a set of features is extracted from the fingerprint image, the final goal is to
recognise the identity of a person whose fingerprint has been previously enrolled into

6
the system. The matching mechanism is the responsible to provide a likeliness score
between two fingerprints. Fingerprint matching is a crucial step in both verification
and identification problems. Roughly, a fingerprint matching algorithm compares two
fingerprints and returns either a degree of similarity or a hard output (matched or non-
matched). Two fingerprints are called genuine if they represent the same finger, and
impostor when they are different.
In this thesis we will use several types of classifiers: the Minimum Distance
Classifier (MD), K-Nearest Neighbour (KNN), Self-Organization Map (SOM), and
Support Vector Machine Classifier (SVM). These techniques will be explained in
Chapter 5.
1.2 Scope and Objectives
Fingerprint recognition is a complex pattern recognition problem. It is difficult
to design a complete and robust fingerprint recognition system especially when dealing
with poor quality fingerprint images. Fingerprint recognition is still a challenging and
important recognition problem, due to the following challenges:
1. The high displacement and rotation which make an overlap between the
query and the template fingerprint image.
2. Different pressure of fingertips
3. Different skin conditions of fingertips
4. Non-linear distortion caused by finger plasticity
5. Wounds and cutting in fingertips caused by hard worker people.
The aim of this research is to make more robust and reliable fingerprint
recognition system by using an efficient feature extraction and matching techniques.
In this research we will achieve the following contributions:
Most researchers tested their approaches on clear fingerprint database,
almost noisy database, or artificial one. Furthermore, researchers who
used the multiresolution techniques, tested their approaches on small
databases (10-30 subjects), and they suggested to increase the number of
their databases. We test our approach on a large real noisy database (Test
Biometrics Ideal, 2010). We choose a very challenge database to be our
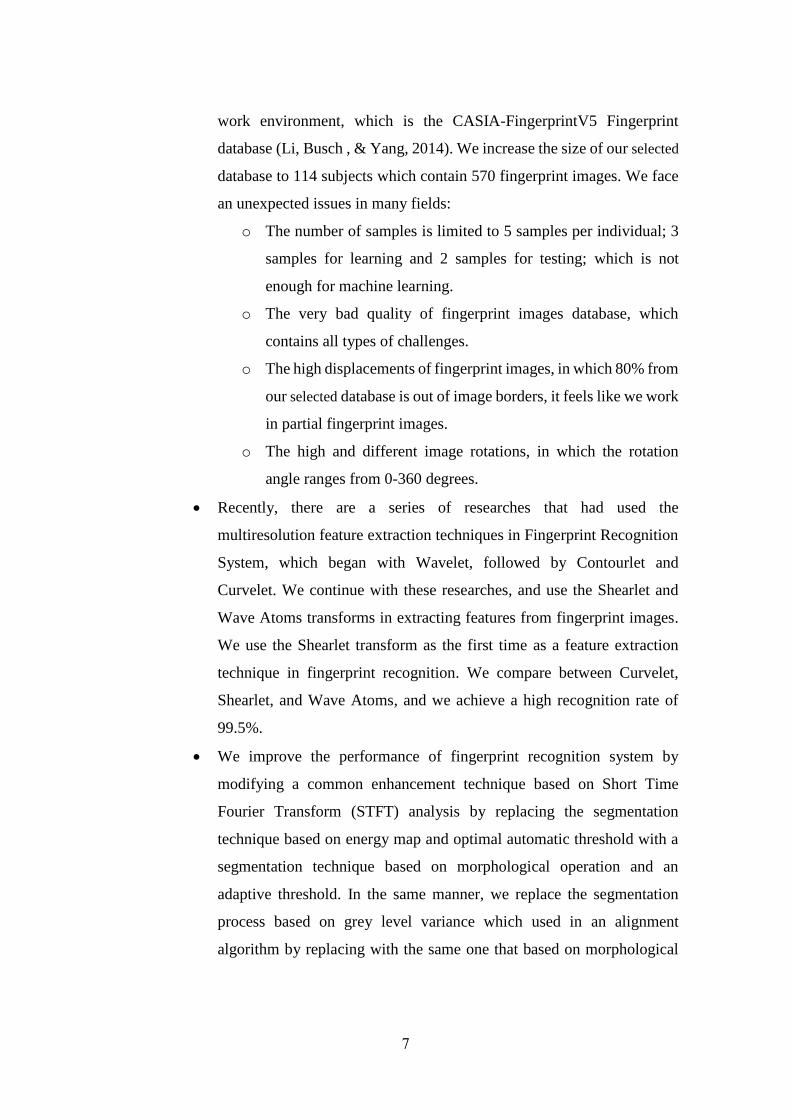
7
work environment, which is the CASIA-FingerprintV5 Fingerprint
database (Li, Busch , & Yang, 2014). We increase the size of our selected
database to 114 subjects which contain 570 fingerprint images. We face
an unexpected issues in many fields:
o The number of samples is limited to 5 samples per individual; 3
samples for learning and 2 samples for testing; which is not
enough for machine learning.
o The very bad quality of fingerprint images database, which
contains all types of challenges.
o The high displacements of fingerprint images, in which 80% from
our selected database is out of image borders, it feels like we work
in partial fingerprint images.
o The high and different image rotations, in which the rotation
angle ranges from 0-360 degrees.
Recently, there are a series of researches that had used the
multiresolution feature extraction techniques in Fingerprint Recognition
System, which began with Wavelet, followed by Contourlet and
Curvelet. We continue with these researches, and use the Shearlet and
Wave Atoms transforms in extracting features from fingerprint images.
We use the Shearlet transform as the first time as a feature extraction
technique in fingerprint recognition. We compare between Curvelet,
Shearlet, and Wave Atoms, and we achieve a high recognition rate of
99.5%.
We improve the performance of fingerprint recognition system by
modifying a common enhancement technique based on Short Time
Fourier Transform (STFT) analysis by replacing the segmentation
technique based on energy map and optimal automatic threshold with a
segmentation technique based on morphological operation and an
adaptive threshold. In the same manner, we replace the segmentation
process based on grey level variance which used in an alignment
algorithm by replacing with the same one that based on morphological

8
operation which enhance the alignment process because of smoothing the
segmentation contour.
1.3 Signification
A wide variety of applications require reliable authentication system to confirm
the identity of individuals ,and to keep their personal information more secured from
impostor users, and let only the genuine users to access their services more secure.
Examples of such applications include secure access to buildings, computer systems,
laptops, cellular phones and ATMs. Security systems based on biometrics have an
advantage characteristics over the other. Fingerprint have been a precious tool for low
enforcement, forensics and recently in commercial use for over a century. Using
fingerprints in security purposes is proved to be reliable and efficient due to the high
uniqueness and persistence properties, but building an efficient automatic fingerprint
recognition system depends on the quality of input fingerprint image, and the feature
extraction algorithm. Recognition of the fingerprint becomes a complex computer
problem while dealing with noisy and low quality images.
In this thesis we are going to improve an automatic fingerprint recognition
system of noisy and low quality images, and introduce the use of modern
multiresolution techniques as a feature extractors, which will be helpful for improving
the performance of recognition system
1.4 Limitations
This thesis is limited to the extent that only 570 fingerprint images are only
considered. Furthermore, we eliminate the fingerprint images which do not have a
reference point (Arch). In addition, we eliminate the fingerprint image which needs a
rotation angle more than 90 degree.
1.5 Benchmarks
To test our new methodology of an automatic fingerprint recognition system
on a very challenges fingerprint database, we select CASIA Fingerprint Image
Database Version 5.0 (or CASIA-FingerprintV5). The volunteers of CASIA-
FingerprintV5 include graduate students, workers, waiters, etc. Each volunteer

9
contributed 40 fingerprint images of his eight fingers (left
and right thumb/second/third/fourth finger), i.e. 5 images per finger. The fingerprint
images of CASIA-FingerprintV5 were captured using URU4000 fingerprint sensor in
one session. The volunteers were asked to rotate their fingers with various levels of
pressure to generate significant intra-class variations. All fingerprint images are 8 bit
grey-level BMP files and the image resolution is 328*356 (Test Biometrics Ideal,
2010).
1.6 Overview of Thesis
This thesis is presented in seven chapters, and organized as follows:
Chapter 1 introduces the needs of biometrics in our life, and the advantages of
using biometrics in authentication process, also give a brief introduction about
the fingerprint recognition systems, and the presentation of fingerprint.
Chapter 2 presents the literature review on the fingerprint recognition systems.
The first section presents the research done in image pre-processing stage,
which includes: the orientation map estimation, filtering, alignment, and core
point detection. The second section presents the research done in feature
extraction techniques, and the last section presents the research done in
classification techniques.
Chapter 3 explains our used methodology in fingerprint pre-processing stage,
which includes fingerprint alignment technique, fingerprint enhancement
based on STFT analysis, and our slight modification in segmentation process,
and finally it presents the core point detection technique of fingerprint images.
Chapter 4 explains the feature extraction techniques, which are used in this
thesis, and namely: Curvelet, Wave Atoms, and Shearlet multiresolution
techniques.
Chapter 5 explains a brief introduction about the matching or the classification
techniques, which are used in this thesis, and namely: MD, KNN, SOM, and
SVM.
Chapter 6 shows the obtained results of our methodology, and discuses some
related points
Chapter 7 presents the conclusions and the future work.

10
Chapter 2
Literature Review
11
Chapter 2
Literature Review
The first stage of fingerprint identification is the pre-processing stage which
contains image alignment and image enhancement processes and both are based on
reliable segmentation process, will directly affects the result of fingerprint
identification.
There are dozens of techniques which are proposed in fingerprint enhancement
and matching. Most of them have no difficulty in matching good quality fingerprint,
but matching low quality fingerprint remains a challenging problem (Chaudhari &
Patil, 2013).
Good quality fingerprint image has high contrast and well defined ridges and
valleys, while poor quality fingerprint is marked by low contrast and ill-defined
boundaries between the ridges and valleys. There are some factors of the uneven force
and collection environment that degrade the quality of fingerprint image (Chikkerur,
Cartwright, & Govindaraju, 2007; Hong, Wang, & Jain, 1998; Khan, Khan, &
Muhammad, 2010):
Presence of creases, bruises or wounds may cause ridge discontinuities.
A dry skin can cause inconsistent contact of finger ridges with scanner surface
causing broken ridges and low contrast ridges.
Oily or wet skin make the valleys tends to fill up.
Moister can cause the valleys to appear dark similar to ridge structure
Sweat on fingerprints leads to smudge marks and connects parallel ridges.
Variations in impression conditions, ridge configuration.
These factors lead to poor quality fingerprint images, in which the ridge
structures are not always defined and detected. In order to facilitate the extraction of
the fingerprint feature points, an effective pre-processing step for fingerprint images
is essential. The pre-processing steps usually include: fingerprint image normalization,
segmentation, ridge orientation estimation, ridge frequency estimation, filtering
techniques, binarization, thinning (Hong, Wang, & Jain, 1998; Jia, 2012), and
alignment. These processes are often employed to reduce the noise and enhance the
12
contrast between ridges and valleys and even get better matching score by
incorporating enhancement prior to feature extraction. A combination between these
steps may lead to image enhancement.
We divide this chapter into three main parts: the first part summarizes the
research done in the pre-processing stage, while the second part describes the feature
extraction techniques, and the final one presents the classification techniques.
2.1 Pre-processing Techniques for Fingerprint Image Recognition System
This section summarizes the works done in image pre-processing stage of
fingerprint image recognition, which includes different steps. According to our
research, we divide this stage into 3 parts: the first part is the enhancement part, which
contains a series of steps to achieve its goal. The second part is the alignment step, and
the last one is the core point detection step.
2.1.1 Fingerprint Image Enhancement
Fingerprint image enhancement can be conducted on either a binary ridge image
or a grey level image (Hong, Wang, & Jain, 1998). A binary ridge image is an image
where all the ridge pixels are assigned a value of 1 and the non-ridge pixels are
assigned a value of zero. Binarization before enhancement often generates more
spurious minutiae structures and lose some true ridge structure, therefore enhancement
of binary ridge image has its inherent limitations, and therefore most enhancement
algorithms are performed on grey images directly (Baghelani, Eshkaftaki, & Ebrahimi,
2010).
Binarization method contains several processes such as: histogram equalization,
Wiener filtering, binarization and thinning. The aim of using histogram equalization is
to uniform the intensity distribution of grey level image, but the use of histogram
equalization in fingerprint enhancement dose not give the required enhancement, and
does not suitable for extracting minutiae from enhanced image (Rajinikannan, Kumar,
& Muthuraj, 2010). A comparison study between three enhancement techniques was
proposed in (Namburu & Praveen, 2007). They compared between the histogram
equalization, FFT enhancement, and Gabor filter. The results showed that
enhancement using Gabor filtering is more reliable and efficient than the others.
13
Similarly the use of contrast limited adaptive histogram equalization (CLAHE)
(Kumar & Verma, 2012) gave a poor recognition rate of 70-75%. Some researchers
attempted to use the optimization algorithms to maximize the information content of
the enhanced image with intensity transformation function in order to enhance the
contrast and minutiae detail in a fingerprint image such as using the Particle Swarm
Optimization (PSO) (Stephen, Reddy, & Vasavi, 2013), and Bat algorithm (Bouaziz,
Draa, & Chikhi, 2015).
There are many techniques are proposed to enhance the grey level image. One
of the most common approach for fingerprint image enhancement and still used today
is the algorithm of Hong et al. (Hong, Wang, & Jain, 1998). The main steps of their
algorithm were the following processes: normalization, local orientation estimation
which based on gradient method, local frequency estimation, region mask estimation,
and filtering with a bank of symmetric Gabor filters, which was designed according to
image orientation and frequency. The algorithm was tested on 50 poor quality
fingerprint images, and they achieved an improvement results.
Researchers tried to improve Hong's et al. algorithm by improving one or more
of their main processes with various ideas. These improvements concentrated on local
orientation estimation and filtering.
Estimating the ridge orientation map is an important step in enhancement
process. The local ridge orientation can be estimated either on a square grid block or
less reliable on every pixel position in fingerprint image. There were much work done
in improving ridge orientation estimation. An approach is based on Median filter-
Mehtre method (Wang, Zhag, Liu, & Yu, 2011) which depended on dividing the
fingerprint direction into 8 directions, computing the median grey of all directions at
each pixel, then estimating the minimum grayscale variation along all 8 ridge
directions.
The orientation map was estimated in each pixel in (Chakraborty & Rao., 2012)
by centring a window of size (32x32) at the point where the orientation was to be
estimated, the window was rotated to 16 different orientations, and at each orientation
a projection along the y-axis of the window was formed, so the projection with greatest
14
variation correspond to the local ridge orientation in this window. The drawback of
this solution is it cannot deal with noisy regions.
Recently, a new approach based on Wave Atom decomposition is proposed by
(Boutella & Serir, 2013) to estimate the orientation image. They compared their results
with the gradient based algorithm by human vision.
Filtering is an important step in fingerprint enhancement process. After ridge
orientation have been estimated, filtering has to be applied to image to correct false
estimation. Although the Gabor filters have an important properties from a signal
processing perspective, the Gabor filter based approach has some errors in orientation
estimation, and propagate to ridge frequency estimation leading to imperfect
reconstruction (Chikkerur, Cartwright, & Govindaraju, 2007; Hu, Jing, Zhan, & Zhu,
2010), this is due to bandwidth limitation of Gabor filter (Wang, Li, Huang, & Feng,
2008).
Instead of having used Gabor filter in spatial domain, the proposed algorithm in
(Namburu & Praveen, 2007), used the Gabor filter in Wavelet domain. Their idea was
that the fingerprint approximation of subimage contained fewer noises than in spatial
domain, and hence computing the orientation image is more reliable.
Some researchers tried to solve the limitations of traditional Gabor filtering, such
as using log-Gabor filtering instead of Gabor filter (Wang, Li, Huang, & Feng, 2008),
using a modified Gabor filtering with adaptive parameters (Yang, Liu, Jiang, & Fan,
2003), using fast Gabor filtering (Wang & Sun, 2010), using the anisotropic filter
instead of Gabor (Greenberg, Aladjem, Kogan, & Dimitrov, 2000), using a series of
notch filter high-pass filter and Gabor filter (Khan & Zakirullah, 2010), and using
directional morphological filter (Wang, Zhag, Liu, & Yu, 2011).
However 2D convolution of an image using Gabor filter, or Log-Gabor filter
contributes to high computational complexity due to the filter components used in
designing the filter (Dyre & Sumathi, 2014).
One of the most popular fingerprint image enhancement techniques is based on
Short Time Fourier Transform (STFT) analysis and contextual filtering in the Fourier
domain was proposed in (Chikkerur, Cartwright, & Govindaraju, 2007; Chikkerur,
Wu, & Govindaraju, 2004). The algorithm had several advantages that the ridge
15
orientation, ridge frequency, and region mask (segmentation) were estimated
simultaneously from STFT analysis. This would prevent errors in ridge orientation
estimation from propagating to other stages. Furthermore, the estimation was
probabilistic and therefore was more robust. The results showed that the proposed
algorithm had better than Hong in recognition rate of over a set of 800 images in
FVC2002 DB3 database. This algorithm is explained in Chapter 3.
An enhancement algorithm based on combination of STFT technique and Gabor
filter was proposed in (Hu, Jing, Zhan, & Zhu, 2010). The algorithm used the main
concept of (Chikkerur, Cartwright, & Govindaraju, 2007) to estimate the orientation
and frequency map of fingerprint image, but they changed the type of window, the size
of blocks, and the overlapping parameters. They did not depend on contextual filtering,
and instead they used Gabor filtering. They compared their results with Hong (Hong,
Wang, & Jain, 1998) algorithm, and got better results. They admitted that their
enhancement fingerprint image did not seem to be better than the enhancement
algorithm of (Chikkerur, Cartwright, & Govindaraju, 2007).
Several enhancement algorithms based on Wavelet transform are performed.
The proposed technique in (Saeed, Tariq, & Jawaid, 2011) included the following
steps: image segmentation, normalization, image sharpening, Gabor Wavelet filtering
to enhance the feature of sharpened image, binarization, and thinning. Experimental
results of their selected fingerprint images form FVC2004 database, showed a good
accuracy in enhancing the fingerprint image quality, but they did not refer to how they
estimated the quality of their enhancement. Another Wavelet based technique was
proposed in (Hsieh, Lai, & Wang, 2003). The main steps of their algorithm are:
segmentation, normalization, Wavelet decomposition, global texture filtering, local
directional compensation, and Wavelet deconstruction.
An enhancement algorithm that combined filtering in both spatial and frequency
domains was proposed in (Dyre & Sumathi, 2014). Fingerprint enhancement models
in (Babatunde, Charles, Kayode, & Olatubosun, 2012) included segmentation,
normalization, ridge orientation estimation, ridge frequency estimation, Gabor
filtering, binarization and thinning. They tested their solution on synthetic and real
16
fingerprint images. The results showed that with free or minimal noise level, the
algorithm performs well.
In (Rajinikannan, Kumar, & Muthuraj, 2010), the performance of three models
of image enhancement techniques was evaluated, and their impact in minutiae
detection were compared. These minutiae detection techniques were: a) The
Histogram Based Image Enhancement, b) The FFT filter Based Fingerprint Image
Enhancement, and c) The Gabor filter Based Fingerprint Image Enhancement. These
techniques were particularly very much different in the way of enhancing the input
image for minutiae detection. They compared the performance of image enhancement
algorithms using the number of minutiae in all the three cases with the values of a
human observer. Among the three evaluated fingerprint image enhancement
algorithms, the Gabor filter based algorithm performed very well. It was performed 5
to 6 times better than the other two algorithms
Similarly, a comparative study between six different enhancement techniques
was proposed in (Malwade, Raut, & Thakare, 2015). The first one was based on
Histogram Equalization. The second one was based on 2D Fourier transform and
Butterworth filter. The third one was based on Gabor filters. The forth one was based
on Gabor filters combined with Wavelet transforms. The fifth one was based on
directional filters. The last one was based on Laplacian-based pyramidal
decomposition (LPD). They computed the peak signal-to-noise ratio, and Equal Error
Rate (EER) for all the testing algorithms. The result showed that the LPD method and
Wavelet based enhancement have been given a slight better results.
Another comparative study between three different enhancing algorithms was
proposed in (Yusharyahya, Nugroho, Purnama, & Galinium, 2014) to evaluate the
effectiveness of fingerprint image enhancement. These algorithms included the use of
FFT, smoothing on the spatial domain, and contextual filtering using Gabor filters.
The result showed an improvements in enhancing poor quality fingerprint images in
frequency domain. Although the FFT produced the best result in enhancing fingerprint
images, it also introduced noise outside of the fingerprint image as a side effect of the
frequency domain process, which can be solved by using a better segmentation
algorithm. The enhancement based on Gabor filters worked well in good and
17
recoverable region of fingerprint image, but it leaved empty blocks in unrecoverable
regions. Algorithms based on only the spatial domain could not enhance minutiae
details in the fingerprint image.
A three-stage enhancement algorithm was proposed in (Kabir, Ahmad, &
Swamy, 2013) to enhance the quality of fingerprint images. The first-stage performed
diffusion filter on the computed orientation field to connect broken ridges. Although
it connected the broken ridges, it reduced the contrast of the image and failed to
separate the falsely conglutinated ridges. In the second stage, filtering was applied to
the enhanced image to remove the smears and scars, to separate the falsely ridges, and
to improve the contrast of the image. Although the second stage overcomes the
limitations of the first-stage, it produced black borders and created false minutiae in
the enhanced image. In the third-stage, an angular filter was applied to overcome the
shortcomings of the second-stage, and this enhanced the low-quality fingerprint
images to a large extent. The drawback of this solution is the complexity of its
procedures, which needs to compute several pre-processing techniques in addition to
their main process, such as normalization, orientation field estimation.
2.1.2 Fingerprint Image Alignment
In order to achieve high recognition rate when comparing fingerprint images or
even the features extracted from the fingerprint images, these images or features of
both the reference sample and the test one have to be aligned. There are three major
challenges involved in capturing fingerprint images: translation, rotation and scaling
(Li, Busch, & Yang, 2014). Fingerprint translation refers to the position of a captured
fingerprint with respect to the fingerprint image background, and for optimum
functionality of AFRS, the fingerprint should be positioned in the central area of the
fingerprint image background. Fingerprint rotation refers to the alignment of a
captured fingerprint image when measured against the image background, and for
optimum functionality of AFRS, the captured image should sit at an angle of
approximately 0 degrees (more or less upright) relative to the vertical axis (Msiza,
Leke-Betechuoh, & Malumedzha, 2011). The most effort of research of addressing
these challenges is focused on translation and rotation issues, because capturing
18
fingerprint images does not lead to scaling problem since most fingerprint images
could be scaled as per the dpi specification of the sensors.
Various techniques are proposed to solve the rotation problem, and each of them
has its advantages and disadvantages. One of them (Wegstein, 1982) depended on
finding both a core point and a delta point in the fingerprint image to estimate the re-
alignment angle. In particular the translation invariance is accomplished by locating
the reference point. The drawback of this solution in addition to the difficulty of
finding delta point, is that it will fail when dealing with Plain Arch (PA) fingerprint
class, which does not contain a core or delta point. Another instance where this
algorithm may fail, is when dealing with Tented Arch (TA) fingerprint class, which
has a single core and a single delta, with the core located almost directly above the
delta. Many singular point detection techniques, however, find it relatively difficult to
detect this delta point. Another instance where this method is likely to fail is when
dealing with the Left Loop (LL) and the Right Loop (RL) fingerprint classes. Although
these classes of fingerprint have both the core point and the delta point, in most cases
the delta point is not captured.
Because of the problem of finding a reference point in the Plain Arch fingerprint
class, researchers attempted to solve this issue by different techniques (Lam, et al.,
2009), (Li, Busch, & Yang, 2014). The only problem with this recent development is
that this technique is dedicated only to those fingerprints that belong to the PA class.
This is a problem, because this solution requires to classify the fingerprint classes, then
to use the appropriate reference point detection method before re-aligning the
fingerprint.
An independent and efficient approach was proposed in (Msiza, Leke-
Betechuoh, & Malumedzha, 2011). Their approach did not depend on a particular
fingerprint class, and so it can be used for all types of fingerprint classes. They used a
new reference point named as True Fingerprint Centre Point (TFCP), which
determined after segmentation process, and it lied on the centre of Region of Interest
(ROI) area. From this point, they determined the rotation angle and direction of
rotation. This algorithm is explained in Chapter 3.
19
The rotation problem was handled in (Jain, Prabhakar, Hong, & Pankanti, 2000)
by cyclic rotation the extracted feature values in the matching stage. Similarly, in
(Guesmi, Trichili, Alimi, & Solaiman, 2012) the feature vector of each fingerprint
template is rotated with 5 angles; -20, -10, 0, 10, 20; and when matching, the test image
is compared for all templates.
The other solution of translation and rotation issues is what is called the
registration. Registration means that you have to choose a base image, then you have
to translate the test image to lie exactly on the base image in order to achieve the
maximum response between the two images. Registration is a common concept in
image process which can achieve the translation and rotation invariant. An approach
based on fingerprint registration was proposed in (Liu, Jiang, Yang, & Zhu, 2006), in
which the best alignment of two fingerprint images, template and input, is achieved by
maximization of Mutual Information (MI) between the extracted features from their
orientation fields, i.e., maximization of similarity measures between two fingerprint
images.
Another approach based on measuring the similarity between a set of rotated
fingerprint images of the registered image over an angular range−40 ≤ 𝜃 ≤ 40, and
the input image, was proposed in (Ito, et al., 2005). The translation was achieved by
using the position of the core point in both images. The drawback of this solution is
the high expensive computations due to the need of rotating each template 80 times
with different rotation angles, then the comparison of each of these rotated images with
the input one is considered. Furthermore, the rotation angle of some fingerprint images
exceeds this limited range of angles.
Anyway, using the registration techniques to solve the alignment and translation
problems in fingerprint recognition system, may be a good solution, but it will cost a
lot of computations and does not work well in all cases of fingerprint image qualities.
2.1.3 Core Point Detection
The reference point is defined as the point with maximum curvature of the
concave ridges in the fingerprint image (Prabhakar, 2001). The reference point plays
a very important role in many identification techniques, and in some techniques it has
20
to be detected accurately. At a global level, the ridge lines in a special area of
fingerprint image make distinctive shapes, and notable landmark structures, such as
core, delta, whorl, and loop. Locating the reference point is a critical step to solve the
problem of various fingerprint image displacement (Eriksson, 2001). One of the most
common and simple approach for determining the reference point is Poincaré index
(Kawagoe & Tojo, 1984). The algorithm depended on the differences in ridge
directions between adjacent blocks. The drawback of this solution that it failed in
determining the reference point in poor quality fingerprint images with cracks, scars,
dry skin, or poor ridge (Prabhakar, 2001). Another solution based on the geometry of
region was used to locate the reference point (Prabhakar, 2001; Jain, Prabhakar, Hong,
& Pankanti, 2000), but it also failed in poor quality fingerprint images.
Determination of singular point in (Nilsson & Bigun, 2003) was accomplished
by its symmetry properties, i.e. its strong response to complex filters designed for
rotational symmetry extraction. The algorithm was described briefly in Section (3.3).
Algorithm in (Ohtsuka, Watanabe, Tomizawa, & Aoki, 2008) used both the global
and local features of the ridge distribution to find the position of core point. The
algorithm achieved better results than of Poincaré index, but it longer in computation
time. The algorithm of (Tang, Wu, & Xiang, 2008) reduced the Poincaré index's
computation time by applying the modified version of Poincaré index to an effective
regions that may contain the singular point.
Recently, an approach based on flow curves was proposed in (Nasiri & Fathy,
2015) to detect the reference points. Both flow curves and fingerprint ridges are
similar to each other, but flow curves are not affected by discontinuities which are
encountered in ridge extraction. Their algorithm depended on clustering the points of
high curvature, then extraction the reference point. They tested their approach on
FVC2002 DB2, and FVC2004 DB1, and gained 92%, and 83% respectively. The result
of reference point detection is computed by measuring the distance between the
location of their approach and the manually determined location. If the distance was
more than 40 pixels, then their approach failed. We suggest that their approach has to
be compared with common algorithms such as Poincare, or complex filter.

21
2.2 Feature Extraction Techniques for Fingerprint Images Recognition
System
The features of fingerprint images can be extracted from global level or local
level. The global level does not has distinctive characteristics which used for
identification of fingerprint images. At the local level, there are some characteristics
can be used to distinguish between different fingerprint images. Minutiae is the most
widely local level characteristic used in fingerprint identification. Minutiae contains
ridge ending and ridge bifurcation.
It is nicely to refer here that there are some features behind the Minutiae, which
can be used for matching. These different features contain: orientation-based minutiae
descriptor, FingerCode, ridge feature map, orientation map, and density map.
Researchers attempted to combine between these features to improve the recognition
rate of fingerprint identification system. One research on comparison of combining
between these features is proposed in (Chen & Zhou, 2010). They concluded that
beyond four features, the improvement is limited, so they suggested to limit the
number of the used features to 4.
Recently, researchers used other features techniques to overcome the limitations
of minutiae based. They tended to use the frequency based algorithms at different
transform to extract unique features for fingerprint images.
In this section we summarises some proposed algorithms based on various
multiresolution transforms to extract features from the fingerprint images.
A comparison study of three frequency based feature extraction techniques was
proposed by (Dale & Joshi, 2008). They used Discrete Cosine Transform (DCT), FFT
and Discrete Wavelet Transform (DWT) to create a feature vector for matching
fingerprints images by using Euclidean distance. The results showed that DCT and
FFT performed better than DWT technique. However, their algorithm did not achieve
a good recognition rate since they do not perform any enhancement process on their
tested fingerprint dataset.
An early approach based on Wavelet decomposition was proposed by (Tico,
Immonen, Ramo, Kuosmanen, & Saarinen, 2001). They did not use an enhancement
process, but they depended on finding a reference point in fingerprint image, so they
22
found it manually. Their algorithm included locating the core point, cropping the ROI
around the core point, dividing the ROI into non overlapping blocks, then applying the
Wavelet decomposition on each block to extract a global feature vector of length 48
which was classified by KNN. The results showed a high recognition rate on 13
subjects selected from Bologna's fingerprint database.
The use of Curvelet transform has been proposed by many researchers as a
feature extraction technique. The proposed solution in (Guesmi, Trichili, Alimi, &
Solaiman, 2012) included: enhancement process, core point detection, cropping of
ROI of size 175x175, resizing this ROI to be 512x512, then applying Curvelet
transform for 5 scales, and encoded three statistical features (Energy, entropy, and
standard division) from each. The feature vector size was 164x3 for each image. They
used the similarity distance to match 30 subjects from FVC2004 database. They
achieved a good results, however, using 492 features is a large number of features
compared to the number of subjects they tested. Furthermore, they solved the rotation
problem by rotating the ROI of template with 5 angles, then they compared the test
image with all of these templates. The drawback of this solution is the multiple of 5
overhead computation will be occurred.
Similarly, another approach using the Curvelet transform was proposed in
(Mandal & Jonathan Wu, 2008). They divided the ROI area into 4 parts 32x32
subimages, applied the Curvelet transform on each subimage with different scales and
angles, then a standard deviation was taken for each subimage to reduce the
dimensionality of Curvelet's coefficients, then they concatenated the feature vector
from each one to be ready for comparison. They achieved the maximum recognition
rate on 15 subjects from FVC2004 database. However, this high recognition rate was
due two reasons: first they determined the core point manually so there was no core
point algorithm is used, and the second is the small number of subjects, and the
efficient number of samples per finger.
Another approach that using the Curvelet transform as a feature extraction was
proposed in (Humaira, Bushra, Firdous, Khan, & Islam, 2013). Their algorithm
included image enhancement process, core point detection, alignment process,
cropping the ROI of size 50x50, applying Curvelet transform to extract the feature
23
vector, then using the mean and standard deviation statistics to get the final feature
vector which would be matched with the KNN algorithm. They tested their solution
on a small database of selected 10 subjects from FVC2002 dataset, and got a high
recognition rate of about 90%. They rejected the fingerprint images which their core
point is near the image borders. We think this high recognition rate is due to very small
testing dataset, however their solution was a robust algorithm. Another hint for their
alignment process, is that their alignment process depended on rotation the test and the
rest of training images according to the reference image. The reference image was
chosen as the maximum energy response by applying Gabor filter to all fingerprint
subject samples. This process is known as a registration process.
A different feature extraction technique based on Contourlet transform was
proposed by (Omidyeganeh, Javadtalab, Ghaemmaghami, & Shirmohammadi, 2012).
The algorithm contained image enhancement, core point detection, cropping the ROI
of size 192x192, dividing the ROI into two non-overlapping blocks with the core point
at the centre, followed by applying the Contourlet transform on each block, then the
feature vector extracted from each block based on Generalized Gaussian Density
(GGD). The results were matched using KNN classifier on 25 subjects from FVC2004
dataset. The results showed an improvement in recognition rate with respect to
Wavelet transform. We can observe from their paper that they did not refer to the
alignment problem, which is an important process in fingerprint identification.
Another approach based on correlation matching between the input image and
the test image was proposed by (Haddad, Beghdadi, Serir, & Mokraoui, 2008). The
authors used the Radon transform to extract the rotation features from fingerprint
images. They tested their algorithm on 10 subjects from FVC2004 dataset. One
drawback of their solution is that they assumed that the fingerprint images were
already aligned, so their solution did not deal with the alignment problem.
Another approach based on Wave Atom transform was proposed by
(Mohammed, Jonathan Wu, & Sid-Ahmed, 2010). The algorithm resized the
fingerprint image to size 64x64, the Wave Atom was applied to this resized image,
then the bidirectional wo-Dimensional Principal Component Analysis (B2DPCA) was
applied to reduce the feature vectors dimension which were classified using the
24
Extreme Learning Machine (ELM). They evaluated their algorithm on 100 subjects of
the three databases FVC2000, FVC2002, and FVC2004. They got a recognition rate
of 93%, 87%, and 89% respectively. The proposed algorithm did not include an
enhancement or rotation processes, however it showed the powerful of B2DPCA
algorithm for dimensionality reduction, and ELM as a classifier. According to our
research, this is the only paper we found, which used the Wave Atom transform as a
feature extraction technique for fingerprint identification.
In (Jena & Dalal, 2014) the fingerprint image was firstly converted to grey
scale image, a 3 level DWT was applied to grey scale image and the feature extraction
was performed using the mean and variance. Features database was created in which
24 features of a person’s fingerprint were stored. Finally matching the feature vectors
was performed using Euclidean distance. They selected 25 person's fingerprint images
from CASIA-FingerprintV5 (200- 299). The system gave FAR as 2.3 % and FRR as
0.9%. One drawback with this approach is that they did not refer to the rotation and
translation problems, although their selected database has a strong rotation level and
translation within the same subjects.
Recently, an approach based on Gabor filter bank was proposed in (Chavan,
Mundada, & Pal, 2015). They used the Gabor filter bank to extract fingerprint image
features. Their approach included: normalization, segmentation, cropping the selected
ROI, locating the reference point, then the Gabor filter is applied on the ROI to extract
the feature vectors. Finally the feature vectors of query fingerprint image are compared
using the Euclidian distance with database fingerprint images. They extracted some
features from the Gabor filter response such as ridge frequency, width of Gaussian
envelope, and filter orientation. These features are transformed into a feature map,
which is circularly tessellated with different 5 bands and 8 sectors with consideration
of reference point as a centre of an image. The algorithm was tested on 20 subjects
from FVC2000 and 50 subjects from DBIT fingerprint database, and they achieved an
average efficiency of 82.95 % and 89.68 % respectively.
2.3 Classification Techniques for Fingerprint Images Recognition System
Most of the explained approaches in Section 2.2 which are based on
multiresolution transformation techniques as a feature extraction algorithms, used a
25
simple matching algorithm to measure the similarity between vectors, such as ED or
KNN, instead of using complex classifiers, such as Neural Networks (NN), or SVM.
This is because they aim to reduce the computation time of their algorithms for AFRS.
Some approaches did not use the enhancement process in their algorithms, and
they dealt with small fingerprint image. However, they depended on a strong
dimensional reduction techniques to reduce their feature vectors, and they depended
on a strong matching algorithm to perform identification process. This kind of
matching needs enough sample for matching.
One of these algorithms was the approach introduced by (Luo, Lin, Lei, & Ni,
2008). The algorithm resized the fingerprint image to 64x64, applied a two-lever
Wavelet decomposition to the image to extract a feature vector, followed by using
2DPCA to reduce the dimension of the feature vector, finally the matching process
was accomplished by Ellipsoidal Basis Function Neural Network (EBFNN).
The approach of (Mohammed, Jonathan Wu, & Sid-Ahmed, 2010) replaced the
Wavelet decomposition with the Wave Atom decomposition, and 2DPCA with
B2DPCA, and EBFNN with extreme learning machine matching algorithm.
An approach based on NN matching was proposed by (Altun & Allahverd,
2006). They used the Contourlet transform for image enhancement after some filtering
process. The extracted features depended on FingerCode algorithm, in which the
feature vector was determined by dividing the circle area around the core point into
sectors which was divided into bands, then computing the grayscale variance of each
sector. A feature vector of size 384 was input to the NN. They tested their algorithm
on their own dataset, which contains 1000 images for only 10 persons, and achieved a
recognition rate of 99.6%. This means that each subject contained 100 samples which
is an excellent condition to the NN to learn. Furthermore, they did not refer to the
rotation problem in their paper, however the rotation problem was solved in the main
reference (Jain, Prabhakar, Hong, & Pankanti, 2000) in matching stage by cyclically
rotating the FingerCode feature eight steps with an angle of 22.5 degree.
An approach based on fingerprint texture pattern and Hidden Markov Model
(HMM) was proposed in (Guo, 2005). The feature vector was based on the orientation
field of fingerprint image, and it was extracted from different regions of the image
26
after scanning, rotation, and core point detection. The result gave an EER of 7.1% on
FVC2002 DB1. This approach skipped the process of thinning and minutiae selection,
however the difficulty of FVC2002 DB1 is classified a low difficulty database in
(Turroni, 2012).
Another approach based on Hilbert curve and HMM was proposed in
(Azarnoush & Kiani, 2014). The algorithm contained: fingerprint enhancement,
locating the core point, binarization, cropping the image around the core point, feature
extraction using Hilbert curve, and finally classification with HMM. They added an
extra process which rejected the defected fingerprint image. Defected images are those
of non-clear core point, or the core point is near the margins. The result gave an ERR
of 2.4% on FVC2002 DB1.
An approaches based on Back Propagation Neural Network (BPNN) classifier
and invariant moment features was proposed in (Yang & Park, 2008). Their approach
contains: image enhancement using STFT, detection of reference point, determination
of ROI, partition the ROI into 4 non overlapping regions, applying moment features
of size of 24 features, and finally matching using BPNN. The result gave an ERR of
3.685% on four databases of FVC2002.
The same approach was proposed in (Balti, Sayadi, & Fnaiech, 2014), but with
a different feature extraction technique based on linear algebra, which known as
Singular Value Decomposition (SVD). They improved the ERR from 3.685% to
3.475%.
An approach based on multilayer perceptron NN was proposed in (El-Feghi,
Tahar, & Ahmadi, 2011). They used the segmentation with an elliptical shape, the
pseudo-Zernike moments (PZM) technique to extract the feature vector of size 21, and
finally the matching was performed using MLP. They tested their approach on a
database of 40 subjects, each subject contains 10 samples. They gained a recognition
rate of 100%. However, they have to test their approach on one of the common
databases to make a comparison to other approaches. Anyway, choosing a database of
10 samples for each subject is a good choice to train the NN.
An approach based on SOM was proposed in (Acquah & Gyimah, 2014). They
detected the core point based in (Jain, Prabhakar, Hong, & Pankanti, 2000), extracted
27
the feature vector from Gabor filter, and used the SOM for matching the fingerprint
images. They achieved a recognition rate of 82% on FVC2004 DB3. The same
approach was proposed in (Elmir, Elberrichi, & Adjoudj, 2012). The results of
recognition rate were: 68.4%, 63%, 73.6%, and 78.9% on databases of FVC2004 DB1,
DB2, DB3, and DB4 respectively.
Some approach combined between clustering and neural network techniques,
such as a combination between SOM and Radial Basis Function Network (RBFN)
(Kundu & Sarker, 2015).
SVM algorithm was first used in fingerprint classification in (Yao, Frasconi, &
Pontil, 2001). An approach based on SVM for fingerprint verification was proposed in
(Daramola, Sokunbi, & Adoghe, 2013). Their approach contained: image
enhancement, feature extraction based on the centre of gravity, and finally matching
using SVM. They tested their approach on fifty students of Covenant University
Otaon, and achieved a recognition rate of 80%. However, they have to test their
approach on common databases.
Another approach based on Fourier-Mellin transform as a feature extraction
algorithm and SVM as a matching algorithm was proposed in (He, Ou, & Guo, 2003).
They tested their approach on a small database which is built by the Biometric System
Lab of size 21 subjects. They achieved a recognition rate of about 94%.
It is worth to know that most of the research which we did on using SVM and
SOM classifiers in fingerprint recognition system, showed that these classifiers were
used much in verification and classification, and they were used less in identification.

28
Chapter 3
Fingerprint Pre-processing
Techniques
29
Chapter 3
Fingerprint Pre-processing Techniques
In this chapter, we introduce the pre-processing techniques, which are one of the
most important part in any fingerprint recognition system. We divide this chapter into
three parts: the first part introduces the alignment technique which is used to rotate the
fingerprint image, the second part introduces the enhancement techniques, which are
used to improve the clarity of poor fingerprint images, and the last part introduces the
reference point detection technique, which is used to select a small region from the
fingerprint image, and is considered as an input image to the feature extraction
technique.
3.1 Alignment Techniques
There are three major challenges involved in the acquired fingerprint samples:
translation, rotation and scaling. Fingerprint translation and rotation processes are the
most important steps in any automatic fingerprint recognition system, since capturing
fingerprint images does not lead to scaling problem since most fingerprint images
could be scaled as per the dpi (Dot per Inch) specification of the sensors. Fingerprint
translation refers to the position of a captured fingerprint with respect to the fingerprint
image background, and for optimum functionality of AFRS, the fingerprint should be
positioned in the central area of the fingerprint image background. Fingerprint rotation
refers to the alignment of a captured fingerprint when measured against the image
background, and for optimum functionality of a fingerprint recognition system, the
captured image should be sat at an angle of approximately 0 degree (more or less
upright) relative to the vertical axis (Msiza, Leke-Betechuoh, & Malumedzha, 2011).
In order to achieve a high recognition rate, the fingerprint images have to be aligned
and translated accurately.
We first used the image registration technique for image alignment problem. We
use an intensity based image registration function; imregister; which is already
implemented in Matlab toolbox. This function takes two images: the first is the fixed
image, and the other is the image which will be rotated and transmitted to match the
fixed one.
30
However, the image registration technique may achieve good results, it costs
high computations. Furthermore, it requires to select a base image, and for each test
image, the registration process is performed with all the training images. When we
applied this technique in CASIA-FingerprintV5 database, we faced a problem that for
every type of noises in this database, the configuration parameters needed to be
optimized differently.
We implement the proposed alignment algorithm in (Msiza, Leke-Betechuoh, &
Malumedzha, 2011). This approach is independent of fingerprint classes, and can be
used for all fingerprint classes. The algorithm is simple and efficient, and contains the
following processes:
1- Segmentation: this process is an important step to separate the foreground
region from the background region. This is useful to avoid the subsequent
extraction of fingerprint feature in the background noise (Alonso-Fernandez
, et al., 2009). It generates a mask image, which contains two colors: white
and black. The white area is the area of the ridge structure; the foreground
region; while the black area is the area of background. See Figure 3.1. The
task of segmentation is to decide which part belongs to the foreground and
which part to the background. The result of the used segmentation technique
which based on grey level variance in Msiza et al. is shown in Figure 3.1.
We replace the segmentation technique used by Msiza et al technique with
another segmentation technique based on morphological operation (Fahmy
& Thabet, 2013), which does not depend on a threshold value, and has
additional features over the one used in Msiza et al. These features affect and
improve the performance of the alignment technique in Msiza et al. such as:
first they used the erosion function which has the effect of removing isolated
foregrounds, and the dilation function which has the effect of broadening or
thickening narrow regions, so it removes the small holes. The mechanics of
erosion and dilation are similar to convolution in filtering operations.
Furthermore, it improves the foreground edges by smoothing the contour.
We will see the results of using this technique over the one used by Msiza et
al in Chapter 6.
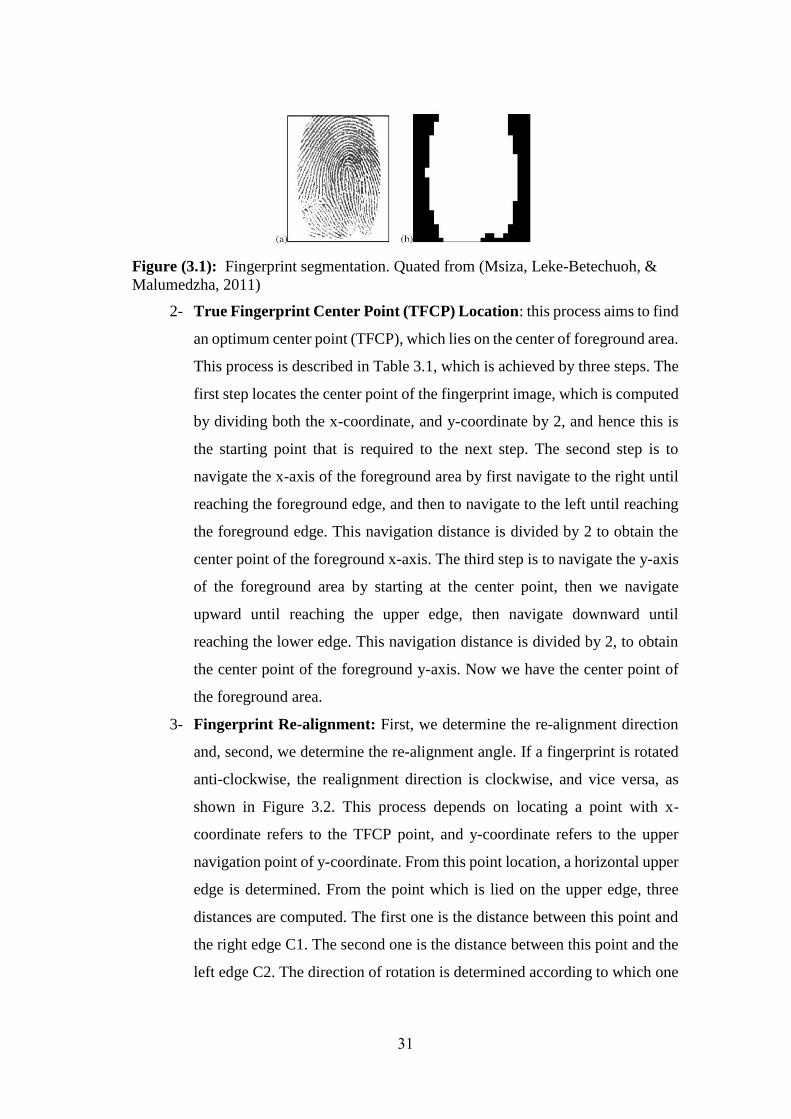
31
Figure (3.1): Fingerprint segmentation. Quated from (Msiza, Leke-Betechuoh, &
Malumedzha, 2011)
2- True Fingerprint Center Point (TFCP) Location: this process aims to find
an optimum center point (TFCP), which lies on the center of foreground area.
This process is described in Table 3.1, which is achieved by three steps. The
first step locates the center point of the fingerprint image, which is computed
by dividing both the x-coordinate, and y-coordinate by 2, and hence this is
the starting point that is required to the next step. The second step is to
navigate the x-axis of the foreground area by first navigate to the right until
reaching the foreground edge, and then to navigate to the left until reaching
the foreground edge. This navigation distance is divided by 2 to obtain the
center point of the foreground x-axis. The third step is to navigate the y-axis
of the foreground area by starting at the center point, then we navigate
upward until reaching the upper edge, then navigate downward until
reaching the lower edge. This navigation distance is divided by 2, to obtain
the center point of the foreground y-axis. Now we have the center point of
the foreground area.
3- Fingerprint Re-alignment: First, we determine the re-alignment direction
and, second, we determine the re-alignment angle. If a fingerprint is rotated
anti-clockwise, the realignment direction is clockwise, and vice versa, as
shown in Figure 3.2. This process depends on locating a point with x-
coordinate refers to the TFCP point, and y-coordinate refers to the upper
navigation point of y-coordinate. From this point location, a horizontal upper
edge is determined. From the point which is lied on the upper edge, three
distances are computed. The first one is the distance between this point and
the right edge C1. The second one is the distance between this point and the
left edge C2. The direction of rotation is determined according to which one
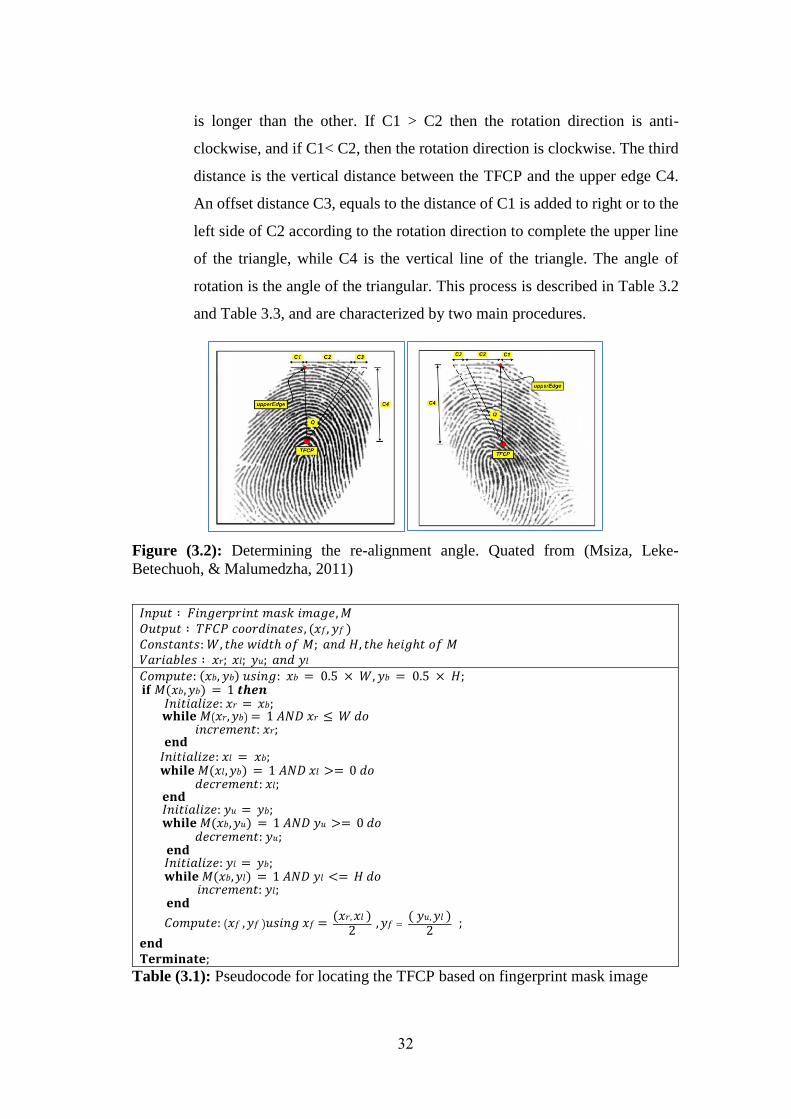
32
is longer than the other. If C1 > C2 then the rotation direction is anti-
clockwise, and if C1< C2, then the rotation direction is clockwise. The third
distance is the vertical distance between the TFCP and the upper edge C4.
An offset distance C3, equals to the distance of C1 is added to right or to the
left side of C2 according to the rotation direction to complete the upper line
of the triangle, while C4 is the vertical line of the triangle. The angle of
rotation is the angle of the triangular. This process is described in Table 3.2
and Table 3.3, and are characterized by two main procedures.
Figure (3.2): Determining the re-alignment angle. Quated from (Msiza, Leke-
Betechuoh, & Malumedzha, 2011)
𝐼𝑛𝑝𝑢𝑡 ∶ 𝐹𝑖𝑛𝑔𝑒𝑟𝑝𝑟𝑖𝑛𝑡 𝑚𝑎𝑠𝑘 𝑖𝑚𝑎𝑔𝑒, 𝑀 𝑂𝑢𝑡𝑝𝑢𝑡 ∶ 𝑇𝐹𝐶𝑃 𝑐𝑜𝑜𝑟𝑑𝑖𝑛𝑎𝑡𝑒𝑠, (𝑥𝑓, 𝑦𝑓 ) 𝐶𝑜𝑛𝑠𝑡𝑎𝑛𝑡𝑠: 𝑊, 𝑡ℎ𝑒 𝑤𝑖𝑑𝑡ℎ 𝑜𝑓 𝑀; 𝑎𝑛𝑑 𝐻, 𝑡ℎ𝑒 ℎ𝑒𝑖𝑔ℎ𝑡 𝑜𝑓 𝑀 𝑉𝑎𝑟𝑖𝑎𝑏𝑙𝑒𝑠 ∶ 𝑥𝑟; 𝑥𝑙; 𝑦𝑢; 𝑎𝑛𝑑 𝑦𝑙 𝐶𝑜𝑚𝑝𝑢𝑡𝑒: (𝑥𝑏, 𝑦𝑏) 𝑢𝑠𝑖𝑛𝑔: 𝑥𝑏 = 0.5 × 𝑊, 𝑦𝑏 = 0.5 × 𝐻; 𝐢𝐟 𝑀(𝑥𝑏, 𝑦𝑏) = 1 𝒕𝒉𝒆𝒏 𝐼𝑛𝑖𝑡𝑖𝑎𝑙𝑖𝑧𝑒: 𝑥𝑟 = 𝑥𝑏; 𝐰𝐡𝐢𝐥𝐞 𝑀(𝑥𝑟, 𝑦𝑏) = 1 𝐴𝑁𝐷 𝑥𝑟 ≤ 𝑊 𝑑𝑜 𝑖𝑛𝑐𝑟𝑒𝑚𝑒𝑛𝑡: 𝑥𝑟; 𝐞𝐧𝐝 𝐼𝑛𝑖𝑡𝑖𝑎𝑙𝑖𝑧𝑒: 𝑥𝑙 = 𝑥𝑏; 𝐰𝐡𝐢𝐥𝐞 𝑀(𝑥𝑙, 𝑦𝑏) = 1 𝐴𝑁𝐷 𝑥𝑙 >= 0 𝑑𝑜 𝑑𝑒𝑐𝑟𝑒𝑚𝑒𝑛𝑡: 𝑥𝑙; 𝐞𝐧𝐝 𝐼𝑛𝑖𝑡𝑖𝑎𝑙𝑖𝑧𝑒: 𝑦𝑢 = 𝑦𝑏; 𝐰𝐡𝐢𝐥𝐞 𝑀(𝑥𝑏, 𝑦𝑢) = 1 𝐴𝑁𝐷 𝑦𝑢 >= 0 𝑑𝑜 𝑑𝑒𝑐𝑟𝑒𝑚𝑒𝑛𝑡: 𝑦𝑢; 𝐞𝐧𝐝 𝐼𝑛𝑖𝑡𝑖𝑎𝑙𝑖𝑧𝑒: 𝑦𝑙 = 𝑦𝑏; 𝐰𝐡𝐢𝐥𝐞 𝑀(𝑥𝑏, 𝑦𝑙) = 1 𝐴𝑁𝐷 𝑦𝑙 <= 𝐻 𝑑𝑜 𝑖𝑛𝑐𝑟𝑒𝑚𝑒𝑛𝑡: 𝑦𝑙; 𝐞𝐧𝐝
𝐶𝑜𝑚𝑝𝑢𝑡𝑒: (𝑥𝑓 , 𝑦𝑓 )𝑢𝑠𝑖𝑛𝑔 𝑥𝑓 = (𝑥𝑟, 𝑥𝑙 )
2 , 𝑦𝑓 =
( 𝑦𝑢, 𝑦𝑙 )2
;
𝐞𝐧𝐝 𝐓𝐞𝐫𝐦𝐢𝐧𝐚𝐭𝐞;
Table (3.1): Pseudocode for locating the TFCP based on fingerprint mask image

33
𝐼𝑛𝑝𝑢𝑡 ∶ Fingerprint mask image, 𝑀; 𝑥𝑓 ; and 𝑦𝑢 𝑂𝑢𝑡𝑝𝑢𝑡 ∶ Re − alignment direction, 𝐷 𝐶𝑜𝑛𝑠𝑡𝑎𝑛𝑡𝑠: 𝑊, the width of 𝑀 𝑉𝑎𝑟𝑖𝑎𝑏𝑙𝑒𝑠 ∶ 𝑥𝑢; 𝐶1; and 𝐶2 𝐼𝑛𝑖𝑡𝑖𝑎𝑙𝑖𝑧𝑒: 𝑥𝑢 = 𝑥𝑓 ; 𝑆𝑡𝑎𝑟𝑡: 𝑎𝑡 𝑡ℎ𝑒 𝑝𝑜𝑖𝑛𝑡 (𝑥𝑢, 𝑦𝑢), 𝑡ℎ𝑒 𝑢𝑝𝑝𝑒𝑟𝐸𝑑𝑔𝑒; 𝐢𝐟 𝑀(𝑥𝑢, 𝑦𝑢) = 1 𝐭𝐡𝐞𝐧 𝐰𝐡𝐢𝐥𝐞 𝑀(𝑥𝑢, 𝑦𝑢) = 1 𝐴𝑁𝐷 𝑥𝑢 <= 𝑊 𝐝𝐨 𝑖𝑛𝑐𝑟𝑒𝑚𝑒𝑛𝑡: 𝑥𝑢; 𝐞𝐧𝐝 𝐶𝑜𝑚𝑝𝑢𝑡𝑒: 𝐶1 = 𝑥𝑢 7 − 𝑥𝑓 ; 𝑅𝑒 − 𝑖𝑛𝑖𝑡𝑖𝑎𝑙𝑖𝑧𝑒: 𝑥𝑢 = 𝑥𝑓 ; 𝐰𝐡𝐢𝐥𝐞 𝑀(𝑥𝑢, 𝑦𝑢) = 1 𝐴𝑁𝐷 𝑥𝑢 >= 0 𝐝𝐨 𝑑𝑒𝑐𝑟𝑒𝑚𝑒𝑛𝑡: 𝑥𝑢; 𝐞𝐧𝐝 𝐶𝑜𝑚𝑝𝑢𝑡𝑒: 𝐶2 = 𝑥𝑓 12 − 𝑥𝑢; 𝐢𝐟 𝐶1 < 𝐶2 𝐭𝐡𝐞𝐧 𝐷 𝑖𝑠 𝑐𝑙𝑜𝑐𝑘𝑤𝑖𝑠𝑒; 𝐞𝐥𝐬𝐞 𝑖𝑓 𝐶2 < 𝐶1 𝐭𝐡𝐞𝐧 𝐷 𝑖𝑠 𝑎𝑛𝑡𝑖 − 𝑐𝑙𝑜𝑐𝑘𝑤𝑖𝑠𝑒; 𝐞𝐥𝐬𝐞 𝐷 𝑖𝑠 𝑢𝑝𝑟𝑖𝑔ℎ𝑡 (𝑛𝑜 𝑟𝑒 − 𝑎𝑙𝑖𝑔𝑛𝑚𝑒𝑛𝑡 𝑟𝑒𝑞𝑢𝑖𝑟𝑒𝑑); 𝐞𝐧𝐝 𝑅𝑒 − 𝑖𝑛𝑖𝑡𝑖𝑎𝑙𝑖𝑧𝑒: 𝑥𝑢 = 𝑥𝑓 ; 𝐞𝐧𝐝 𝐓𝐞𝐫𝐦𝐢𝐧𝐚𝐭𝐞;
Table (3.2): Pseudocode for determining the realignment direction of a rotated
fingerprint
𝐼𝑛𝑝𝑢𝑡 ∶ Re − alignment direction, 𝐷; 𝐶1; 𝐶2; 𝑦𝑓; & 𝑦𝑢 𝑂𝑢𝑡𝑝𝑢𝑡 ∶ Re − alignment angle, 𝑄 𝑉𝑎𝑟𝑖𝑎𝑏𝑙𝑒𝑠 ∶ 𝐶3 and 𝐶4 Initialize: 𝑄 = 0 degrees; 𝐢𝐟 𝐷 𝑖𝑠 𝑛𝑜𝑡 𝑢𝑝𝑟𝑖𝑔ℎ𝑡 𝐭𝐡𝐞𝐧 𝐶𝑜𝑚𝑝𝑢𝑡𝑒: 𝐶4 = 𝑦𝑓 3 − 𝑦𝑢; 𝐢𝐟 𝐷 𝑖𝑠 𝑐𝑙𝑜𝑐𝑘𝑤𝑖𝑠𝑒 𝐭𝐡𝐞𝐧 𝐴𝑑𝑑: 𝑎𝑛 𝑜𝑓𝑓𝑠𝑒𝑡, 𝐶3 = 𝐶1, 𝑡𝑜 𝑡ℎ𝑒 𝑙𝑒𝑓𝑡 𝑜𝑓 𝐶2; 𝐞𝐥𝐬𝐞 𝐢𝐟 𝐷 𝑖𝑠 𝑎𝑛𝑡𝑖 − 𝑐𝑙𝑜𝑐𝑘𝑤𝑖𝑠𝑒 𝐭𝐡𝐞𝐧 𝐴𝑑𝑑: 𝑎𝑛 𝑜𝑓𝑓𝑠𝑒𝑡, 𝐶3 = 𝐶1, 𝑡𝑜 𝑡ℎ𝑒 𝑟𝑖𝑔ℎ𝑡 𝑜𝑓 𝐶2; 𝐞𝐧𝐝 𝑄 = arctan (𝑑𝑖𝑣𝑖𝑑𝑒(𝑠𝑢𝑚(𝐶2,𝐶3),𝐶4)) 𝑑𝑒𝑔𝑟𝑒𝑒𝑠;
𝒆𝒏𝒅 𝐓𝐞𝐫𝐦𝐢𝐧𝐚𝐭𝐞;
Table (3.3): Pseudocode for determining the realignment angle of a rotated
fingerprint
3.2 Fingerprint Enhancement Techniques
One of the most popular and an effective fingerprint enhancement algorithm is
proposed in (Chikkerur, Cartwright, & Govindaraju, 2007). The enhancement
algorithm is based on short time Fourier transform (STFT) analysis, and on contextual
filtering in the Fourier domain whose parameters depend on the local ridge frequency
and orientation. The idea of this algorithm is to create an adaptive filter whose
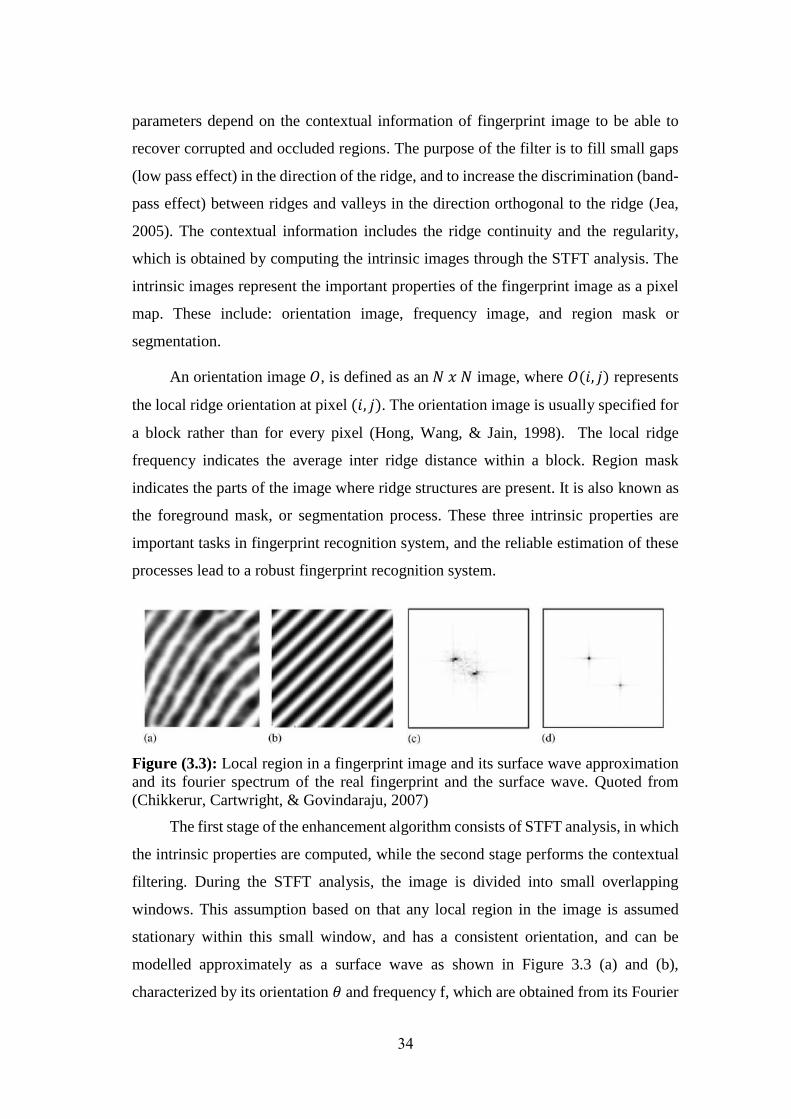
34
parameters depend on the contextual information of fingerprint image to be able to
recover corrupted and occluded regions. The purpose of the filter is to fill small gaps
(low pass effect) in the direction of the ridge, and to increase the discrimination (band-
pass effect) between ridges and valleys in the direction orthogonal to the ridge (Jea,
2005). The contextual information includes the ridge continuity and the regularity,
which is obtained by computing the intrinsic images through the STFT analysis. The
intrinsic images represent the important properties of the fingerprint image as a pixel
map. These include: orientation image, frequency image, and region mask or
segmentation.
An orientation image 𝑂, is defined as an 𝑁 𝑥 𝑁 image, where 𝑂(𝑖, 𝑗) represents
the local ridge orientation at pixel (𝑖, 𝑗). The orientation image is usually specified for
a block rather than for every pixel (Hong, Wang, & Jain, 1998). The local ridge
frequency indicates the average inter ridge distance within a block. Region mask
indicates the parts of the image where ridge structures are present. It is also known as
the foreground mask, or segmentation process. These three intrinsic properties are
important tasks in fingerprint recognition system, and the reliable estimation of these
processes lead to a robust fingerprint recognition system.
Figure (3.3): Local region in a fingerprint image and its surface wave approximation
and its fourier spectrum of the real fingerprint and the surface wave. Quoted from
(Chikkerur, Cartwright, & Govindaraju, 2007)
The first stage of the enhancement algorithm consists of STFT analysis, in which
the intrinsic properties are computed, while the second stage performs the contextual
filtering. During the STFT analysis, the image is divided into small overlapping
windows. This assumption based on that any local region in the image is assumed
stationary within this small window, and has a consistent orientation, and can be
modelled approximately as a surface wave as shown in Figure 3.3 (a) and (b),
characterized by its orientation 𝜃 and frequency f, which are obtained from its Fourier
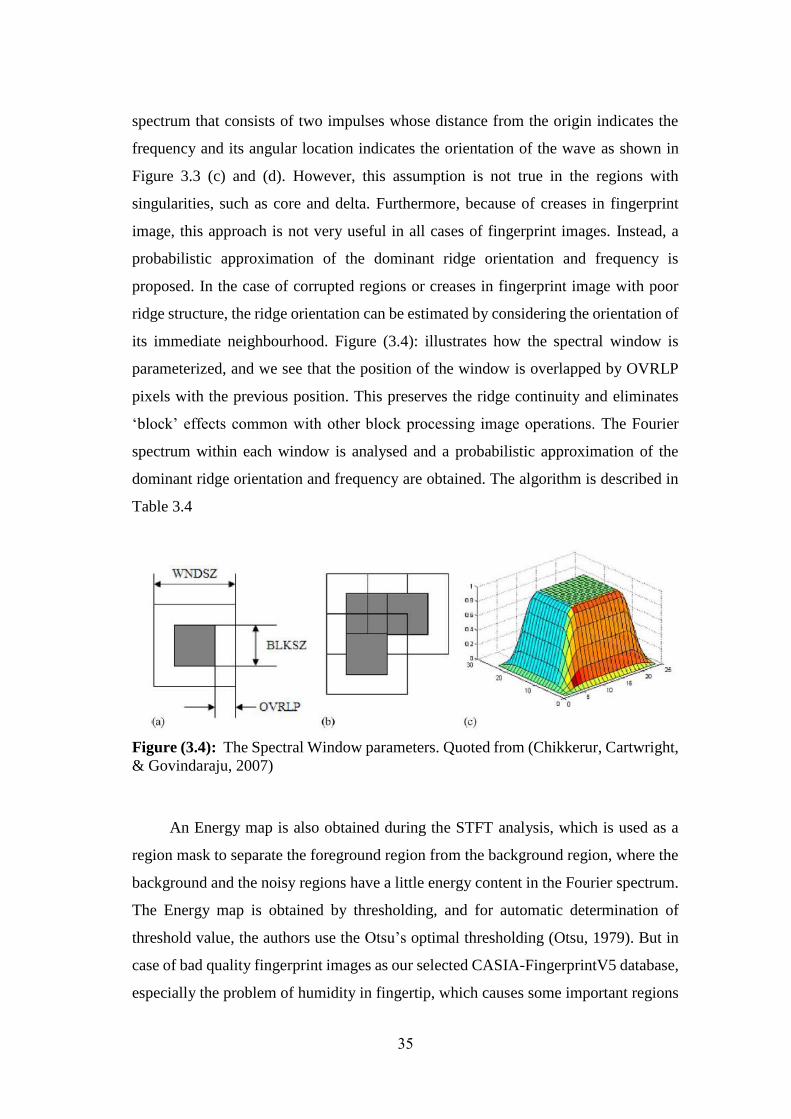
35
spectrum that consists of two impulses whose distance from the origin indicates the
frequency and its angular location indicates the orientation of the wave as shown in
Figure 3.3 (c) and (d). However, this assumption is not true in the regions with
singularities, such as core and delta. Furthermore, because of creases in fingerprint
image, this approach is not very useful in all cases of fingerprint images. Instead, a
probabilistic approximation of the dominant ridge orientation and frequency is
proposed. In the case of corrupted regions or creases in fingerprint image with poor
ridge structure, the ridge orientation can be estimated by considering the orientation of
its immediate neighbourhood. Figure (3.4): illustrates how the spectral window is
parameterized, and we see that the position of the window is overlapped by OVRLP
pixels with the previous position. This preserves the ridge continuity and eliminates
‘block’ effects common with other block processing image operations. The Fourier
spectrum within each window is analysed and a probabilistic approximation of the
dominant ridge orientation and frequency are obtained. The algorithm is described in
Table 3.4
Figure (3.4): The Spectral Window parameters. Quoted from (Chikkerur, Cartwright,
& Govindaraju, 2007)
An Energy map is also obtained during the STFT analysis, which is used as a
region mask to separate the foreground region from the background region, where the
background and the noisy regions have a little energy content in the Fourier spectrum.
The Energy map is obtained by thresholding, and for automatic determination of
threshold value, the authors use the Otsu’s optimal thresholding (Otsu, 1979). But in
case of bad quality fingerprint images as our selected CASIA-FingerprintV5 database,
especially the problem of humidity in fingertip, which causes some important regions

36
to be dark or black. This causes the thresholding technique to consider this black
regions a part of the background area, and so it will be ignored. We solve this problem
by replacing the process of computing the Energy map by the segmentation technique
proposed by (Fahmy & Thabet, 2013) as we did in the alignment step. This technique
does not depend on the thresholding to estimate the foreground region. The results of
the comparison of both techniques will be discussed in Chapter 6.
The orientation image is then used to compute the Coherence image, which is
used to adapt the angular bandwidth. The resulting contextual information is used to
filter each overlapping window in the Fourier domain. The filter used is separable in
radial and angular domain, and is given by:
𝐻(𝑟, 𝜑) = 𝐻𝑟(𝑟)𝐻𝜑(𝜑), (3.1)
𝐻𝑟(𝑟) = √[(𝑟𝑟𝐵𝑊)2𝑛
(𝑟𝑟𝐵𝑊)2𝑛 + (𝑟2 − 𝑟𝑐2)2𝑛
] , (3.2)
𝐻𝜑(𝜑) = (cos2
𝜋
2
(𝜑 − 𝜑𝑐)
𝜑𝐵𝑊, 𝑖𝑓 |𝜑| < 𝜑𝐵𝑊
0 𝑜𝑡ℎ𝑒𝑟𝑤𝑖𝑠𝑒
), (3.3)
Where 𝑟𝑟𝐵𝑊, 𝜑𝐵𝑊 are the radial bandwidth and the angular bandwidth respectively.
The enhanced image is obtained by tiling the result of each analysis window.
𝐼𝑛𝑝𝑢𝑡 ∶ 𝐼𝑚𝑎𝑔𝑒 𝐼(𝑥, 𝑦) 𝑂𝑢𝑡𝑝𝑢𝑡: 𝐸𝑛ℎ𝑎𝑛𝑐𝑒𝑑 𝐼𝑚𝑎𝑔𝑒 𝐼(𝑥, 𝑦), 𝑅𝑖𝑑𝑔𝑒 𝑂𝑟𝑖𝑒𝑛𝑡𝑎𝑡𝑖𝑜𝑛 𝐼𝑚𝑎𝑔𝑒 𝑂(𝑥, 𝑦), 𝑅𝑖𝑑𝑔𝑒 𝐹𝑟𝑒𝑞𝑢𝑒𝑛𝑐𝑦 𝐼𝑚𝑎𝑔𝑒 𝐹(𝑥, 𝑦), 𝐸𝑛𝑒𝑟𝑔𝑦 𝐼𝑚𝑎𝑔𝑒 𝐸(𝑥, 𝑦), 𝑂𝑟𝑖𝑒𝑛𝑡𝑎𝑡𝑖𝑜𝑛 𝐶𝑜ℎ𝑒𝑟𝑒𝑛𝑐𝑒 𝐼𝑚𝑎𝑔𝑒 𝐶(𝑥, 𝑦), 𝑅𝑒𝑔𝑖𝑜𝑛 𝑀𝑎𝑠𝑘 (𝑥, 𝑦) 𝑺𝒕𝒂𝒈𝒆 𝟏: 𝑺𝑻𝑭𝑻 𝑨𝒏𝒂𝒍𝒚𝒔𝒊𝒔
1- 𝐹𝑜𝑟 𝑒𝑎𝑐ℎ 𝑜𝑣𝑒𝑟𝑙𝑎𝑝𝑝𝑖𝑛𝑔 𝑏𝑙𝑜𝑐𝑘 𝐵(𝑥, 𝑦) 𝑖𝑛 𝑡ℎ𝑒 𝑖𝑚𝑎𝑔𝑒 𝑑𝑜:
a. 𝑅𝑒𝑚𝑜𝑣𝑒 𝐷𝐶 𝑐𝑜𝑛𝑡𝑒𝑛𝑡 𝑜𝑓 𝐵, 𝐵 = 𝐵 − 𝑎𝑣𝑔(𝐵)
b. 𝑀𝑢𝑙𝑡𝑖𝑝𝑙𝑦 𝑏𝑦 𝑠𝑝𝑒𝑐𝑡𝑟𝑎𝑙 𝑤𝑖𝑛𝑑𝑜𝑤 𝑊
c. 𝑂𝑏𝑡𝑎𝑖𝑛 𝑡ℎ𝑒 𝐹𝐹𝑇 𝑜𝑓 𝑡ℎ𝑒 𝑏𝑙𝑜𝑐𝑘, 𝐹 = 𝐹𝐹𝑇(𝐵)
d. 𝑃𝑒𝑟𝑓𝑜𝑟𝑚 𝑟𝑜𝑜𝑡 𝑓𝑖𝑙𝑡𝑒𝑟𝑖𝑛𝑔 𝑜𝑛 𝐹
e. 𝑃𝑒𝑟𝑓𝑜𝑟𝑚 𝑆𝑇𝐹𝑇 𝐴𝑛𝑎𝑙𝑦𝑠𝑖𝑠. 𝑇ℎ𝑒 𝐴𝑛𝑎𝑙𝑦𝑠𝑖𝑠 𝑦𝑖𝑒𝑙𝑑 𝑣𝑎𝑙𝑢𝑒𝑠 𝑜𝑓 𝐸(𝑥, 𝑦), 𝑂(𝑥, 𝑦), 𝐹(𝑥, 𝑦)
𝐸𝑛𝑑 𝑓𝑜𝑟 2- 𝑆𝑚𝑜𝑜𝑡ℎ𝑒𝑛 𝑜𝑟𝑖𝑒𝑛𝑡𝑎𝑡𝑖𝑜𝑛 𝑖𝑚𝑎𝑔𝑒 𝑂(𝑥, 𝑦) 𝑏𝑦 𝑣𝑒𝑐𝑡𝑜𝑟 𝑎𝑣𝑒𝑟𝑎𝑔𝑖𝑛𝑔 𝑡𝑜 𝑦𝑖𝑒𝑙𝑑 ��(𝑥, 𝑦)
3- 𝑃𝑒𝑟𝑓𝑜𝑟𝑚 𝑖𝑠𝑜𝑡𝑟𝑜𝑝𝑖𝑐 𝑑𝑖𝑓𝑓𝑢𝑠𝑖𝑜𝑛 𝑜𝑛 𝑓𝑟𝑒𝑞𝑢𝑒𝑛𝑐𝑦 𝑚𝑎𝑝 𝐹(𝑥, 𝑦) 𝑡𝑜 𝑦𝑖𝑒𝑙𝑑 ��(𝑥, 𝑦)
4- 𝐶𝑜𝑝𝑚𝑢𝑡𝑒 𝑐𝑜ℎ𝑒𝑟𝑒𝑛𝑐𝑒 𝑖𝑚𝑎𝑔𝑒 𝐶(𝑥, 𝑦) 𝑢𝑠𝑖𝑛𝑔 ��(𝑥, 𝑦)
5- 𝐶𝑜𝑚𝑝𝑢𝑡𝑒 𝑟𝑒𝑔𝑖𝑜𝑛 𝑚𝑎𝑠𝑘 𝑅(𝑥, 𝑦) 𝑏𝑦 (Fahmy & Thabet, 2013)
𝑺𝒕𝒂𝒈𝒆 𝟐: 𝑬𝒏𝒉𝒂𝒏𝒄𝒆𝒎𝒆𝒏𝒕 1- 𝐹𝑜𝑟 𝑒𝑎𝑐ℎ 𝑜𝑣𝑒𝑟𝑙𝑎𝑝𝑝𝑖𝑛𝑔 𝑏𝑙𝑜𝑐𝑘 𝐵(𝑥, 𝑦) 𝑖𝑛 𝑡ℎ𝑒 𝑖𝑚𝑎𝑔𝑒 𝑑𝑜:
a. 𝐶𝑜𝑚𝑝𝑢𝑡𝑒 𝑎𝑛𝑔𝑢𝑙𝑎𝑟 𝑓𝑖𝑙𝑡𝑒𝑟 𝐹𝐴 𝑐𝑒𝑛𝑡𝑒𝑟𝑒𝑑 𝑎𝑟𝑜𝑢𝑛𝑑 𝑂(𝑥, 𝑦)𝑎𝑛𝑑 𝑤𝑖𝑡ℎ 𝑏𝑎𝑛𝑑𝑤𝑖𝑑𝑡ℎ
𝑖𝑛𝑣𝑒𝑟𝑠𝑒𝑙𝑦 𝑝𝑟𝑜𝑝𝑜𝑟𝑡𝑖𝑜𝑛𝑎𝑙 𝑡𝑜 𝐶(𝑥, 𝑦)

37
b. 𝐶𝑜𝑚𝑝𝑢𝑡𝑒 𝑟𝑎𝑑𝑖𝑎𝑙 𝑓𝑖𝑙𝑡𝑒𝑟 𝐹𝑅 𝑐𝑒𝑛𝑡𝑒𝑟𝑒𝑑 𝑎𝑟𝑜𝑢𝑛𝑑 𝑓𝑟𝑒𝑞𝑢𝑒𝑛𝑐𝑦 𝐹(𝑥, 𝑦)
c. 𝐹𝑖𝑙𝑡𝑒𝑟 𝑡ℎ𝑒 𝑏𝑙𝑜𝑐𝑘 𝑖𝑛 𝑡ℎ𝑒 𝐹𝐹𝑇 𝑑𝑜𝑚𝑎𝑖𝑛 𝐹 = 𝐹 ∗ 𝐹𝐴 ∗ 𝐹𝑅
d. 𝐶𝑜𝑚𝑝𝑢𝑡𝑒 𝑡ℎ𝑒 𝑒𝑛ℎ𝑎𝑛𝑐𝑒𝑑 𝑏𝑜𝑐𝑘 ��(𝑥, 𝑦) = 𝐼𝐹𝐹𝑇(𝐹)
𝐸𝑛𝑑 𝑓𝑜𝑟
2- 𝑅𝑒𝑐𝑜𝑛𝑠𝑡𝑟𝑢𝑐𝑡 𝑡ℎ𝑒 𝑒𝑛ℎ𝑎𝑛𝑐𝑒𝑑 𝑖𝑚𝑎𝑔𝑒 𝑏𝑦 𝑐𝑜𝑚𝑝𝑜𝑠𝑖𝑛𝑔 𝑒𝑛ℎ𝑎𝑛𝑐𝑒𝑑 𝑏𝑙𝑜𝑐𝑘𝑠 ��(𝑥, 𝑦)
Table (3.4): Pseudocode for Fingerprint Image Enhancement using STFT Analysis
3.3 Core Point Detection
The reason of needing a common reference point is that the two fingerprint
images are probably not perfectly aligned. One of the images might be a little displaced
compared to the other one (Eriksson, 2001). So detecting the reference point solves
the image transition problem.
Fingerprints are classified into six main classes (Iwasokun & Akinyokun, 2014;
Prabhakar, 2001; Alonso-Fernandez , et al., 2009), named as: arch, tented arch, right
loop, left loop, whorl, and twin loop, which are shown in Figure 3.5.
Figure (3.5): The six major fingerprint classes: (a) Arch, (b) Tented Arch, (c) Left
Loop, (d) Right Loop, (e) Whorl, and (f) twin loop. Quoted from (Alonso-Fernandez
, et al., 2009)
To be familiar with the fingerprint classification percentage: Arches and tented
arches are the least common found in about 5% of all fingerprint pattern. Loops are
the most common type of fingerprint patterns, and they found in about 60-65%. Whorls
are found in about 30-35%. (Leo, 2004; Hamilton, 2008).
Some parts of the ridge curves resemble semicircles, whose centre is called a
core. Also there are triangular patterns in the fingerprints, whose centre is called a
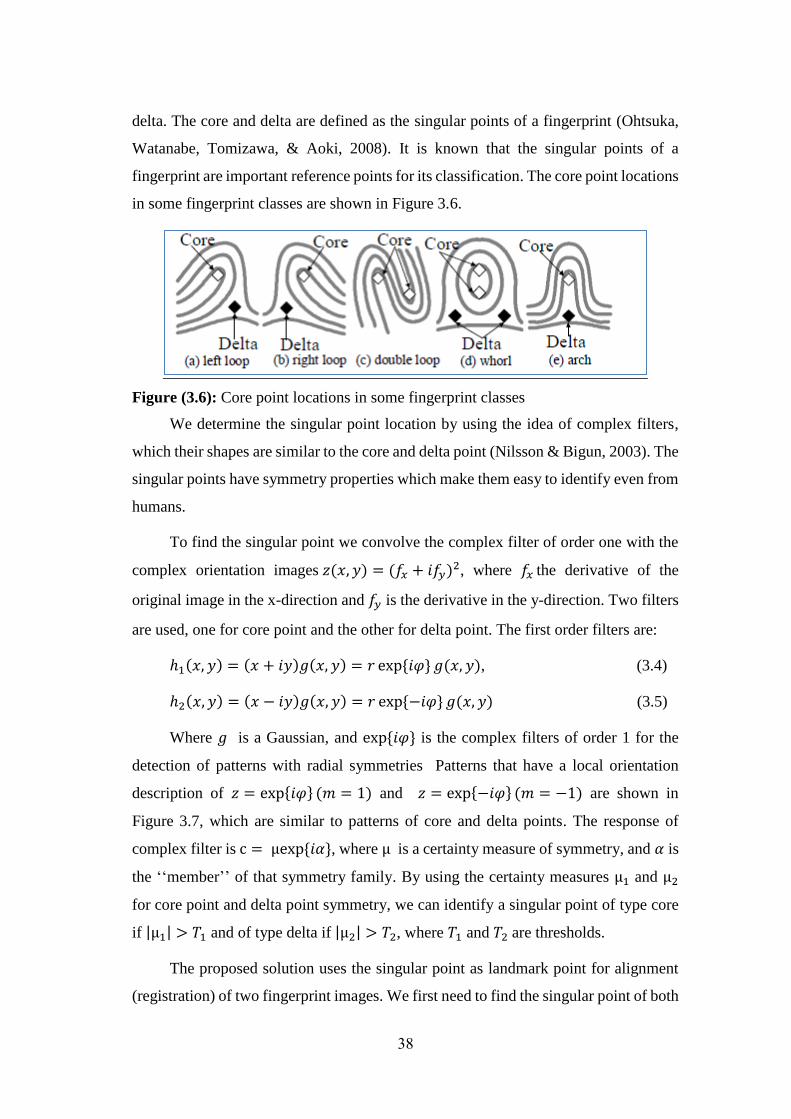
38
delta. The core and delta are defined as the singular points of a fingerprint (Ohtsuka,
Watanabe, Tomizawa, & Aoki, 2008). It is known that the singular points of a
fingerprint are important reference points for its classification. The core point locations
in some fingerprint classes are shown in Figure 3.6.
Figure (3.6): Core point locations in some fingerprint classes
We determine the singular point location by using the idea of complex filters,
which their shapes are similar to the core and delta point (Nilsson & Bigun, 2003). The
singular points have symmetry properties which make them easy to identify even from
humans.
To find the singular point we convolve the complex filter of order one with the
complex orientation images 𝑧(𝑥, 𝑦) = (𝑓𝑥 + 𝑖𝑓𝑦)2, where 𝑓𝑥 the derivative of the
original image in the x-direction and 𝑓𝑦 is the derivative in the y-direction. Two filters
are used, one for core point and the other for delta point. The first order filters are:
ℎ1(𝑥, 𝑦) = (𝑥 + 𝑖𝑦)𝑔(𝑥, 𝑦) = 𝑟 exp{𝑖𝜑} 𝑔(𝑥, 𝑦), (3.4)
ℎ2(𝑥, 𝑦) = (𝑥 − 𝑖𝑦)𝑔(𝑥, 𝑦) = 𝑟 exp{−𝑖𝜑} 𝑔(𝑥, 𝑦) (3.5)
Where 𝑔 is a Gaussian, and exp{𝑖𝜑} is the complex filters of order 1 for the
detection of patterns with radial symmetries Patterns that have a local orientation
description of 𝑧 = exp{𝑖𝜑} (𝑚 = 1) and 𝑧 = exp{−𝑖𝜑} (𝑚 = −1) are shown in
Figure 3.7, which are similar to patterns of core and delta points. The response of
complex filter is c = μexp{𝑖𝛼}, where μ is a certainty measure of symmetry, and 𝛼 is
the ‘‘member’’ of that symmetry family. By using the certainty measures μ1 and μ2
for core point and delta point symmetry, we can identify a singular point of type core
if |μ1| > 𝑇1 and of type delta if |μ2| > 𝑇2, where 𝑇1 and 𝑇2 are thresholds.
The proposed solution uses the singular point as landmark point for alignment
(registration) of two fingerprint images. We first need to find the singular point of both

39
the reference fingerprint image and the unknown one, then rotate and translate the
unknown fingerprint image according to the position and orientation of the reference
one.
Figure (3.7): Complex Filter Patterns.
In this thesis, we focus on determining the core point only, since we need only
one point for fingerprint image alignment, also, not all types of fingerprint classes have
a delta point.
3.4 The Proposed Methodology of Fingerprint Pre-processing Stage
The proposed methodology of fingerprint pre-processing stage contains the
following steps as shown in Figure 3.8: image acquisition, image segmentation, image
rotation, image enhancement, and finally core point detection.
Figure (3.8): The Proposed Methodology of Pre-processing stage of AFIS

40
Chapter 4
Feature Extraction
Techniques
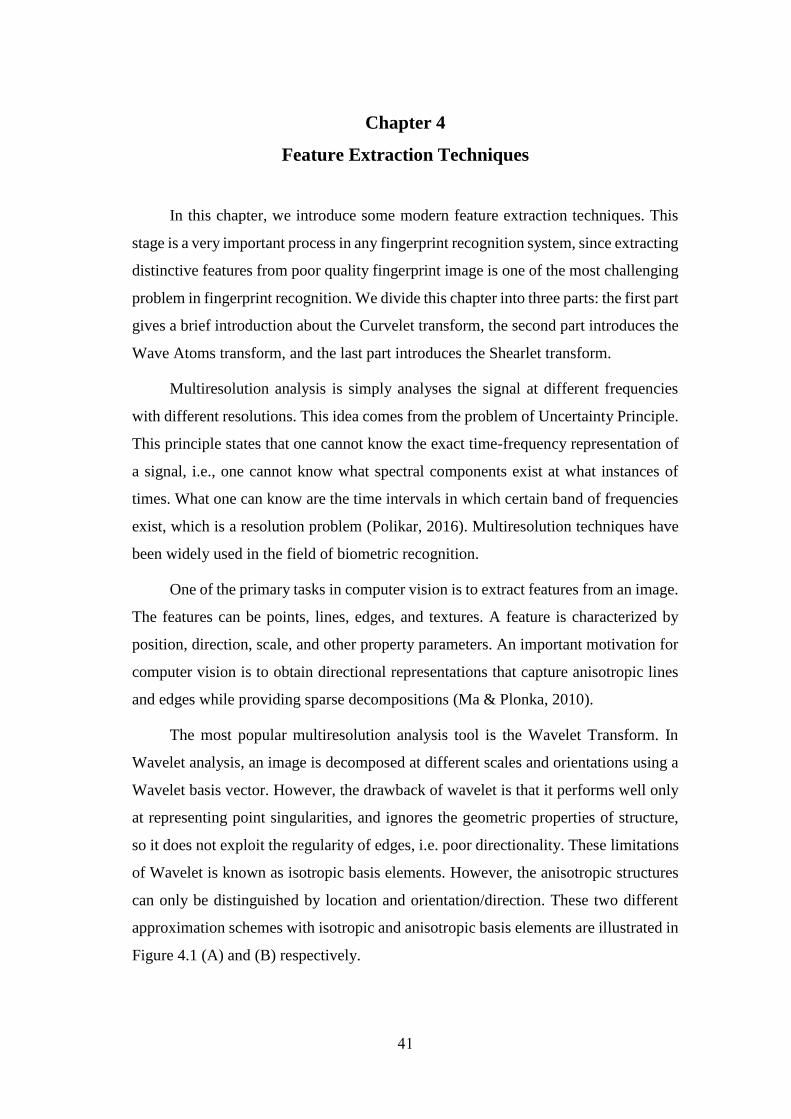
41
Chapter 4
Feature Extraction Techniques
In this chapter, we introduce some modern feature extraction techniques. This
stage is a very important process in any fingerprint recognition system, since extracting
distinctive features from poor quality fingerprint image is one of the most challenging
problem in fingerprint recognition. We divide this chapter into three parts: the first part
gives a brief introduction about the Curvelet transform, the second part introduces the
Wave Atoms transform, and the last part introduces the Shearlet transform.
Multiresolution analysis is simply analyses the signal at different frequencies
with different resolutions. This idea comes from the problem of Uncertainty Principle.
This principle states that one cannot know the exact time-frequency representation of
a signal, i.e., one cannot know what spectral components exist at what instances of
times. What one can know are the time intervals in which certain band of frequencies
exist, which is a resolution problem (Polikar, 2016). Multiresolution techniques have
been widely used in the field of biometric recognition.
One of the primary tasks in computer vision is to extract features from an image.
The features can be points, lines, edges, and textures. A feature is characterized by
position, direction, scale, and other property parameters. An important motivation for
computer vision is to obtain directional representations that capture anisotropic lines
and edges while providing sparse decompositions (Ma & Plonka, 2010).
The most popular multiresolution analysis tool is the Wavelet Transform. In
Wavelet analysis, an image is decomposed at different scales and orientations using a
Wavelet basis vector. However, the drawback of wavelet is that it performs well only
at representing point singularities, and ignores the geometric properties of structure,
so it does not exploit the regularity of edges, i.e. poor directionality. These limitations
of Wavelet is known as isotropic basis elements. However, the anisotropic structures
can only be distinguished by location and orientation/direction. These two different
approximation schemes with isotropic and anisotropic basis elements are illustrated in
Figure 4.1 (A) and (B) respectively.
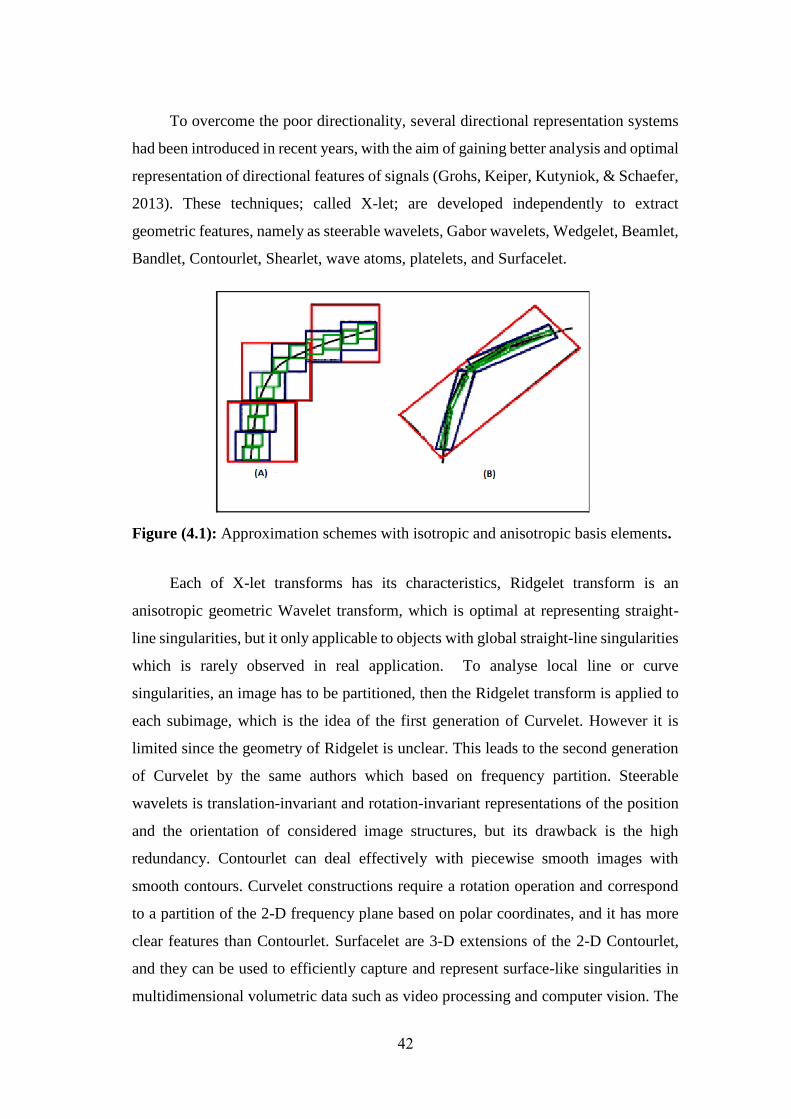
42
To overcome the poor directionality, several directional representation systems
had been introduced in recent years, with the aim of gaining better analysis and optimal
representation of directional features of signals (Grohs, Keiper, Kutyniok, & Schaefer,
2013). These techniques; called X-let; are developed independently to extract
geometric features, namely as steerable wavelets, Gabor wavelets, Wedgelet, Beamlet,
Bandlet, Contourlet, Shearlet, wave atoms, platelets, and Surfacelet.
Figure (4.1): Approximation schemes with isotropic and anisotropic basis elements.
Each of X-let transforms has its characteristics, Ridgelet transform is an
anisotropic geometric Wavelet transform, which is optimal at representing straight-
line singularities, but it only applicable to objects with global straight-line singularities
which is rarely observed in real application. To analyse local line or curve
singularities, an image has to be partitioned, then the Ridgelet transform is applied to
each subimage, which is the idea of the first generation of Curvelet. However it is
limited since the geometry of Ridgelet is unclear. This leads to the second generation
of Curvelet by the same authors which based on frequency partition. Steerable
wavelets is translation-invariant and rotation-invariant representations of the position
and the orientation of considered image structures, but its drawback is the high
redundancy. Contourlet can deal effectively with piecewise smooth images with
smooth contours. Curvelet constructions require a rotation operation and correspond
to a partition of the 2-D frequency plane based on polar coordinates, and it has more
clear features than Contourlet. Surfacelet are 3-D extensions of the 2-D Contourlet,
and they can be used to efficiently capture and represent surface-like singularities in
multidimensional volumetric data such as video processing and computer vision. The
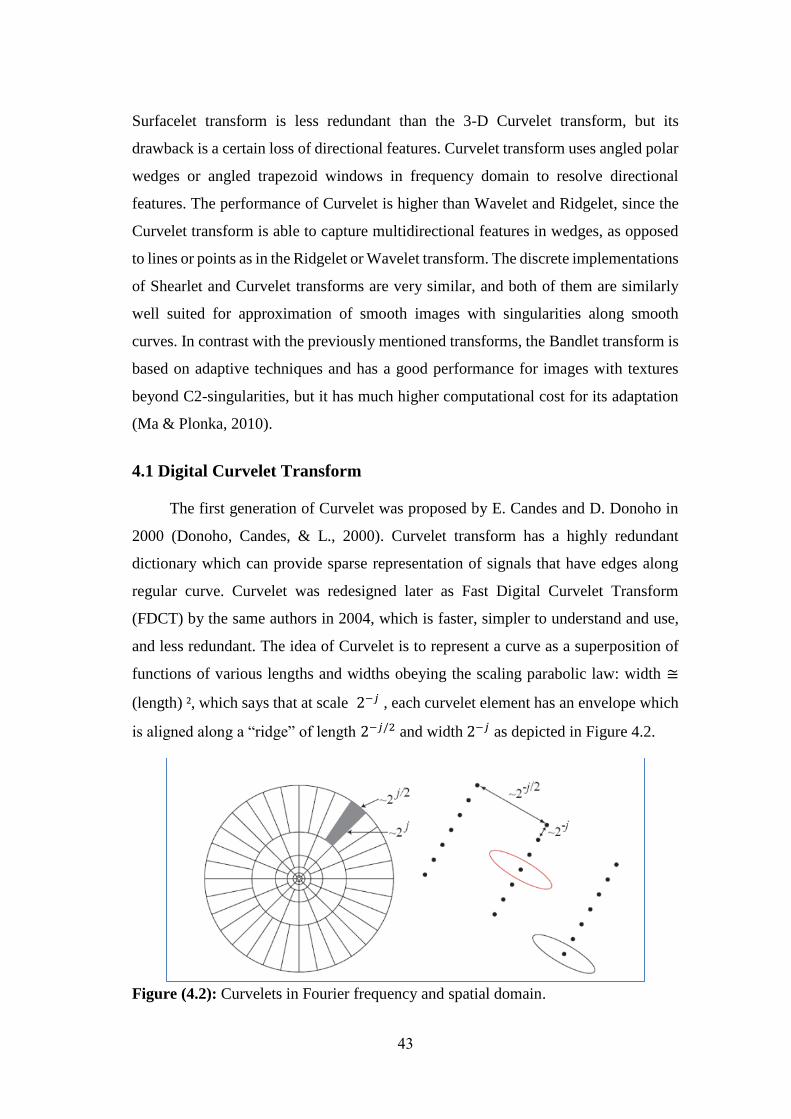
43
Surfacelet transform is less redundant than the 3-D Curvelet transform, but its
drawback is a certain loss of directional features. Curvelet transform uses angled polar
wedges or angled trapezoid windows in frequency domain to resolve directional
features. The performance of Curvelet is higher than Wavelet and Ridgelet, since the
Curvelet transform is able to capture multidirectional features in wedges, as opposed
to lines or points as in the Ridgelet or Wavelet transform. The discrete implementations
of Shearlet and Curvelet transforms are very similar, and both of them are similarly
well suited for approximation of smooth images with singularities along smooth
curves. In contrast with the previously mentioned transforms, the Bandlet transform is
based on adaptive techniques and has a good performance for images with textures
beyond C2-singularities, but it has much higher computational cost for its adaptation
(Ma & Plonka, 2010).
4.1 Digital Curvelet Transform
The first generation of Curvelet was proposed by E. Candes and D. Donoho in
2000 (Donoho, Candes, & L., 2000). Curvelet transform has a highly redundant
dictionary which can provide sparse representation of signals that have edges along
regular curve. Curvelet was redesigned later as Fast Digital Curvelet Transform
(FDCT) by the same authors in 2004, which is faster, simpler to understand and use,
and less redundant. The idea of Curvelet is to represent a curve as a superposition of
functions of various lengths and widths obeying the scaling parabolic law: width ≅
(length) ², which says that at scale 2−𝑗 , each curvelet element has an envelope which
is aligned along a “ridge” of length 2−𝑗/2 and width 2−𝑗 as depicted in Figure 4.2.
Figure (4.2): Curvelets in Fourier frequency and spatial domain.
44
This law is suited for approximating C² singularity carves (Grohs, Keiper,
Kutyniok, & Schaefer, 2013). Figure 4.2 shows Curvelets in Fourier frequency domain
and spatial domain. Figure 4.3 (a) shows the Curvelets frequency tilling in continues
domain which is defined by using coronae and rotations, while Figure 4.3 (b) shows
the Curvelet transform in the discrete domain.
In order to implement Curvelet transform (Cand`es, Demanet, Donoho, & Ying,
2005), first 2D Fast Fourier Transform (FFT) of the image is taken. Then the 2D
Fourier frequency plane is divided into wedges (see the grey region for j=5 in Figure
4.2, and Figure 4.3). The length of the localizing windows is doubled at every other
dyadic subband. The parabolic shape of wedges is the result of partitioning the Fourier
plane into radial (concentric circles, and squares) and angular (rotations and shears)
divisions. Different scales are obtained by radial division; the smallest scale defines
the finest resolution while the largest scale defines the coarsest resolution. Angular
division divides each scale into different orientation; the maximum number of
orientations was found at the finest resolution and the lesser number of orientations
was found at coarsest resolution. The concentric circles are responsible for the
decomposition of an image into multiple scales (used for bandpassing the image at
different scale) and the angular divisions partition the bandpassed image into different
angles or orientations. Thus if we want to deal with a particular wedge we’ll need to
define its scale j and angle θ.
Figure (4.3): Curvelet Frequency Tilling. Quoted from (Fadili & Starck, 2009)
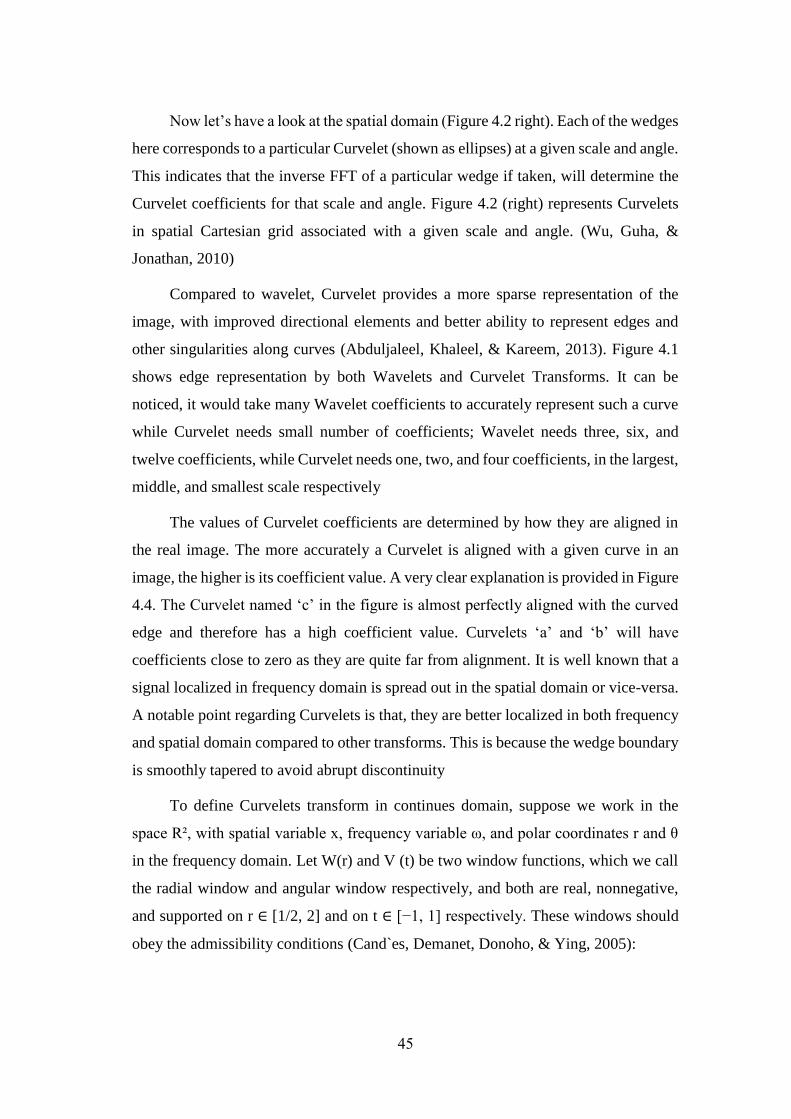
45
Now let’s have a look at the spatial domain (Figure 4.2 right). Each of the wedges
here corresponds to a particular Curvelet (shown as ellipses) at a given scale and angle.
This indicates that the inverse FFT of a particular wedge if taken, will determine the
Curvelet coefficients for that scale and angle. Figure 4.2 (right) represents Curvelets
in spatial Cartesian grid associated with a given scale and angle. (Wu, Guha, &
Jonathan, 2010)
Compared to wavelet, Curvelet provides a more sparse representation of the
image, with improved directional elements and better ability to represent edges and
other singularities along curves (Abduljaleel, Khaleel, & Kareem, 2013). Figure 4.1
shows edge representation by both Wavelets and Curvelet Transforms. It can be
noticed, it would take many Wavelet coefficients to accurately represent such a curve
while Curvelet needs small number of coefficients; Wavelet needs three, six, and
twelve coefficients, while Curvelet needs one, two, and four coefficients, in the largest,
middle, and smallest scale respectively
The values of Curvelet coefficients are determined by how they are aligned in
the real image. The more accurately a Curvelet is aligned with a given curve in an
image, the higher is its coefficient value. A very clear explanation is provided in Figure
4.4. The Curvelet named ‘c’ in the figure is almost perfectly aligned with the curved
edge and therefore has a high coefficient value. Curvelets ‘a’ and ‘b’ will have
coefficients close to zero as they are quite far from alignment. It is well known that a
signal localized in frequency domain is spread out in the spatial domain or vice-versa.
A notable point regarding Curvelets is that, they are better localized in both frequency
and spatial domain compared to other transforms. This is because the wedge boundary
is smoothly tapered to avoid abrupt discontinuity
To define Curvelets transform in continues domain, suppose we work in the
space R², with spatial variable x, frequency variable ω, and polar coordinates r and θ
in the frequency domain. Let W(r) and V (t) be two window functions, which we call
the radial window and angular window respectively, and both are real, nonnegative,
and supported on r ∈ [1/2, 2] and on t ∈ [−1, 1] respectively. These windows should
obey the admissibility conditions (Cand`es, Demanet, Donoho, & Ying, 2005):
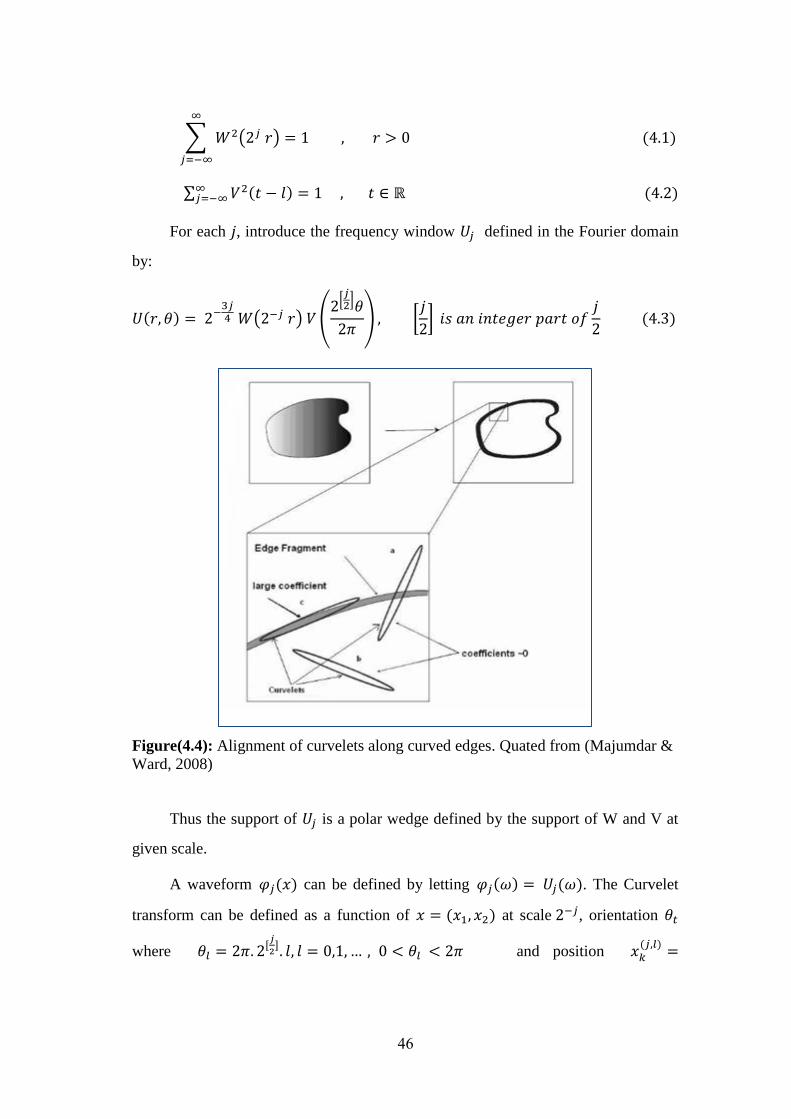
46
∑ 𝑊2(2𝑗 𝑟) = 1 , 𝑟 > 0 (4.1)
∞
𝑗=−∞
∑ 𝑉2(𝑡 − 𝑙) = 1 , 𝑡 ∈ ℝ∞𝑗=−∞ (4.2)
For each 𝑗, introduce the frequency window 𝑈𝑗 defined in the Fourier domain
by:
𝑈(𝑟, 𝜃) = 2−3𝑗4 𝑊(2−𝑗 𝑟) 𝑉 (
2[𝑗2
]𝜃
2𝜋) , [
𝑗
2] 𝑖𝑠 𝑎𝑛 𝑖𝑛𝑡𝑒𝑔𝑒𝑟 𝑝𝑎𝑟𝑡 𝑜𝑓
𝑗
2 (4.3)
Figure(4.4): Alignment of curvelets along curved edges. Quated from (Majumdar &
Ward, 2008)
Thus the support of 𝑈𝑗 is a polar wedge defined by the support of W and V at
given scale.
A waveform 𝜑𝑗(𝑥) can be defined by letting 𝜑𝑗(𝜔) = 𝑈𝑗(𝜔). The Curvelet
transform can be defined as a function of 𝑥 = (𝑥1, 𝑥2) at scale 2−𝑗, orientation 𝜃𝑡
where 𝜃𝑙 = 2𝜋. 2[𝑗
2]. 𝑙, 𝑙 = 0,1, … , 0 < 𝜃𝑙 < 2𝜋 and position 𝑥𝑘
(𝑗,𝑙)=
47
𝑅𝜃𝑙 (𝑘1. 2−𝑗 , 𝑘2. 2−𝑗/2 ), where 𝑘 = (𝑘1, 𝑘2) is the shift parameter by (Cand`es,
Demanet, Donoho, & Ying, 2005):
𝜑𝑗,𝑙,𝑘(𝑥) = 𝜑𝑗 (𝑅𝜃𝑙 (𝑥 − 𝑥𝑘
(𝑗,𝑙))) (4.4)
A Curvelet coefficient is the inner product between an element 𝑓 𝜖 𝐿2(ℝ2) and a
Curvelet 𝜑𝑗,𝑙,𝑘:
𝑐𝑗,𝑙,𝑘 ∶= (𝑓, 𝜑𝑗,𝑙,𝑘 ) = ∫ℝ2 𝑓(𝑥) 𝜑𝑗,𝑙,𝑘 (𝑥) 𝑑𝑥 (4.5)
Where 𝑐𝑗,𝑙,𝑘 is the Curvelet coefficient, and (. ) donates the conjugate operator.
Based on Plancherel’s Theory,
𝑐𝑗,𝑙,𝑘 ∶= 1
2𝜋2∫
ℝ2 𝑓(𝜔)𝜑𝑗,𝑙,𝑘 (𝑥) 𝑑𝜔 (4.6)
𝑐𝑗,𝑙,𝑘 ∶= 1
2𝜋2∫
ℝ2 𝑓(𝜔)𝑈𝑗( 𝑅𝜃𝑡
𝜔)𝑒𝑖 (𝑥𝑘(𝑗,𝑙)
,𝜔) 𝑑𝜔 (4.7)
If the input 𝑓[𝑥1, 𝑥2] ( 0 ≤ 𝑥1, 𝑥2 < 𝑛) the spatial Cartesian is an image, then
the discrete form of the continuous Curvelet transform can be expressed as the
following:
𝑐𝐷𝑗,𝑙,𝑘 ∶= ∑ 𝑓[𝑥1, 𝑥2]
0≤𝑥1,𝑥2 <𝑛
𝜑𝐷𝑗,𝑙,𝑘
[𝑥1, 𝑥2] 𝑑𝜔 (4.8)
Where each 𝜑𝐷𝑗,𝑙,𝑘
is a digital curvelet waveform (D stands for “digital”)
There are two generations of Curvelet transform. The first generation uses
complex series of steps, involving Ridgelet analysis of the image, and its performance
is very slow. The second generation eliminates the use of Ridgelet transform as a pre-
processing step in the first generation, and it is simpler, faster, and less redundant than
the original one. This new generation is known as Fast Discrete Curvelet Transform
(FDCT), which is implemented by two different forms: Curvelets via USFFT
(Unequally Spaced Fast Fourier Transform) and Curvelets via Wrapping. The
difference between them is the choice of spatial grid to translate Curvelets at each scale
and angle. FDCT wrapping is the fastest Curvelet transform currently available.
Because of this, Curvelet via wrapping will be used for this work.
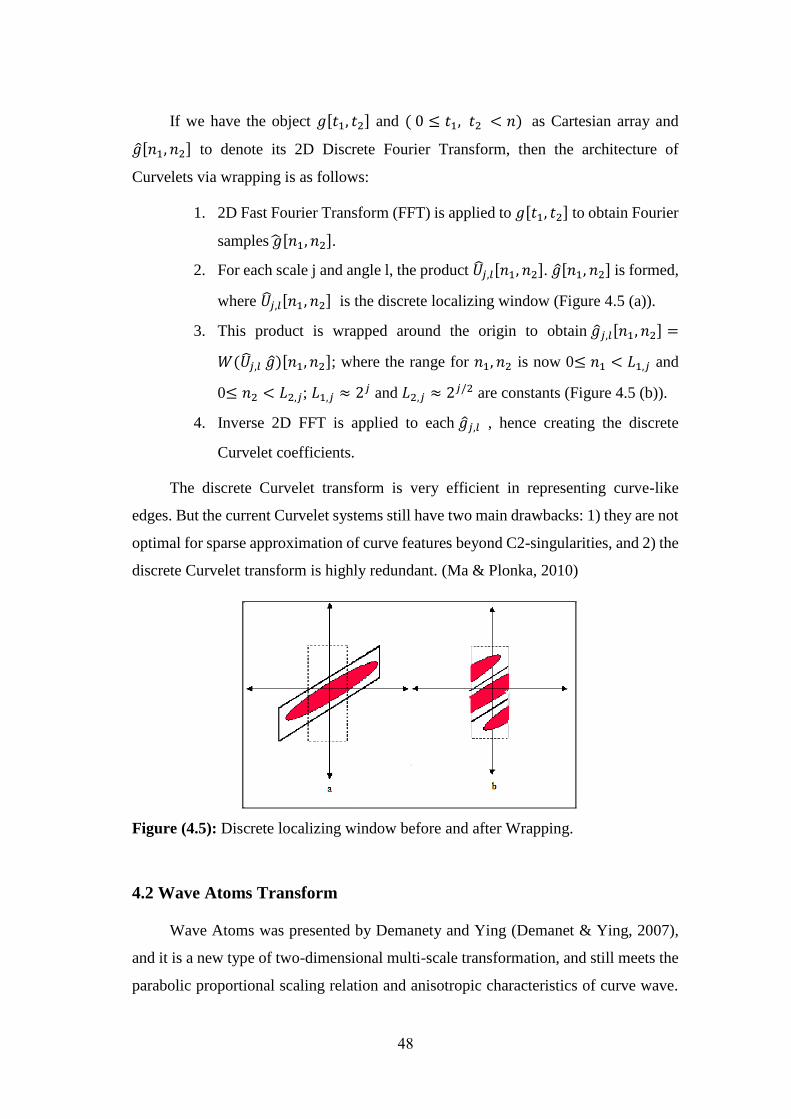
48
If we have the object 𝑔[𝑡1, 𝑡2] and ( 0 ≤ 𝑡1, 𝑡2 < 𝑛) as Cartesian array and
��[𝑛1, 𝑛2] to denote its 2D Discrete Fourier Transform, then the architecture of
Curvelets via wrapping is as follows:
1. 2D Fast Fourier Transform (FFT) is applied to 𝑔[𝑡1, 𝑡2] to obtain Fourier
samples ��[𝑛1, 𝑛2].
2. For each scale j and angle l, the product ��𝑗,𝑙[𝑛1, 𝑛2]. ��[𝑛1, 𝑛2] is formed,
where ��𝑗,𝑙[𝑛1, 𝑛2] is the discrete localizing window (Figure 4.5 (a)).
3. This product is wrapped around the origin to obtain ��𝑗,𝑙[𝑛1, 𝑛2] =
𝑊(��𝑗,𝑙 ��)[𝑛1, 𝑛2]; where the range for 𝑛1, 𝑛2 is now 0≤ 𝑛1 < 𝐿1,𝑗 and
0≤ 𝑛2 < 𝐿2,𝑗; 𝐿1,𝑗 ≈ 2𝑗 and 𝐿2,𝑗 ≈ 2𝑗/2 are constants (Figure 4.5 (b)).
4. Inverse 2D FFT is applied to each ��𝑗,𝑙 , hence creating the discrete
Curvelet coefficients.
The discrete Curvelet transform is very efficient in representing curve-like
edges. But the current Curvelet systems still have two main drawbacks: 1) they are not
optimal for sparse approximation of curve features beyond C2-singularities, and 2) the
discrete Curvelet transform is highly redundant. (Ma & Plonka, 2010)
Figure (4.5): Discrete localizing window before and after Wrapping.
4.2 Wave Atoms Transform
Wave Atoms was presented by Demanety and Ying (Demanet & Ying, 2007),
and it is a new type of two-dimensional multi-scale transformation, and still meets the
parabolic proportional scaling relation and anisotropic characteristics of curve wave.

49
The name of wave atoms comes from the property that they also provide an optimally
sparse representation of wave propagators, a mathematical result of independent
interest, with applications to fast numerical solvers for wave equations (Demanet &
Ying, 2007).
Wave atoms satisfies all multiresolution transform properties which are
described as follows (Majumdar & Ward, 2008; Hejazi & Alhanjouri, 2010):
1- Multiresolution: this property state that the transform should allow
images to be successively approximated, from coarse to fine
resolutions. The frequency plane of Wave Atom is divided into
concentric rings in order to facilitate bandpassing at multiple
resolutions.
2- Localization: this means that the basis functions of the transforms
should be localized in both the spatial and the frequency domains.
Wave Atom is localized in both spatial domain and frequency domain.
3- Critical sampling: For some applications (e.g., compression), the
transforms should form a basis, or a frame with small redundancy.
Wave Atom form tight frames with redundancy two.
4- Directionality: this means that the transform should contain basis
functions oriented at a variety of direction. In Wave Atom the entire
frequency plane is divided into angular wedges, and this allows for
analyzing the image at various orientations
5- Anisotropy: When a physical property changes with direction, that
property is said anisotropy For image transforms, anisotropy means
that the basis elements of the transforms should not be circular (similar
in all directions) but may be elliptical (more along the major axis and
less along the minor axis). Wave Atoms are elliptical in shape (the
major and the minor axes related by a parabolic scaling law), thus they
are anisotropic.
Wave atoms interpolate exactly between directional wavelets and Gabor, in the
sense that the period of the oscillations of each wave packet (wavelength) is linked to
the size of the essential support (diameter) by the parabolic scaling. Figure 4.6 shows
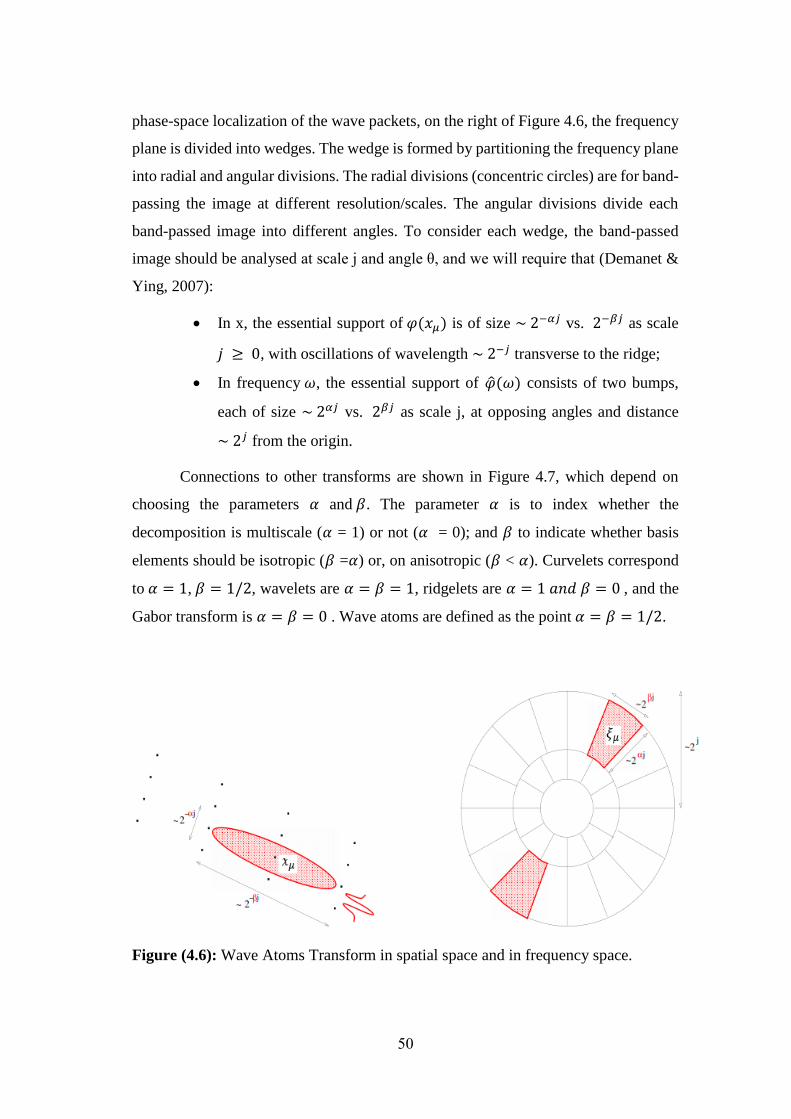
50
phase-space localization of the wave packets, on the right of Figure 4.6, the frequency
plane is divided into wedges. The wedge is formed by partitioning the frequency plane
into radial and angular divisions. The radial divisions (concentric circles) are for band-
passing the image at different resolution/scales. The angular divisions divide each
band-passed image into different angles. To consider each wedge, the band-passed
image should be analysed at scale j and angle θ, and we will require that (Demanet &
Ying, 2007):
In x, the essential support of 𝜑(𝑥𝜇) is of size ~ 2−𝛼𝑗 vs. 2−𝛽𝑗 as scale
𝑗 ≥ 0, with oscillations of wavelength ~ 2−𝑗 transverse to the ridge;
In frequency 𝜔, the essential support of ��(𝜔) consists of two bumps,
each of size ~ 2𝛼𝑗 vs. 2𝛽𝑗 as scale j, at opposing angles and distance
~ 2𝑗 from the origin.
Connections to other transforms are shown in Figure 4.7, which depend on
choosing the parameters 𝛼 and 𝛽. The parameter 𝛼 is to index whether the
decomposition is multiscale (𝛼 = 1) or not (𝛼 = 0); and 𝛽 to indicate whether basis
elements should be isotropic (𝛽 =𝛼) or, on anisotropic (𝛽 < 𝛼). Curvelets correspond
to 𝛼 = 1, 𝛽 = 1/2, wavelets are 𝛼 = 𝛽 = 1, ridgelets are 𝛼 = 1 𝑎𝑛𝑑 𝛽 = 0 , and the
Gabor transform is 𝛼 = 𝛽 = 0 . Wave atoms are defined as the point 𝛼 = 𝛽 = 1/2.
Figure (4.6): Wave Atoms Transform in spatial space and in frequency space.
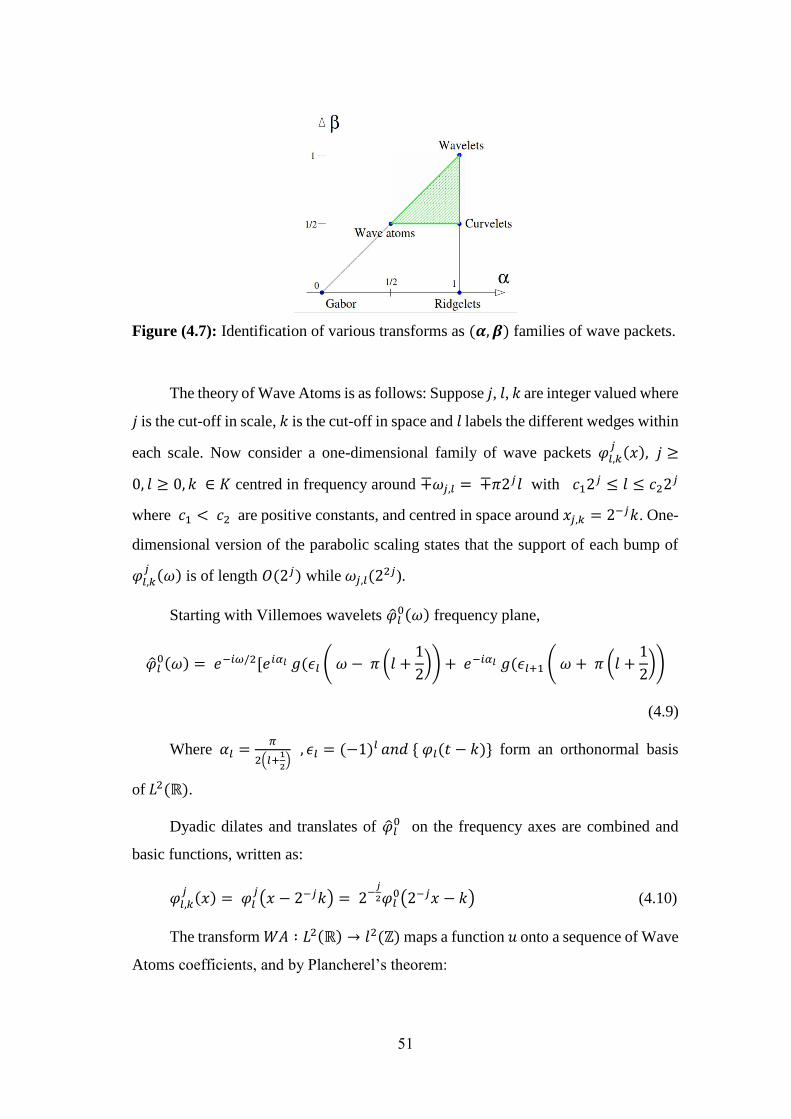
51
Figure (4.7): Identification of various transforms as (𝜶, 𝜷) families of wave packets.
The theory of Wave Atoms is as follows: Suppose 𝑗, 𝑙, 𝑘 are integer valued where
𝑗 is the cut-off in scale, 𝑘 is the cut-off in space and 𝑙 labels the different wedges within
each scale. Now consider a one-dimensional family of wave packets 𝜑𝑙,𝑘𝑗 (𝑥), 𝑗 ≥
0, 𝑙 ≥ 0, 𝑘 ∈ 𝐾 centred in frequency around ∓𝜔𝑗,𝑙 = ∓𝜋2𝑗𝑙 with 𝑐12𝑗 ≤ 𝑙 ≤ 𝑐22𝑗
where 𝑐1 < 𝑐2 are positive constants, and centred in space around 𝑥𝑗,𝑘 = 2−𝑗𝑘. One-
dimensional version of the parabolic scaling states that the support of each bump of
𝜑𝑙,𝑘𝑗 (𝜔) is of length 𝑂(2𝑗) while 𝜔𝑗,𝑙(22𝑗).
Starting with Villemoes wavelets ��𝑙0(𝜔) frequency plane,
��𝑙0(𝜔) = 𝑒−𝑖𝜔/2[𝑒𝑖𝛼𝑙 𝑔(𝜖𝑙 ( 𝜔 − 𝜋 (𝑙 +
1
2)) + 𝑒−𝑖𝛼𝑙 𝑔(𝜖𝑙+1 ( 𝜔 + 𝜋 (𝑙 +
1
2))
(4.9)
Where 𝛼𝑙 =𝜋
2(𝑙+1
2) , 𝜖𝑙 = (−1)𝑙 𝑎𝑛𝑑 { 𝜑𝑙(𝑡 − 𝑘)} form an orthonormal basis
of 𝐿2(ℝ).
Dyadic dilates and translates of ��𝑙0 on the frequency axes are combined and
basic functions, written as:
𝜑𝑙,𝑘𝑗 (𝑥) = 𝜑𝑙
𝑗(𝑥 − 2−𝑗𝑘) = 2−
𝑗
2𝜑𝑙0(2−𝑗𝑥 − 𝑘) (4.10)
The transform 𝑊𝐴 ∶ 𝐿2(ℝ) → 𝑙2(ℤ) maps a function 𝑢 onto a sequence of Wave
Atoms coefficients, and by Plancherel’s theorem:
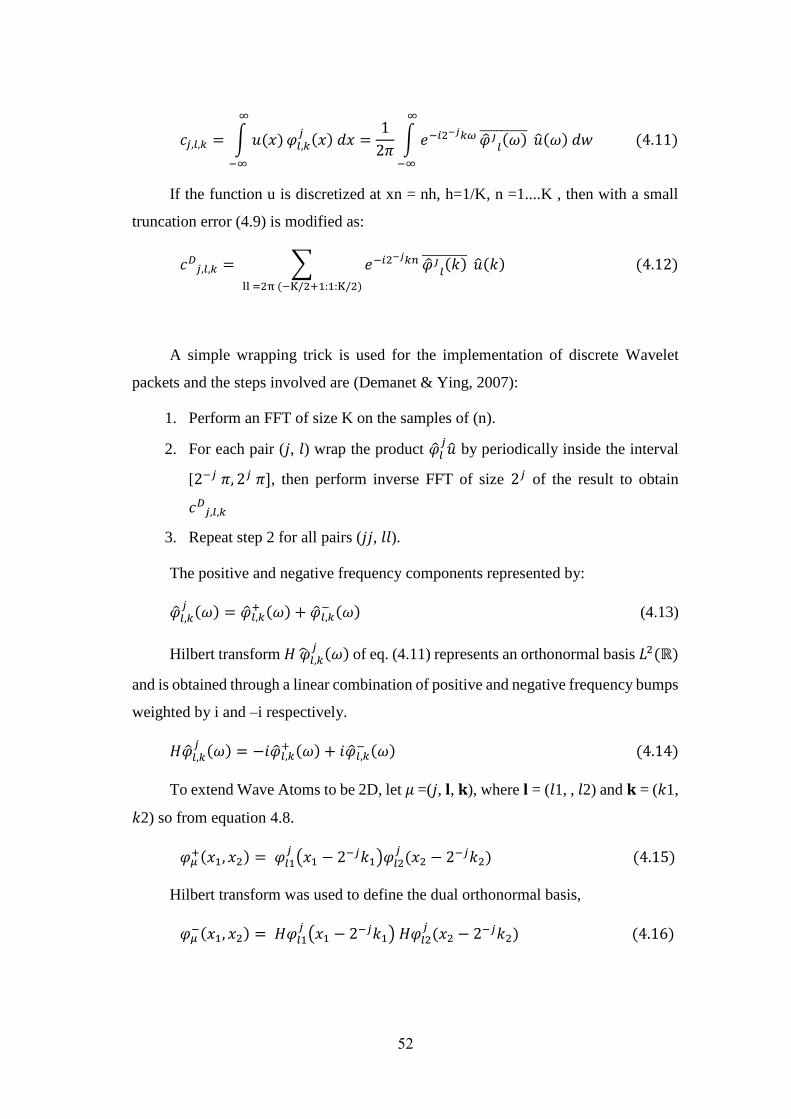
52
𝑐𝑗,𝑙,𝑘 = ∫ 𝑢(𝑥)
∞
−∞
𝜑𝑙,𝑘𝑗 (𝑥) 𝑑𝑥 =
1
2𝜋∫ 𝑒−𝑖2−𝑗𝑘𝜔 ��𝑗
𝑙(𝜔)
∞
−∞
��(𝜔) 𝑑𝑤 (4.11)
If the function u is discretized at xn = nh, h=1/K, n =1....K , then with a small
truncation error (4.9) is modified as:
𝑐𝐷𝑗,𝑙,𝑘 = ∑ 𝑒−𝑖2−𝑗𝑘𝑛 ��𝑗
𝑙(𝑘)
ll =2π (−K/2+1:1:K/2)
��(𝑘) (4.12)
A simple wrapping trick is used for the implementation of discrete Wavelet
packets and the steps involved are (Demanet & Ying, 2007):
1. Perform an FFT of size K on the samples of (n).
2. For each pair (𝑗, 𝑙) wrap the product ��𝑙𝑗�� by periodically inside the interval
[2−𝑗 𝜋, 2𝑗 𝜋], then perform inverse FFT of size 2𝑗 of the result to obtain
𝑐𝐷𝑗,𝑙,𝑘
3. Repeat step 2 for all pairs (𝑗𝑗, 𝑙𝑙).
The positive and negative frequency components represented by:
��𝑙,𝑘𝑗 (𝜔) = ��𝑙,𝑘
+ (𝜔) + ��𝑙,𝑘− (𝜔) (4.13)
Hilbert transform 𝐻 ��𝑙,𝑘𝑗 (𝜔) of eq. (4.11) represents an orthonormal basis 𝐿2(ℝ)
and is obtained through a linear combination of positive and negative frequency bumps
weighted by i and –i respectively.
𝐻��𝑙,𝑘𝑗 (𝜔) = −𝑖��𝑙,𝑘
+ (𝜔) + 𝑖��𝑙,𝑘− (𝜔) (4.14)
To extend Wave Atoms to be 2D, let 𝜇 =(𝑗, 𝐥, 𝐤), where 𝐥 = (𝑙1, , 𝑙2) and 𝐤 = (𝑘1,
𝑘2) so from equation 4.8.
𝜑𝜇+(𝑥1, 𝑥2) = 𝜑𝑙1
𝑗(𝑥1 − 2−𝑗𝑘1)𝜑𝑙2
𝑗(𝑥2 − 2−𝑗𝑘2) (4.15)
Hilbert transform was used to define the dual orthonormal basis,
𝜑𝜇−(𝑥1, 𝑥2) = 𝐻𝜑𝑙1
𝑗(𝑥1 − 2−𝑗𝑘1) 𝐻𝜑𝑙2
𝑗(𝑥2 − 2−𝑗𝑘2) (4.16)
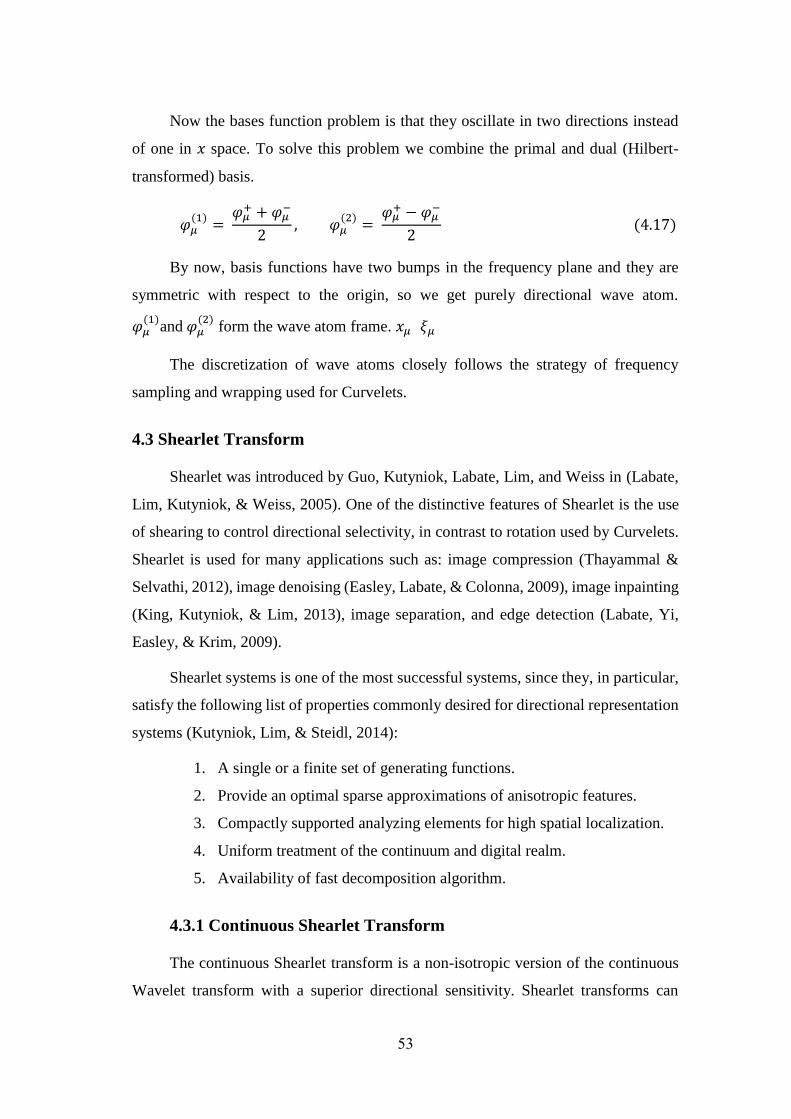
53
Now the bases function problem is that they oscillate in two directions instead
of one in 𝑥 space. To solve this problem we combine the primal and dual (Hilbert-
transformed) basis.
𝜑𝜇(1)
= 𝜑𝜇
+ + 𝜑𝜇−
2, 𝜑𝜇
(2)=
𝜑𝜇+ − 𝜑𝜇
−
2 (4.17)
By now, basis functions have two bumps in the frequency plane and they are
symmetric with respect to the origin, so we get purely directional wave atom.
𝜑𝜇(1)
and 𝜑𝜇(2)
form the wave atom frame. 𝑥𝜇 𝜉𝜇
The discretization of wave atoms closely follows the strategy of frequency
sampling and wrapping used for Curvelets.
4.3 Shearlet Transform
Shearlet was introduced by Guo, Kutyniok, Labate, Lim, and Weiss in (Labate,
Lim, Kutyniok, & Weiss, 2005). One of the distinctive features of Shearlet is the use
of shearing to control directional selectivity, in contrast to rotation used by Curvelets.
Shearlet is used for many applications such as: image compression (Thayammal &
Selvathi, 2012), image denoising (Easley, Labate, & Colonna, 2009), image inpainting
(King, Kutyniok, & Lim, 2013), image separation, and edge detection (Labate, Yi,
Easley, & Krim, 2009).
Shearlet systems is one of the most successful systems, since they, in particular,
satisfy the following list of properties commonly desired for directional representation
systems (Kutyniok, Lim, & Steidl, 2014):
1. A single or a finite set of generating functions.
2. Provide an optimal sparse approximations of anisotropic features.
3. Compactly supported analyzing elements for high spatial localization.
4. Uniform treatment of the continuum and digital realm.
5. Availability of fast decomposition algorithm.
4.3.1 Continuous Shearlet Transform
The continuous Shearlet transform is a non-isotropic version of the continuous
Wavelet transform with a superior directional sensitivity. Shearlet transforms can
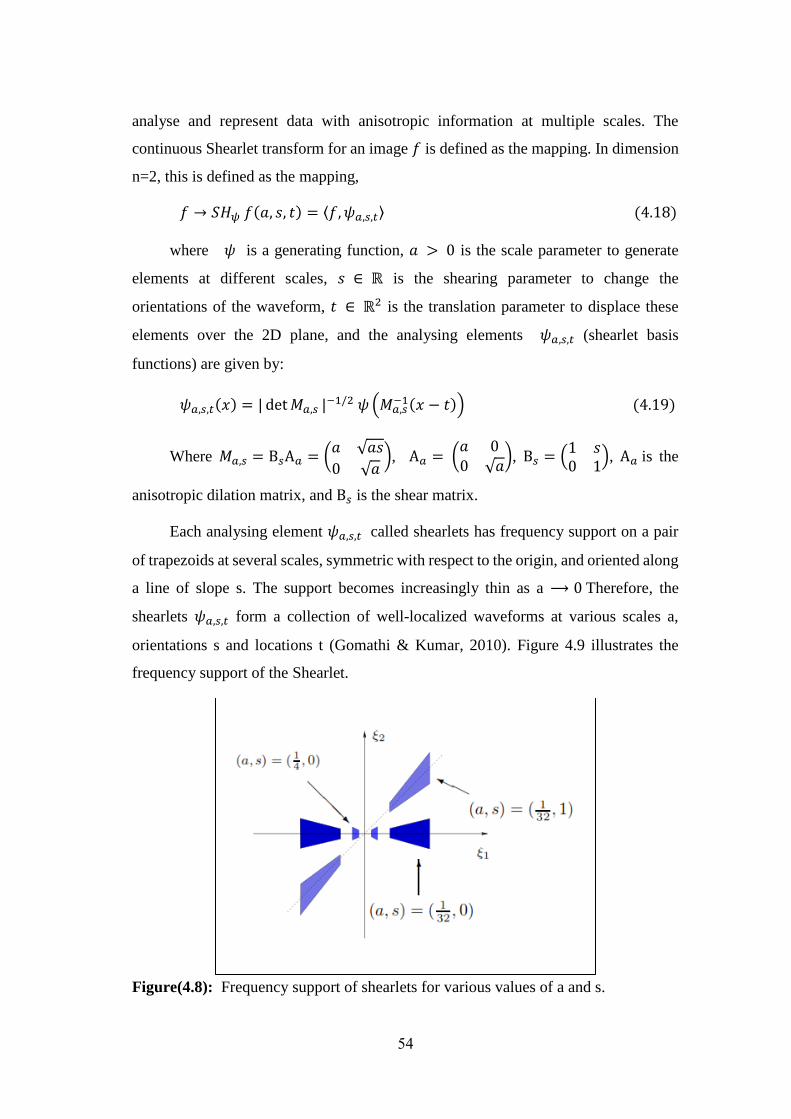
54
analyse and represent data with anisotropic information at multiple scales. The
continuous Shearlet transform for an image 𝑓 is defined as the mapping. In dimension
n=2, this is defined as the mapping,
𝑓 → 𝑆𝐻𝜓 𝑓(𝑎, 𝑠, 𝑡) = ⟨𝑓, 𝜓𝑎,𝑠,𝑡⟩ (4.18)
where 𝜓 is a generating function, 𝑎 > 0 is the scale parameter to generate
elements at different scales, 𝑠 ∈ ℝ is the shearing parameter to change the
orientations of the waveform, 𝑡 ∈ ℝ2 is the translation parameter to displace these
elements over the 2D plane, and the analysing elements 𝜓𝑎,𝑠,𝑡 (shearlet basis
functions) are given by:
𝜓𝑎,𝑠,𝑡(𝑥) = | det 𝑀𝑎,𝑠 |−1/2 𝜓 (𝑀𝑎,𝑠−1(𝑥 − 𝑡)) (4.19)
Where 𝑀𝑎,𝑠 = B𝑠A𝑎 = (𝑎 √𝑎𝑠
0 √𝑎), A𝑎 = (
𝑎 00 √𝑎
), B𝑠 = (1 𝑠0 1
), A𝑎 is the
anisotropic dilation matrix, and B𝑠 is the shear matrix.
Each analysing element 𝜓𝑎,𝑠,𝑡 called shearlets has frequency support on a pair
of trapezoids at several scales, symmetric with respect to the origin, and oriented along
a line of slope s. The support becomes increasingly thin as a ⟶ 0 Therefore, the
shearlets 𝜓𝑎,𝑠,𝑡 form a collection of well-localized waveforms at various scales a,
orientations s and locations t (Gomathi & Kumar, 2010). Figure 4.9 illustrates the
frequency support of the Shearlet.
Figure(4.8): Frequency support of shearlets for various values of a and s.
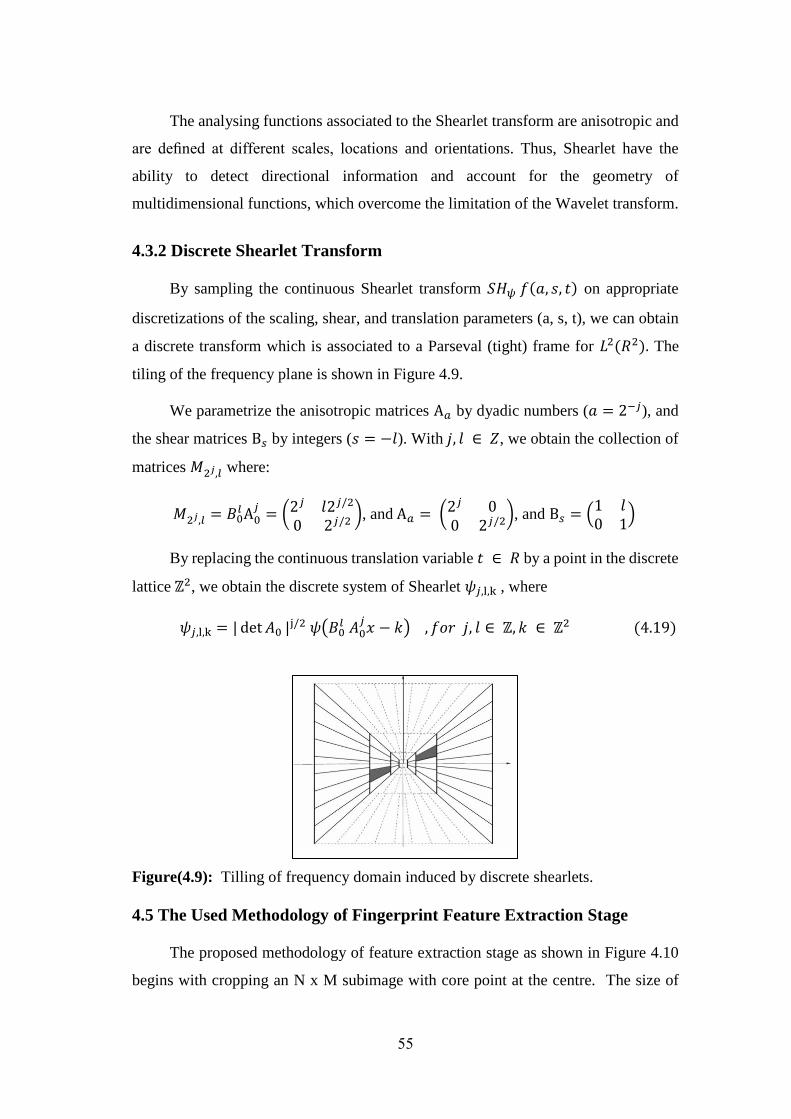
55
The analysing functions associated to the Shearlet transform are anisotropic and
are defined at different scales, locations and orientations. Thus, Shearlet have the
ability to detect directional information and account for the geometry of
multidimensional functions, which overcome the limitation of the Wavelet transform.
4.3.2 Discrete Shearlet Transform
By sampling the continuous Shearlet transform 𝑆𝐻𝜓 𝑓(𝑎, 𝑠, 𝑡) on appropriate
discretizations of the scaling, shear, and translation parameters (a, s, t), we can obtain
a discrete transform which is associated to a Parseval (tight) frame for 𝐿2(𝑅2). The
tiling of the frequency plane is shown in Figure 4.9.
We parametrize the anisotropic matrices A𝑎 by dyadic numbers (𝑎 = 2−𝑗), and
the shear matrices B𝑠 by integers (𝑠 = −𝑙). With 𝑗, 𝑙 ∈ 𝑍, we obtain the collection of
matrices 𝑀2𝑗,𝑙 where:
𝑀2𝑗,𝑙 = 𝐵0𝑙 A0
𝑗= (2𝑗 𝑙2𝑗/2
0 2𝑗/2), and A𝑎 = (2𝑗 0
0 2𝑗/2), and B𝑠 = (
1 𝑙0 1
)
By replacing the continuous translation variable 𝑡 ∈ 𝑅 by a point in the discrete
lattice ℤ2, we obtain the discrete system of Shearlet 𝜓𝑗,l,k , where
𝜓𝑗,l,k = | det 𝐴0 |j/2 𝜓(𝐵0𝑙 𝐴0
𝑗𝑥 − 𝑘) , 𝑓𝑜𝑟 𝑗, 𝑙 ∈ ℤ, 𝑘 ∈ ℤ2 (4.19)
Figure(4.9): Tilling of frequency domain induced by discrete shearlets.
4.5 The Used Methodology of Fingerprint Feature Extraction Stage
The proposed methodology of feature extraction stage as shown in Figure 4.10
begins with cropping an N x M subimage with core point at the centre. The size of
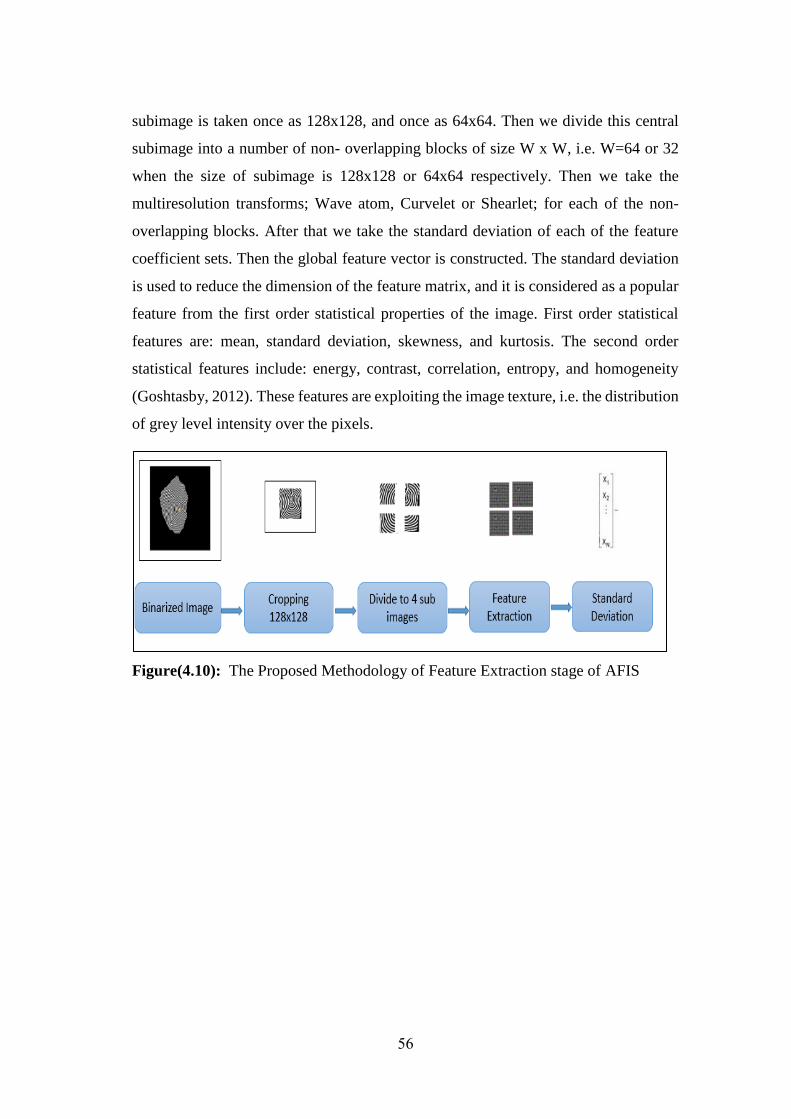
56
subimage is taken once as 128x128, and once as 64x64. Then we divide this central
subimage into a number of non- overlapping blocks of size W x W, i.e. W=64 or 32
when the size of subimage is 128x128 or 64x64 respectively. Then we take the
multiresolution transforms; Wave atom, Curvelet or Shearlet; for each of the non-
overlapping blocks. After that we take the standard deviation of each of the feature
coefficient sets. Then the global feature vector is constructed. The standard deviation
is used to reduce the dimension of the feature matrix, and it is considered as a popular
feature from the first order statistical properties of the image. First order statistical
features are: mean, standard deviation, skewness, and kurtosis. The second order
statistical features include: energy, contrast, correlation, entropy, and homogeneity
(Goshtasby, 2012). These features are exploiting the image texture, i.e. the distribution
of grey level intensity over the pixels.
Figure(4.10): The Proposed Methodology of Feature Extraction stage of AFIS

57
Chapter 5
Classification Techniques

58
Chapter 5
Classification Techniques
Once a set of features is extracted from the fingerprint image, the final goal is to
confirm the identity of a person whose fingerprint has been previously enrolled into
the system. The matching mechanism is the responsible to provide a score between
two fingerprints. Fingerprint matching is a crucial step in both verification and
identification problems. Roughly, a fingerprint matching algorithm compares two
fingerprints and returns either a degree of similarity or a hard output (matched or non-
matched). Two fingerprints are called genuine if they represent the same finger, and
impostor when they are different.
The reasons of making matching process of fingerprint images is an extremely
difficult problem are due to the following:
1. The process of acquisitions of fingerprint images which are collected
from different devices, which lead to random scale, displacement and
rotation compared to the fingerprint images templates.
2. As a result of different displacement and rotation, there is an overlap area
in the foreground area between the input and the fingerprint image
templates.
3. The difficulty to describe the random nonlinear deformation of collected
fingerprint images with a mathematic model, due to the plasticity of
finger skin.
4. Poor quality of fingerprint images due to various finger pressure, sweat,
dirt, grease, dryness of the skin, oily of the skin, skin disease, and
humidity in the air.
5. Some enhancement and feature extraction algorithms loss true minutiae,
or adding spurious one.
6. Not enough fingerprint image samples in some datasets, such as CASIA-
FingerprintV5 dataset.
Fingerprint matching as a pattern recognition problem is still popular up to now,
because the issue of matching low-quality and partial fingerprint image has not been
solved well (Tong, Wang, Pi, & Zhang, 2006; Amira, 2011).
59
Fingerprint matching algorithms can be classified into various categories, such
as correlation-based matching, minutiae-based matching, ridge feature-based
matching, and texture-based matching, and each one of these algorithms has its own
features in accuracy and speed. However, they classified into three major categories
(Alonso-Fernandez , et al., 2009):
1. Minutiae-based Matching: is the most popular algorithm, which is used
in most recognition systems. This matching type requires extraction of
minutiae features from the registered fingerprint image and the input
fingerprint image, and the number of corresponding minutiae pairings
between the two images is used to recognize a valid fingerprint image.
Minutiae features contains a list of attributes such as: minutiae position,
minutiae direction, and type of minutiae (ridge ending, ridge bifurcation).
To compare the minutiae sets between two fingerprints, an alignment
process has to be done, which requires to compute the displacement and
rotation, then the corresponding minutiae at similar position in both
fingerprints are looked for. Extracting minutiae is difficult in the low and
poor quality fingerprints. Generally, minutiae based methods require a
significant amount of pre-processing to produce accurate results.
2. Image-based (Pattern-based, ridge-based or non-minutiae feature
based) Matching: since minutiae based matching is unreliable in poor
quality fingerprints, an alternative features are exploited such as: local
orientation and frequency, ridge shape, and texture information. Texture
information is more reliable in poor quality fingerprint images than
minutiae (Alonso-Fernandez , et al., 2009). Another technique for an
image based fingerprint matching system involves wavelets
(Diefenderfer, 2006), where fingerprint patterns are matched based on
Wavelet domain features. A primary advantage to this approach is that
these features can be directly extracted from the fingerprint image
without applying the needed pre-processing steps in minutiae based.
Once the core point has been determined, a rectangular region
surrounding the core is established, which is referred to as the central
sub-image. This area is then divided into non overlapping square blocks
60
of uniform size. Then the Wavelet decomposition is computed on each
block, and its Wavelet features are extracted, then the global feature is
estimated, then performing the matching sequence with the template
features. The lower computational requirements of this process make
using Wavelet features attractive to a small-scale system.
3. Correlation-based Matching: Two fingerprint images are
superimposed and the correlation between corresponding pixels is
computed for different alignments (e.g. various displacement and
rotations). The cross correlation which measures the image similarity is
maximized between two images. The drawback of this type is its
computation complexity, Furthermore it has limited ability to deal with
variations in scale, translation, and rotation.
In this work, we use four different classifiers to perform fingerprint recognition.
These classifiers are: Minimum Distance Classifier (MD), K-Nearest Neighbour
(KNN), Self-Organization Map (SOM), and Support Vector Machine Classifier
(SVM).
5.1 Minimum Distance Classifier
The simplest classifier is Minimum Distance Classifier. Given a set of M training
samples 𝑥𝑖 and a set of M labels 𝑦𝑖 belong to L different classes, where 𝑦𝑖 ∈
{1,2, . . . , L}, we first represent the 𝑘𝑡ℎ class by its mean vector 𝑚𝑘 which can be
calculated by Equation 5.1
𝑚𝑘 =1
𝑁𝑘∑ 𝑥𝑖
(𝑘)
𝑁𝑘
𝑖=1
𝑘 = 1,2, … , 𝐿 , (5.1)
Where 𝑁𝑘 is the number of training samples which belong to class 𝑘 and 𝑥𝑖(𝑘) is
the feature vector for each training sample belonging to class 𝑘. For a given test
sample 𝑥, it is classified to class 𝑘 if its Euclidean distance to 𝑚𝑘 is smaller than all
other classes as indicated in Equation 5.2.
𝑥 ∈ 𝑘 𝑖𝑓 𝐷(𝑥, 𝑚𝑘) = 𝑚𝑖𝑛{𝐷(𝑥, 𝑚𝑘)𝑖 = 1,2, . . . , 𝐿} , (5.2)

61
5.2 K-Nearest Neighbors
The k-nearest neighbour classification is an instance-based learning algorithm
that has been shown to be very effective for a variety of problem domains. It is also
called a lazy learning algorithm because it makes use of the whole training set as a
reference set to classify new instances. It may be a surprise to know that KNN is
considered as one of the top 10 data mining algorithms (Wu & Kumar, 2008). The
objective of k-nearest neighbour classification is to discover k nearest neighbours for
a given instance, then assign a class label to the given instance according to the
majority class of the k nearest neighbours (Taniar, 2008). The algorithm assumes that
all instances correspond to points in the n-dimensional space. The key element of this
scheme is the availability of a similarity measure that is capable of identifying
neighbours. The nearest neighbours of an instance are defined in terms of a distance
function such as the standard Euclidean distance. More precisely, let an instance 𝑥 be
described by the feature vector {𝑎1(𝑥), 𝑎2(𝑥), … . , 𝑎𝑟(𝑥)}, where 𝑎𝑖(𝑥) denotes the
value of the ith attribute of instance 𝑥. Then the distance between two instances 𝑥𝑖 and
𝑥𝑗 is defined as 𝑑𝑖𝑠𝑡(𝑥𝑖, 𝑥𝑗), where:
𝑑𝑖𝑠𝑡2(𝑥𝑖 , 𝑥𝑗) = √∑(𝑎𝑞(𝑥𝑖) − 𝑎𝑞(𝑥𝑗))2
𝑟
𝑞=1
(5.3)
5.3 Self Organizing Map (SOM)
SOM (also known as Kohonen network) is introduced by Kohonen (1990, 1989).
SOM is a type of unsupervised artificial neural networks, and hence, the network is
presented with input data, but, as opposed to supervised learning, the network is not
provided with desired outputs. The network is therefore allowed to freely organize
itself according to similarities in the data, resulting in a map containing the input data.
SOM reduces dimensions by producing a map of usually one or two dimensions that
plots the similarities of the data by grouping similar objects together. SOM is useful
for visualization and clustering, since it can be used to explore the groupings and
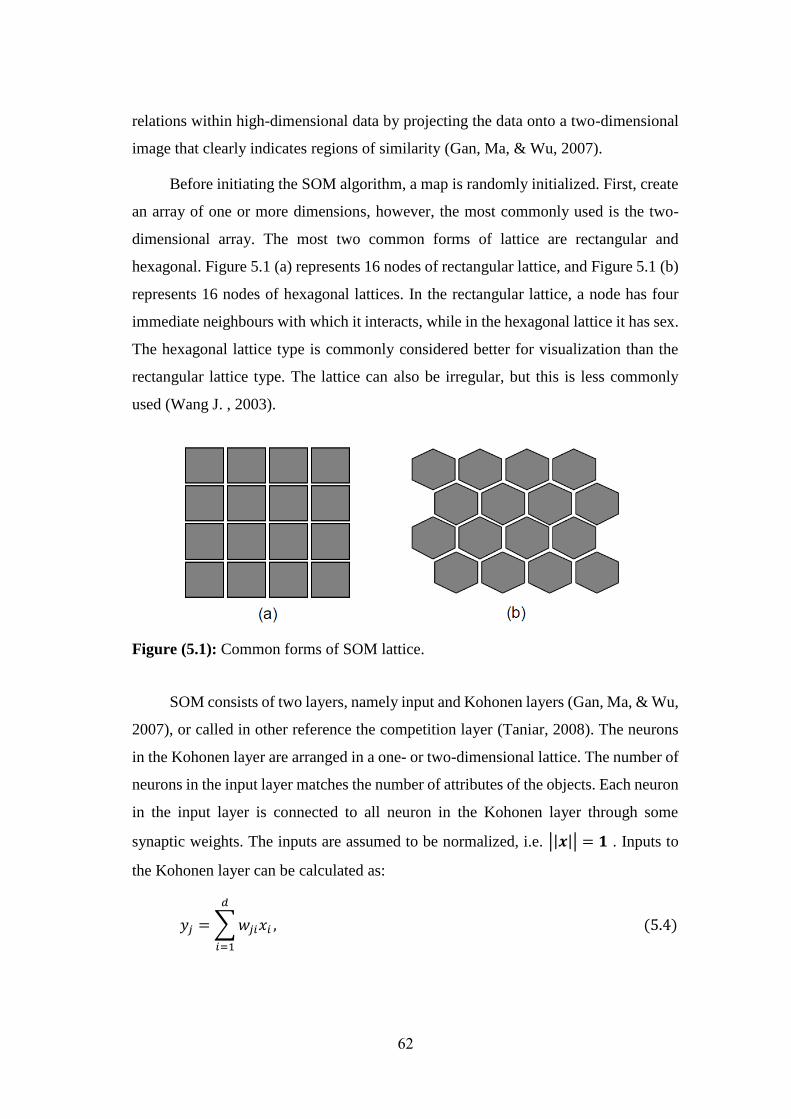
62
relations within high-dimensional data by projecting the data onto a two-dimensional
image that clearly indicates regions of similarity (Gan, Ma, & Wu, 2007).
Before initiating the SOM algorithm, a map is randomly initialized. First, create
an array of one or more dimensions, however, the most commonly used is the two-
dimensional array. The most two common forms of lattice are rectangular and
hexagonal. Figure 5.1 (a) represents 16 nodes of rectangular lattice, and Figure 5.1 (b)
represents 16 nodes of hexagonal lattices. In the rectangular lattice, a node has four
immediate neighbours with which it interacts, while in the hexagonal lattice it has sex.
The hexagonal lattice type is commonly considered better for visualization than the
rectangular lattice type. The lattice can also be irregular, but this is less commonly
used (Wang J. , 2003).
Figure (5.1): Common forms of SOM lattice.
SOM consists of two layers, namely input and Kohonen layers (Gan, Ma, & Wu,
2007), or called in other reference the competition layer (Taniar, 2008). The neurons
in the Kohonen layer are arranged in a one- or two-dimensional lattice. The number of
neurons in the input layer matches the number of attributes of the objects. Each neuron
in the input layer is connected to all neuron in the Kohonen layer through some
synaptic weights. The inputs are assumed to be normalized, i.e. ||𝒙|| = 𝟏 . Inputs to
the Kohonen layer can be calculated as:
𝑦𝑗 = ∑ 𝑤𝑗𝑖𝑥𝑖
𝑑
𝑖=1
, (5.4)
63
Where 𝑤𝑗𝑖 is the weight from the input neuron 𝑖 to the output neuron 𝑗. The
neurons in the Kohonen layer undergo three basic stages, such as competition,
cooperation, and updating. In the competition stage, the neurons in the Kohonen layer
compete among themselves to be the winner. In the next stage, a neighbourhood
surrounding the winning neuron is identified for cooperation among themselves. The
winning neuron along with its neighbours is updated in the third stage (Taniar, 2008).
The algorithm responsible for the formation of the SOM first initializes the weights in
the network by assigning them small random values. Then the algorithm proceeds to
the three processes, which are explained below in detail.
Competitive process: Let 𝒙 = (𝑥1, 𝑥2, . . . , 𝑥𝑑 )𝑇 be an object selected at
random from the input space, where 𝑑 is the dimension of the input space. Let the
weight vector of neuron 𝑗 in the Kohonen layer be denoted by
𝒘𝑗 = (𝑤𝑗1, 𝑤𝑗2, . . . , 𝑤𝑗𝑚)𝑇 , 𝑗 = 1, 2, . . . , 𝑚. (5.5)
Where 𝑚 is the total number of neurons in the Kohonen layer. The best match
of the input object x with the weight vectors 𝑤𝑗1, 𝑤𝑗2, . . . , 𝑤𝑗𝑚 can be found by
comparing the inner products 𝑤1𝑇𝑥, 𝑤2
𝑇𝑥, . . . . . , 𝑤𝑚𝑇 𝑥, and selecting the largest product,
which is mathematically equivalent to minimizing the Euclidean distance between the
vectors 𝑤𝑗 and 𝑥. Therefore, the index 𝑖(𝑥) of the winning neuron for the input object
x can be determined by
𝑖(𝑥) = arg min1≤𝑗≤𝑚
||𝑥 − 𝑤𝑗|| , (5.6)
Cooperative process: In the cooperative process, a topological neighbourhood
is defined so that the winning neuron determines its topological neighbourhood of
excited neurons for cooperation. They will try to update their synaptic weights through
the cooperation. This will have a smoothing effect on the weight vectors in this
neighbourhood. The number of nodes affected depends upon the type of lattice and the
neighbourhood function.
Let ℎ𝑗,𝑡denote the topological neighborhood centered on winning neuron 𝑡 and
𝑑𝑡,𝑗 denote the lateral distance between winning neuron 𝑡 and excited neuron 𝑗.The
64
topological neighborhood function ℎ𝑗,𝑡 is assumed to follow a Gaussian distribution as
given next:
ℎ𝑗,𝑡 = exp (− 𝑑𝑡,𝑗
2
2𝜎2), (5.7)
Where 𝜎 is a parameter that measures the degree to which excited neurons in the
neighborhood of the winning neuron participate in the learning process.
Updating process: The synaptic weights of the winning neuron and the excited
neurons lying in its neighbourhood are updated using the rule given below:
𝑤𝑗(𝑠+1)
= 𝑤𝑗(𝑠)
+ 𝜼(𝒔)ℎ𝑗,𝑖(𝑥)(𝑠)(𝑥 − 𝑤𝑗(𝑠)
) , (5.8)
Where 𝑤𝑗(𝑠)
is the weight vector of neuron j at time or iteration s, 𝑤𝑗(𝑠+1)
is the
new weight vector at time s + 1, 𝜼(𝒔) is the learning-rate parameter defined as:
𝜼(𝒔) = 𝜼𝟎 exp (− 𝑠
𝜏2) , 𝑠 = 0,1,2, … …. (5.9)
And ℎ𝑗,𝑖(𝑥) is the neighborhood function defined as:
ℎ𝑗,𝑖(𝑥)(𝐬) = exp (− 𝑑𝑖(𝑥),𝑗
2
2𝜎2(𝑠)) , 𝑠 = 0,1,2, … (5.10)
With 𝜎(𝑠) specified by:
𝜎(𝑠) = σ0 (− 𝑠
𝜏1), (5.11)
The constants 𝜼𝟎, σ0, 𝜏1, and 𝜏2 can be configured as follows:
𝜼𝟎 = 0.1,σ0 = the radius of the lattice, 𝜏1 =1000
𝑙𝑜𝑔σ0, 𝑎𝑛𝑑 𝜏2 = 1000.
The training process of hexagonal SOM is shown in Figure (5.2). First, the
weight vectors are mapped randomly onto a two-dimensional, hexagonal lattice as in
Figure 5.2(a). The weight vectors, which illustrated by arrows in the nodes, pointing
in random directions. In Figure 5.2 (a), the closest match to the input data vector x has
been found in node c. The nodes within the neighbourhood ℎ𝑐,𝑖 learn from node c. The
size of the neighbourhood ℎ𝑐,𝑖 is determined by the neighborhood radius. The weight
vectors within the neighbourhood ℎ𝑐,𝑖 tune to, or learn from, the input data vector x.
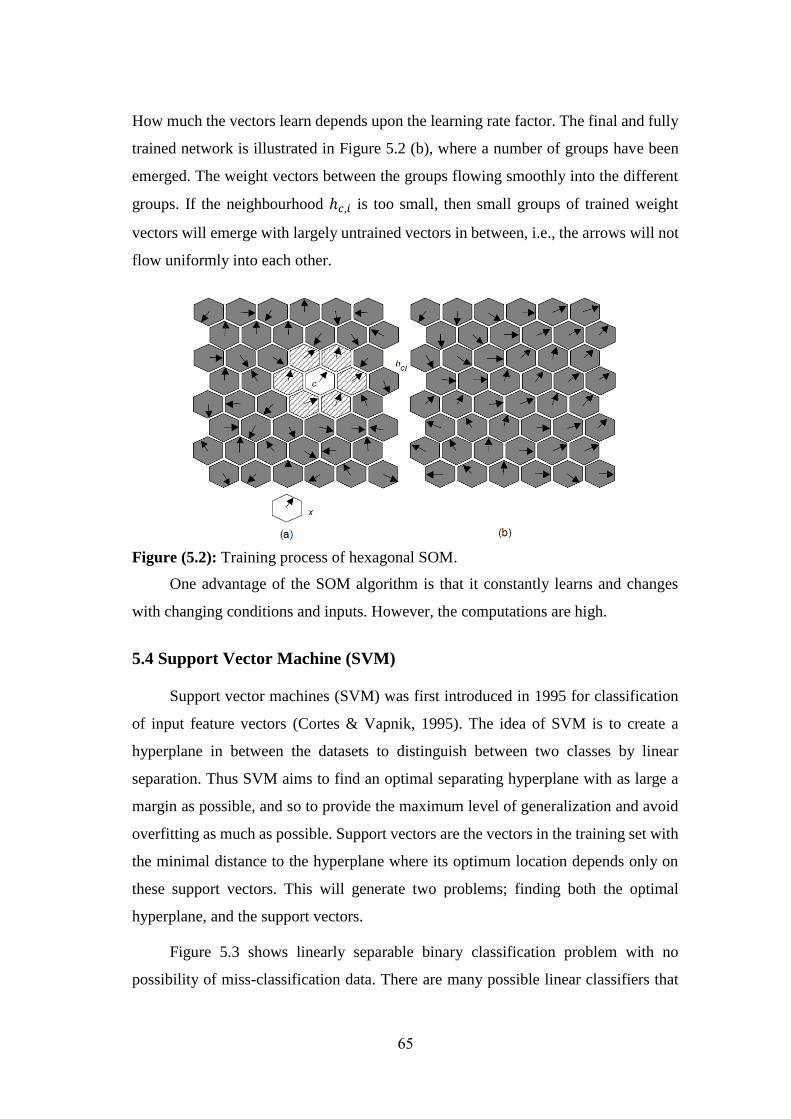
65
How much the vectors learn depends upon the learning rate factor. The final and fully
trained network is illustrated in Figure 5.2 (b), where a number of groups have been
emerged. The weight vectors between the groups flowing smoothly into the different
groups. If the neighbourhood ℎ𝑐,𝑖 is too small, then small groups of trained weight
vectors will emerge with largely untrained vectors in between, i.e., the arrows will not
flow uniformly into each other.
Figure (5.2): Training process of hexagonal SOM.
One advantage of the SOM algorithm is that it constantly learns and changes
with changing conditions and inputs. However, the computations are high.
5.4 Support Vector Machine (SVM)
Support vector machines (SVM) was first introduced in 1995 for classification
of input feature vectors (Cortes & Vapnik, 1995). The idea of SVM is to create a
hyperplane in between the datasets to distinguish between two classes by linear
separation. Thus SVM aims to find an optimal separating hyperplane with as large a
margin as possible, and so to provide the maximum level of generalization and avoid
overfitting as much as possible. Support vectors are the vectors in the training set with
the minimal distance to the hyperplane where its optimum location depends only on
these support vectors. This will generate two problems; finding both the optimal
hyperplane, and the support vectors.
Figure 5.3 shows linearly separable binary classification problem with no
possibility of miss-classification data. There are many possible linear classifiers that

66
can separate the data in the Figure 5.3, but there is only one that maximizes the margin
(maximizes the distance between it and the nearest data point of each class). This linear
classifier is termed the optimal separating hyperplane, which is defined as:
𝑤. 𝑥 + 𝑏 = 0, (5.12)
A separating hyperplane in canonical form must satisfy the following
constraints:
𝑛𝑖(𝑤. 𝑥 + 𝑏) ≥ 1 , 𝑖 = 1,2, … 𝑁, (5.13)
Figure (5.3): Support vector machine with linear separable data
Considering the Figure 5.3 above the margins are defined as d+ and d-. The
margin will be maximized in the case d+ = d−. Furthermore, training data in the
margins will lie on the hyper-planes H+ and H-. The distance between hyperplane H+
and H- is:
𝜌 = 𝑑− = 𝑑+ = 2
||𝑤|| , (5.14)
Hence, the hyperplane that separates optimally the training data is the hyperplane
which maximize the margin 𝜌 and minimizes:
𝜑(𝑤) =1
2||𝑤||
2, (5.15)
Where 𝑤 is the weight vector. The main problem of estimation of an optimal
hyperplane, is when the training data is nonlinear separable. To overcome this
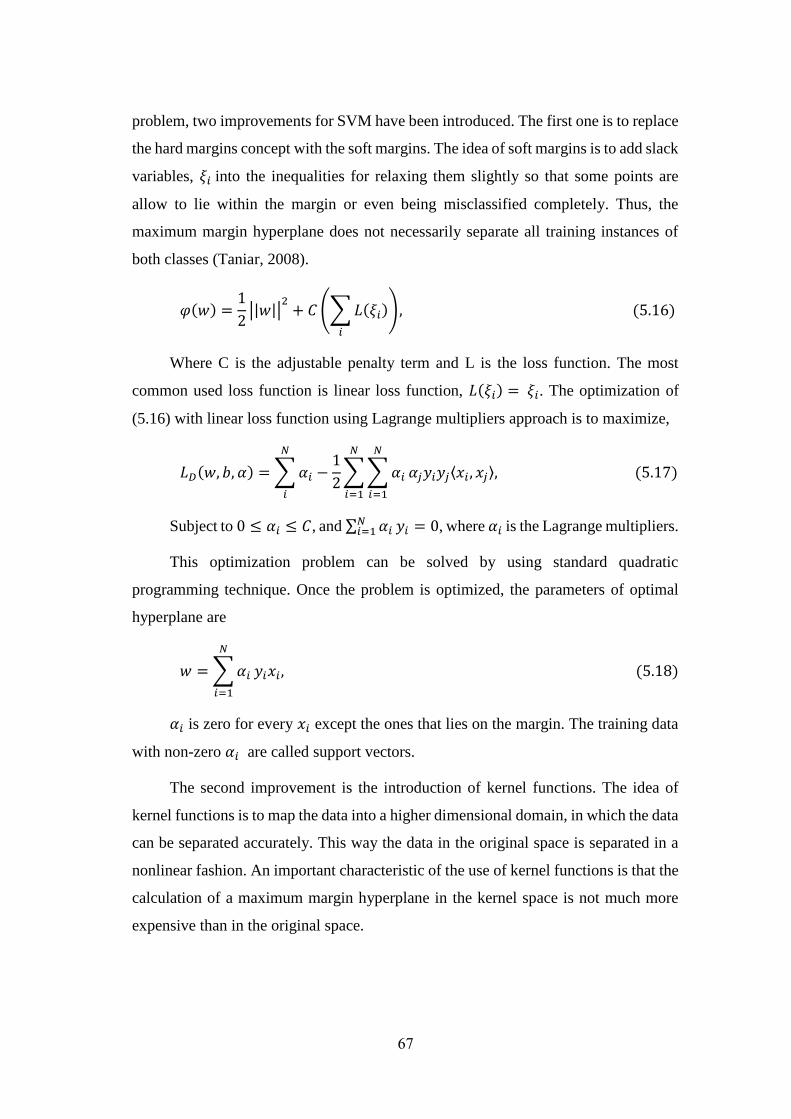
67
problem, two improvements for SVM have been introduced. The first one is to replace
the hard margins concept with the soft margins. The idea of soft margins is to add slack
variables, 𝜉𝑖 into the inequalities for relaxing them slightly so that some points are
allow to lie within the margin or even being misclassified completely. Thus, the
maximum margin hyperplane does not necessarily separate all training instances of
both classes (Taniar, 2008).
𝜑(𝑤) =1
2||𝑤||
2+ 𝐶 (∑ 𝐿(𝜉𝑖)
𝑖
), (5.16)
Where C is the adjustable penalty term and L is the loss function. The most
common used loss function is linear loss function, 𝐿(𝜉𝑖) = 𝜉𝑖. The optimization of
(5.16) with linear loss function using Lagrange multipliers approach is to maximize,
𝐿𝐷(𝑤, 𝑏, 𝛼) = ∑ 𝛼𝑖
𝑁
𝑖
−1
2∑ ∑ 𝛼𝑖
𝑁
𝑖=1
𝑁
𝑖=1
𝛼𝑗𝑦𝑖𝑦𝑗⟨𝑥𝑖 , 𝑥𝑗⟩, (5.17)
Subject to 0 ≤ 𝛼𝑖 ≤ 𝐶, and ∑ 𝛼𝑖𝑁𝑖=1 𝑦𝑖 = 0, where 𝛼𝑖 is the Lagrange multipliers.
This optimization problem can be solved by using standard quadratic
programming technique. Once the problem is optimized, the parameters of optimal
hyperplane are
𝑤 = ∑ 𝛼𝑖
𝑁
𝑖=1
𝑦𝑖𝑥𝑖, (5.18)
𝛼𝑖 is zero for every 𝑥𝑖 except the ones that lies on the margin. The training data
with non-zero 𝛼𝑖 are called support vectors.
The second improvement is the introduction of kernel functions. The idea of
kernel functions is to map the data into a higher dimensional domain, in which the data
can be separated accurately. This way the data in the original space is separated in a
nonlinear fashion. An important characteristic of the use of kernel functions is that the
calculation of a maximum margin hyperplane in the kernel space is not much more
expensive than in the original space.

68
Chapter 6
Results and Discussion

69
Chapter 6
Results and Discussion
6.1 Pre-processing Results
In this section we will show the results of applying the pre-processing techniques
on CASIA-FingerprintV5 database. This stage consists of three sub-sections: the first
one shows the results of alignment process, the second shows the results of the
enhancement process including the original algorithm and the modified one, and the
last one shows the results of core point detection process.
6.1.1 Alignment Results
When we perform the alignment process on the CASIA-FingerprintV5 database,
we face some problems. One of them is the existence of some small black regions
within the white regions, and this means that these black regions are considered as a
part of the foreground region. This result is a by-product of segmentation process in
poor quality fingerprint images. Another problem is the non-smooth contour of the
image segmentation as shown in Figure 3.1. Both of these problems affect the
performance of the alignment technique described in Chapter 3, since the alignment
technique is based on navigation along the x-coordinate and the y-coordinate, and so
while incrementing the navigation variable, it will stop the navigation when it finds a
black pixel, since it finds the contour of image segmentation. This will affect the TFCP
location, and the upper point location, and as a result it affects the determination of
C1, C2, and C3.
We solve the problems above by using the segmentation algorithm described in
(Fahmy & Thabet, 2013). Figure 6.1 shows the results of alignment, which depend on
segmentation process of (Msiza, Leke-Betechuoh, & Malumedzha, 2011), where the
left side is the original images. The middle side is the result of segmentation according
to (Msiza, Leke-Betechuoh, & Malumedzha, 2011), and the right side is the result of
rotation. Figure 6.2 shows the results of alignment which depends on segmentation
process of (Fahmy & Thabet, 2013), where the results of segmentation are shown in
the middle column according, and the result of rotation are shown in the last column.
From both figures we can visually observe that the proposed solution is more accurate

70
than the other in determining the angle of rotation because of smoothing the image
contour, and removing false small black blocks in the foreground region.
Figure (6.1): Image Rotation result according to image segmentation in the original
algorithm.
Although the used algorithm of rotation is robust, it has some drawbacks. The
algorithm cannot perform well in some images which need to be rotated and have cuts
in the image boundaries, especially if the image is cut in more than one side, i.e. the
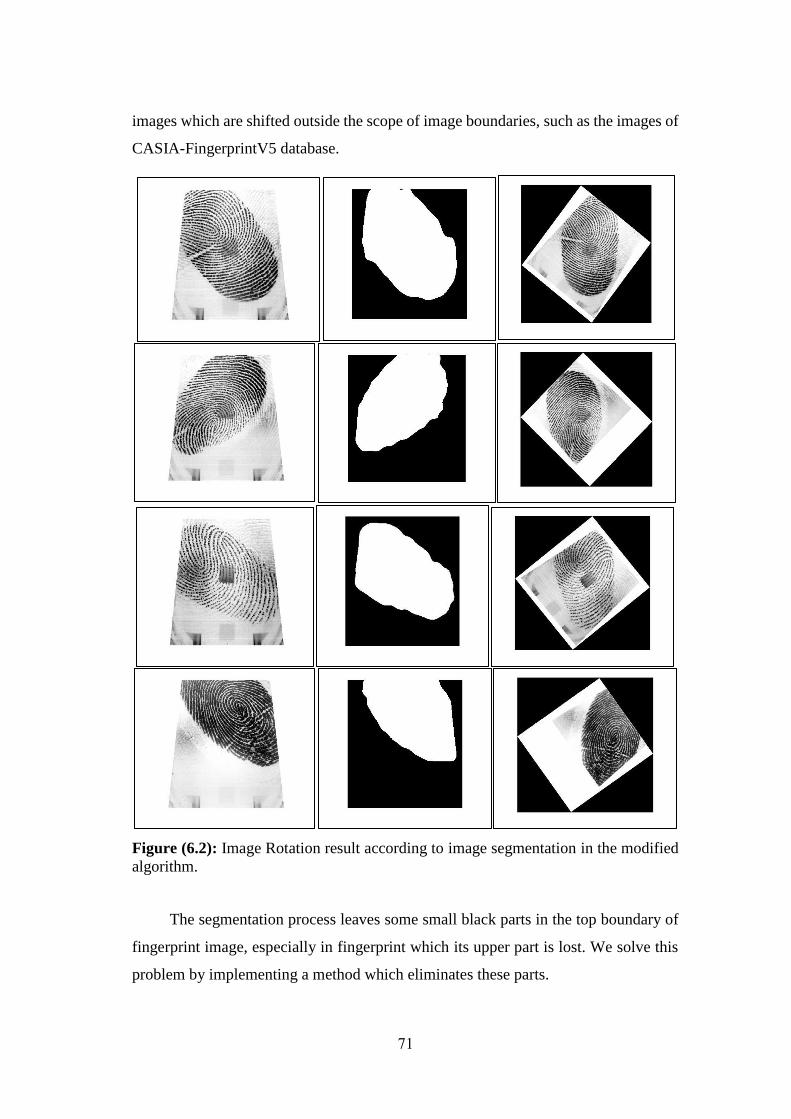
71
images which are shifted outside the scope of image boundaries, such as the images of
CASIA-FingerprintV5 database.
Figure (6.2): Image Rotation result according to image segmentation in the modified
algorithm.
The segmentation process leaves some small black parts in the top boundary of
fingerprint image, especially in fingerprint which its upper part is lost. We solve this
problem by implementing a method which eliminates these parts.

72
Another drawback of this technique that it cannot deal with images which need
a rotation angle more than 90 degree in both directions. CASIA-FingerprintV5
database contains a lot of different rotation challenges, which need to be solved
efficiency. We suggest a solution as a future work, which can deal with this issue.
6.1.2 Enhancement Process Results
We use the enhancement algorithm proposed by (Chikkerur, Cartwright, &
Govindaraju, 2007), in which the region mask is obtained by thresholding the energy
image. When we apply the algorithm on CASIA-FingerprintV5 database, we obtain
an efficient enhancement results in most types of poor quality images. The algorithm
can connect the ridge discontinuity, and treats the fingertips creases and dryness. But
we cannot obtain an optimum segmentation when dealing with the humidity in some
images. This is because of the very bad qualities of the fingerprint images, where the
humidity and dryness get together in the same fingertip, and this leads to segment some
parts and to lose the others. Sometimes the opposite is true, that some fingerprint
images contains some traces of the previous scanned fingertips, and this leads to
segment some parts which does not belong to the targeted fingertip. This issue rarely
occurs, but it is existed in the CASIA-FingerprintV5 database. Furthermore the
background regions are not clean as the other databases such as FVC family. It
contains some small grey blocks in different regions, which affects the segmentation
process which based on single thresholding the grey level variation. Single
thresholding will lose some information about the ridge regions which are hardly
appeared in bad quality fingerprint images. For this reason we replace the
segmentation step of Chikkerur et al. algorithm with the algorithm proposed by
(Fahmy & Thabet, 2013) which we use it in the alignment step. The segmentation
process of (Fahmy & Thabet, 2013) was based on computing the range image over
blocks of size 16x16 then applying a local adaptive thresholding to select an
appropriate threshold level for each block.
The modified enhancement technique gives a slight improvement in some poor
quality images with a lot of creases and wounds as shown in Figure 6.3, where the
upper row shows some bad samples with a lot of creases of CASIA-FingerprintV5
database, the middle row shows the result of the original technique, and the last row
73
shows the result of the modified technique. We also see that both enhancement
algorithm can connect the discontinuities of the ridges, and improve the contrast
between ridges and valleys, however the enhancement results of the modified
algorithm give a better region mask image than the original since the segmentation
technique in the modified algorithm depends on an adaptive thresholding with each
block.
Another reason that degrades the quality of fingerprint images is the dryness of
fingers, which leads to fragmented and low contrast ridges. Figure 6.4 shows some of
these images and the result of the original and the modified algorithm, where the upper
row is three samples images from CASIA- FingerprintV5, the middle row shows the
result of the original technique, and the last row shows the result of the modified
technique.
Figure (6.3): Enhancement result of both the original technique and the modified one.
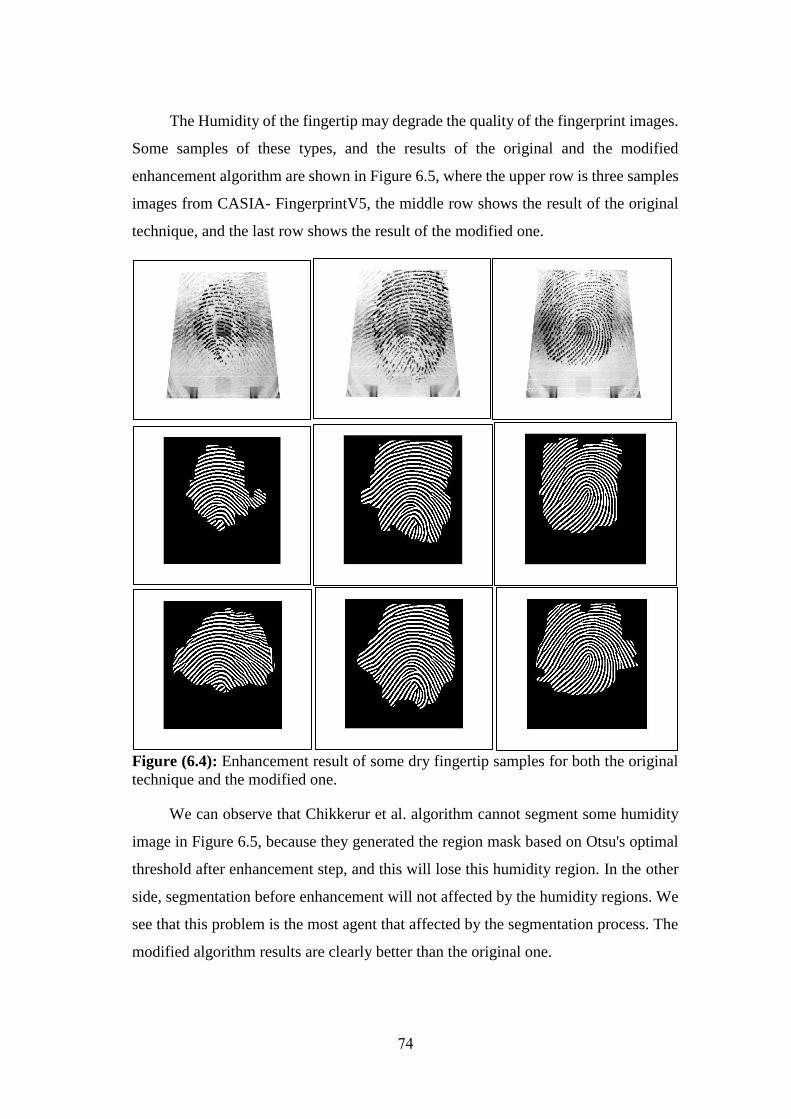
74
The Humidity of the fingertip may degrade the quality of the fingerprint images.
Some samples of these types, and the results of the original and the modified
enhancement algorithm are shown in Figure 6.5, where the upper row is three samples
images from CASIA- FingerprintV5, the middle row shows the result of the original
technique, and the last row shows the result of the modified one.
Figure (6.4): Enhancement result of some dry fingertip samples for both the original
technique and the modified one.
We can observe that Chikkerur et al. algorithm cannot segment some humidity
image in Figure 6.5, because they generated the region mask based on Otsu's optimal
threshold after enhancement step, and this will lose this humidity region. In the other
side, segmentation before enhancement will not affected by the humidity regions. We
see that this problem is the most agent that affected by the segmentation process. The
modified algorithm results are clearly better than the original one.
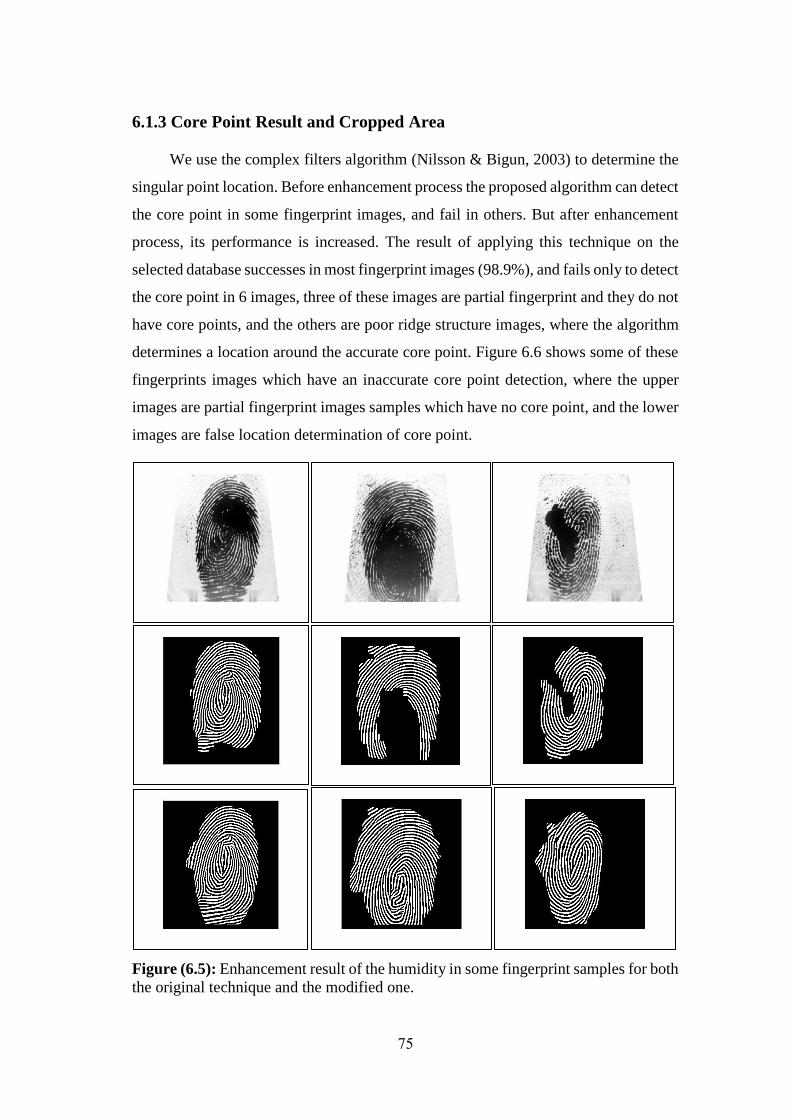
75
6.1.3 Core Point Result and Cropped Area
We use the complex filters algorithm (Nilsson & Bigun, 2003) to determine the
singular point location. Before enhancement process the proposed algorithm can detect
the core point in some fingerprint images, and fail in others. But after enhancement
process, its performance is increased. The result of applying this technique on the
selected database successes in most fingerprint images (98.9%), and fails only to detect
the core point in 6 images, three of these images are partial fingerprint and they do not
have core points, and the others are poor ridge structure images, where the algorithm
determines a location around the accurate core point. Figure 6.6 shows some of these
fingerprints images which have an inaccurate core point detection, where the upper
images are partial fingerprint images samples which have no core point, and the lower
images are false location determination of core point.
Figure (6.5): Enhancement result of the humidity in some fingerprint samples for both
the original technique and the modified one.
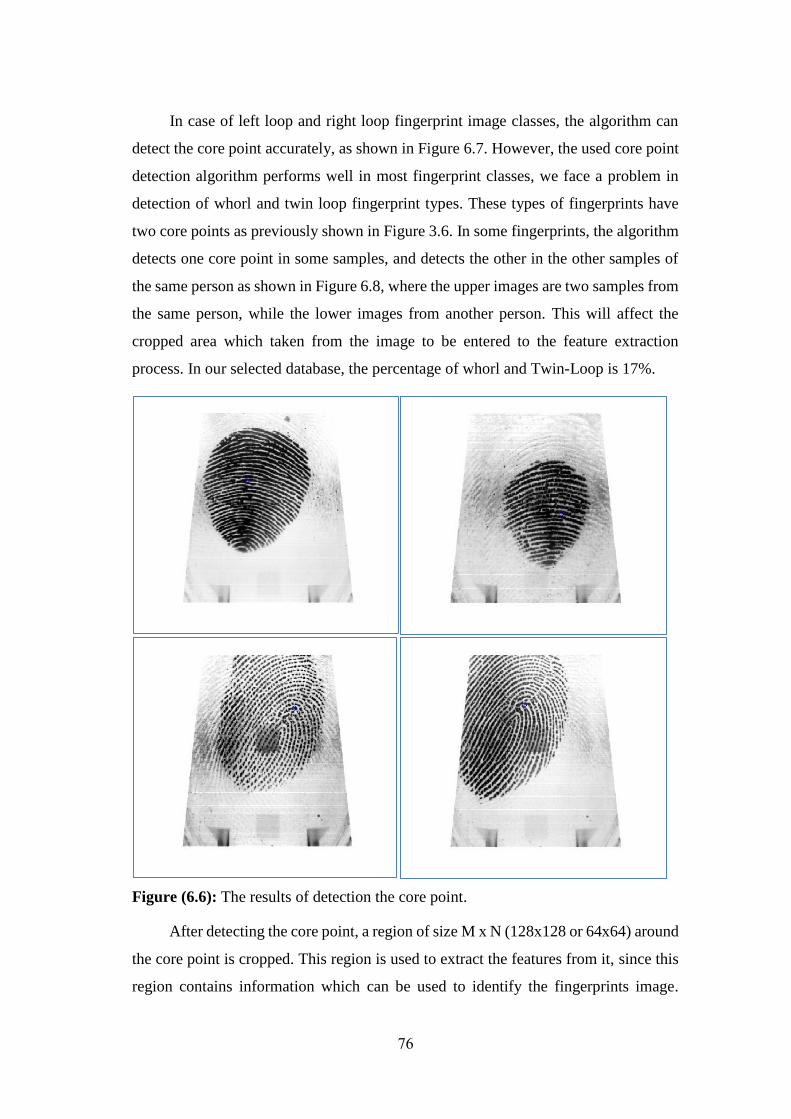
76
In case of left loop and right loop fingerprint image classes, the algorithm can
detect the core point accurately, as shown in Figure 6.7. However, the used core point
detection algorithm performs well in most fingerprint classes, we face a problem in
detection of whorl and twin loop fingerprint types. These types of fingerprints have
two core points as previously shown in Figure 3.6. In some fingerprints, the algorithm
detects one core point in some samples, and detects the other in the other samples of
the same person as shown in Figure 6.8, where the upper images are two samples from
the same person, while the lower images from another person. This will affect the
cropped area which taken from the image to be entered to the feature extraction
process. In our selected database, the percentage of whorl and Twin-Loop is 17%.
Figure (6.6): The results of detection the core point.
After detecting the core point, a region of size M x N (128x128 or 64x64) around
the core point is cropped. This region is used to extract the features from it, since this
region contains information which can be used to identify the fingerprints image.
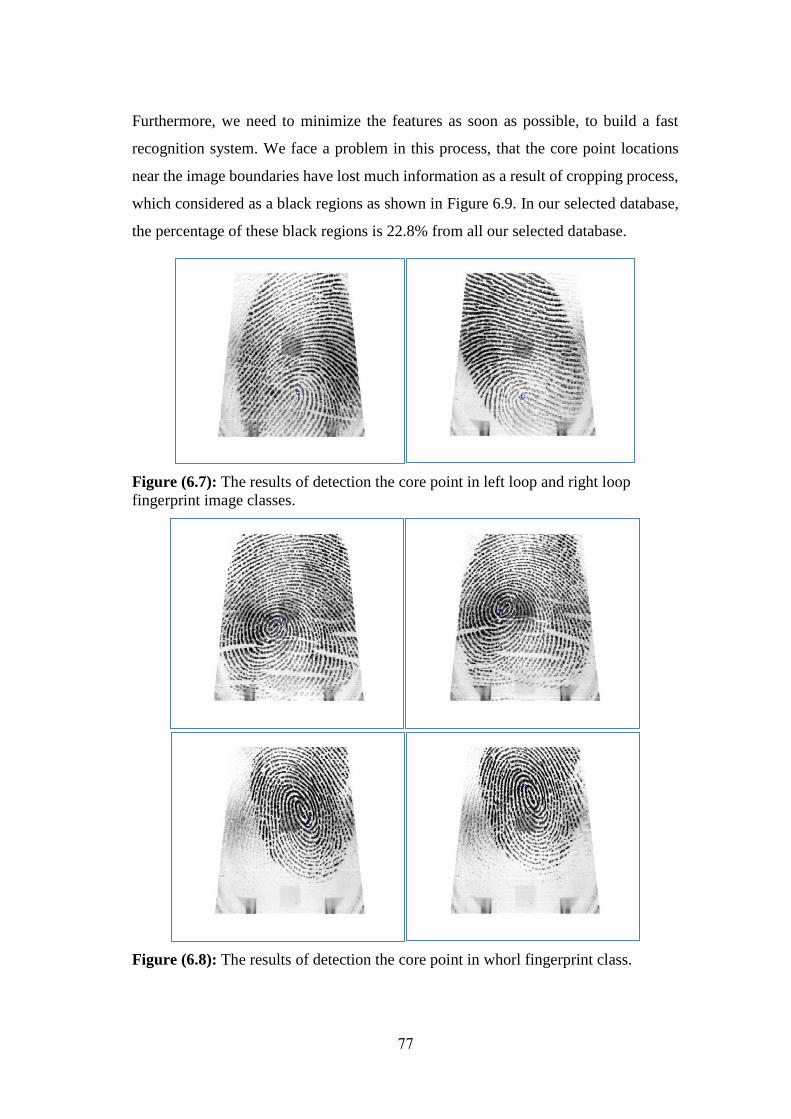
77
Furthermore, we need to minimize the features as soon as possible, to build a fast
recognition system. We face a problem in this process, that the core point locations
near the image boundaries have lost much information as a result of cropping process,
which considered as a black regions as shown in Figure 6.9. In our selected database,
the percentage of these black regions is 22.8% from all our selected database.
Figure (6.7): The results of detection the core point in left loop and right loop
fingerprint image classes.
Figure (6.8): The results of detection the core point in whorl fingerprint class.
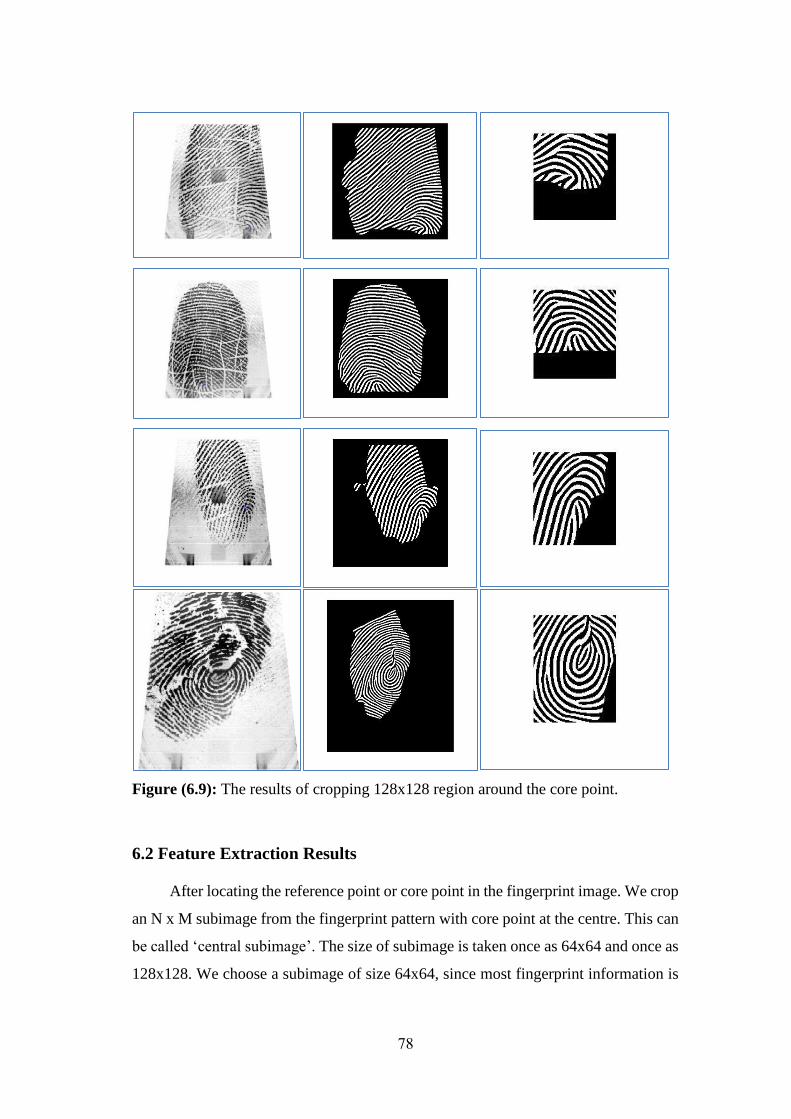
78
Figure (6.9): The results of cropping 128x128 region around the core point.
6.2 Feature Extraction Results
After locating the reference point or core point in the fingerprint image. We crop
an N x M subimage from the fingerprint pattern with core point at the centre. This can
be called ‘central subimage’. The size of subimage is taken once as 64x64 and once as
128x128. We choose a subimage of size 64x64, since most fingerprint information is
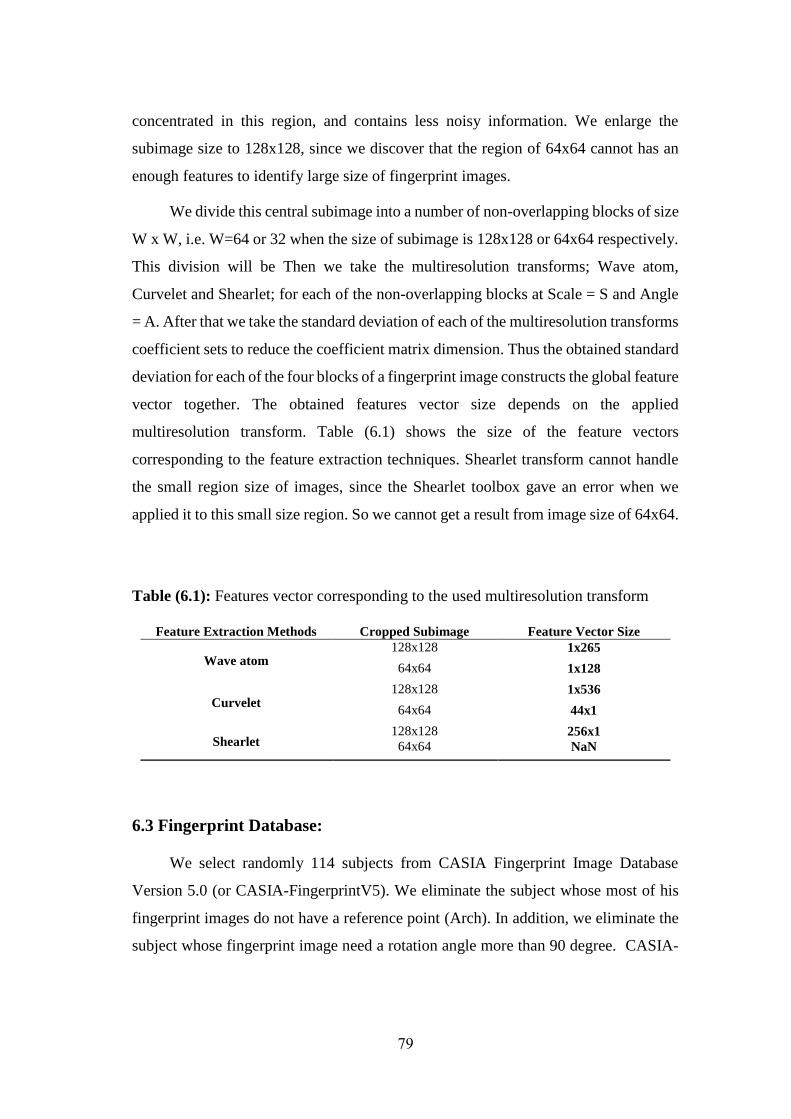
79
concentrated in this region, and contains less noisy information. We enlarge the
subimage size to 128x128, since we discover that the region of 64x64 cannot has an
enough features to identify large size of fingerprint images.
We divide this central subimage into a number of non-overlapping blocks of size
W x W, i.e. W=64 or 32 when the size of subimage is 128x128 or 64x64 respectively.
This division will be Then we take the multiresolution transforms; Wave atom,
Curvelet and Shearlet; for each of the non-overlapping blocks at Scale = S and Angle
= A. After that we take the standard deviation of each of the multiresolution transforms
coefficient sets to reduce the coefficient matrix dimension. Thus the obtained standard
deviation for each of the four blocks of a fingerprint image constructs the global feature
vector together. The obtained features vector size depends on the applied
multiresolution transform. Table (6.1) shows the size of the feature vectors
corresponding to the feature extraction techniques. Shearlet transform cannot handle
the small region size of images, since the Shearlet toolbox gave an error when we
applied it to this small size region. So we cannot get a result from image size of 64x64.
Table (6.1): Features vector corresponding to the used multiresolution transform
Feature Vector Size Cropped Subimage Feature Extraction Methods
1x265 128x128 Wave atom
1x128 64x64
1x536 128x128 Curvelet
44x1 64x64
256x1 128x128 Shearlet NaN 64x64
6.3 Fingerprint Database:
We select randomly 114 subjects from CASIA Fingerprint Image Database
Version 5.0 (or CASIA-FingerprintV5). We eliminate the subject whose most of his
fingerprint images do not have a reference point (Arch). In addition, we eliminate the
subject whose fingerprint image need a rotation angle more than 90 degree. CASIA-
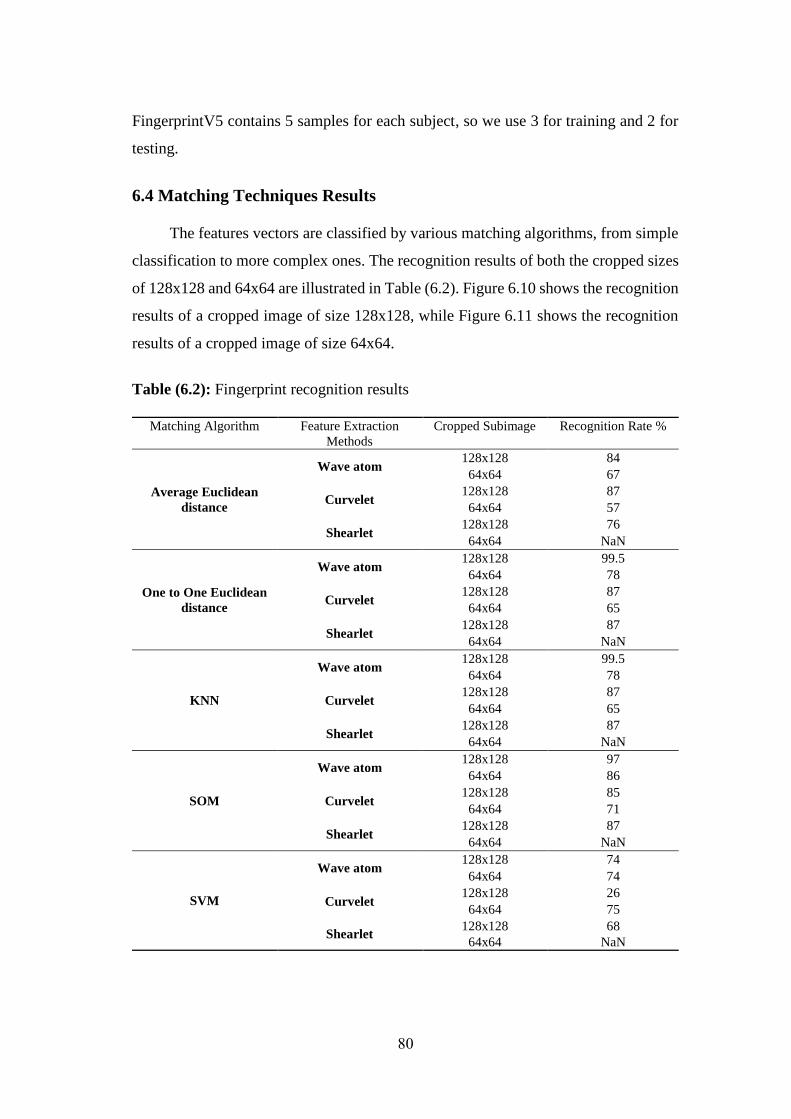
80
FingerprintV5 contains 5 samples for each subject, so we use 3 for training and 2 for
testing.
6.4 Matching Techniques Results
The features vectors are classified by various matching algorithms, from simple
classification to more complex ones. The recognition results of both the cropped sizes
of 128x128 and 64x64 are illustrated in Table (6.2). Figure 6.10 shows the recognition
results of a cropped image of size 128x128, while Figure 6.11 shows the recognition
results of a cropped image of size 64x64.
Table (6.2): Fingerprint recognition results
Recognition Rate % Cropped Subimage Feature Extraction
Methods
Matching Algorithm
84 128x128 Wave atom
Average Euclidean
distance
67 64x64
87 128x128 Curvelet
57 64x64
76 128x128 Shearlet
NaN 64x64
99.5 128x128 Wave atom
One to One Euclidean
distance
78 64x64
87 128x128 Curvelet
65 64x64
87 128x128 Shearlet
NaN 64x64
99.5 128x128 Wave atom
KNN
78 64x64
87 128x128 Curvelet
65 64x64
87 128x128 Shearlet
NaN 64x64
97 128x128 Wave atom
SOM
86 64x64
85 128x128 Curvelet
71 64x64
87 128x128 Shearlet
NaN 64x64
74 128x128 Wave atom
SVM
74 64x64
26 128x128 Curvelet
75 64x64
68 128x128 Shearlet
NaN 64x64
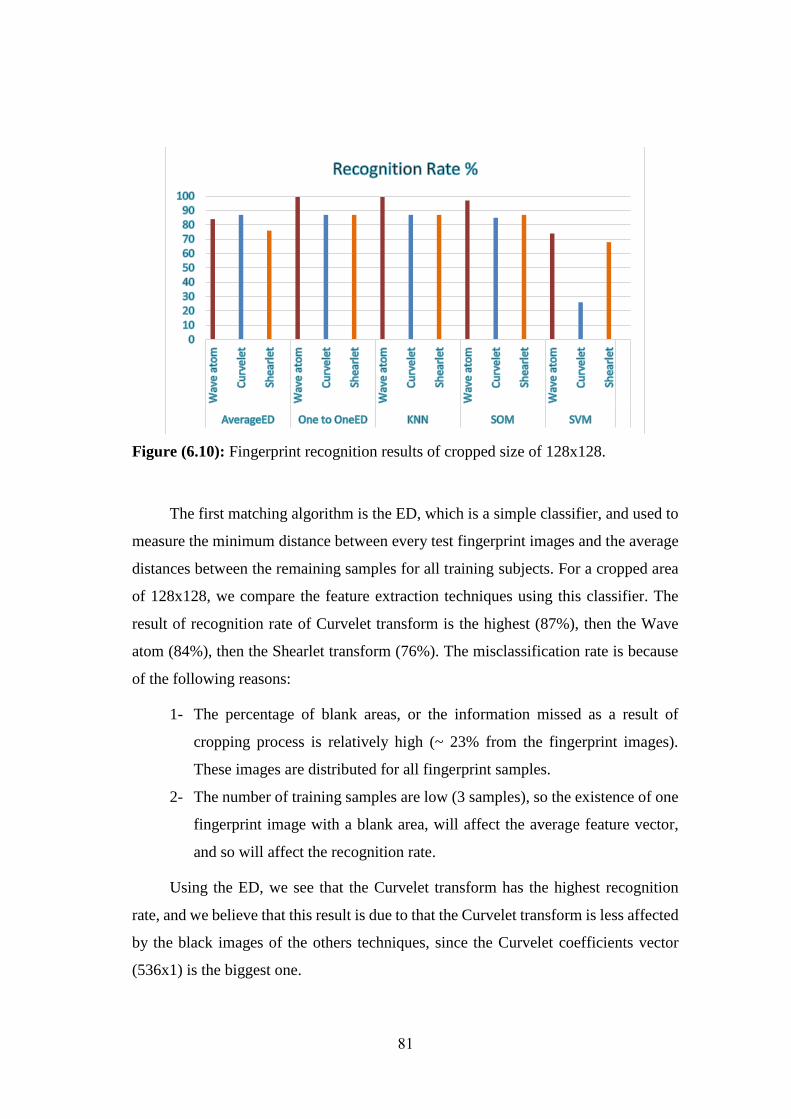
81
Figure (6.10): Fingerprint recognition results of cropped size of 128x128.
The first matching algorithm is the ED, which is a simple classifier, and used to
measure the minimum distance between every test fingerprint images and the average
distances between the remaining samples for all training subjects. For a cropped area
of 128x128, we compare the feature extraction techniques using this classifier. The
result of recognition rate of Curvelet transform is the highest (87%), then the Wave
atom (84%), then the Shearlet transform (76%). The misclassification rate is because
of the following reasons:
1- The percentage of blank areas, or the information missed as a result of
cropping process is relatively high (~ 23% from the fingerprint images).
These images are distributed for all fingerprint samples.
2- The number of training samples are low (3 samples), so the existence of one
fingerprint image with a blank area, will affect the average feature vector,
and so will affect the recognition rate.
Using the ED, we see that the Curvelet transform has the highest recognition
rate, and we believe that this result is due to that the Curvelet transform is less affected
by the black images of the others techniques, since the Curvelet coefficients vector
(536x1) is the biggest one.
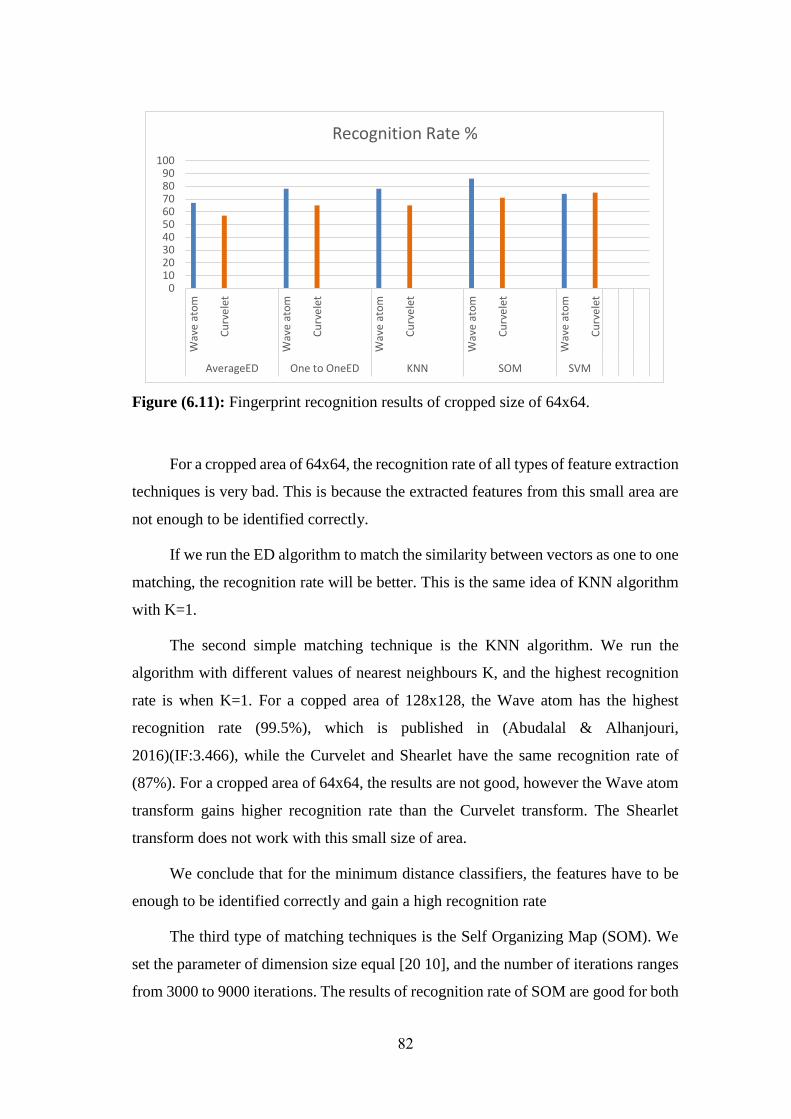
82
Figure (6.11): Fingerprint recognition results of cropped size of 64x64.
For a cropped area of 64x64, the recognition rate of all types of feature extraction
techniques is very bad. This is because the extracted features from this small area are
not enough to be identified correctly.
If we run the ED algorithm to match the similarity between vectors as one to one
matching, the recognition rate will be better. This is the same idea of KNN algorithm
with K=1.
The second simple matching technique is the KNN algorithm. We run the
algorithm with different values of nearest neighbours K, and the highest recognition
rate is when K=1. For a copped area of 128x128, the Wave atom has the highest
recognition rate (99.5%), which is published in (Abudalal & Alhanjouri,
2016)(IF:3.466), while the Curvelet and Shearlet have the same recognition rate of
(87%). For a cropped area of 64x64, the results are not good, however the Wave atom
transform gains higher recognition rate than the Curvelet transform. The Shearlet
transform does not work with this small size of area.
We conclude that for the minimum distance classifiers, the features have to be
enough to be identified correctly and gain a high recognition rate
The third type of matching techniques is the Self Organizing Map (SOM). We
set the parameter of dimension size equal [20 10], and the number of iterations ranges
from 3000 to 9000 iterations. The results of recognition rate of SOM are good for both
0102030405060708090
100
Wav
e at
om
Cu
rve
let
Wav
e at
om
Cu
rve
let
Wav
e at
om
Cu
rve
let
Wav
e at
om
Cu
rve
let
Wav
e at
om
Cu
rve
let
AverageED One to OneED KNN SOM SVM
Recognition Rate %
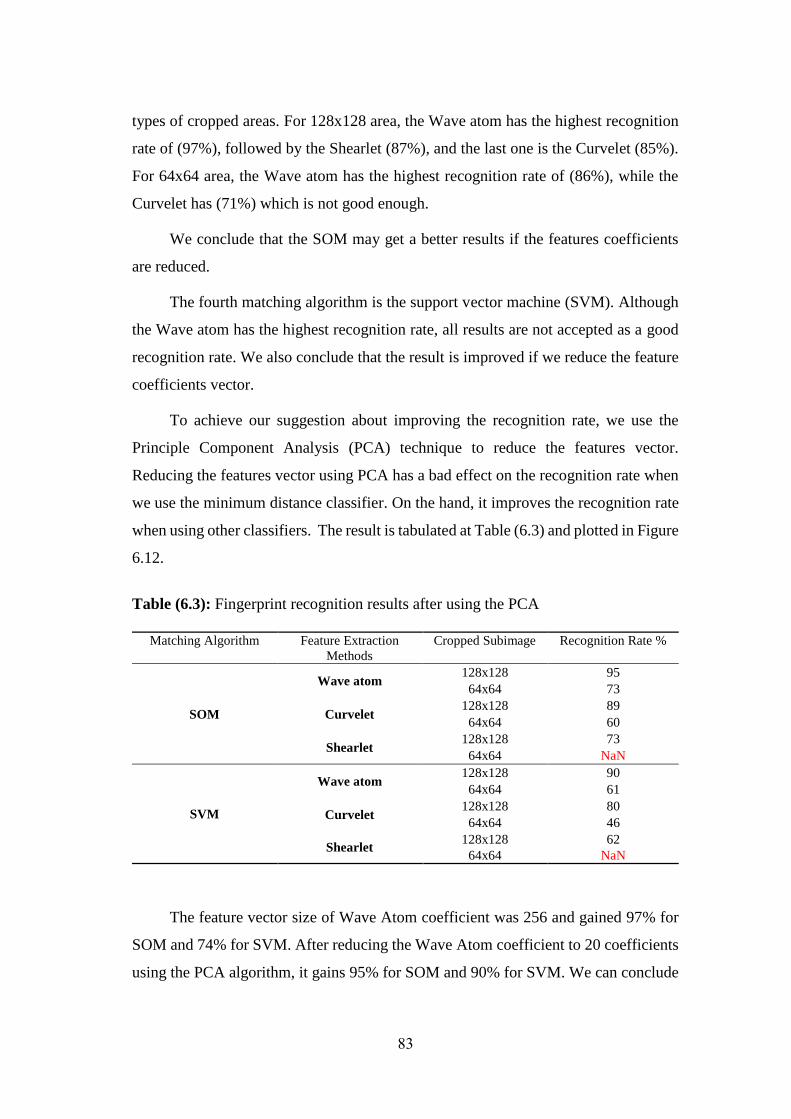
83
types of cropped areas. For 128x128 area, the Wave atom has the highest recognition
rate of (97%), followed by the Shearlet (87%), and the last one is the Curvelet (85%).
For 64x64 area, the Wave atom has the highest recognition rate of (86%), while the
Curvelet has (71%) which is not good enough.
We conclude that the SOM may get a better results if the features coefficients
are reduced.
The fourth matching algorithm is the support vector machine (SVM). Although
the Wave atom has the highest recognition rate, all results are not accepted as a good
recognition rate. We also conclude that the result is improved if we reduce the feature
coefficients vector.
To achieve our suggestion about improving the recognition rate, we use the
Principle Component Analysis (PCA) technique to reduce the features vector.
Reducing the features vector using PCA has a bad effect on the recognition rate when
we use the minimum distance classifier. On the hand, it improves the recognition rate
when using other classifiers. The result is tabulated at Table (6.3) and plotted in Figure
6.12.
Table (6.3): Fingerprint recognition results after using the PCA
Recognition Rate % Cropped Subimage Feature Extraction
Methods
Matching Algorithm
95 128x128 Wave atom
SOM
73 64x64
89 128x128 Curvelet
60 64x64
73 128x128 Shearlet
NaN 64x64
90 128x128 Wave atom
SVM
61 64x64
80 128x128 Curvelet
46 64x64
62 128x128 Shearlet
NaN 64x64
The feature vector size of Wave Atom coefficient was 256 and gained 97% for
SOM and 74% for SVM. After reducing the Wave Atom coefficient to 20 coefficients
using the PCA algorithm, it gains 95% for SOM and 90% for SVM. We can conclude
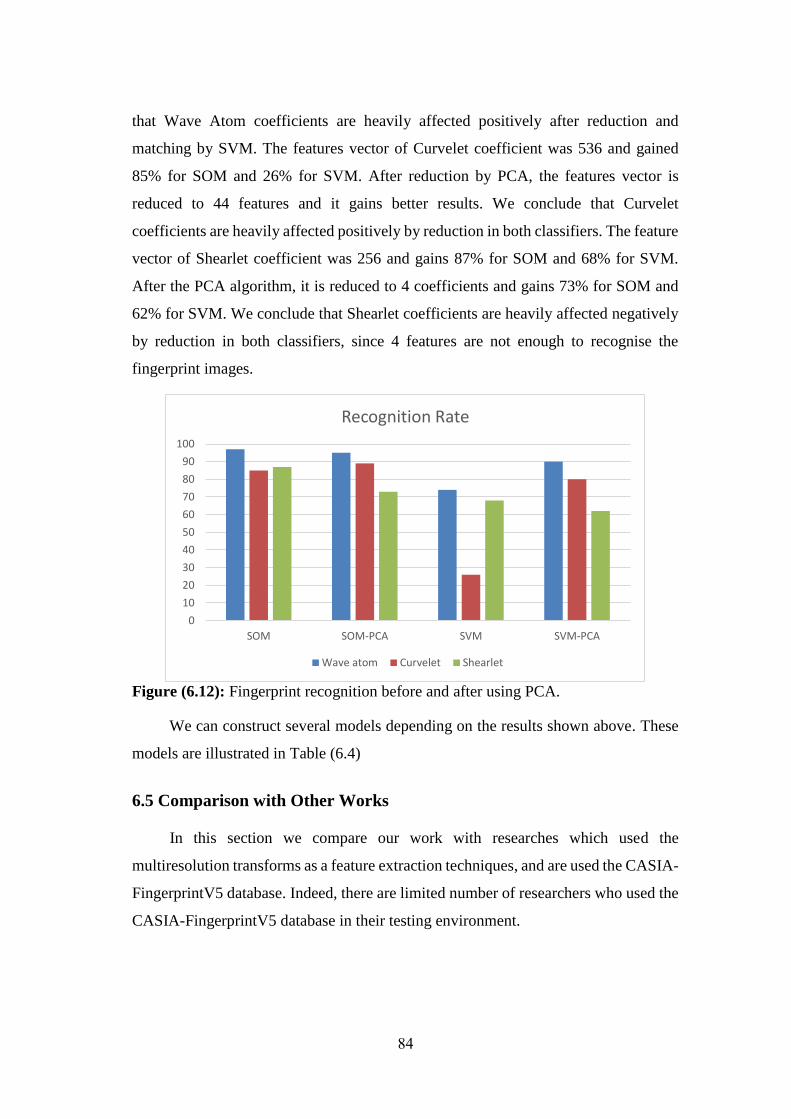
84
that Wave Atom coefficients are heavily affected positively after reduction and
matching by SVM. The features vector of Curvelet coefficient was 536 and gained
85% for SOM and 26% for SVM. After reduction by PCA, the features vector is
reduced to 44 features and it gains better results. We conclude that Curvelet
coefficients are heavily affected positively by reduction in both classifiers. The feature
vector of Shearlet coefficient was 256 and gains 87% for SOM and 68% for SVM.
After the PCA algorithm, it is reduced to 4 coefficients and gains 73% for SOM and
62% for SVM. We conclude that Shearlet coefficients are heavily affected negatively
by reduction in both classifiers, since 4 features are not enough to recognise the
fingerprint images.
Figure (6.12): Fingerprint recognition before and after using PCA.
We can construct several models depending on the results shown above. These
models are illustrated in Table (6.4)
6.5 Comparison with Other Works
In this section we compare our work with researches which used the
multiresolution transforms as a feature extraction techniques, and are used the CASIA-
FingerprintV5 database. Indeed, there are limited number of researchers who used the
CASIA-FingerprintV5 database in their testing environment.
0
10
20
30
40
50
60
70
80
90
100
SOM SOM-PCA SVM SVM-PCA
Recognition Rate
Wave atom Curvelet Shearlet
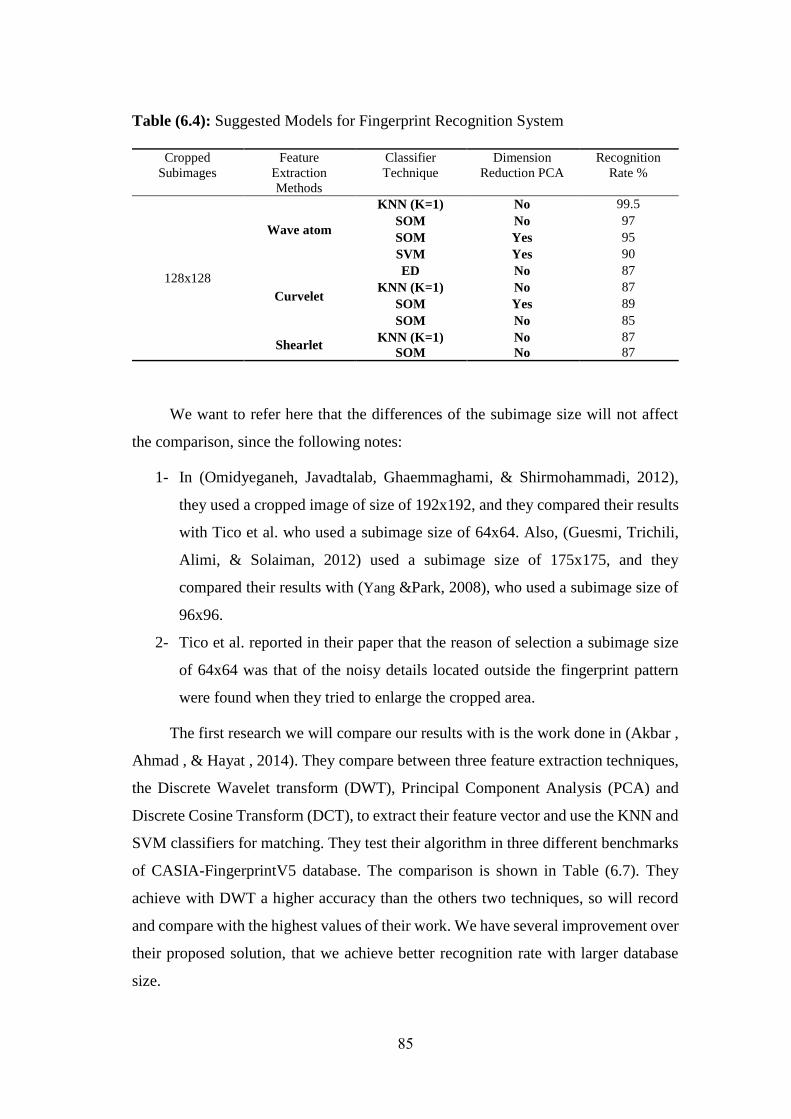
85
Table (6.4): Suggested Models for Fingerprint Recognition System
Recognition
Rate %
Dimension
Reduction PCA
Classifier
Technique
Feature
Extraction
Methods
Cropped
Subimages
99.5 No KNN (K=1)
Wave atom
128x128
97 No SOM
95 Yes SOM
90 Yes SVM
87 No ED
Curvelet 87 No KNN (K=1)
89 Yes SOM
85 No SOM
87 No KNN (K=1) Shearlet
87 No SOM
We want to refer here that the differences of the subimage size will not affect
the comparison, since the following notes:
1- In (Omidyeganeh, Javadtalab, Ghaemmaghami, & Shirmohammadi, 2012),
they used a cropped image of size of 192x192, and they compared their results
with Tico et al. who used a subimage size of 64x64. Also, (Guesmi, Trichili,
Alimi, & Solaiman, 2012) used a subimage size of 175x175, and they
compared their results with (Yang &Park, 2008), who used a subimage size of
96x96.
2- Tico et al. reported in their paper that the reason of selection a subimage size
of 64x64 was that of the noisy details located outside the fingerprint pattern
were found when they tried to enlarge the cropped area.
The first research we will compare our results with is the work done in (Akbar ,
Ahmad , & Hayat , 2014). They compare between three feature extraction techniques,
the Discrete Wavelet transform (DWT), Principal Component Analysis (PCA) and
Discrete Cosine Transform (DCT), to extract their feature vector and use the KNN and
SVM classifiers for matching. They test their algorithm in three different benchmarks
of CASIA-FingerprintV5 database. The comparison is shown in Table (6.7). They
achieve with DWT a higher accuracy than the others two techniques, so will record
and compare with the highest values of their work. We have several improvement over
their proposed solution, that we achieve better recognition rate with larger database
size.
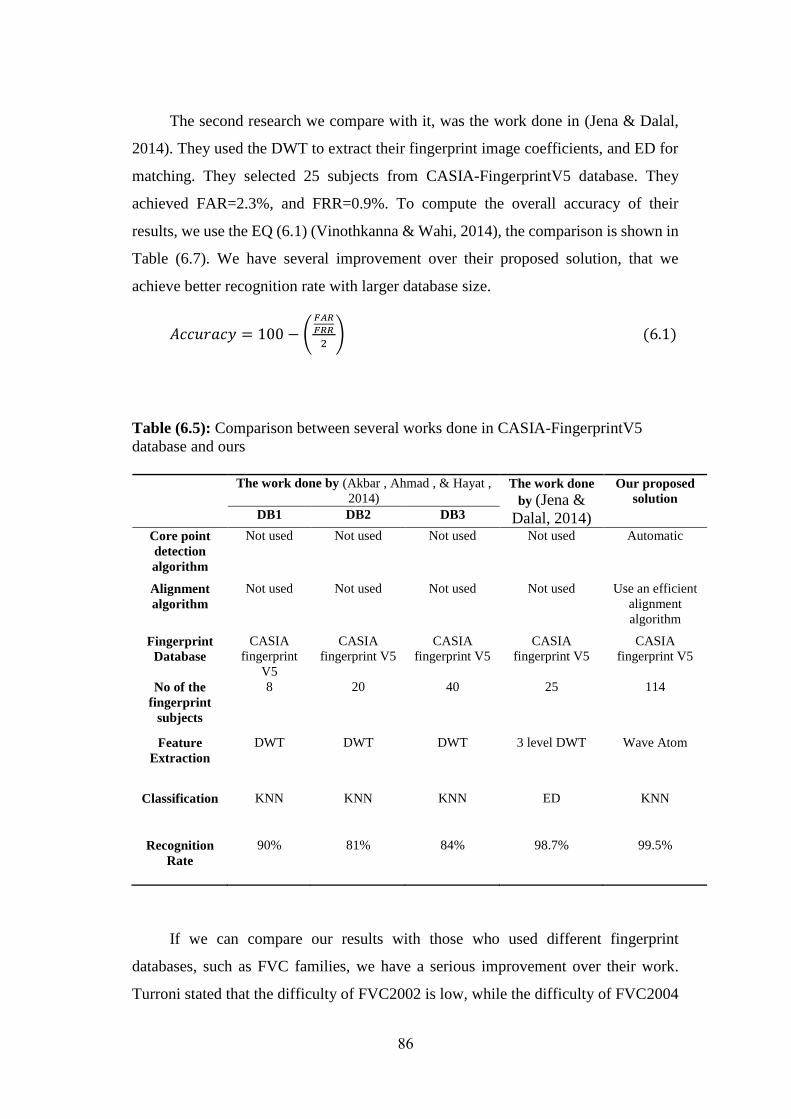
86
The second research we compare with it, was the work done in (Jena & Dalal,
2014). They used the DWT to extract their fingerprint image coefficients, and ED for
matching. They selected 25 subjects from CASIA-FingerprintV5 database. They
achieved FAR=2.3%, and FRR=0.9%. To compute the overall accuracy of their
results, we use the EQ (6.1) (Vinothkanna & Wahi, 2014), the comparison is shown in
Table (6.7). We have several improvement over their proposed solution, that we
achieve better recognition rate with larger database size.
𝐴𝑐𝑐𝑢𝑟𝑎𝑐𝑦 = 100 − (𝐹𝐴𝑅
𝐹𝑅𝑅
2) (6.1)
Table (6.5): Comparison between several works done in CASIA-FingerprintV5
database and ours
The work done by (Akbar , Ahmad , & Hayat ,
2014) The work done
by (Jena &
Dalal, 2014)
Our proposed
solution
DB1 DB2 DB3
Core point
detection
algorithm
Not used Not used Not used Not used Automatic
Alignment
algorithm
Not used Not used Not used Not used Use an efficient
alignment
algorithm
Fingerprint
Database
CASIA
fingerprint
V5
CASIA
fingerprint V5
CASIA
fingerprint V5
CASIA
fingerprint V5
CASIA
fingerprint V5
No of the
fingerprint
subjects
8 20 40 25 114
Feature
Extraction
DWT DWT DWT 3 level DWT Wave Atom
Classification KNN KNN KNN ED KNN
Recognition
Rate
90% 81% 84% 98.7% 99.5%
If we can compare our results with those who used different fingerprint
databases, such as FVC families, we have a serious improvement over their work.
Turroni stated that the difficulty of FVC2002 is low, while the difficulty of FVC2004

87
is medium (Turroni, 2012). Some researchers have described the CASIA-
FingerprintV5 as a very challenges database (Li, Busch , & Yang, 2014)
There were a series of researches which used the multiresolution techniques in
fingerprint identification. These researches which started by using Wavelet transform
(Tico, Immonen, Ramo, Kuosmanen, & Saarinen, 2001), followed by Contourlet
transform (Omidyeganeh, Javadtalab, Ghaemmaghami, & Shirmohammadi, 2012),
and Curvelet transform (Mandal & Jonathan Wu, 2008; Guesmi, Trichili, Alimi, &
Solaiman, 2012; Humaira, Bushra, Firdous, Khan, & Islam, 2013). We have several
improvements over their works in terms of number of testing fingerprint database, and
the recognition rate.

88
Chapter 7
Conclusion and Future
Work
89
Chapter 7
Conclusions and Future Work
7.1 Conclusions
During the study and the development of this thesis, various problems have been
identified, which results yield contribution to the automatic fingerprint recognition
system. The following conclusions are listed below:
To achieve high recognition rate in poor quality fingerprint images, the
fingerprint image has to be enhanced with a reliable enhancement techniques.
Fingerprint enhancement technique based on STFT analysis is a reliable and an
efficient technique which applied on CASIA-FingerprintV5 database.
Accurate segmentation to distinguish between the foreground and background is
an important step for the efficiency and the accuracy of subsequent enhancement and
feature extraction stages. Segmentation based on one threshold value for all the
fingerprint image may lose some important information at least visible and intensity
regions, while segmentation based on the range image feature over blocks and local
adaptive thresholding, performs better than the original since it selects an appropriate
threshold level for each block. Furthermore, applying segmentation after enhancement
may lose the humidity regions in fingerprint image since there are no regular signal in
these regions, and hence the Fourier transform of these regions is constant and these
parts will not be processed through a complete enhancement process. Segmentation
based on morphological operations, closing and opening operations, before
enhancement can segment these humidity regions.
An accurate displacement and rotation of fingerprint images are critical issues
that affect the performance of feature extraction techniques, and decrease the
recognition rate. Our used methodology is translation invariant, since we use the core
point as a reference point. Detection the core point algorithm based on complex filters
performs good after enhancement steps, but it fails to detect the exact location of the
core point in whorl and twin loop fingerprint classes, because these classes of
fingerprints have two core points. So it detects one of the core point in one sample,
90
and detects the other in the other sample. The percentage of whorl and twin loop
fingerprint classes in our selected database is 17%.
Although the fingerprint alignment algorithm of Msiza et al. is independent and
performs well in our experiments, it has some drawbacks. It performs well in the
images of almost complete mask, i.e. without cuts in the image boundaries, especially
if the image is cut in more than one side, such as the images of CASIA-FingerprintV5
database. Another factor of limitations, that the algorithm assumes that most
fingerprint rotation angle ranges between (0-90 degree), but we found that, in CASIA-
FingerprintV5 images, the rotation angle ranges between (0-360 degree). We suggest
a good solution to overcome this limitation, but because the limitation in thesis
schedule, we cannot implement the suggested solution, which is explained in the future
work section. The segmentation process may leave some small black parts at the upper
boundary of fingerprint image, especially when the fingerprint displacement is out of
the top image border. We solve this problem by implementing a method to eliminate
these parts.
In poor quality fingerprint images, the extracted features from a fingerprint
subimage of size 64x64 are not enough to recognize the persons. When we increase
the size of subimage to 128x128, the performance of recognition is increased, in spite
of losing some parts of the images which contain important information about the ridge
structure due to the nearest of the core point location to the image boundaries.
Curvelet and Shearlet represent and target the edge features, while Wave Atom
represents the image texture (Yao Z. , 2007). This may explain the convergence of
results which are obtained from Curvelet and Shearlet. Targeting the image texture in
fingerprint image is more efficient than the image edge. Among all multiresolution
feature extraction techniques, Wave Atoms transform is the highest recognition rate of
99.5% which is published in (Abudalal & Alhanjouri, 2016).
Most researches which used the multiresolution techniques in fingerprint
identification, tested their proposed solution in small database which ranged from (10-
50 subjects), since increasing the number of subjects will decrease the recognition rate.
We test our methodology on a large number of subjects (114 subjects). We introduce
91
an automatic fingerprint recognition system on a very challenges fingerprint database,
CASIA-FingerprintV5, and achieve a high recognition rate.
We choose to test our methodology in a noisy database. CASIA-FingerprintV5
database is a very challenges database, and it needs a lot of processes to solve the
problems of high displacement, wide range of angle rotation, and bad quality
fingerprint images.
7.2 Future Work
The following points are some suggestions for future study:
1- The alignment algorithm which is used in this thesis, has limited to a rotation
angle between (0-90 degrees). The CASIA-FingerprintV5 has various rotation
angle between (0-360 degrees). We can use the following solution to consider
the whole angle:
a. For a rotation angle between (90, -90): this angles can be discovered by
investigating the distance of both the horizontal axis, and the vertical
axis, and if the horizontal axis distance is more than the vertical axis,
then the image is rotated with an angle of 90 or -90. To decide what
angle has to be taken, we can look at the core point orientation: if it
refers to the right, then the image has to be rotated by 90 degree, else it
has to be rotated by -90 degree.
b. For a rotation angle between (0, -180): this angles can be discovered
by investigating the distance of both the horizontal axis, and the vertical
axis, and if the horizontal axis distance is shorter than the vertical axis,
then the image is rotated with an angle of 0 or 180. To decide what
angle has to be taken, we can look at the core point orientation: if it
refers to the upper, then the image has to be rotated by 180 degree, else
it does not need a rotation.
2- The proposed fingerprint recognition system needs to be secured against
several attacks, which can compromise the system, and steel the template. This
field has received more and more attention in the last years. We found that the
most last researches in IEEE is about securing the biometrics templates.

92
3- Core point detection technique needs to be improved to face the problem of
whorl and twin loop fingerprint types.
4- We use the standard deviation to reduce the dimension of feature matrix, but
there are other statistical properties of the image texture: first order and second
order statistical features such as: mean, skewness, kurtosis, energy, contrast,
correlation, entropy, and homogeneity. We will try to replace the standard
deviation with one or a combination of them.
5- We will apply our proposed methodology in latent fingerprint, and deal with
various problems in this field.

93
References
94
References Abduljaleel, I., Khaleel, A., Kareem, S. (2013). Comparing study using DWT / CT
transforms in image denoising process. Basrah Journal of Science (A), 3(1),
111-120.
Abudalal, W., & Alhanjouri, M. (2016). Poor Quality Fingerprint Recognition
Based on Wave Atom Transform. International Journal of Scientific
Engineering and Applied Science (IJSEAS), 2(8), 234-254.
Acquah, H., & Gyimah, M. (2014). Classification and Recognition of Fingerprints
using Self Organizing Maps(SOM). IJCSI International Journal of Computer
Science Issues, 11(1), 153-160.
Akbar , S., Ahmad , A., & Hayat , M. (2014). Identification of Fingerprint Using
Discrete Wavelet Transform in Conjunction with Support Vector Machine.
International Journal of Computer Science Issues (IJCSI), 11(5), 189-200.
Albahdal, T. (2014, April 7-9). Problems and Promises of Using the Cloud and
Biometrics. Paper presented at IEEE 11th International Conference on
Information Technology: New Generations (pp. 293-300), Las Vegas, NV.
Alonso-Fernandez , F., Bigun, J., Fierrez, J., Fronthaler, H., Kollreider, K., &
Ortega-Garcia, J. (2009). Fingerprint Recognition. In Petrovska-Delacrétaz,
Dijana, Chollet, Gérard, Dorizzi, and Bernadette (Eds.), Guide to Biometric
Reference Systems and Performance Evaluation (pp.51-90). London: Springer-
Verlag.
Altun, A., & Allahverd, N. (2006). Recognition of Fingerprints Enhanced by
Contourlet Transform with Artificial Neural Networks. Paper presented at
IEEE 28th International Conference on Information Technology: Interfaces,
Cavtat/Dubrovnik.
Saleh, A. (2011). Enhanced Secure Algorithm for Fingerprint Recognition.
(Unpublished PHD Thesis). Ain Shams University, Egypt.
Azarnoush, A., & Kiani, K. (2014). Improving the Performance of an HMM-based
Fingerprint Recognition System. Paper presented at IEEE 2014 World
Symposium on Computer Applications & Research (WSCAR), Sousse.
Babatunde, I., Kayode, B., Charles, A, & Olatubosun, O. (2012). Fingerprint
Image Enhancement: Segmentation to Thinning. International Journal of
Advanced Computer Science and Applications (IJACSA), 3(1), 15-25.
Baghelani, M., Eshkaftaki, J., & Ebrahimi, A. (2010, October). A Novel Mapping
for Fingerprint Image Enhancement. Paper presented at 6th Iranian
Conference on Machine Vision and Image Processing (MVIP), Iranian.
Isfahan.
Balti, A., Sayadi, M., & Fnaiech, F. (2014). Fingerprint characterization using
SVD features. Paper presented at IEEE 1st International Conference on Image
Processing, Applications and Systems (IPAS), Sfax.
Bouaziz, A. , Draa, A., & Chikhi, S. (2015, April). Bat Algorithm for Fingerprint
Image Enhancement. Paper presented at IEEE 12th International Symposium
on Programming and Systems (ISPS). Algiers.
Boutella, L., & Serir, A. (2013). Fingerprint Orientation Map Based on Wave
Atoms Transform. Journal of Image and Graphics, 1(3), 129-134.
Cand`es, E., Demanet, L., Donoho, D., & Ying, L. (2005). Fast Discrete Curvelet
Transforms. Applied and Computational Mathematics. Retrieved March 10,
2015, from: http://www.curvelet.org/
95
Chakraborty, S., & Rao, K. (2012, May). Fingerprint Enhancement by Directional
Filtering. Paper presented at IEEE 9th International Conference on Electrical
Engineering/Electronics, Computer, Telecommunications and Information
Technology (ECTI-CON), Phetchaburi.
Chaudhari, S., & Patil, A. (2013). A Study and Review on Fingerprint Image
Enhancement and Minutiae Extraction. IOSR Journal of Computer
Engineering (IOSR-JCE), 9(6), 53-56.
Chavan, S., Mundada, P., & Pal, D. (2015, Febreuary 4-6). Fingerprint
Authentication using Gabor Filter based Matching Algorithm. Paper presented
at IEEE International Conference on Technologies for Sustainable
Development (ICTSD-2015). Mumbai, India.
Chen, F., & Zhou, J. (2010, Augest 22-22). A Comparative Study of Combining
Multiple Features for Fingerprint Recognition. Paper presented at IEEE
International Workshop on Emerging Techniques and Challenges for Hand-
Based Biometrics (ETCHB). Istanbul.
Chikkerur, S., Cartwright, A., Govindaraju, V. (2007). Fingerprint Image
Enhancement Using STFT Analysis. The Journal of Pattern Recognition,
Elsevier., 40(1), 198-211.
Chikkerur, Wu, S., Govindaraju, V. (2004). A systematic approach for feature
extraction in fingerprint images. In D. Zhang and A. Jain (Eds.), Biometric
Authentication. (pp. 344-350). Berlin: Springer.
Cortes, & Vapnik. (1995). Support-vector networks. Machine Learning, 20(3),
273-297.
Dale, M., & Joshi, M. (2008, November 19-21). Fingerprint Matching Using
Transform Features. Paper presented at IEEE 10 International Conference
TENCON. Hyderabad
Daramola, A., Sokunbi, T., Adoghe, A. (2013). Fingerprint Verification System
Using Support Vector Machine. International Journal on Computer Science
and Engineering (IJCSE), 5(3), 678-684.
Demanet, L., & Ying, L. (2007). Wave atoms and sparsity of oscillatory patterns.
Elsevier, 368-387.
Diefenderfer, G. (2006). Fingerprint Recognition (Unpublished Master Thesis).
Graduate School, California.
Candes, E., & Donoho, L. (2000). Curvelets: A surprisingly effective nonadaptive
representation. Stanford University. Retrieved from
http://statweb.stanford.edu/~candes/papers/Curvelet-SMStyle.pdf
Dyre, S. & Sumathi, C. (2014, Descember 18-20). Hybrid approach to Enhancing
Fingerprint Images using filters in the frequency domain. Paper presented at
IEEE International Conference on Computational Intelligence and Computing
Research (ICCIC), Coimbatore.
Easley, G., Labate, D., & Colonna, F. (2009). Shearlet Based Total Variation for
Denoising. IEEE Transactions on Image Processing, 18(2), 260 - 268.
El-Feghi, I., Tahar, A., Ahmadi, M. (2011). Efficient Features Extraction for
Fingerprint Classification with Multi Layer Perceptron Neural Network. Paper
presented at IEEE 8th International Multi-Conference on Systems, Signals and
Devices (SSD). Sousse.
96
Elmir, Y., Elberrichi, Z., Adjoudj. R. (2012). Support Vector Machine Based
Fingerprint Identification. Paper presented at IEEE International Conference
on CTIC. Algeria.
Eriksson, M. (2001). Biometrics Fingerprint based identity verification
(Unpublished Master Thisis). UMEÅ University, Sweden.
Fadili, J., & Starck, L. (2009). Curvelets and Ridgelets. Encyclopedia of
Complexity and Systems Science, 1718-1738. Springer New York.
Fahmy, M., & Thabet, M. (2013). A Fingerprint Segmentation Technique Based
on Morphological Processing. Paper presented at IEEE International
Symposium on Signal Processing and Information Technology, Athens.
Gan, G., Ma, C., & Wu, J. (Eds.). (2007). Data Clustering Theory, Algorithms,and
Applications. Alexandria, Virginia: American Statistical Association and the
Society for Industrial and Applied.
Gomathi, & Kumar. (2010, December 28-29). An Efficient GEM Model for Image
Inpainting Using a New Directional Sparse Representation: Discrete Shearlet
Transform. Paper presented at IEEE 2010 International Conference on
Computational Intelligence and Computing Research (ICCIC), Coimbatore.
Goshtasby, A. (2012). Image Registration: Principles, Tools and Methods. USA:
Springer.
Greenberg, S., Aladjem, M., Kogan, D., Dimitrov, I. (2000). Fingerprint Image
Enhancement Using Filtering Techniques. Paper presented at IEEE 15th
International Conference on Pattern Recognition, Barcelona.
Grohs, P., Keiper, S., Kutyniok, G., Schaefer, M. (2013). Parabolic Molecules:
Curvelets, Shearlets,and Beyond. In G., Fasshauer, L., Schumaker (Eds.),
Approximation Theory XIV: San Antonio 2013, (pp. 141-172). Switzerland:
Springer International Publishing.
Guesmi, H., Trichili, H., Alimi, A., & Solaiman, B. (2012, September 6-7).
Curvelet Transform-Based Features Extraction For Fingerprint Identification.
Paper presented at IEEE International Conference of the Biometrics Special
Interest Group (BIOSIG). Darmstadt .
Guo, H. (2005, August 18-21). A Hidden Markov Model Fingerprint Matching
Approach. Paper presented at IEEE International Conference on Machine
Learning and Cybernetics.Guangzhou, China.
Haddad, Z., Beghdadi, A., Serir, A., & Mokraoui, A. (2008, November 23-26).
Fingerprint Identification Using Radon Transform. Paper presented at IEEE
First Workshops on Image Processing Theory, Tools and Applications. Sousse.
Hamad, H. M., & Abudalal, W. (2016). The Two Secured Factors of
Authentication. IUG Journal of Natural and Engineering Studies (Islamic
University of Gaza), 24(1), 1-14.
Hamilton, J. (2008). Fingerprint Analysis: Hints from Prints. United States:
ABDO publishing company.
He, Y., Ou, Z., & Guo, H. (2003, November 2-5). A Method of Fingerprint
Identification Based on Space Invariant Transforms and Support Vector
Machines. Paper presented at IEEE International Conference on Machine
Learning and Cybernetics.
Hejazi, H., & Alhanjouri, M. (2010). Face Recognition Using Curevelet And
Waveatom Transform (Unpublished Master Thesis). IUG, Gaza, Palestine.
97
Hong, L., Wang, Y., & Jain, K. (1998). Fingerprint Image Enhancement:
Algorithm and Performance Evaluation. IEEE Trans. Pattern Analysis
Machine, 20(8), 777–789.
Hsieh, T., Lai, E., Wang, C. (2003). An effective algorithm for fingerprint image
enhancement based on wavelet transform. Elsevier, 36(2), 303 – 312.
Hu, Y., Jing, X., Zhan, B., Zhu, X. (2010, March 27-29). Low Quality Fingerprint
Image Enhancement Based on Gabor Filter. Paper presented at IEEE 2nd
International Conference on Advanced Computer Control (ICACC).
Shenyang.
Humaira, N., Bushra, N., Firdous, Z., Khan, M., & Islam, M. (2013, May 17-18).
Curvelet Feature Based Fingerprint Recognition Using Fourier Enhancement.
Paper presented at IEEE International Conference on Informatics, Electronics
& Vision (ICIEV). Dhaka.
Ito, K., Morita, A., Aoki, T., Higuchi, T., Nakajima, H., & Kobayashi, K. (2005,
September 11-14). A Fingerprint Recognition Algorithm Using Phase-Based
Image Matching for Low-Quality Fingerprints. Paper presented at IEEE
International Conference on Image Processing.
Iwasokun, G., & Akinyokun, O. (2014). Fingerprint Singular Point Detection
Based on Modified Poincare Index Method. International Journal of Signal
Processing, Image Processing and Pattern Recognition, 7(5), 259-272.
Jain, A., Prabhakar, S., Hong, L., & Pankanti, S. (2000). Filterbank-Based
Fingerprint Matching. IEEE Transactions on Image Processing, 9(5), 846-860.
Jalutharia, N. (2010). Fingeprint Recognitin and Analysis (Unpublished Master
Thesis) Thapar University, Patiala, India.
Jea, T.-Y. (2005). Minutiae-Based Partial Fingerprint Recognition (Unpublished
PHD Thesis). State University of New York at Buffalo, New York.
Jena, M., & Dalal, S. (2014). DWT Based Fingerprint Recognition Approach.
International Journal of Engineering Research & Technology (IJERT), 3(5),
1800-1803.
Jia, C., Cao, K. (2012, June 24-27). The research on the preprocessing algorithm
for fingerprint image. Paper presented at IEEE Symposium on Electrical &
Electronics Engineering (EEESYM). Kuala Lumpur .
Kabir, W., Ahmad, O., & Swamy. (2013, Augest 4-7). Enhancement of Low-
Quality Fingerprint Images by a Three-Stage Filtering Scheme. Paper
presented at IEEE 56th International Midwest Symposium on Circuits and
Systems (MWSCAS), Columbus, OH.
Kankrale N., & Jawale, M. (2013). Fuzzy Logic Concatenation in Fingerprint and
Iris Multimodal Biometric Identification System. International Journal of
Advanced Research in Computer Science and Software Engineering, 3(10),
120-126.
Kankrale, N., & Sapkal, D. (2012). Template Level Concatenation of Iris and
Fingerprint in Multimodal Biometric Identification Systems. Paper presented
at International Conference on Recent Trends in Engineering & Technology
(IJECSCSE),
Kawagoe, M., & Tojo, A. (1984). Fingerprint pattern classification. Elsevier,
17(3), 295-303.
Kesava, R. (2010). Cloud Software As A Service. Journal of Global Research in
Computer Science, 1(2), 16-22.
98
Khan, M., & Zakirullah, A. (2010, October 24-28). Fourier Cleaning of
Fingerprint Images. Paper presented at IEEE 10th International Conference on
Signal Processing Proceedings. Beijing.
Khan, M., Khan, A., & Muhammad, N. (2010, June 14-16). Fingerprint Image
Enhancement Using Principal Component Analysis (PCA) Filters. Paper
presented at IEEE International Conference on Information and Emerging
Technologies (ICIET). Karachi
King, E., Kutyniok, G., Lim, W. (2013). Image Inpainting: Theoretical Analysis
and Comparison of Algorithms. SPIE Optical Engineering+ Applications (pp.
885802-885802). International Society for Optics and Photonics.
Kumar, N. & Verma, P. (2012). Fingerprint Image Enhancement and Minutia
Matching. International Journal of Engineering Sciences & Emerging
Technologies (IJESET), 2(2), 37-42.
Kundu, S., & Sarker, G. (2015). A Modified SOM-Based RBFN for Rotation
Invariant Clear and Occluded Fingerprint Recognition. Springer, 11-20.
Kutyniok, G., Lim, W., & Steidl, G. (2014). Shearlets: Theory and Applications.
GAMM‐Mitteilungen, 37(2), 259 – 280.
Labate, D., Yi, S., Easley, G., & Krim, H. (2009). A Shearlet Approach To Edge
Analysis and Detection. IEEE Trans. Image Process, 18(5), 929-941.
Labate, D., Lim, W., Kutyniok, G., & Weiss, G. (2005). Sparse Multidimensional
Representation using Shearlets. Paper presented at International Society for
Optics and Photonics in Optics & Photonics.
Lam, H., Hou, Z., Yau, W., Chen, T., Li, J., Sim, K. (2009). Reference Point
Detection for Arch Type Fingerprints. Lecture Notes in Computer Science,
5558, 666-674.
Leo, W. (2004). Fingerprint Identification. San Clemente: LawTech Publishing
Group.
Lewis, I. (2014). Ever had your fingerprints taken? Meeting the challenges of 21st
Century access control. Elsevier, Biometric Technology Today, 2014(5), 9-11.
Li, G., Busch, C., & Yang, B. (2014, May 26-30). A novel approach used for
measuring fingerprint orientation of arch fingerprint. Paper presented at IEEE
37th International Convention on Information and Communication
Technology, Electronics and Microelectronics (MIPRO), Opatija.
Liu, L., Jiang, T., Yang, J., & Zhu, C. (2006). Fingerprint Registration by
Maximization of Mutual Information. IEEE Transactions on Image
Processing, 15(5), 1100-1111.
Luo, J., Lin, S., Lei, M., & Ni, J. (2008, October). Application of Dimensionality
Reduction Analysis to Fingerprint Recognition. Paper presented at IEEE '08.
International Symposium on Computational Intelligence and Design (ISCID),
Wuhan
Ma, J., & Plonka, G. (2010). The Curvelet Transform A review of recent
applications. IEEE Signal Processing Mahazine, 118-133.
Majumdar, A., & Ward, R. (2008). Multiresolution Methods in Face Recognition.
Recent Advances in Face Recognition, INTECH Open Access Publisher.
Malwade, A., Raut, R., Thakare, V. (2015). A Survey on Enhancement Technique
to Improve Accuracy in Fingerprint Matching. International Journal of
Advanced Research in Computer Science and Software Engineering, 5(4), 28-
32.
99
Mandal, T., & Wu, Q. (2008). A Small Scale Fingerprint Matching Scheme Using
Digital Curvelet Transform. Paper presented at IEEE International Conference
on Systems, Man and Cybernetics. Singapore.
Mohammed, A., Wu, Q., & Sid-Ahmed, M. (2010). Application of Wave Atoms
Decomposition and Extreme Learning Machine for Fingerprint Classification.
Springer, 6112, 246-255.
Msiza, I., Leke-Betechuoh, B., & Malumedzha, T. (2011, December 6-8).
Fingerprint Re-alignment: A Solution Based on the True Fingerprint Center
Point. Paper presented at IEEE International Conference on Machine Learning
and Computing (ICMLC 2011). Singapore.
Namburu, P. (2007). A study on fingerprint image enhancement and minutiae
extraction techniques (Unpublished PHD Dissertation). National Institute of
Technology, Rourkela.
Nasiri, A., & Fathy, M. (2015). An effective algorithm for fingerprint reference
point detection based on filed flow curves. Paper presented at IEEE
International Symposium on Artificial Intelligence and Signal Processing.
Mashhad.
Nilsson, K., & Bigun, J. (2003). Localization of corresponding points in
fingerprints by complex filtering. Pattern Recognition Letters, 24(13), 2135-
2144.
Ohtsuka, T., Watanabe, D., Tomizawa, D., & Aoki, H. (2008). Reliable Detection
of Core and Delta in Fingerprints by using Singular Candidate Method. Paper
presented at IEEE '08 Computer Society Conference on Computer Vision and
Pattern Recognition Workshops CVPRW. Anchorage, AK .
Omidyeganeh, M., Javadtalab, A., Ghaemmaghami, S., & Shirmohammadi, S.
(2012, May 13-16). Contourlet Based Distance Measurement to Improve
Fingerprint Identification Accuracy. Paper presented at IEEE International in
Instrumentation and Measurement Technology Conference (I2MTC), Graz.
Otsu, N. (1979). A Threshold Selection Method from Gray Level Histograms.
IEEE Trans. Systems, 9(1), 62–66.
Pober, M. (2010). Comparing performance of different fingerprint matchers by
using StirMark distorted images (Unpublished Master Thesis). University at
Salzburg, Austria.
Polikar, R. (2016, January 17). The Wavelet Tutorial. Retrieved Retrieved
November 12, 2015, from:
http://users.rowan.edu/~polikar/WAVELETS/WTpart1.html
Prabhakar, S. (2001). Fingerprint Classification and Matching Using a Filterbank
(Unpublished PHD Thesis). Michigan State University, USA.
Rajinikannan, M., Kumar, D., Muthuraj, R. (2010). Estimating the Impact of
Fingerprint Image Enhancement Algorithms for Better Minutia Detection.
International Journal of Computer Applications, 2(1), 36-42.
Rawat, A. (2009). A Hierarchical Fingerprint Matching Sytem (Unpublished
Mater Thesis), Indian Institute of Technology Kanpur, India.
Saeed, A., Tariq, A., & Jawaid, U. (2011, July 23-24). Automated System For
Fingerprint Image Enhancement Using Improved Segmentation and Gabor
Wavelets. Paper presented at IEEE International Conference on Information
and Communication Technologies (ICICT). Karachi.
100
Severance, C. (2015). Anil Jain: 25 Years of Biometric Recognition. IEEE
COMPUTER SOCIETY, 48(8), 8-10.
Stephen, M., Reddy, P., & Vasavi, V. (2013). Fingerprint Image Enhancement
through Particle Swarm Optimization. International Journal of Computer
Applications, 66(21), 34-40.
Goodrich, M., & Tamassia, R. (2010, October 25). Introduction to Computer
Security. Addison-Wesley Publishing Company.
Tang, T., Wu, X., Xiang, M. (2008). An Improved Fingerprint Singular Point
Detection Algorithm Based on Continuous Orientation Field. Paper presented
at IEEE '08. International Symposium on Computer Science and
Computational Technology (ISCSCT ) Shanghai.
Tang, H., Zhu, Z., Gao, Z., & Li, Y. (2014, November). A Secure Biometric-Based
Authentication Scheme Using Smart Card. Paper presented at IEEE
International Conference on Cyberspace Technology (CCT 2013), Beijing,
China.
Taniar, D. (2008). Data Mining and Knowledge Discovery Technologies. New
York: IGI PublIshIng.
Test Biometrics Ideal. (2010). Retrieved November 12, 2015, from
http://biometrics.idealtest.org
Thayammal, S., & Selvathi, D. (2012). Image Compression using Multidirectional
Anisotropic Transform: Shearlet Transform. Devices. Paper presented at IEEE
2012 International Conference on Circuits and Systems (ICDCS). Coimbatore
Tico, M., Immonen, E., Ramo, P., Kuosmanen, P., & Saarinen, J. (2001, May 6-
9). Fingerprint Recognition Using Wavelet Features. Paper presented at IEEE
International Symposium on Circuits and Systems, Sydney, NSW
Tong, Y., Wang, H., Pi, D., Zhang, Q. (2006). Fast Algorithm of Hough Transform-
Based Approaches for Fingerprint Matching. Paper presented at IEEE 6th
World Congress on Intelligent Control and Automation, Dalian.
Turroni, F. (2012). Fingerprint Recognition:Enhancement, Feature Extraction
and Automatic Evaluation of Algorithms (Unpublished PHD Thises),
University of Bologna.
Vinothkanna, R., & Wahi, A. (2014). Fuzzy Vault Fusion Based Multimodal
Biometric Human Recognition System With Fingerprint and Ear. Journal of
Theoretical and Applied Information Technology, 59(2), 304-317.
Wang, J.,& Sun, X.. (2010, July 7-9). Fingerprint Image Enhancement using a fast
Gabor filter. Paper presented at IEEE 8th World Congress on Intelligent
Control and Automation (WCICA). Jinan.
Wang, J. (2003). Data Mining: Opportunities and Challenges. United States of
America: Idea Group Publishing (an imprint of Idea Group Inc.).
Wang, W., Li, J., Huang, F., & Feng, H. (2008). Design and implementation of
Log-Gabor filter in fingerprint image enhancement. Elsevier, 29, 301–308.
Wang, Zhag, Liu, & Yu. (2011,). Fingerprint Image Enhancement Based On
Morphological Filter. Paper presented at IEEE International Conference on
Computational and Information Sciences. Chengdu, China.
Wegstein. (1982). An Automated Fingerprint Identification System.
U.S.Government Publication, U.S. Department of Commerce National Bureau
of Standards,.
101
Wu, Guha, T., & Jonathan, Q. M. (2010). Curvelet Based Feature Extraction. In
Face Recognition (pp. 35-46). InTech. Retrieved November 12, 2015, from:
http://www.intechopen.com/books/facerecognition/curvelet-based-feature-
extraction
Wu, X., & Kumar, V. (2008). Top 10 algorithms in data mining. Springer, 1-37.
Wu. (2007). Advanced feature extraction algorithms for automatic fingerprint
recognition systems (Unpublished PHD Thesis). University at Buffalo, NY.
Yang, C., & Park, D. (2008). Fingerprint Verification Based on Invariant Moment
Features and Nonlinear BPNN. International Journal of Control, Automation,
and Systems, 6(6), 800-808.
Yang, C., & Park, D. (2008). A fingerprint verification algorithm using tessellated
invariant moment features. Neurocomputing, Elsevier, 71, 1939– 1946.
Yang, J., Liu, L., Jiang, T., & Fan, Y., (2003). A modified Gabor filter design
method for fingerprint image enhancement. Pattern Recognition Letters,
Elsevier, 24, 1805–1817.
Yao, Y., Frasconi, P., & Pontil, M. (2001). Fingerprint Classification with
Combinations of Support Vector Machines. Pattern Recognition Letters, 24(12
Springer), 253–258.
Yao, Z. (2007). Directional Edge and Texture Representations for Image
Processing (Unpublished PHD Thesis) University of Warwick, United
Kingdom.
Yusharyahya, K., Nugroho, A., Purnama, J., & Galsinium, M. (2014, Augest 20-
21). A Comparison of Fingerprint Enhancement Algorithms for Poor Quality
Fingerprint Images. Paper presented at IEEE International Conference of
Advanced Informatics: Concept, Theory and Application (ICAICTA)