Embed Size (px)
Citation preview
Modern Pump Selection for
System Efficiency
By: Kyle DelPiano - Business Development Manager, Bell & Gossett
2
Be REALISTIC and Honest regarding variable
speed pumping. Actual efficiency depends on
the configuration of pump vs. load conditions
(rarely at full load) and flow conditions. These
conditions must be accounted for to determine
expected actual operating pump efficiency
and therefore actual cost savings from
variable speed pumping. You must map the
range of operating conditions to be accurate.
Our Seminar Goal!!
3
To Get Highest System Pumping Efficiency
Maximize your efficiency islands!!!
4
• Basic Pump Affinity Laws
• Pump Head Loss Calculations
• Pump Curve Review
• System Curve Review
• Pump Selection Examples
• Summary
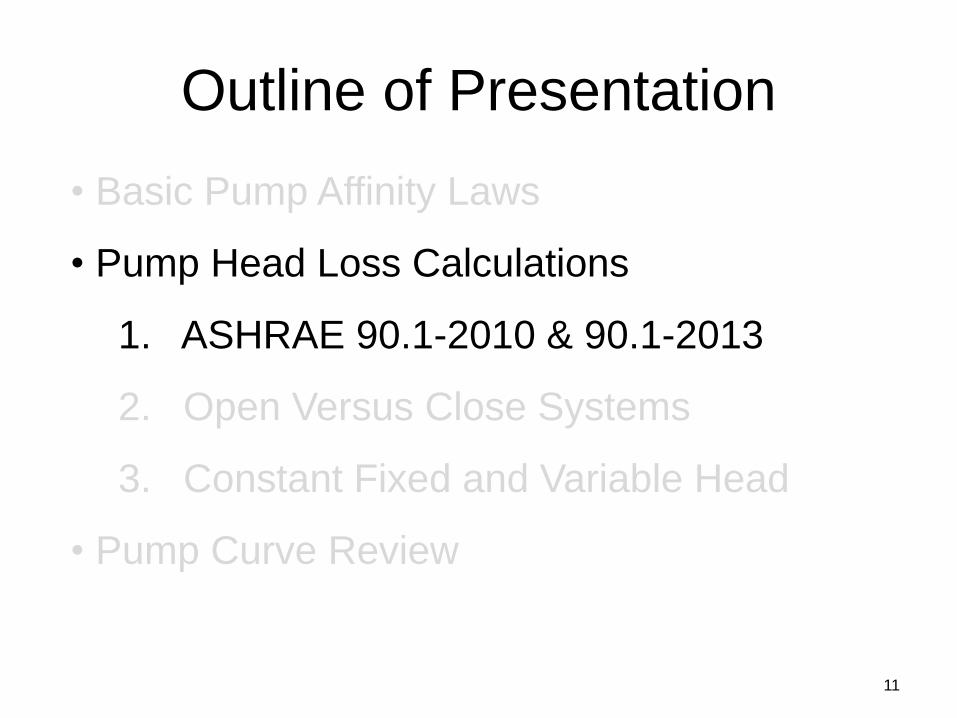
Outline of Presentation
Outline of Presentation
5
• Basic Pump Affinity Laws
• Pump Head Loss Calculations
1. ASHRAE 90.1-2010 & 90.1-2013
2. Open Versus Close Systems
3. Constant Fixed and Variable Head
• Pump Curve Review
6
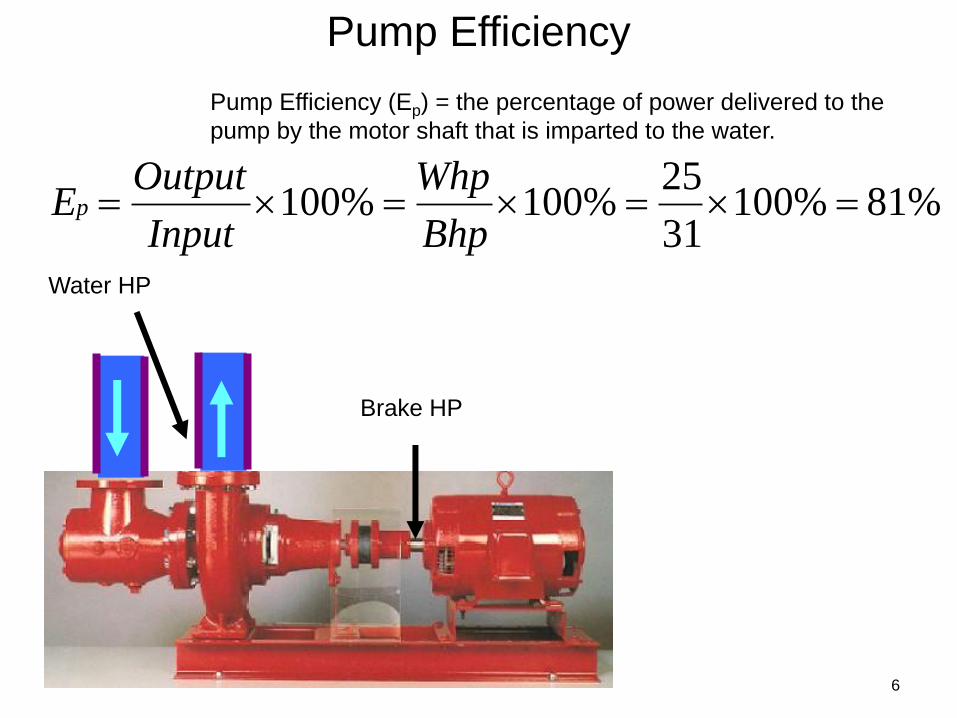
Water HP
Brake HP
Pump Efficiency
%81%10031
25%100%100
Bhp
Whp
Input
OutputEp
Pump Efficiency (Ep) = the percentage of power delivered to the
pump by the motor shaft that is imparted to the water.
7
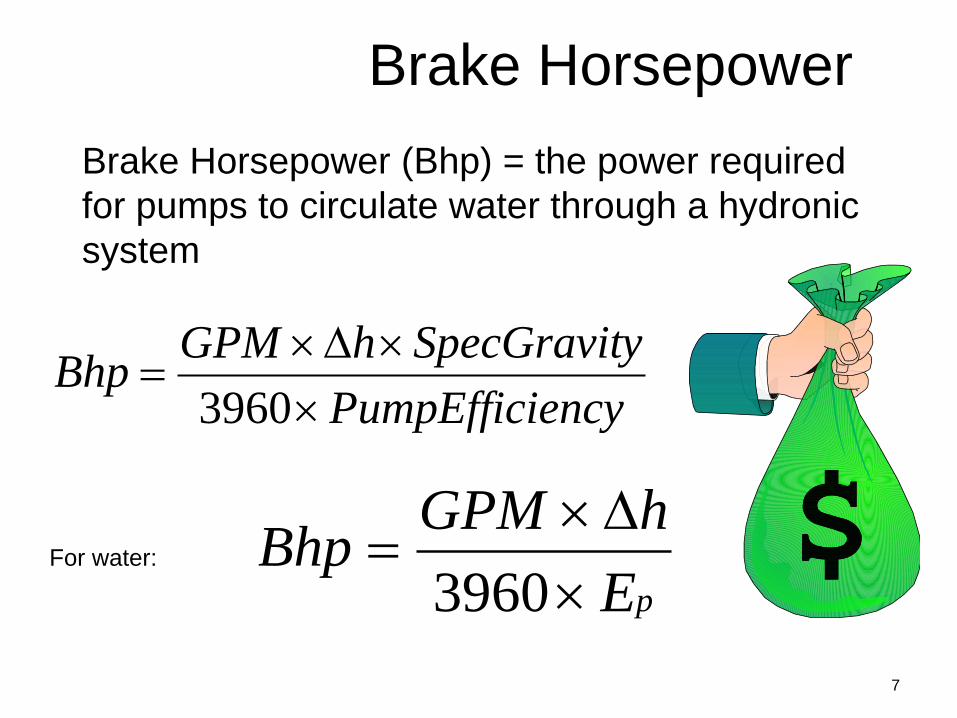
Brake Horsepower
encyPumpEffici
ySpecGravithGPMBhp
3960
Brake Horsepower (Bhp) = the power required
for pumps to circulate water through a hydronic
system
pE
hGPMBhp
3960For water:
8
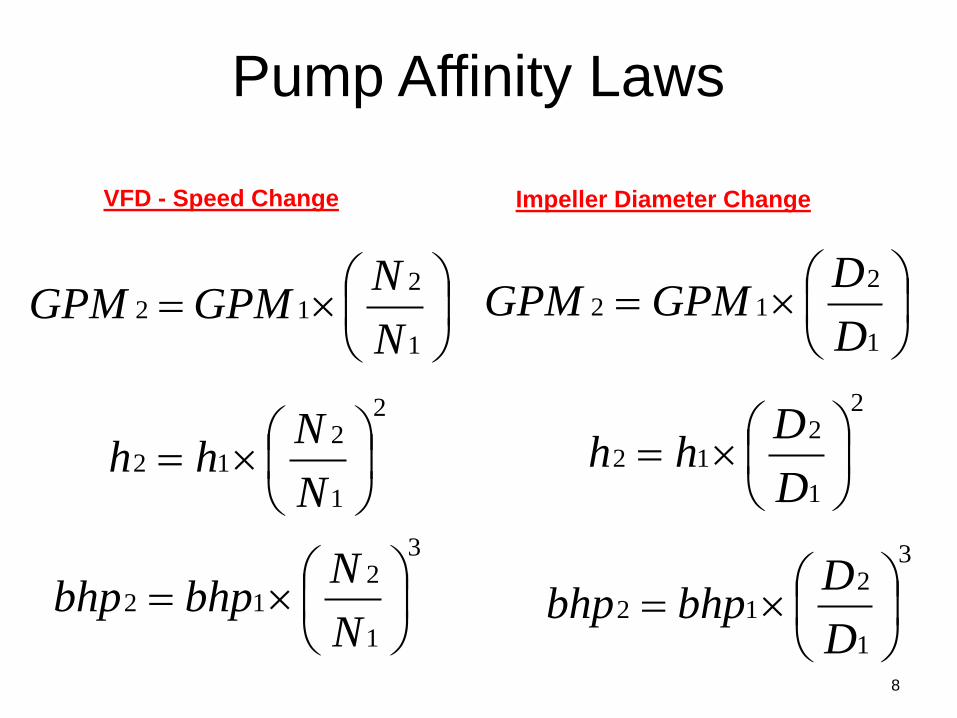
Pump Affinity Laws
1
212
N
NGPMGPM
2
1
212
N
Nhh
3
1
212
N
Nbhpbhp
VFD - Speed Change
1
212
D
DGPMGPM
2
1
212
D
Dhh
3
1
212
D
Dbhpbhp
Impeller Diameter Change
9
% H
ea
d
% B
HP
% Design Flow
120
110
100
90
80
50
40
30
20
10
70
60
120
110
100
90
80
50
40
30
20
10
70
60
0 0
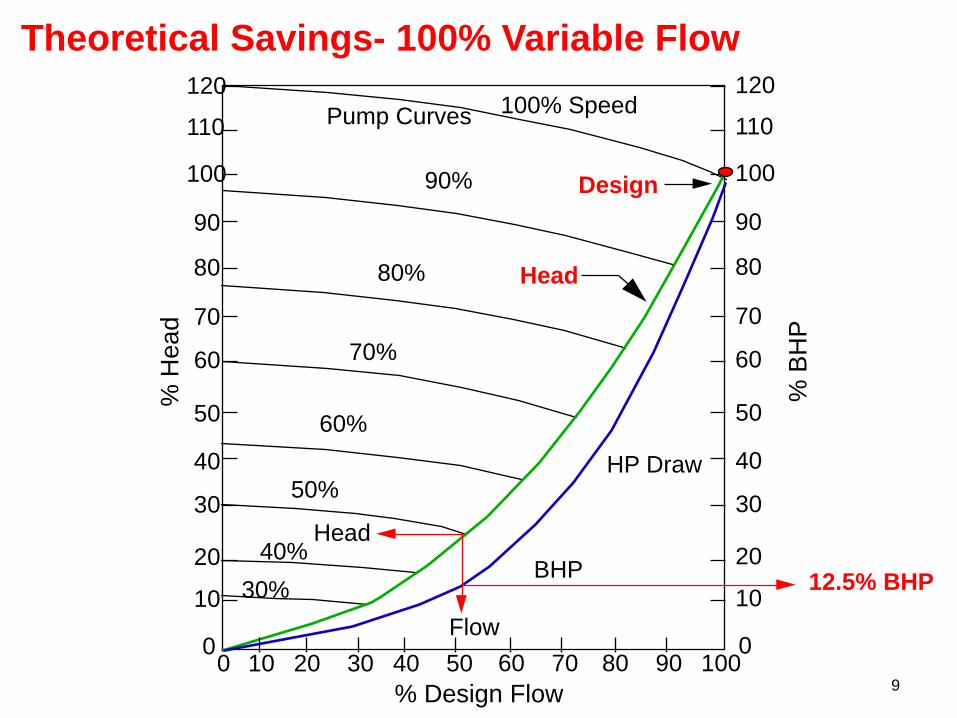
Pump Curves 100% Speed
90%
80%
70%
60%
50%
40%
30%
Head
Flow
BHP
10 20 30 40 50 60 70 80 90 100 0
HP Draw
Design
Head
Theoretical Savings- 100% Variable Flow
12.5% BHP
10
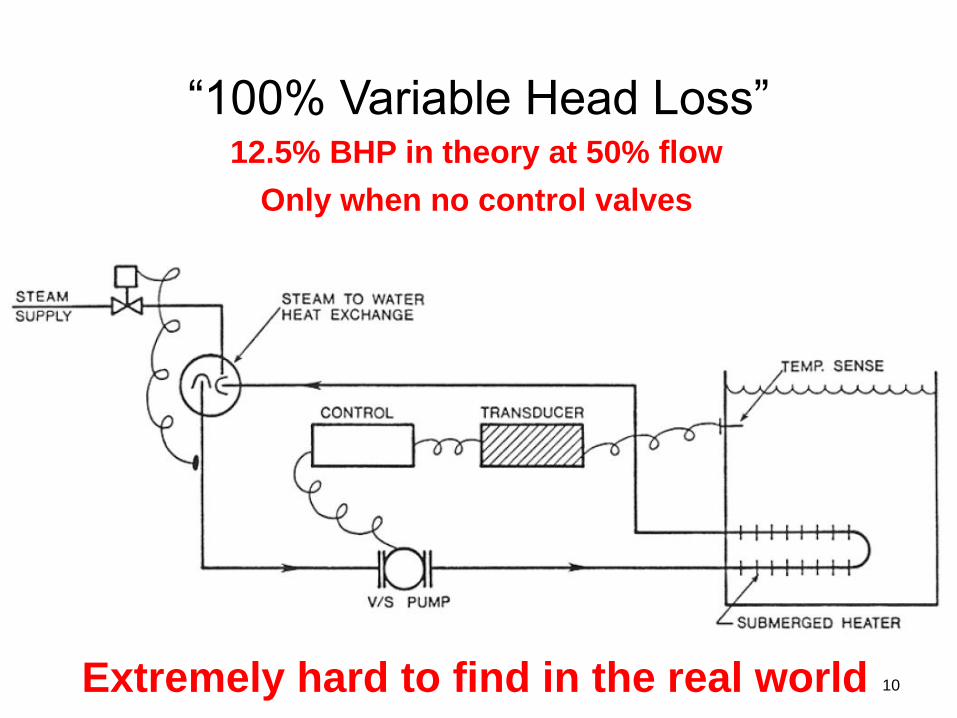
“100% Variable Head Loss” 12.5% BHP in theory at 50% flow
Extremely hard to find in the real world
Only when no control valves
Outline of Presentation
11
• Basic Pump Affinity Laws
• Pump Head Loss Calculations
1. ASHRAE 90.1-2010 & 90.1-2013
2. Open Versus Close Systems
3. Constant Fixed and Variable Head
• Pump Curve Review

12
ASHRAE STANDARD
ANSI/ASHRAE/IESNA/Standard 90.1-2010 (I-P Edition)
ASHRAE is dedicated to improve its Standards to facilitate the move to NZEBs
13
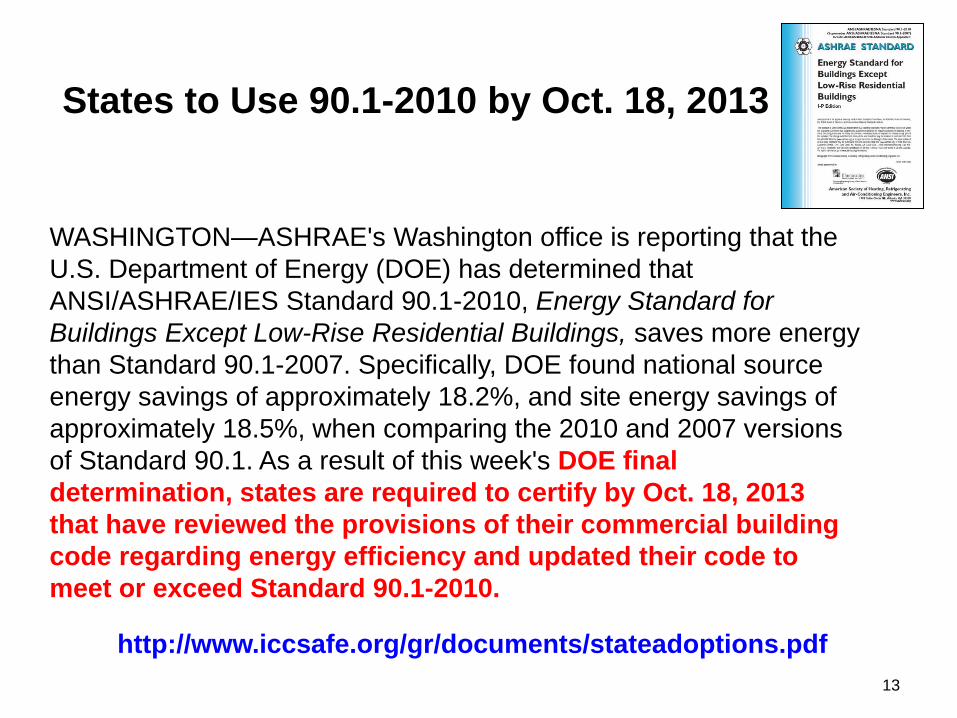
WASHINGTON—ASHRAE's Washington office is reporting that the
U.S. Department of Energy (DOE) has determined that
ANSI/ASHRAE/IES Standard 90.1-2010, Energy Standard for
Buildings Except Low-Rise Residential Buildings, saves more energy
than Standard 90.1-2007. Specifically, DOE found national source
energy savings of approximately 18.2%, and site energy savings of
approximately 18.5%, when comparing the 2010 and 2007 versions
of Standard 90.1. As a result of this week's DOE final
determination, states are required to certify by Oct. 18, 2013
that have reviewed the provisions of their commercial building
code regarding energy efficiency and updated their code to
meet or exceed Standard 90.1-2010.
States to Use 90.1-2010 by Oct. 18, 2013
http://www.iccsafe.org/gr/documents/stateadoptions.pdf
14
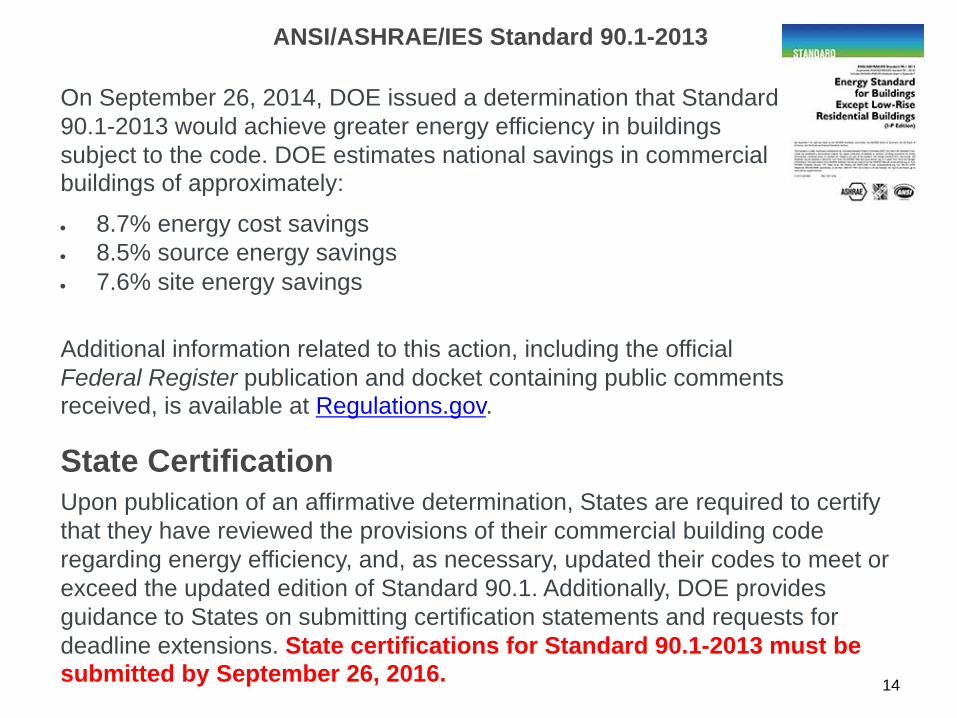
ANSI/ASHRAE/IES Standard 90.1-2013
On September 26, 2014, DOE issued a determination that Standard
90.1-2013 would achieve greater energy efficiency in buildings
subject to the code. DOE estimates national savings in commercial buildings of approximately:
8.7% energy cost savings 8.5% source energy savings 7.6% site energy savings
Additional information related to this action, including the official
Federal Register publication and docket containing public comments received, is available at Regulations.gov.
State Certification Upon publication of an affirmative determination, States are required to certify
that they have reviewed the provisions of their commercial building code
regarding energy efficiency, and, as necessary, updated their codes to meet or
exceed the updated edition of Standard 90.1. Additionally, DOE provides
guidance to States on submitting certification statements and requests for
deadline extensions. State certifications for Standard 90.1-2013 must be submitted by September 26, 2016.
15
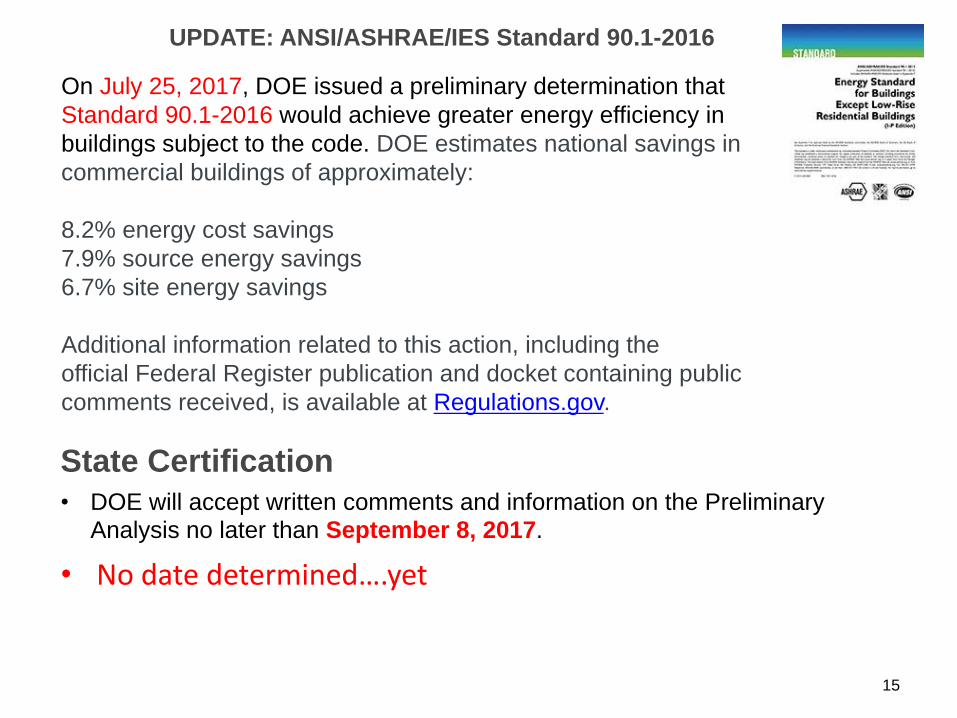
UPDATE: ANSI/ASHRAE/IES Standard 90.1-2016
On July 25, 2017, DOE issued a preliminary determination that
Standard 90.1-2016 would achieve greater energy efficiency in
buildings subject to the code. DOE estimates national savings in
commercial buildings of approximately:
8.2% energy cost savings
7.9% source energy savings
6.7% site energy savings
Additional information related to this action, including the
official Federal Register publication and docket containing public
comments received, is available at Regulations.gov.
State Certification • DOE will accept written comments and information on the Preliminary
Analysis no later than September 8, 2017.
• No date determined….yet

Current ASHRAE 90.1 Code Adoptions

Current ASHRAE 90.1 Code Adoptions
18
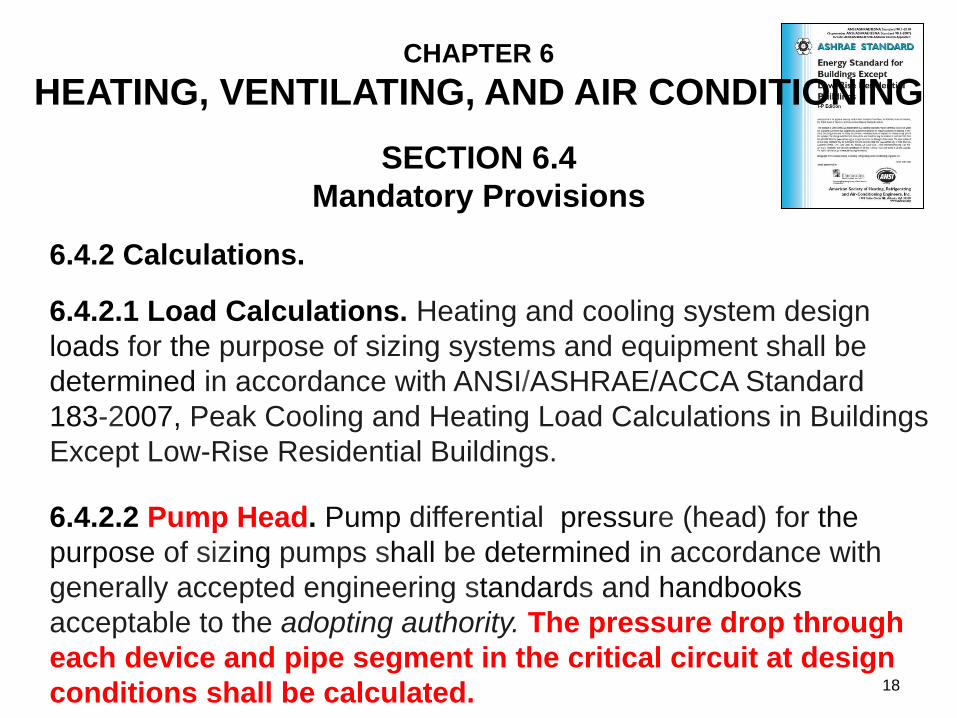
CHAPTER 6
HEATING, VENTILATING, AND AIR CONDITIONING
6.4.2.1 Load Calculations. Heating and cooling system design
loads for the purpose of sizing systems and equipment shall be
determined in accordance with ANSI/ASHRAE/ACCA Standard
183-2007, Peak Cooling and Heating Load Calculations in Buildings
Except Low-Rise Residential Buildings.
SECTION 6.4
Mandatory Provisions
6.4.2.2 Pump Head. Pump differential pressure (head) for the
purpose of sizing pumps shall be determined in accordance with
generally accepted engineering standards and handbooks
acceptable to the adopting authority. The pressure drop through
each device and pipe segment in the critical circuit at design
conditions shall be calculated.
6.4.2 Calculations.

19
Calculator
iPad & iPhone Versions
Android Version
• Available free from iTunes App Store
• All the calculators from the plastic
wheel PLUS
• Greater range of pipe sizes
• Addition of PVC Pipe
• Includes English & Metric Units
• Handles fluids other than water
• Incorporates Circuit Setter wheel
22
CHAPTER 6
HEATING, VENTILATING, AND AIR CONDITIONING
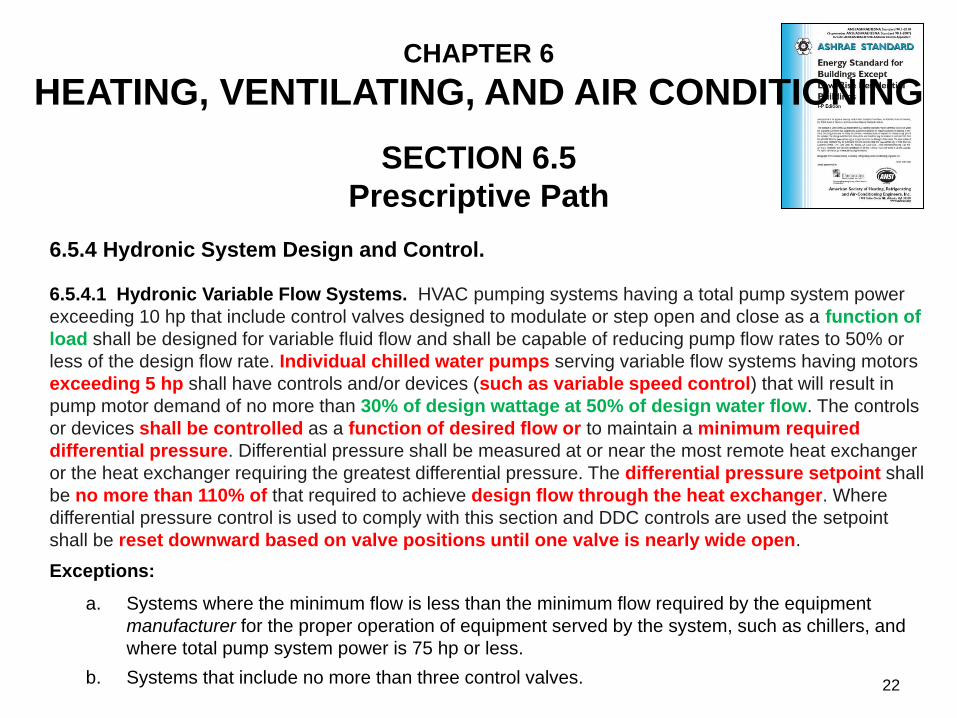
6.5.4.1 Hydronic Variable Flow Systems. HVAC pumping systems having a total pump system power
exceeding 10 hp that include control valves designed to modulate or step open and close as a function of
load shall be designed for variable fluid flow and shall be capable of reducing pump flow rates to 50% or
less of the design flow rate. Individual chilled water pumps serving variable flow systems having motors
exceeding 5 hp shall have controls and/or devices (such as variable speed control) that will result in
pump motor demand of no more than 30% of design wattage at 50% of design water flow. The controls
or devices shall be controlled as a function of desired flow or to maintain a minimum required
differential pressure. Differential pressure shall be measured at or near the most remote heat exchanger
or the heat exchanger requiring the greatest differential pressure. The differential pressure setpoint shall
be no more than 110% of that required to achieve design flow through the heat exchanger. Where
differential pressure control is used to comply with this section and DDC controls are used the setpoint
shall be reset downward based on valve positions until one valve is nearly wide open.
SECTION 6.5
Prescriptive Path
Exceptions:
Systems where the minimum flow is less than the minimum flow required by the equipment
manufacturer for the proper operation of equipment served by the system, such as chillers, and
where total pump system power is 75 hp or less.
a.
Systems that include no more than three control valves. b.
6.5.4 Hydronic System Design and Control.

ARI 550/590 Standard
IPLV Load Profile
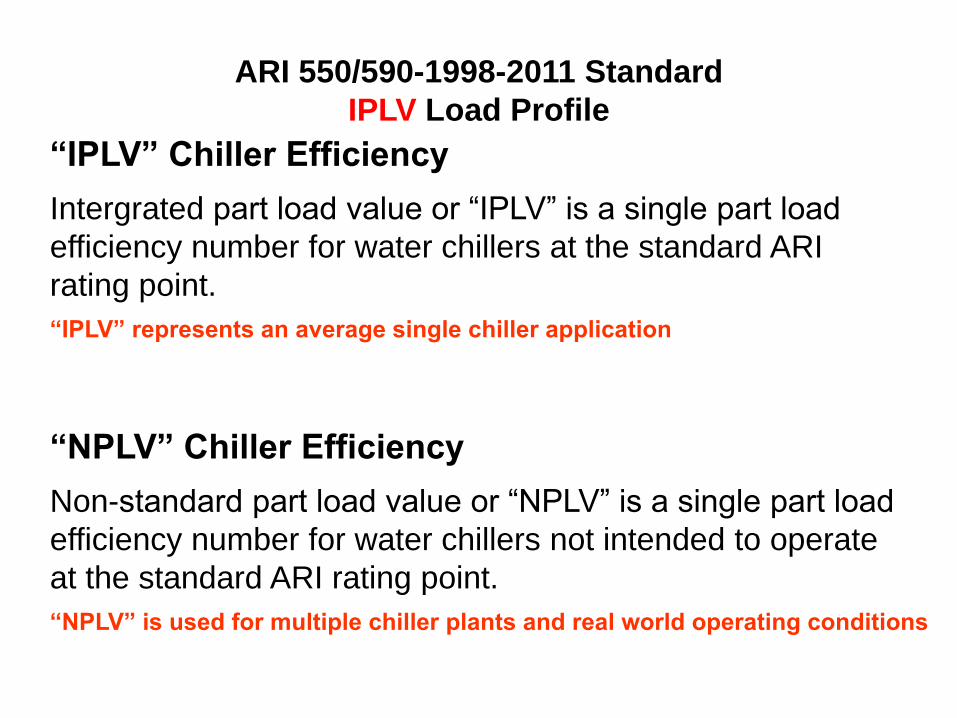
ARI 550/590-1998-2011 Standard
IPLV Load Profile
Intergrated part load value or “IPLV” is a single part load
efficiency number for water chillers at the standard ARI
rating point.
“IPLV” Chiller Efficiency
Non-standard part load value or “NPLV” is a single part load
efficiency number for water chillers not intended to operate
at the standard ARI rating point.
“NPLV” Chiller Efficiency
“IPLV” represents an average single chiller application
“NPLV” is used for multiple chiller plants and real world operating conditions
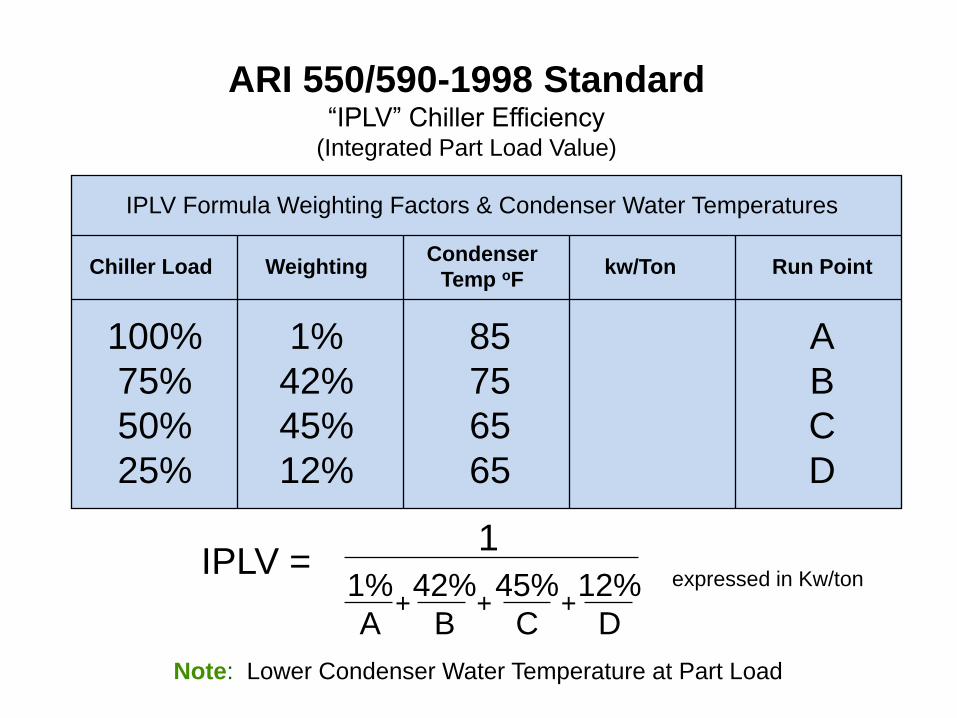
ARI 550/590-1998 Standard “IPLV” Chiller Efficiency
(Integrated Part Load Value)
Note: Lower Condenser Water Temperature at Part Load
IPLV Formula Weighting Factors & Condenser Water Temperatures
Chiller Load Weighting Condenser
Temp oF kw/Ton Run Point
100%
75%
50%
25%
1%
42%
45%
12%
85
75
65
65
A
B
C
D
1 IPLV =
1%
A
42%
B
45%
C
12%
D
expressed in Kw/ton
+ + +
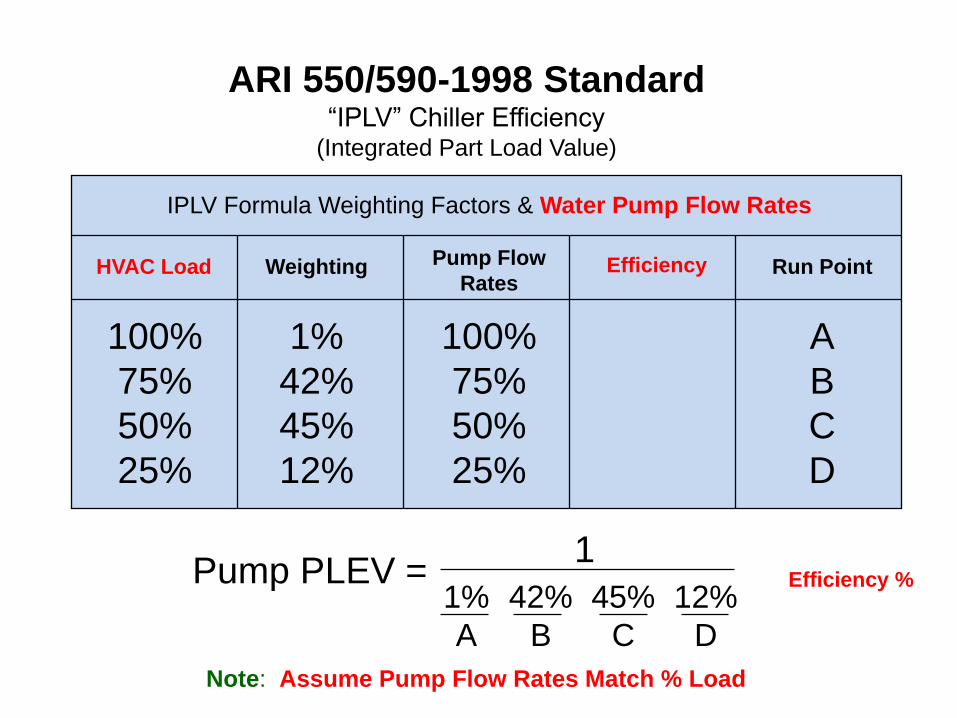
ARI 550/590-1998 Standard “IPLV” Chiller Efficiency
(Integrated Part Load Value)
IPLV Formula Weighting Factors & Water Pump Flow Rates
HVAC Load Weighting Pump Flow
Rates Run Point
100%
75%
50%
25%
1%
42%
45%
12%
A
B
C
D
Efficiency
Note: Assume Pump Flow Rates Match % Load
1 Pump PLEV =
1%
A
42%
B
45%
C
12%
D
Efficiency %
100%
75%
50%
25%
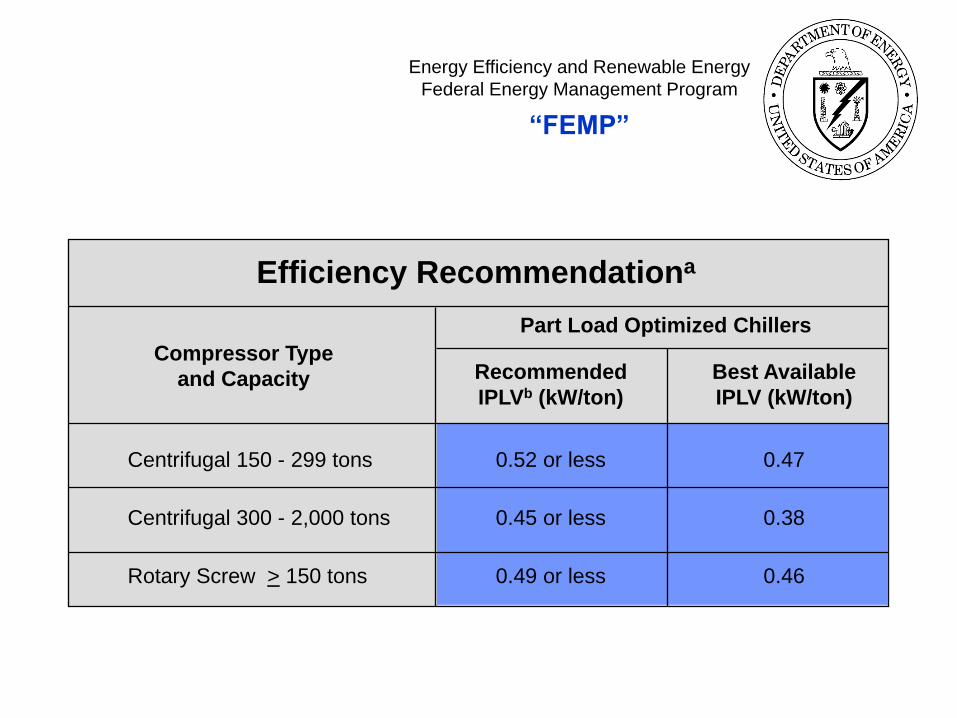
“FEMP”
Energy Efficiency and Renewable Energy
Federal Energy Management Program
Efficiency Recommendationa
Compressor Type
and Capacity
Centrifugal 150 - 299 tons
Centrifugal 300 - 2,000 tons
Rotary Screw > 150 tons
Part Load Optimized Chillers
Recommended
IPLVb (kW/ton)
Best Available
IPLV (kW/ton)
0.52 or less
0.45 or less
0.49 or less
0.47
0.38
0.46
Outline of Presentation
28
• Basic Pump Affinity Laws
• Pump Head Loss Calculations
1. ASHRAE 90.1-2010 & 90.1-2013
2. Constant Fixed and Variable Head
• Pump Curve Review
Outline of Presentation
29
• Basic Pump Affinity Laws
• Pump Head Loss Calculations
1. ASHRAE 90.1-2010 & 90.1-2013
2. Open Versus Close Systems
3. Constant Fixed and Variable Head
• Pump Curve Review
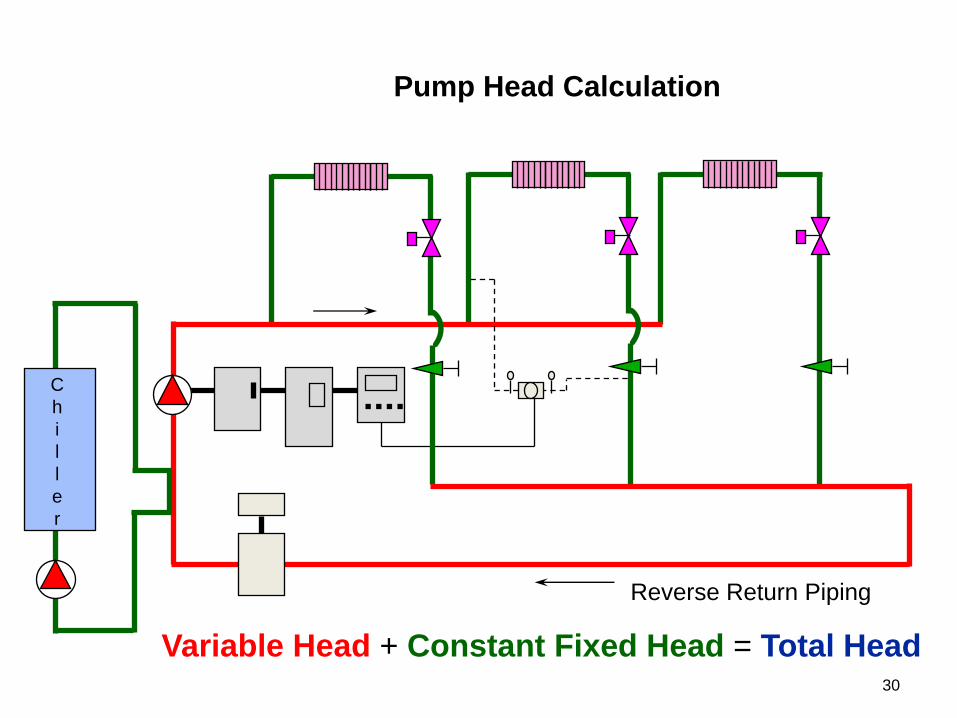
30
C
h
i
l
l
e
r
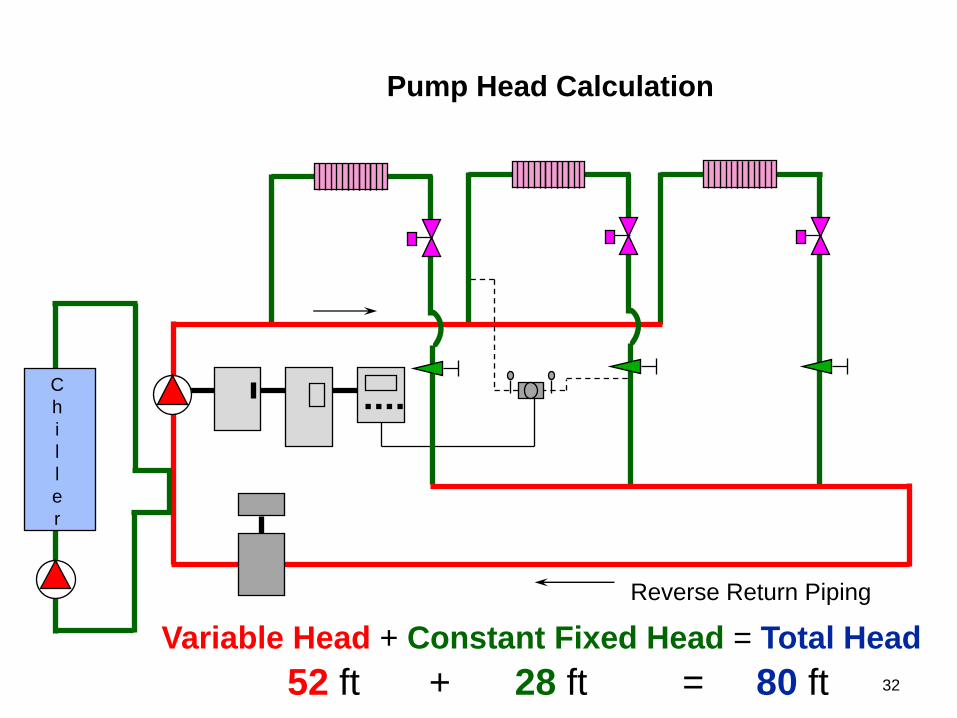
Variable Head + Constant Fixed Head = Total Head
Reverse Return Piping
Pump Head Calculation
31
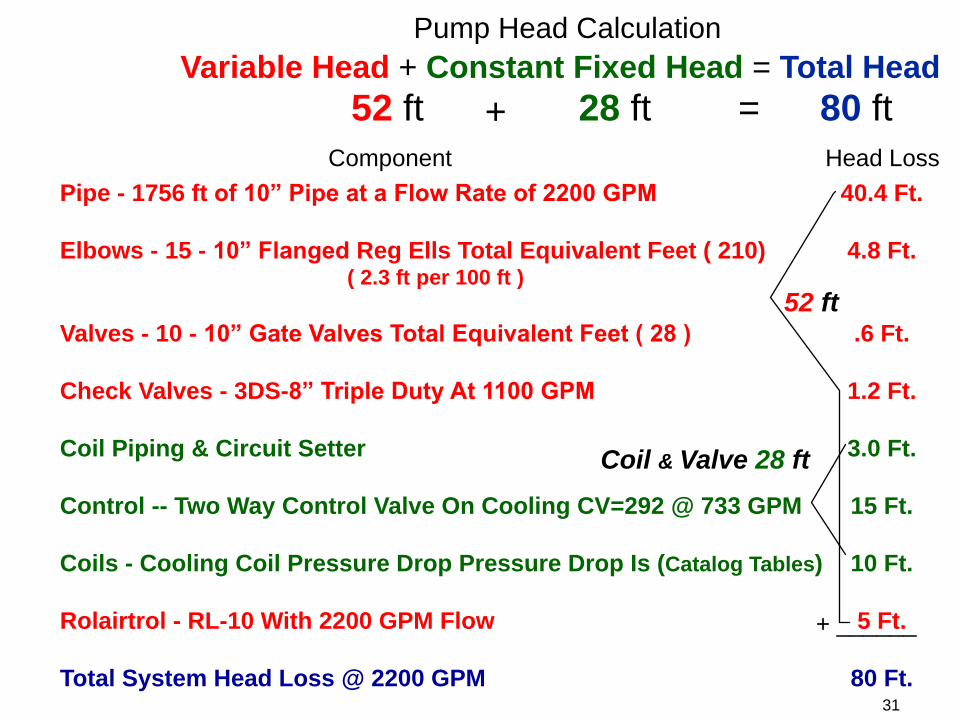
Pump Head Calculation
Component Head Loss
Pipe - 1756 ft of 10” Pipe at a Flow Rate of 2200 GPM
Elbows - 15 - 10” Flanged Reg Ells Total Equivalent Feet ( 210) ( 2.3 ft per 100 ft )
Valves - 10 - 10” Gate Valves Total Equivalent Feet ( 28 )
Check Valves - 3DS-8” Triple Duty At 1100 GPM
Coil Piping & Circuit Setter
Control -- Two Way Control Valve On Cooling CV=292 @ 733 GPM
Coils - Cooling Coil Pressure Drop Pressure Drop Is (Catalog Tables)
Rolairtrol - RL-10 With 2200 GPM Flow
Total System Head Loss @ 2200 GPM
40.4 Ft.
4.8 Ft.
.6 Ft.
1.2 Ft.
3.0 Ft.
15 Ft.
10 Ft.
5 Ft.
80 Ft.
+ ______
Variable Head + Constant Fixed Head = Total Head
52 ft 80 ft 28 ft + =
52 ft
Coil & Valve 28 ft
32
C
h
i
l
l
e
r
Variable Head + Constant Fixed Head = Total Head
52 ft 80 ft 28 ft + =
Reverse Return Piping
Pump Head Calculation
33
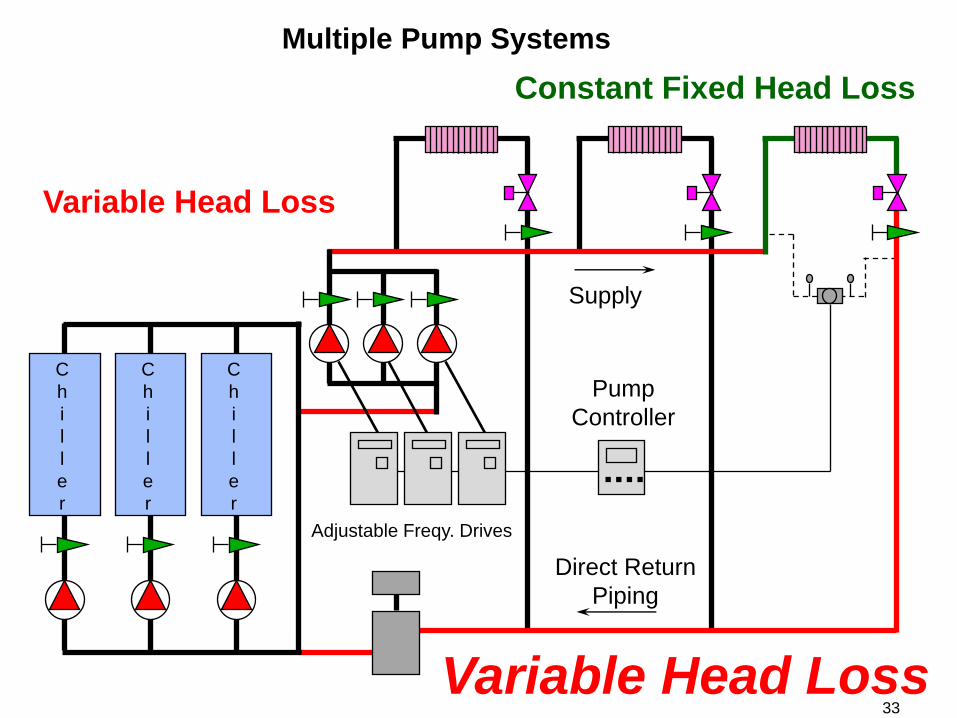
Direct Return
Piping
C
h
i
l
l
e
r
C
h
i
l
l
e
r
C
h
i
l
l
e
r
Supply
Variable Head Loss
Constant Fixed Head Loss
Variable Head Loss
Pump
Controller
Adjustable Freqy. Drives
Multiple Pump Systems
34 34
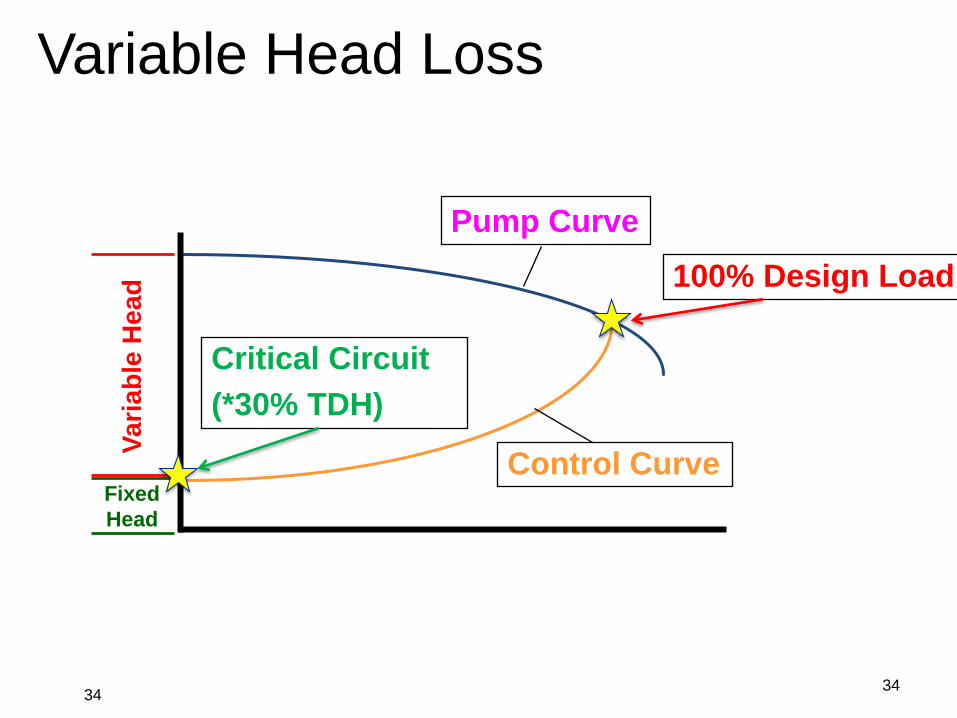
Variable Head Loss
Pump Curve
Control Curve
Vari
ab
le H
ead
Fixed
Head
100% Design Load
Critical Circuit
(*30% TDH)
35
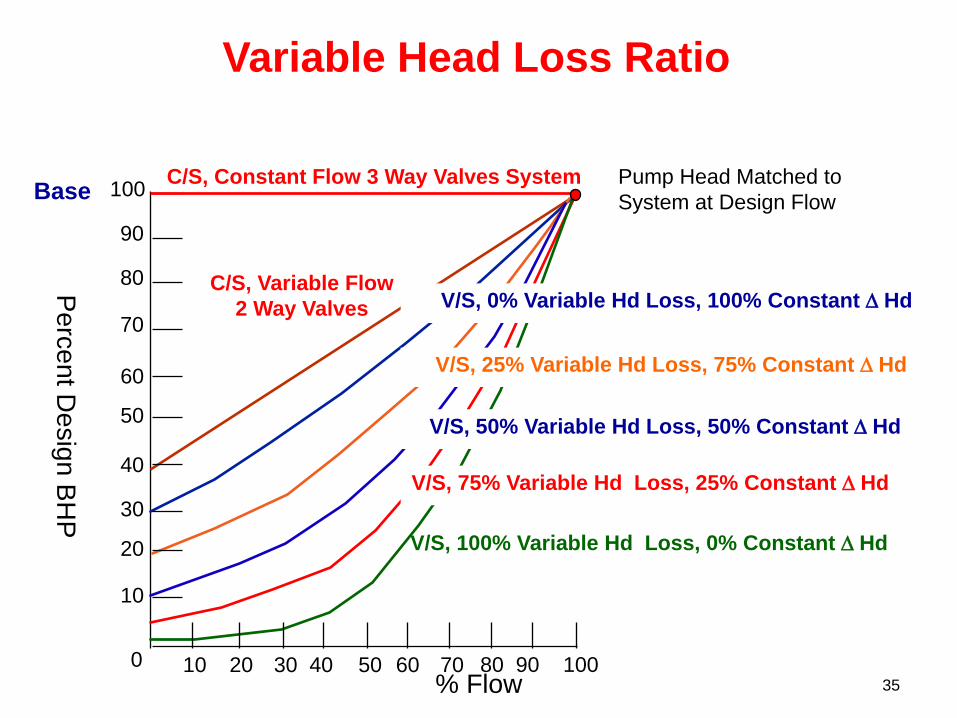
Variable Head Loss Ratio
Perc
ent D
esig
n B
HP
% Flow
90
80
70
60
50
40
30
20
10
0 10 100 90 80 70 60 50 40 30 20
100 C/S, Constant Flow 3 Way Valves System Pump Head Matched to
System at Design Flow
C/S, Variable Flow
2 Way Valves V/S, 0% Variable Hd Loss, 100% Constant Hd
V/S, 25% Variable Hd Loss, 75% Constant Hd
V/S, 50% Variable Hd Loss, 50% Constant Hd
V/S, 75% Variable Hd Loss, 25% Constant Hd
V/S, 100% Variable Hd Loss, 0% Constant Hd
Base
Outline of Presentation
36
• Basic Pump Affinity Laws
• Pump Head Loss Calculations
1. ASHRAE 90.1-2010 & 90.1-2013
2. Open Versus Close Systems
3. Constant Fixed and Variable Head
• Pump Curve Review
37
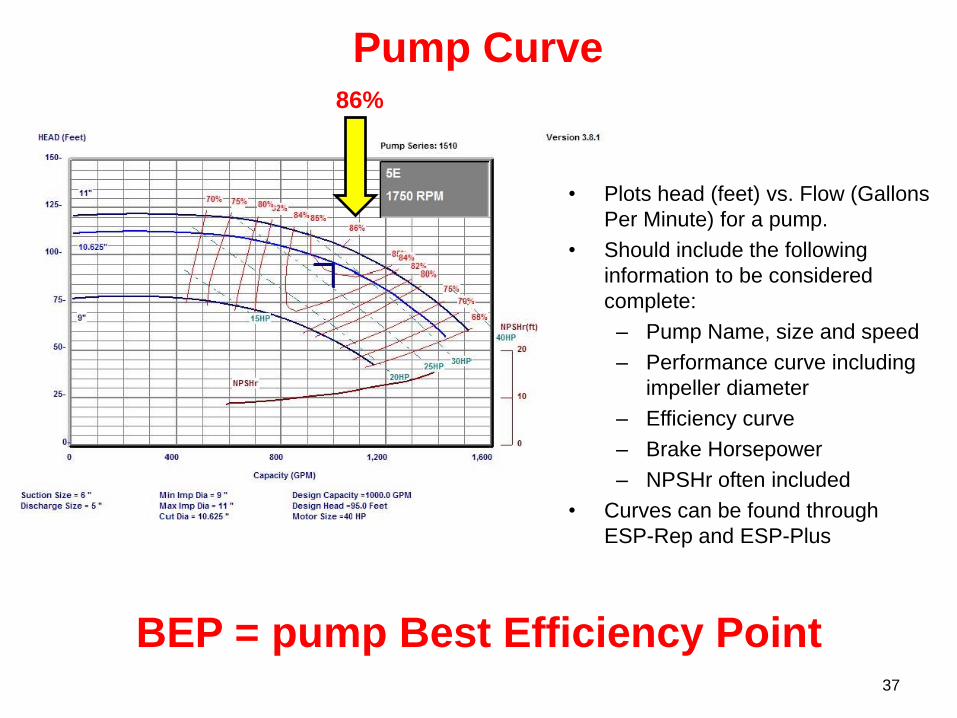
Pump Curve
• Plots head (feet) vs. Flow (Gallons
Per Minute) for a pump.
• Should include the following
information to be considered
complete:
– Pump Name, size and speed
– Performance curve including
impeller diameter
– Efficiency curve
– Brake Horsepower
– NPSHr often included
• Curves can be found through
ESP-Rep and ESP-Plus
BEP = pump Best Efficiency Point
86%
38
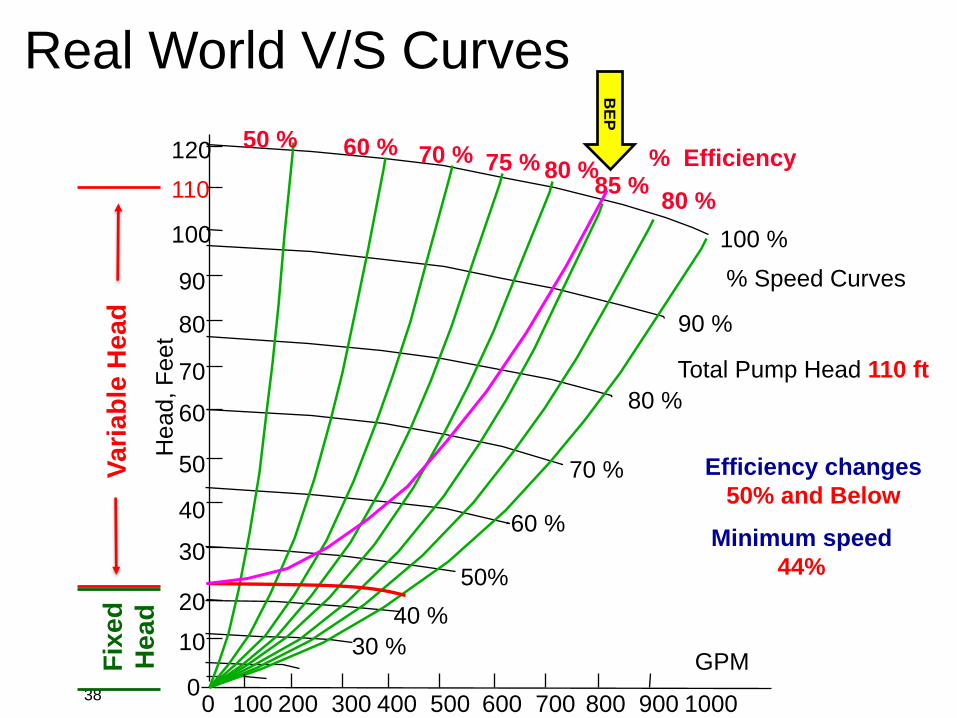
Efficiency changes
50% and Below
120
110
100
90
80
50
40
30
20
10
70
60
0 100 200 300 400 500 600 700 800 900 1000 0
100 %
90 %
80 %
70 %
60 %
50%
40 %
30 %
80 %
80 % 75 % 70 % 60 % 50 %
85 %
% Speed Curves
% Efficiency H
ead
, F
eet
GPM
Minimum speed
44%
Real World V/S Curves
BE
P
Vari
ab
le H
ead
F
ixed
Head
Total Pump Head 110 ft
40
What happens to minimum
pump speed as you increase
minimum control head or
differential pressure set point?
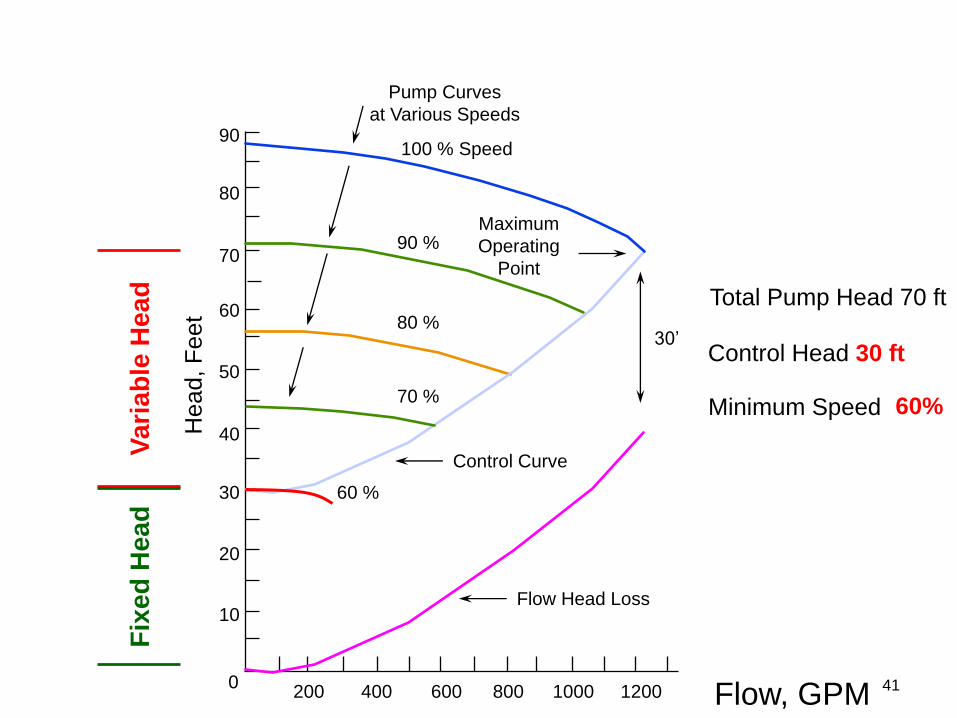
41 Flow, GPM
Flow Head Loss
Control Curve
Maximum
Operating
Point
Pump Curves
at Various Speeds 90
80
70
60
50
40
30
20
10
0
100 % Speed
90 %
80 %
70 %
30’
200 400 600 800 1000 1200
Total Pump Head 70 ft
Control Head 30 ft
Minimum Speed 60%
Head
, F
eet
Vari
ab
le H
ead
F
ixed
Head
60 %
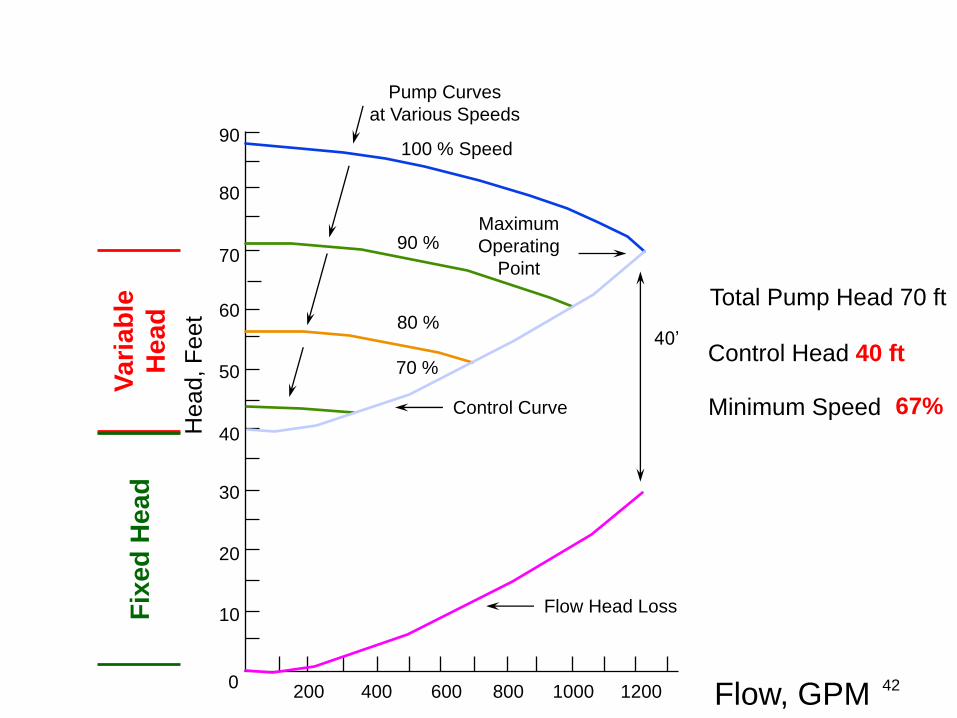
42 Flow, GPM
Flow Head Loss
Control Curve
Maximum
Operating
Point
Total Pump Head 70 ft
Pump Curves
at Various Speeds 90
80
70
60
50
40
30
20
10
0
100 % Speed
90 %
80 %
70 %
40’
200 400 600 800 1000 1200
Control Head 40 ft
Minimum Speed 67%
Head
, F
eet
Vari
ab
le
Head
F
ixed
Head
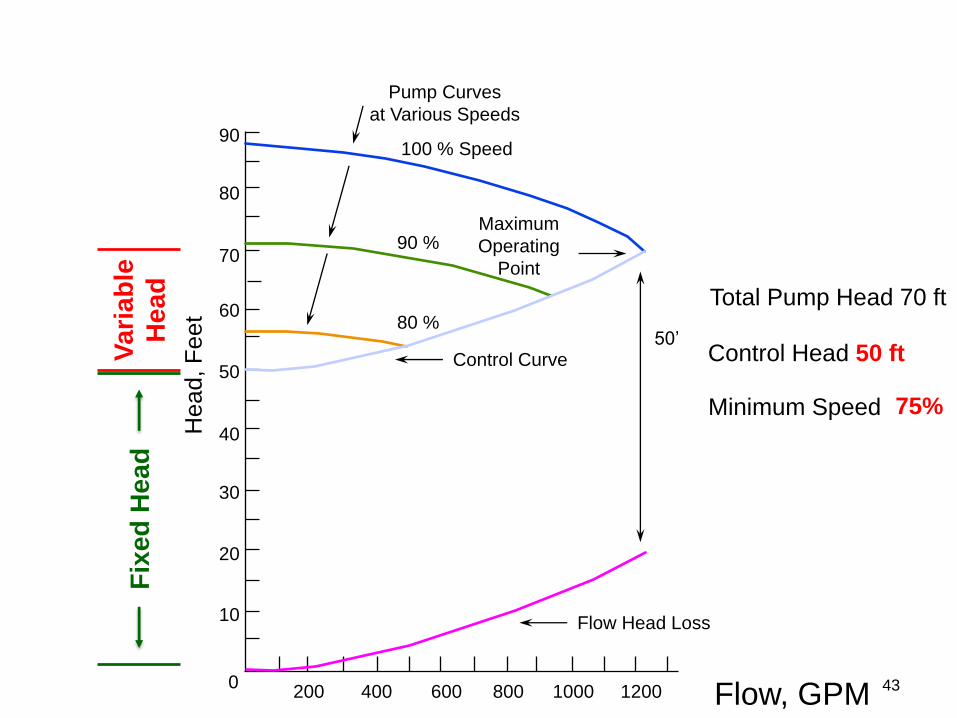
43 Flow, GPM
Flow Head Loss
Control Curve
Maximum
Operating
Point
Total Pump Head 70 ft
Pump Curves
at Various Speeds 90
80
70
60
50
40
30
20
10
0
100 % Speed
90 %
80 % 50’
200 400 600 800 1000 1200
Control Head 50 ft
Minimum Speed 75%
Head
, F
eet
Vari
ab
le
Head
F
ixed
Head
44 Flow, GPM
Flow Head Loss
Control Curve
Maximum
Operating
Point
Total Pump Head 70 ft
Pump Curves
at Various Speeds 90
80
70
60
50
40
30
20
10
0
100 % Speed
90 %
60’
200 400 600 800 1000 1200
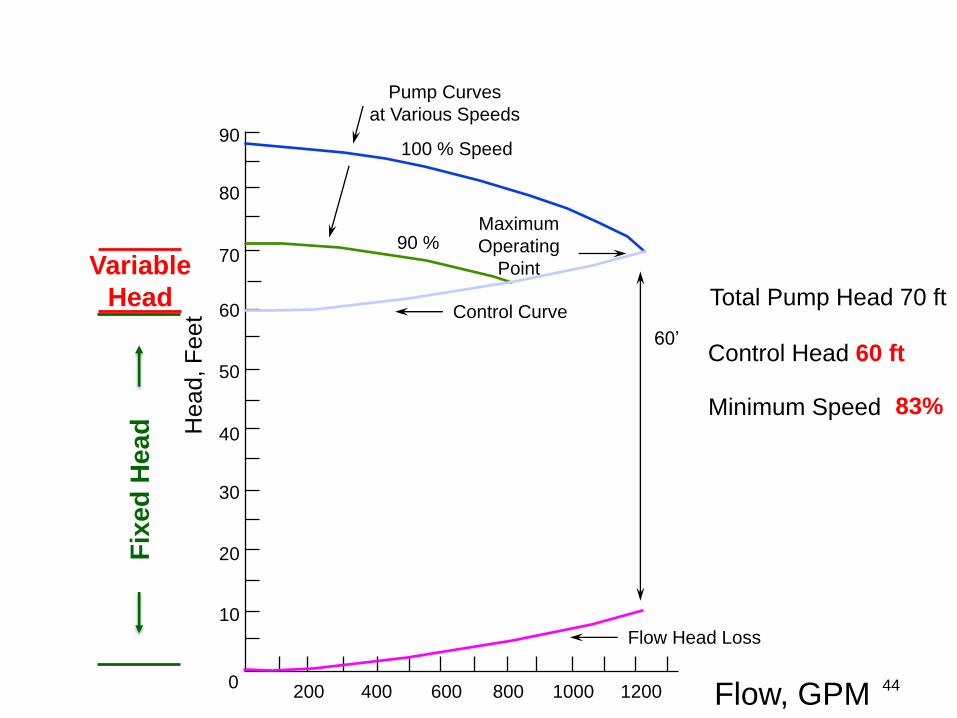
Control Head 60 ft
Minimum Speed 83%
Head
, F
eet
Variable
Head
Fix
ed
Head
45 Flow, GPM Flow Head Loss
Control Curve
Maximum
Operating
Point
Total Pump Head 70 ft
Pump Curves
at Various Speeds 90
80
70
60
50
40
30
20
10
0
100 % Speed
90 %
70’
200 400 600 800 1000 1200
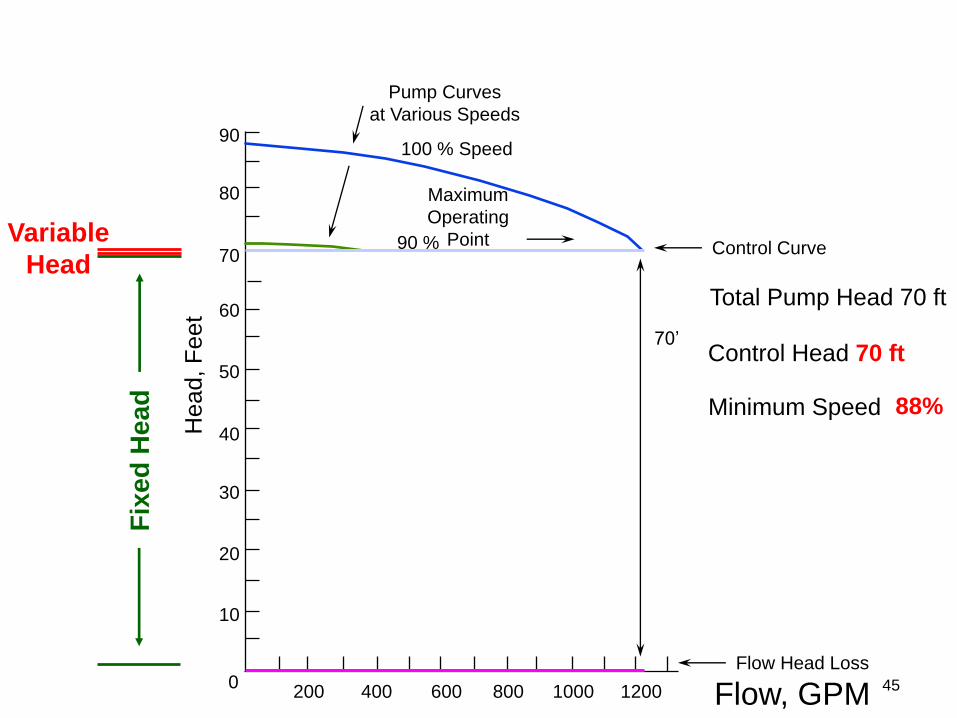
Control Head 70 ft
Minimum Speed 88%
Head
, F
eet
Variable
Head
Fix
ed
Head
46
What happens to BEP pump
efficiency (at 50% flow) as you
increase minimum control
head or differential pressure
set point?
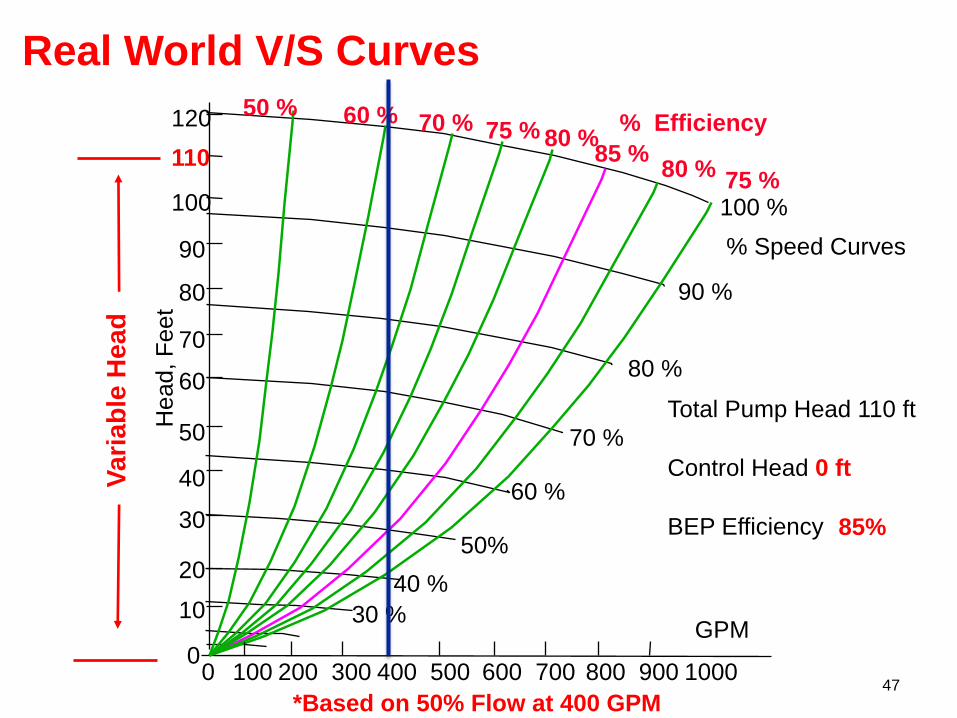
47
120
110
100
90
80
50
40
30
20
10
70
60
0 100 200 300 400 500 600 700 800 900 1000 0
100 %
90 %
80 %
70 %
60 %
50%
40 %
30 %
80 %
80 % 75 % 70 % 60 % 50 %
85 %
% Speed Curves
% Efficiency
GPM
Control Head 0 ft
BEP Efficiency
*Based on 50% Flow at 400 GPM
Total Pump Head 110 ft
85%
75 %
Real World V/S Curves
Head
, F
eet
Vari
ab
le H
ead
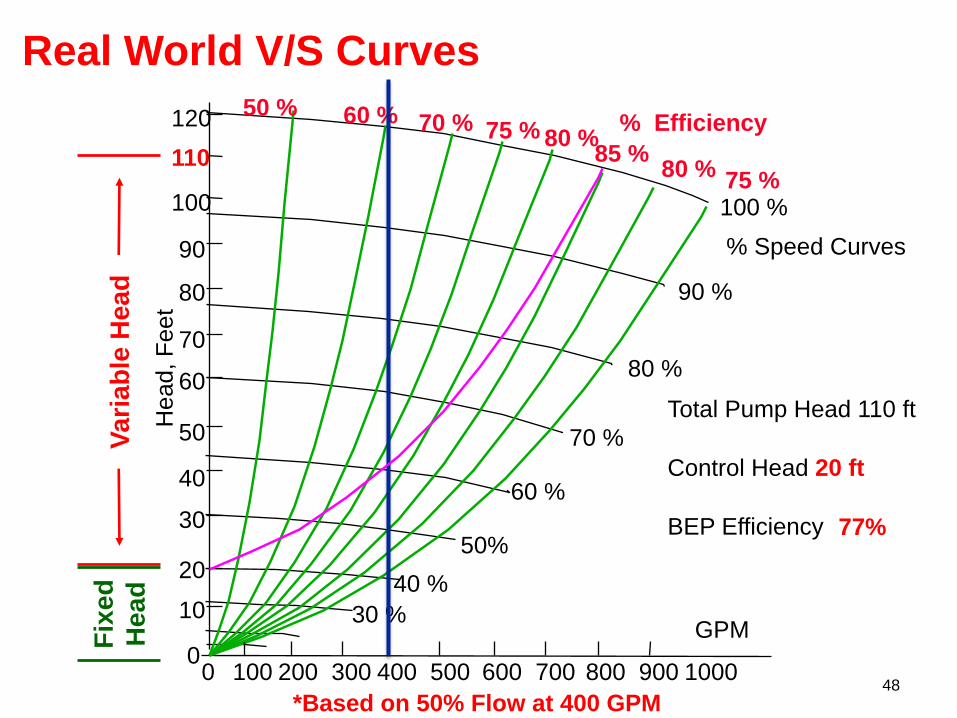
48
120
110
100
90
80
50
40
30
20
10
70
60
0 100 200 300 400 500 600 700 800 900 1000 0
100 %
90 %
80 %
70 %
60 %
50%
40 %
30 %
80 %
80 % 75 % 70 % 60 % 50 %
85 %
% Speed Curves
% Efficiency
GPM
BEP Efficiency
*Based on 50% Flow at 400 GPM
Total Pump Head 110 ft
Control Head 20 ft
77%
75 %
Real World V/S Curves
Head
, F
eet
Vari
ab
le H
ead
F
ixed
Head
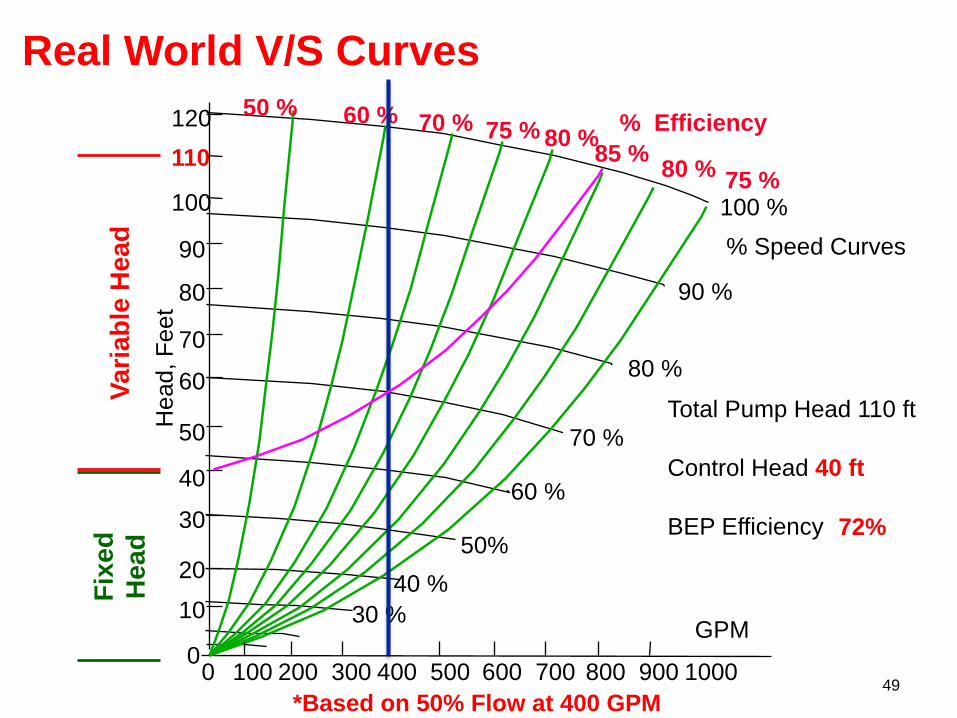
49
120
110
100
90
80
50
40
30
20
10
70
60
0 100 200 300 400 500 600 700 800 900 1000 0
100 %
90 %
80 %
70 %
60 %
50%
40 %
30 %
80 %
80 % 75 % 70 % 60 % 50 %
85 %
% Speed Curves
% Efficiency
GPM
BEP Efficiency
*Based on 50% Flow at 400 GPM
Total Pump Head 110 ft
Control Head 40 ft
72%
75 %
Real World V/S Curves
Head
, F
eet
Vari
ab
le H
ead
F
ixed
Head
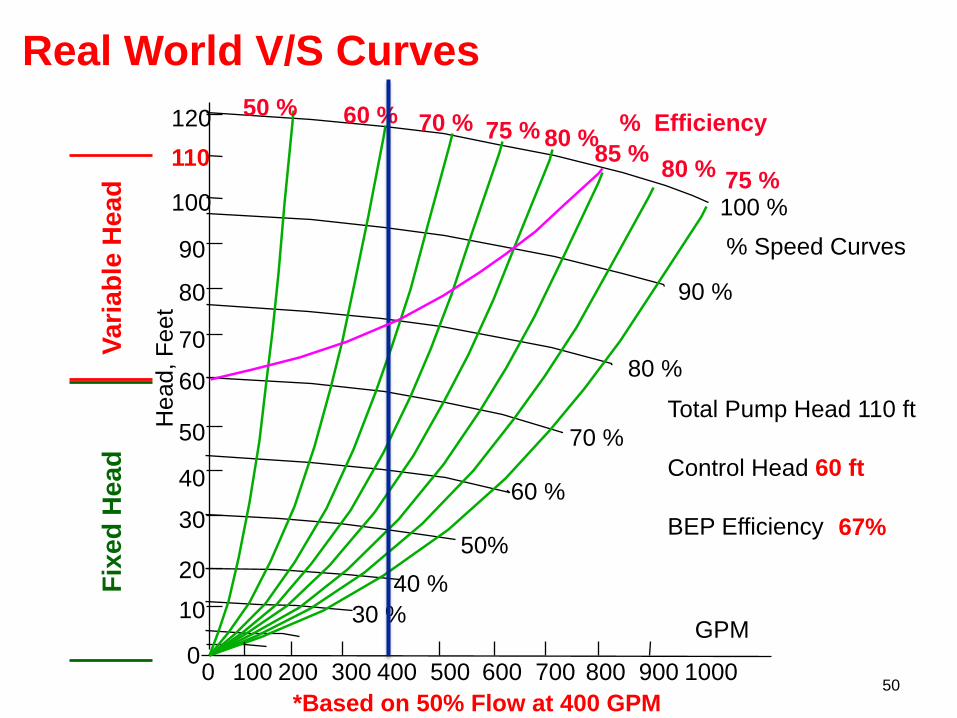
50
120
110
100
90
80
50
40
30
20
10
70
60
0 100 200 300 400 500 600 700 800 900 1000 0
100 %
90 %
80 %
70 %
60 %
50%
40 %
30 %
80 %
80 % 75 % 70 % 60 % 50 %
85 %
% Speed Curves
% Efficiency
GPM
BEP Efficiency
*Based on 50% Flow at 400 GPM
Total Pump Head 110 ft
Control Head 60 ft
67%
75 %
Real World V/S Curves
Head
, F
eet
Vari
ab
le H
ead
F
ixed
Head
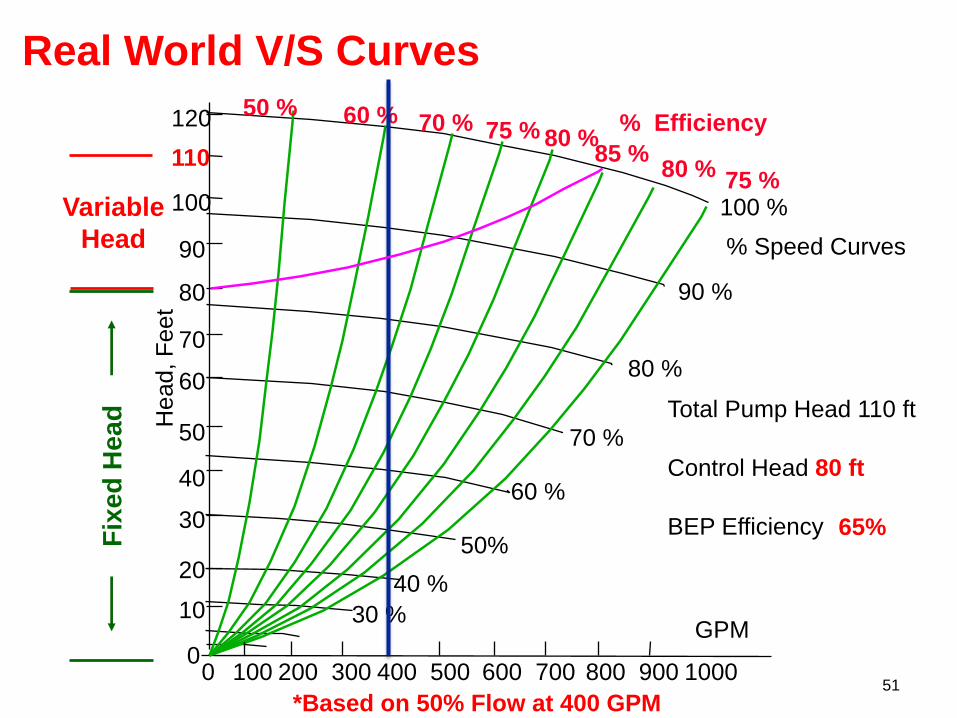
51
120
110
100
90
80
50
40
30
20
10
70
60
0 100 200 300 400 500 600 700 800 900 1000 0
100 %
90 %
80 %
70 %
60 %
50%
40 %
30 %
80 %
80 % 75 % 70 % 60 % 50 %
85 %
% Speed Curves
% Efficiency
GPM
BEP Efficiency
*Based on 50% Flow at 400 GPM
Total Pump Head 110 ft
Control Head 80 ft
65%
75 %
Real World V/S Curves
Head
, F
eet
Variable
Head
Fix
ed
Head
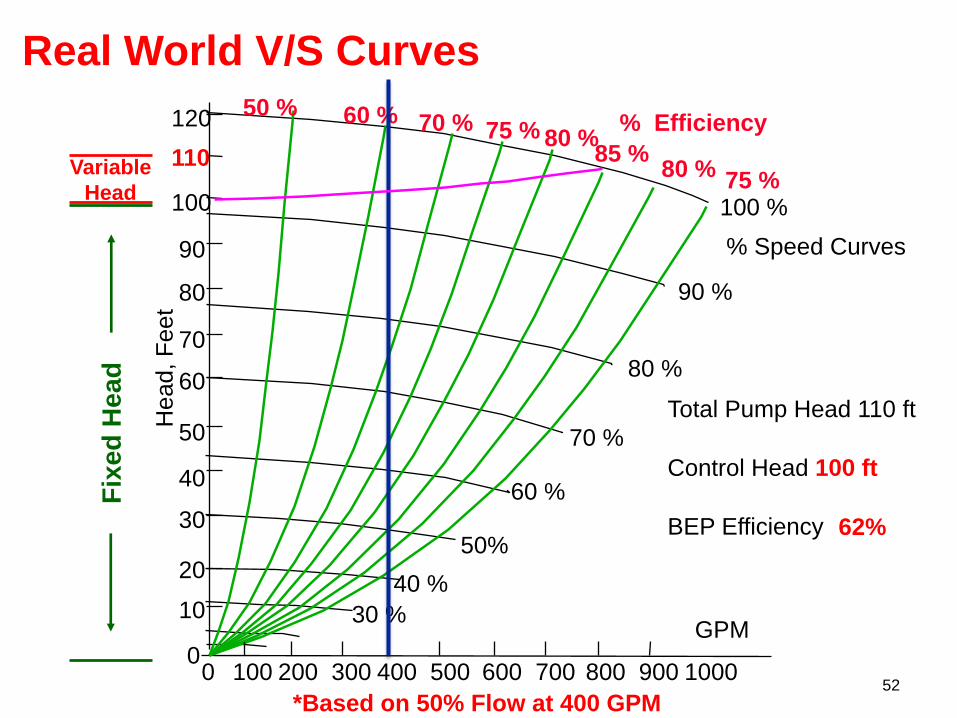
52
120
110
100
90
80
50
40
30
20
10
70
60
0 100 200 300 400 500 600 700 800 900 1000 0
100 %
90 %
80 %
70 %
60 %
50%
40 %
30 %
80 %
80 % 75 % 70 % 60 % 50 %
85 %
% Speed Curves
% Efficiency
GPM
BEP Efficiency
*Based on 50% Flow at 400 GPM
Total Pump Head 110 ft
Control Head 100 ft
62%
75 %
Real World V/S Curves
Head
, F
eet
Fix
ed
Head
Variable
Head
53
What happens to BEP pump
efficiency at 100% flow when
you over head a pump?
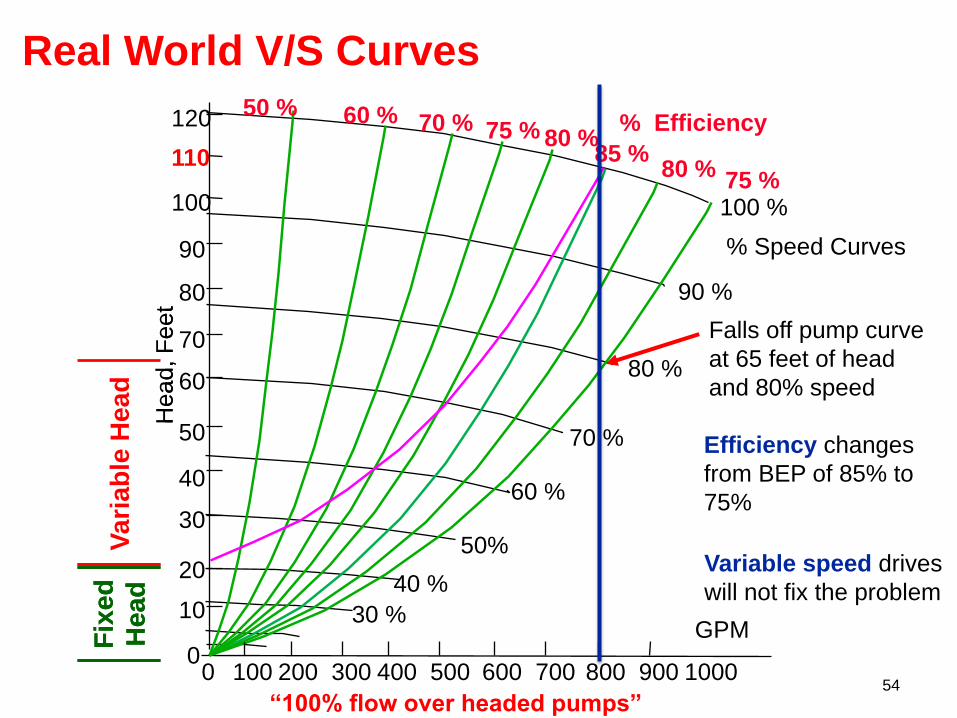
54
120
110
100
90
80
50
40
30
20
10
70
60
0 100 200 300 400 500 600 700 800 900 1000 0
100 %
90 %
80 %
70 %
60 %
50%
40 %
30 %
80 %
80 % 75 % 70 % 60 % 50 %
85 %
% Speed Curves
% Efficiency
Head
, F
eet
GPM
75 %
Efficiency changes
from BEP of 85% to
75%
Variable speed drives
will not fix the problem
Falls off pump curve
at 65 feet of head
and 80% speed
“100% flow over headed pumps”
Real World V/S Curves
Vari
ab
le H
ead
F
ixed
Head
Fix
ed
Head
H
ead
, F
eet
Vari
ab
le H
ead
55
• System Curve Review
1. Fixed Head and Variable Head
2. Constant Volume and Variable Volume
3. Pump Selection Guidelines ASHRAE & HI
4. Efficiency Islands and Load Profiles
• Pump Selection Examples
1. Condenser Water Pump Selection and BEP with VSD
2. Variable Volume Pump Sections and Efficiency Islands
• Energy Savings Old Versus New Pumps
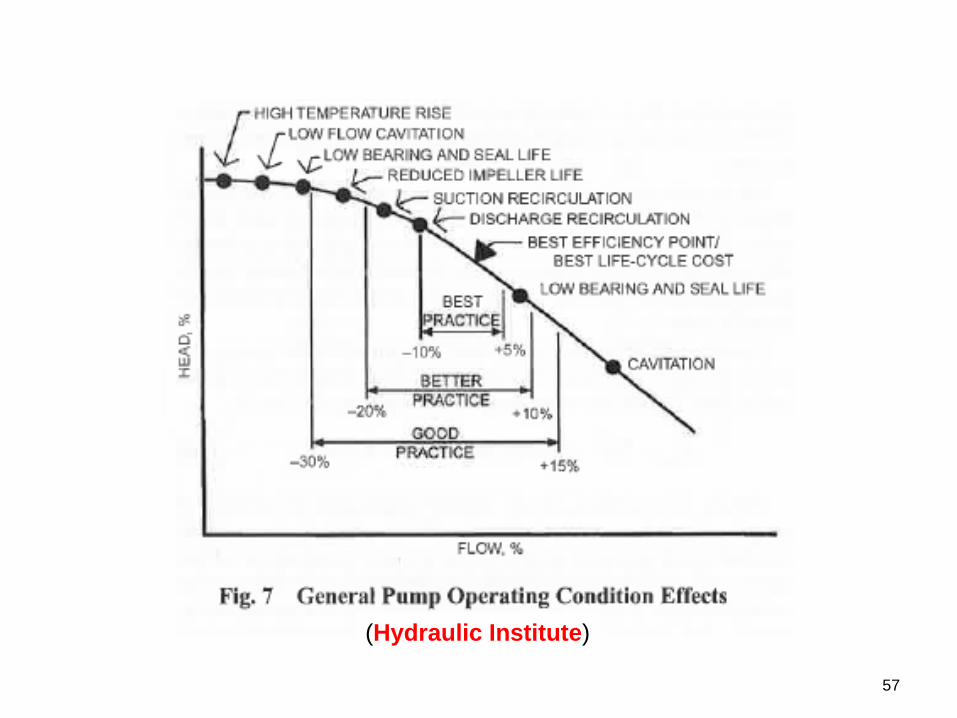
57
(Hydraulic Institute)
58
ASHRAE Recommendation
“selection limits of 66% to 115% of flow at the BEP are
suggested”
“Where possible, pumps should be chosen to operate to the
left of the BEP because the pressure in the actual system
may be less than design due to overstated data for pipe friction
and for other equipment. Otherwise, the pump operates at a
higher flow and possibly in the turbulent region.”
-- 2016 ASHRAE Systems and Equipment Handbook
59
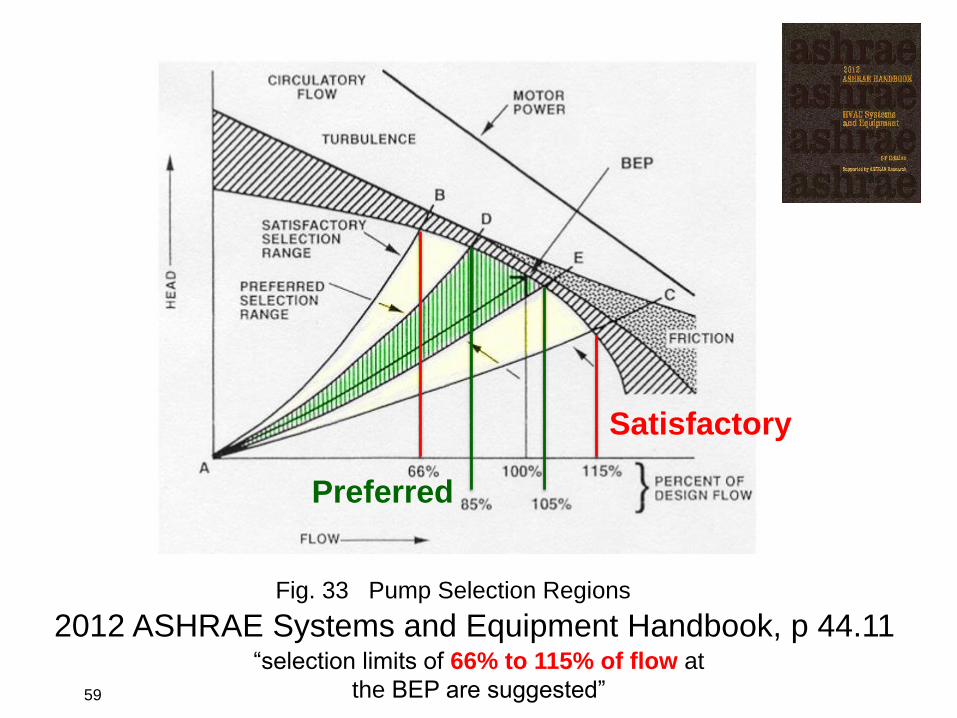
2012 ASHRAE Systems and Equipment Handbook, p 44.11
Fig. 33 Pump Selection Regions
“selection limits of 66% to 115% of flow at
the BEP are suggested”
Satisfactory
Preferred
60
Should we consider selecting pumps at full design flow to the right of
BEP to maximize variable flow system efficiency?
(Must have accurate pump head calculations )
(Do Not Overhead)
As the load changes, control valves change the system curve and
the operating point moves to a new point on the pump cure
2012 ASHRAE Systems and Equipment Handbook, p 44.11
Two 50% parallel selected pumps will have a higher system
efficiency and provide 70% plus standby
61
• System Curve Review
1. Fixed Head and Variable Head
2. Constant Volume and Variable Volume
3. Pump Selection Guidelines ASHRAE
4. Efficiency Islands and Load Profiles
• Pump Selection Examples
1. Condenser Water Pump Selection and BEP with VSD
2. Variable Volume Pump Sections and Efficiency Islands
• Energy Savings Old Versus New Pumps
65
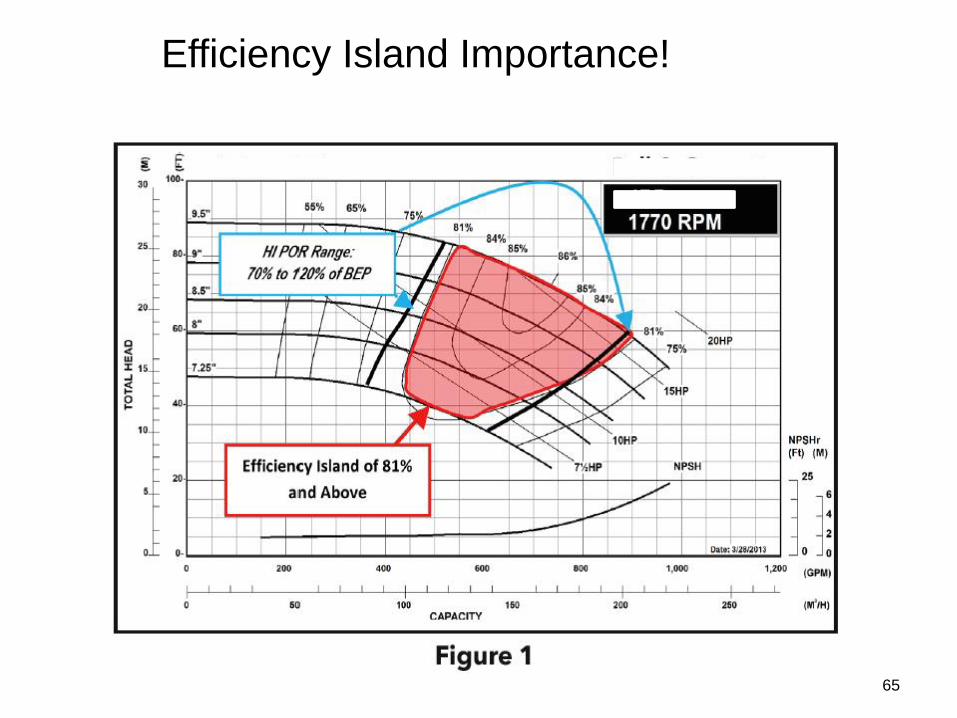
Efficiency Island Importance!
66
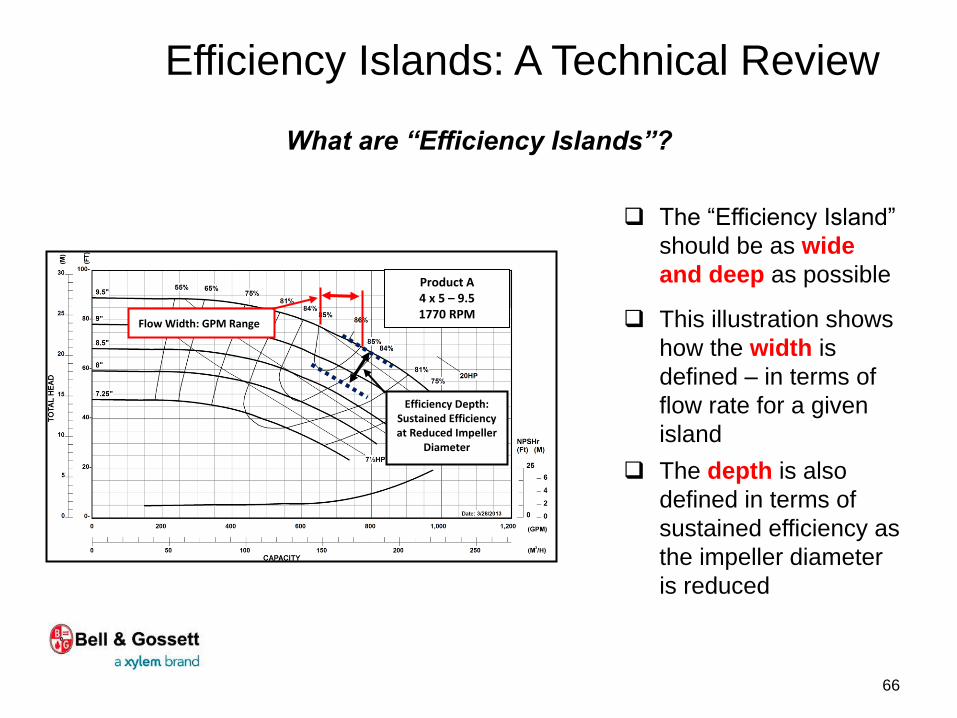
Efficiency Islands: A Technical Review
What are “Efficiency Islands”?
The “Efficiency Island”
should be as wide
and deep as possible
This illustration shows
how the width is
defined – in terms of
flow rate for a given
island
The depth is also
defined in terms of
sustained efficiency as
the impeller diameter
is reduced
Product A 4 x 5 – 9.5 1770 RPM
Flow Width: GPM Range
Efficiency Depth: Sustained Efficiency at Reduced Impeller
Diameter
10’ 10’ 0’
2’
4’
6’
8’
10’
30’
20’ Set Point
M
M
M
M
M
M
1
2
3
4
5
6
100 GPM
100 GPM
100 GPM
100 GPM
100 GPM
100 GPM
Part Load
70
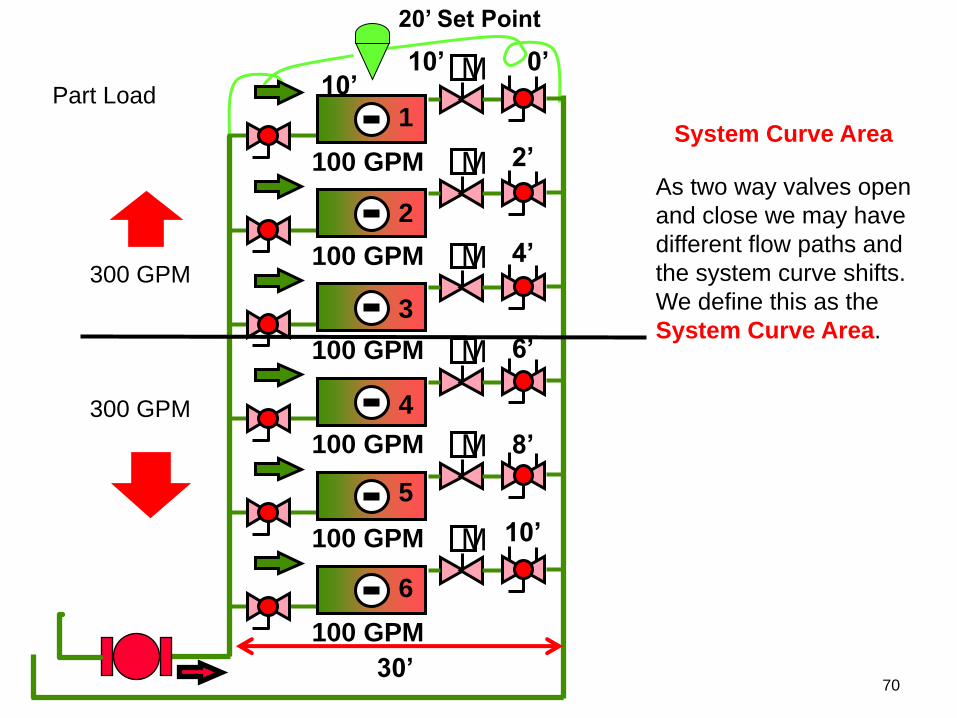
System Curve Area
As two way valves open
and close we may have
different flow paths and
the system curve shifts.
We define this as the
System Curve Area.
300 GPM
300 GPM
68
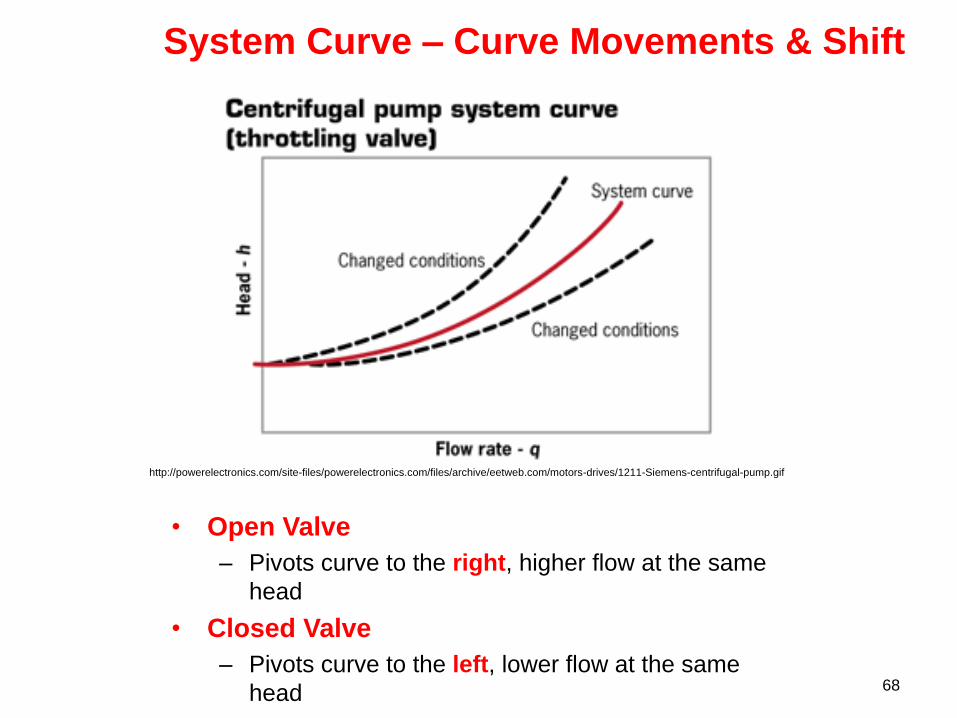
System Curve – Curve Movements & Shift
• Open Valve
– Pivots curve to the right, higher flow at the same
head
• Closed Valve
– Pivots curve to the left, lower flow at the same
head
http://powerelectronics.com/site-files/powerelectronics.com/files/archive/eetweb.com/motors-drives/1211-Siemens-centrifugal-pump.gif
69
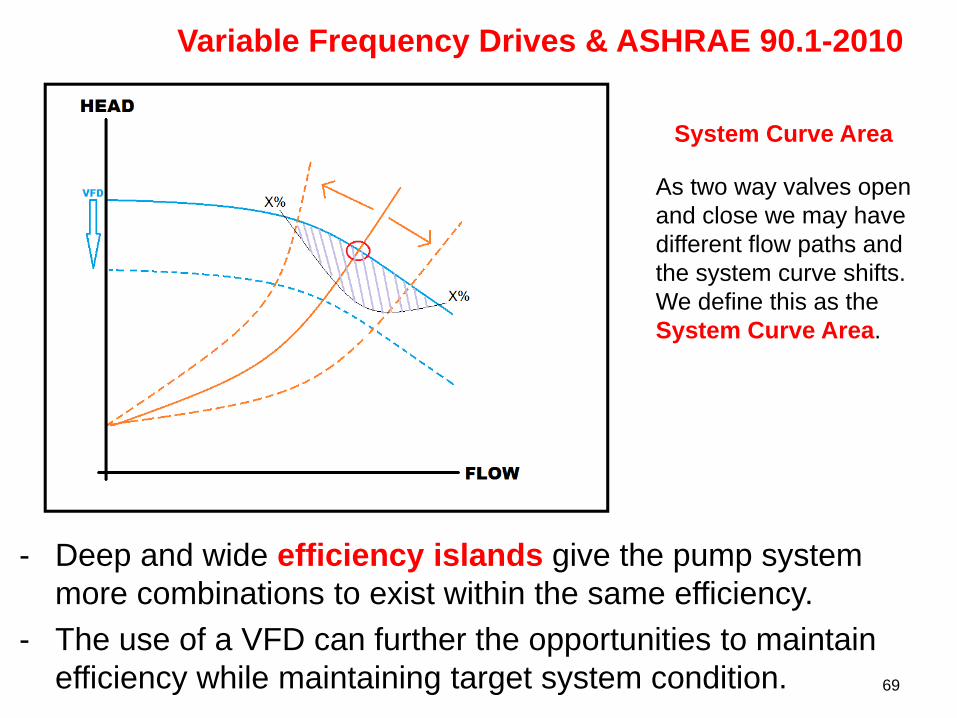
Variable Frequency Drives & ASHRAE 90.1-2010
- Deep and wide efficiency islands give the pump system
more combinations to exist within the same efficiency.
- The use of a VFD can further the opportunities to maintain
efficiency while maintaining target system condition.
System Curve Area
As two way valves open
and close we may have
different flow paths and
the system curve shifts.
We define this as the
System Curve Area.
71
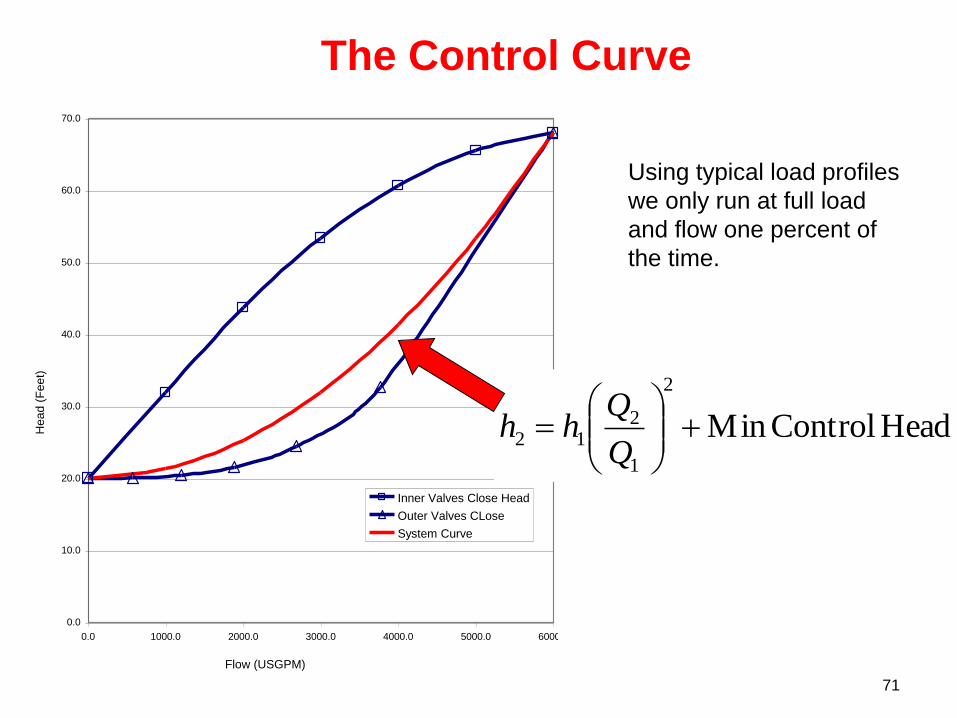
The Control Curve
Flow (USGPM)
Head (
Feet)
0.0
10.0
20.0
30.0
40.0
50.0
60.0
70.0
0.0 1000.0 2000.0 3000.0 4000.0 5000.0 6000.0
Inner Valves Close Head
Outer Valves CLose
System Curve
Head ControlMin
2
1
212
Q
Qhh
Using typical load profiles
we only run at full load
and flow one percent of
the time.
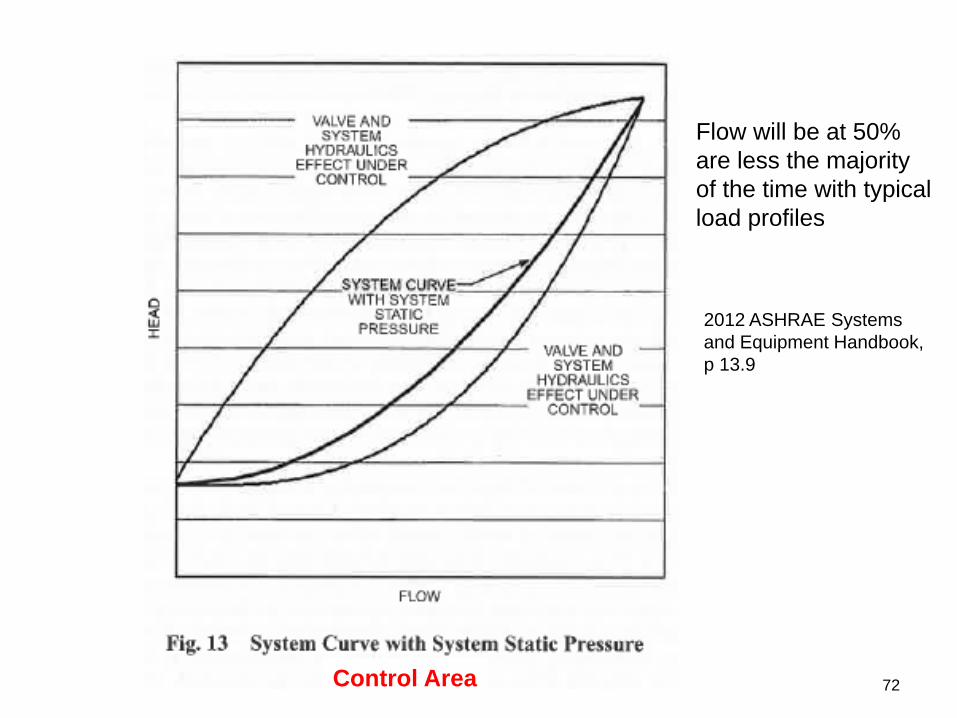
72 Control Area
Flow will be at 50%
are less the majority
of the time with typical
load profiles
2012 ASHRAE Systems
and Equipment Handbook,
p 13.9
75
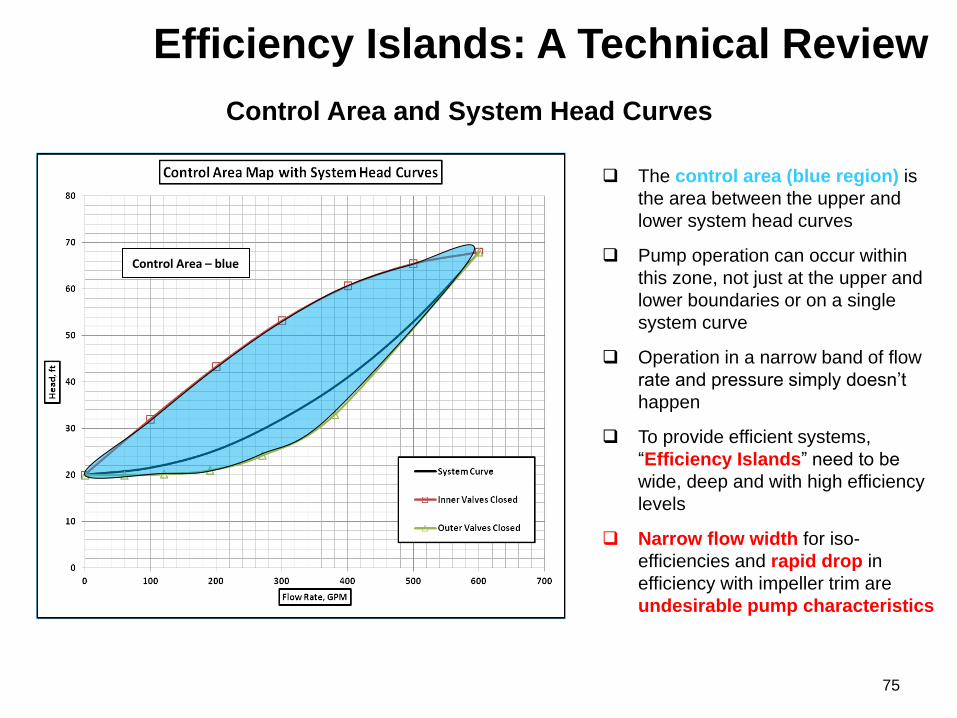
Control Area and System Head Curves
Efficiency Islands: A Technical Review
The control area (blue region) is
the area between the upper and
lower system head curves
Pump operation can occur within
this zone, not just at the upper and
lower boundaries or on a single
system curve
Operation in a narrow band of flow
rate and pressure simply doesn’t
happen
To provide efficient systems,
“Efficiency Islands” need to be
wide, deep and with high efficiency
levels
Narrow flow width for iso-
efficiencies and rapid drop in
efficiency with impeller trim are
undesirable pump characteristics
Control Area – blue

76
77
79
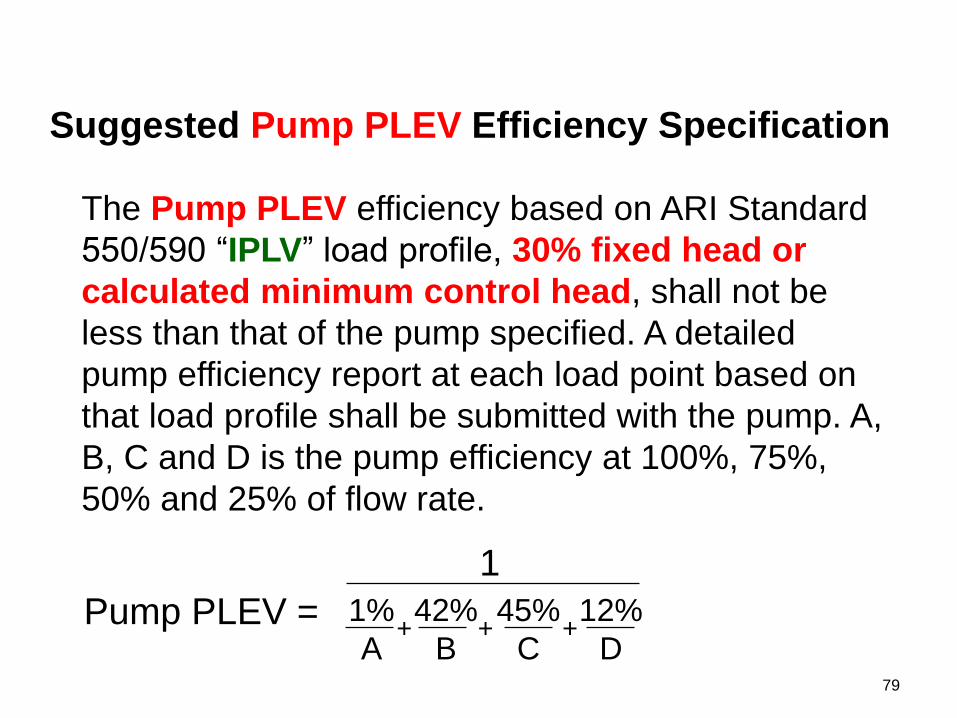
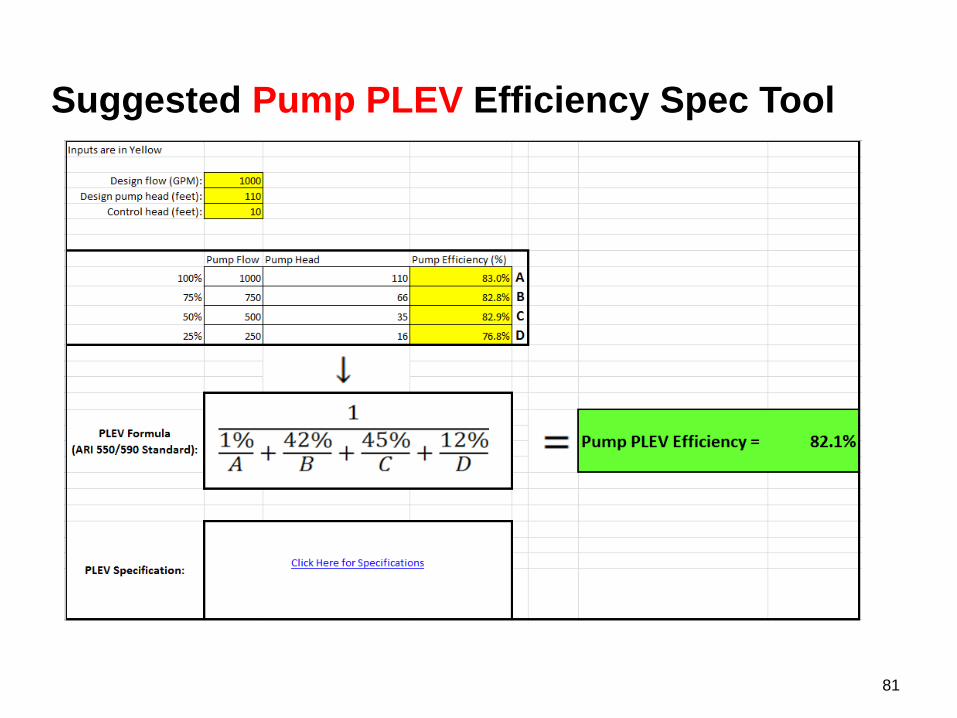
Suggested Pump PLEV Efficiency Specification
The Pump PLEV efficiency based on ARI Standard
550/590 “IPLV” load profile, 30% fixed head or
calculated minimum control head, shall not be
less than that of the pump specified. A detailed
pump efficiency report at each load point based on
that load profile shall be submitted with the pump. A,
B, C and D is the pump efficiency at 100%, 75%,
50% and 25% of flow rate.
1
1%
A
42%
B
45%
C
12%
D + + +
Pump PLEV =
80
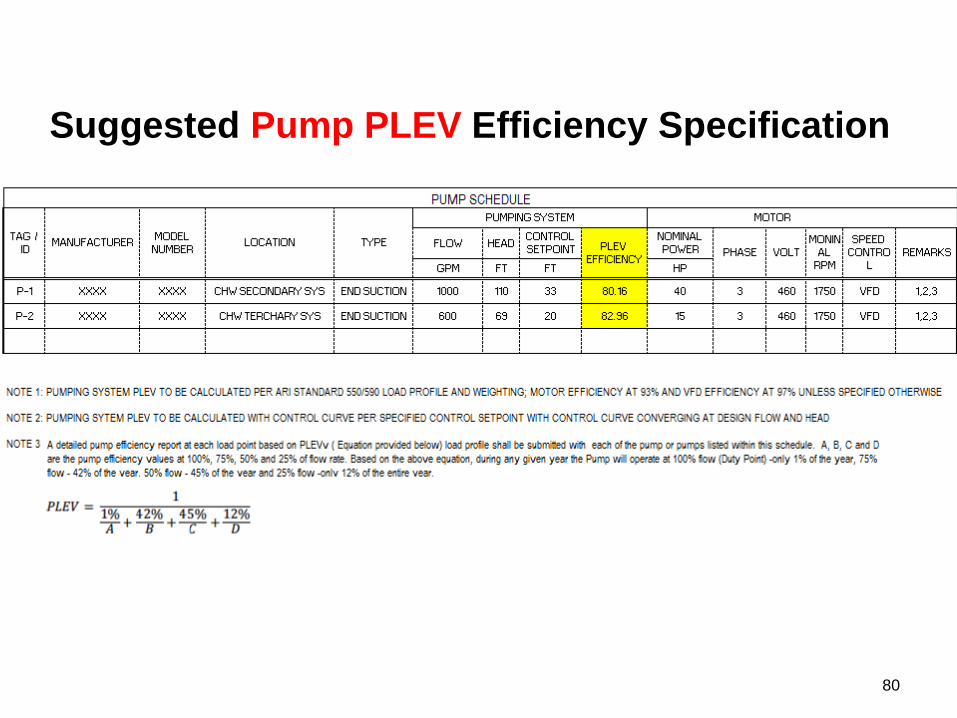
Suggested Pump PLEV Efficiency Specification
81
Suggested Pump PLEV Efficiency Spec Tool
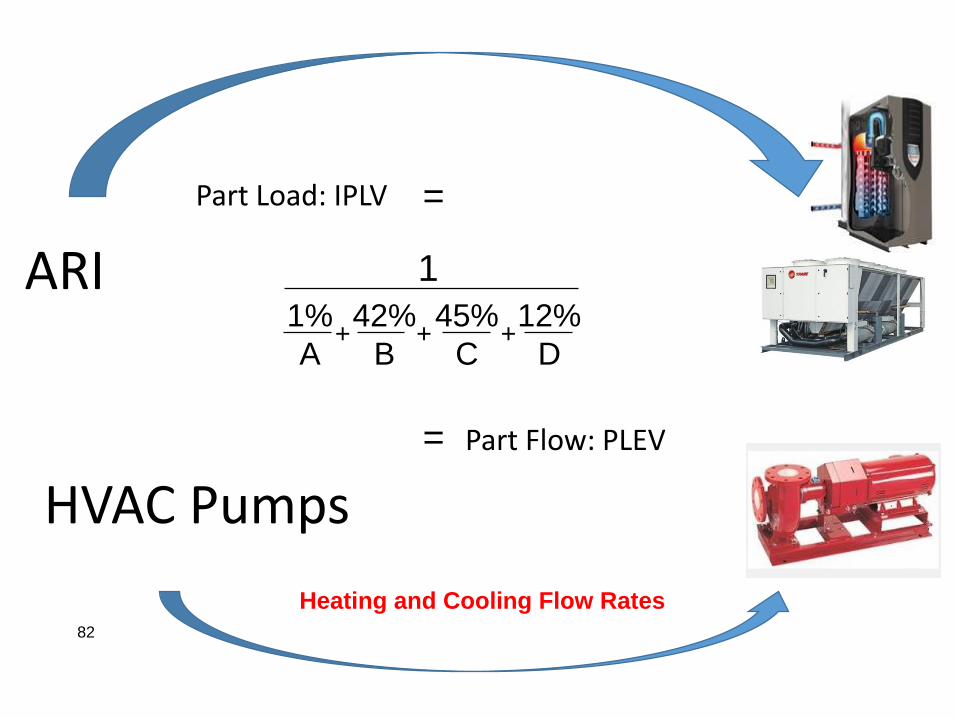
82
ARI
HVAC Pumps
Part Load: IPLV
Part Flow: PLEV
=
1
1%
A
42%
B
45%
C
12%
D + + +
Heating and Cooling Flow Rates
=
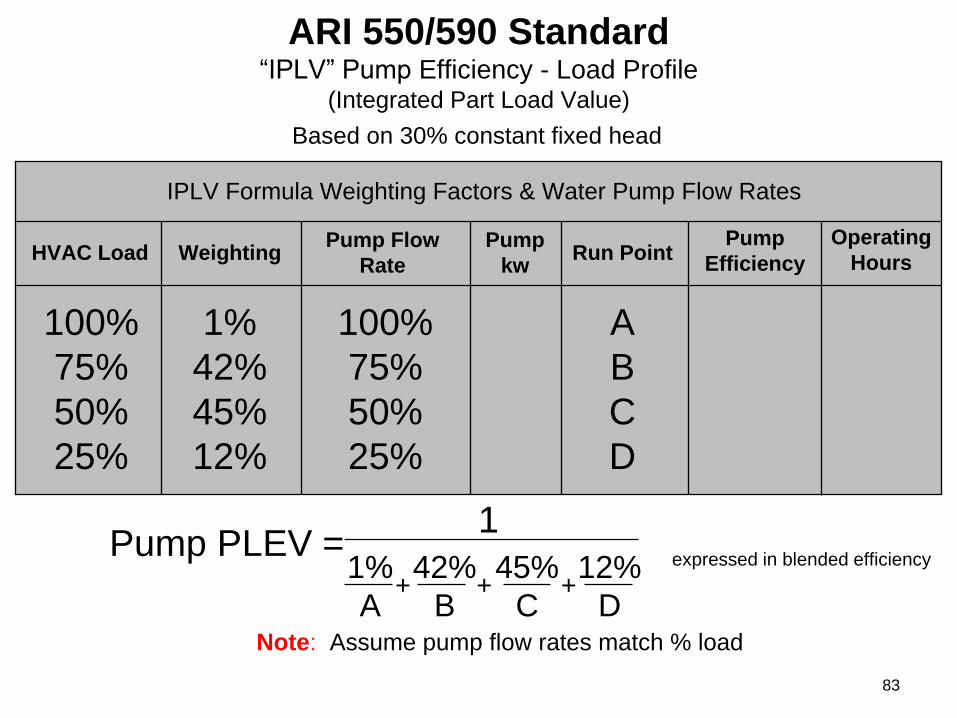
83
ARI 550/590 Standard “IPLV” Pump Efficiency - Load Profile
(Integrated Part Load Value)
Note: Assume pump flow rates match % load
IPLV Formula Weighting Factors & Water Pump Flow Rates
HVAC Load Weighting Pump Flow
Rate
Pump
kw Run Point
100%
75%
50%
25%
1%
42%
45%
12%
100%
75%
50%
25%
A
B
C
D
1 Pump PLEV =
1%
A
42%
B
45%
C
12%
D
expressed in blended efficiency
+ + +
Pump
Efficiency
Operating
Hours
Based on 30% constant fixed head
84
To Get Highest System Pumping Efficiency
- Goal is to maximize efficiency island:
Greatest range of flow and greatest span of
total head
- By having a larger island, shifts in the system
curve or movements along the pump curve
can happen within the same efficiency
range

85
To Get Highest System Pumping Efficiency
Maximize your efficiency islands!!!
86
• System Curve Review
1. Fixed Head and Variable Head
2. Constant Volume and Variable Volume
3. Pump Selection Guidelines ASHRAE
4. Efficiency Islands and Load Profiles
• Pump Selection Examples
1. Variable Volume Pump Sections and Efficiency Islands
• Energy Savings Old Versus New Pumps
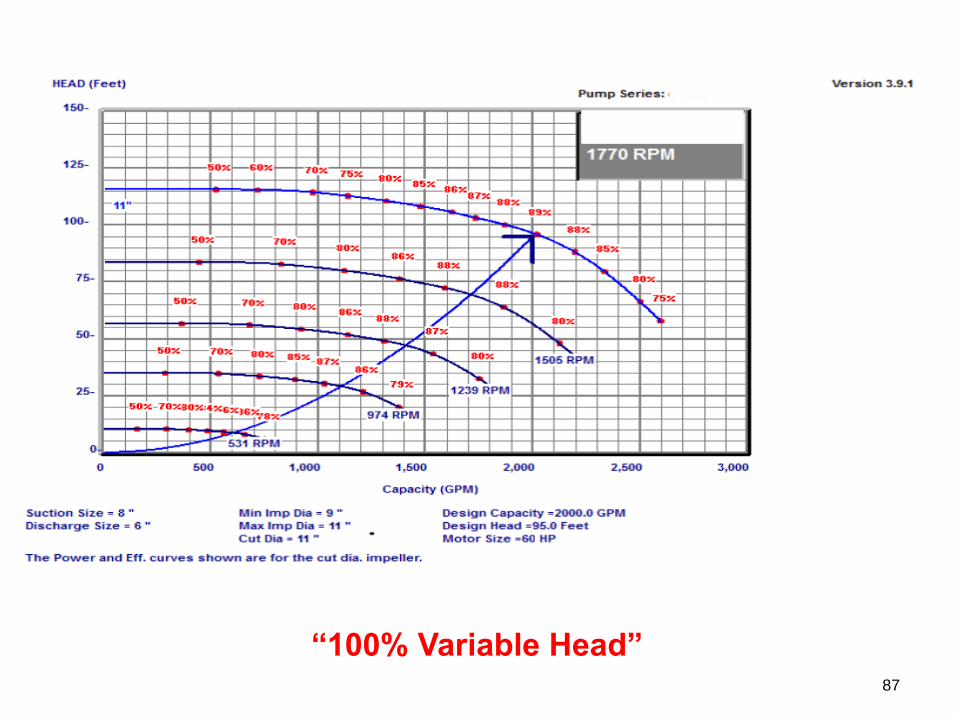
87
“100% Variable Head”
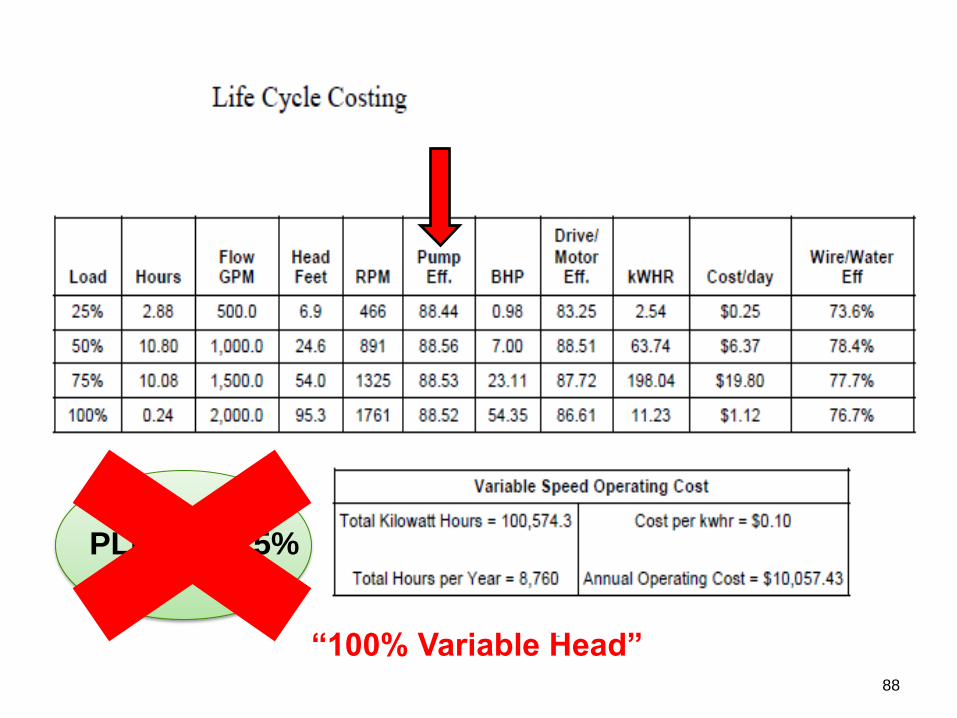
88
“100% Variable Head”
PLEV = 88.5%
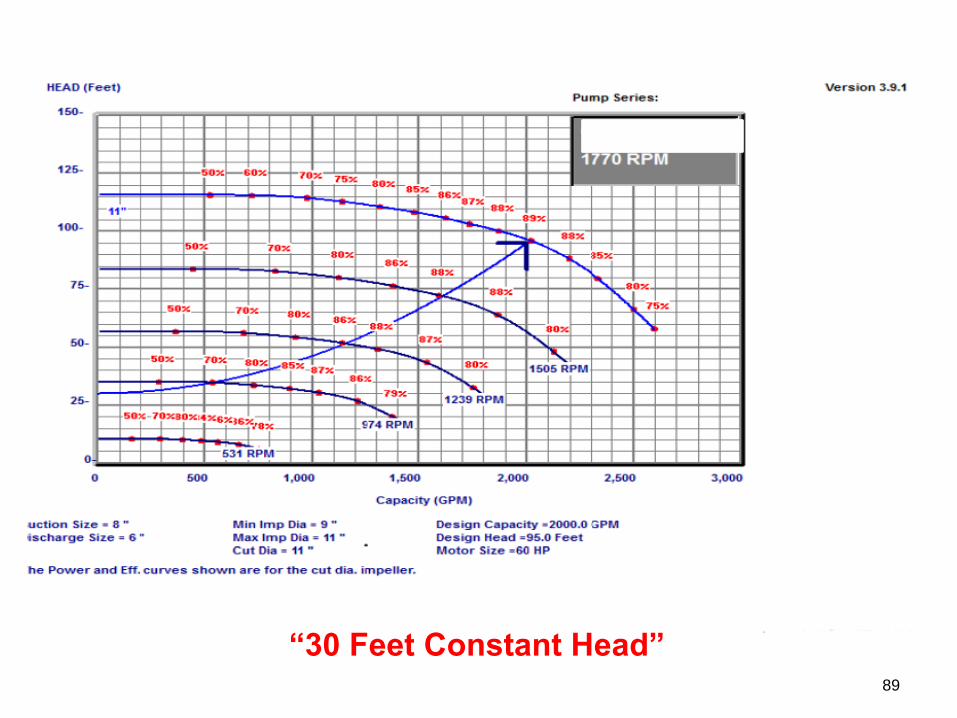
89
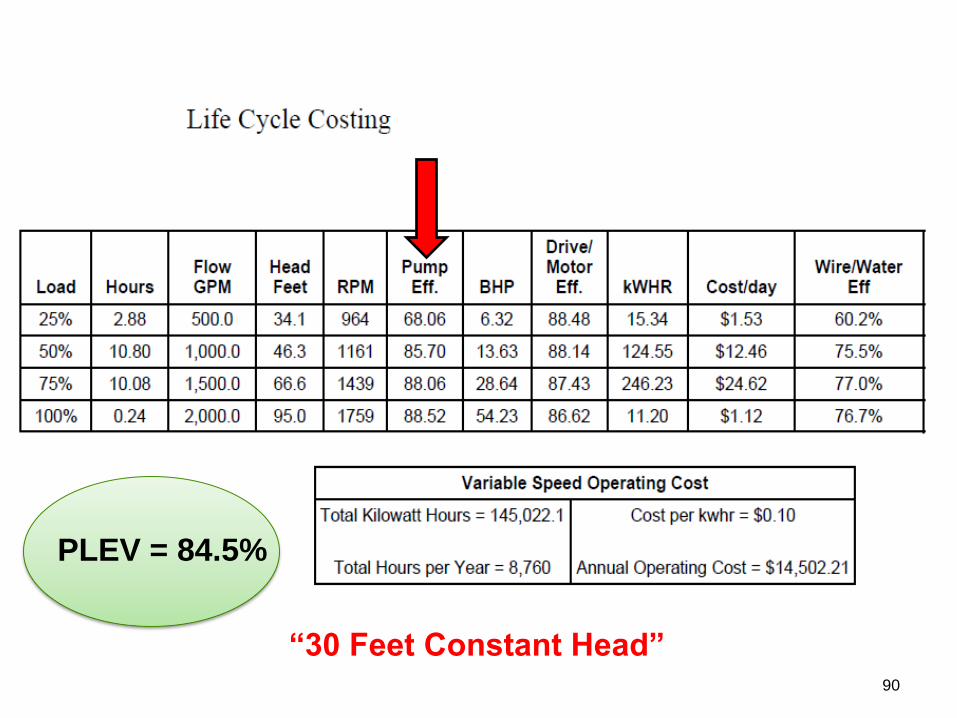
“30 Feet Constant Head”
90
“30 Feet Constant Head”
PLEV = 84.5%
91 91
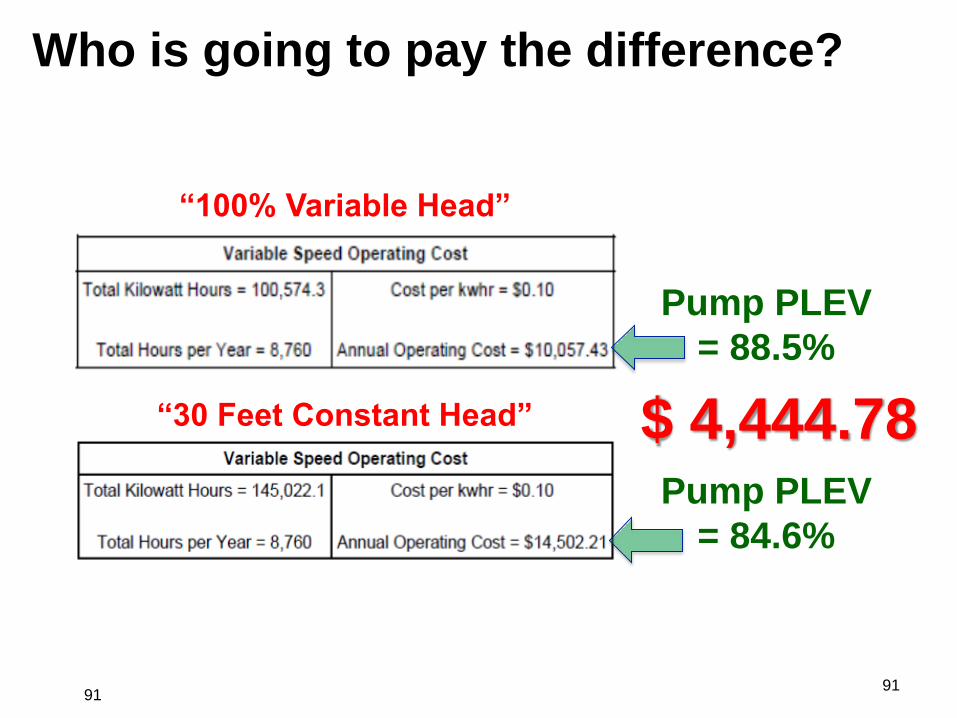
“100% Variable Head”
“30 Feet Constant Head”
Who is going to pay the difference?
$ 4,444.78 Pump PLEV
= 84.6%
Pump PLEV
= 88.5%

Thank you for coming!
92
Which Island would you pick?