Embed Size (px)
Citation preview
1
MODFLOW Simulation of Pumping Test Data in a Fractured
Sedimentary Rock AquiferMeghan Hodgins1, Mustafa Chudnoff1
1Glorieta Geoscience, Inc.,[email protected],
[email protected], Santa Fe, NM, USA
Site Location Map
Generalized Geologic Map
2
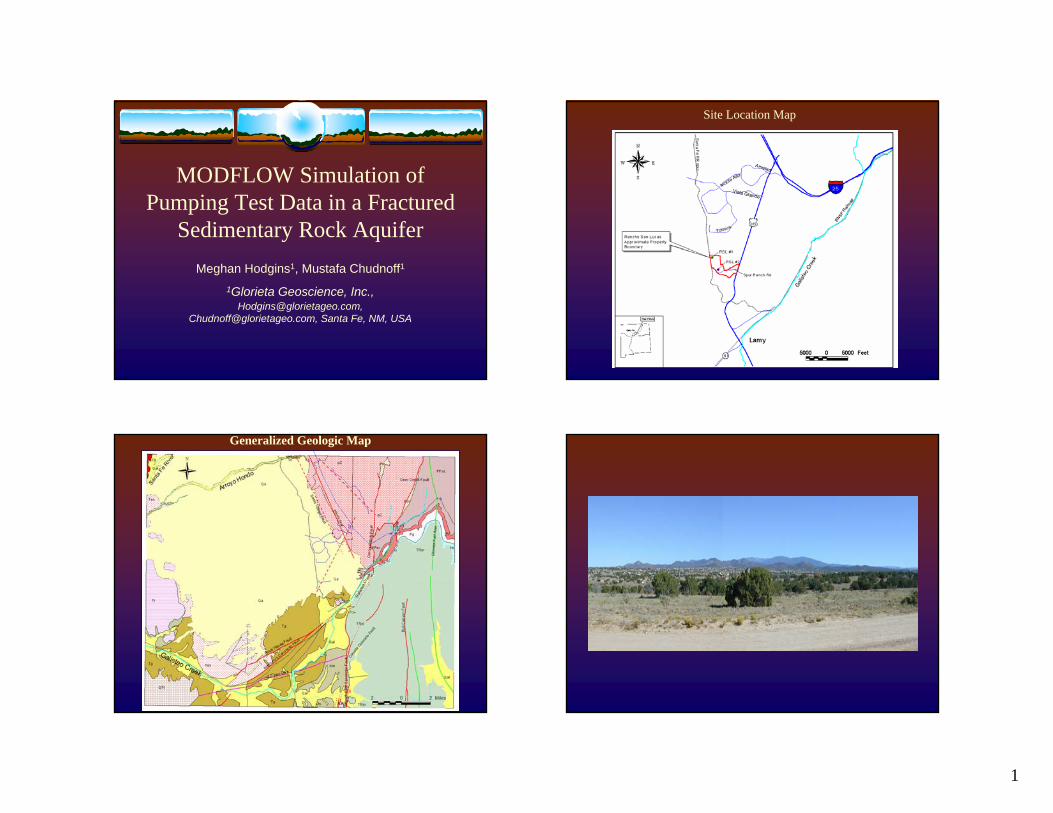
Potentiometric Surface Contour MapCorrelation diagram from RSL#1 to RSL #2
Schematic cross section from RSL#1 to RSL#2Hypothesis 1: Buried fault reconciles dip of bedding with elevation of units in the wells Schematic cross section from RSL#1 to RSL#2 (b)
Hypothesis 2: Buried folds reconcile dip of bedding with elevation of units in the wells
3
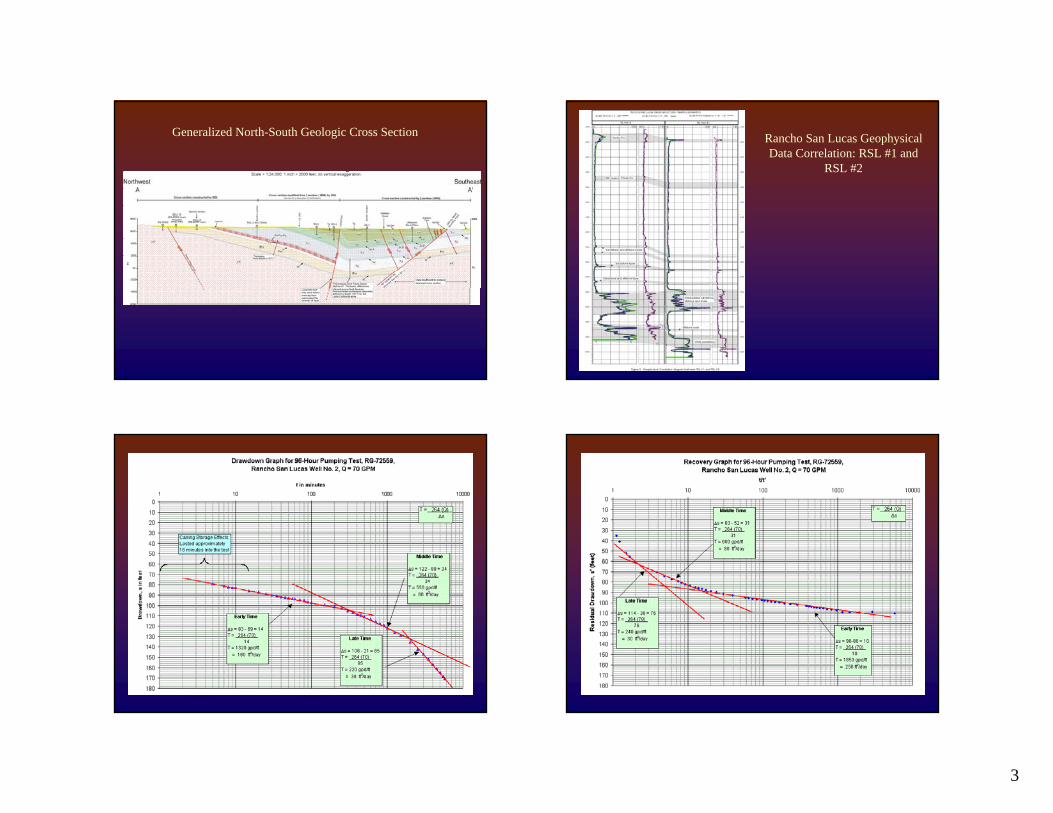
Generalized North-South Geologic Cross Section Rancho San Lucas Geophysical Data Correlation: RSL #1 and
RSL #2
Drawdown Graph for 96-hr ptest Recovery Graph for 96-hr ptest
4
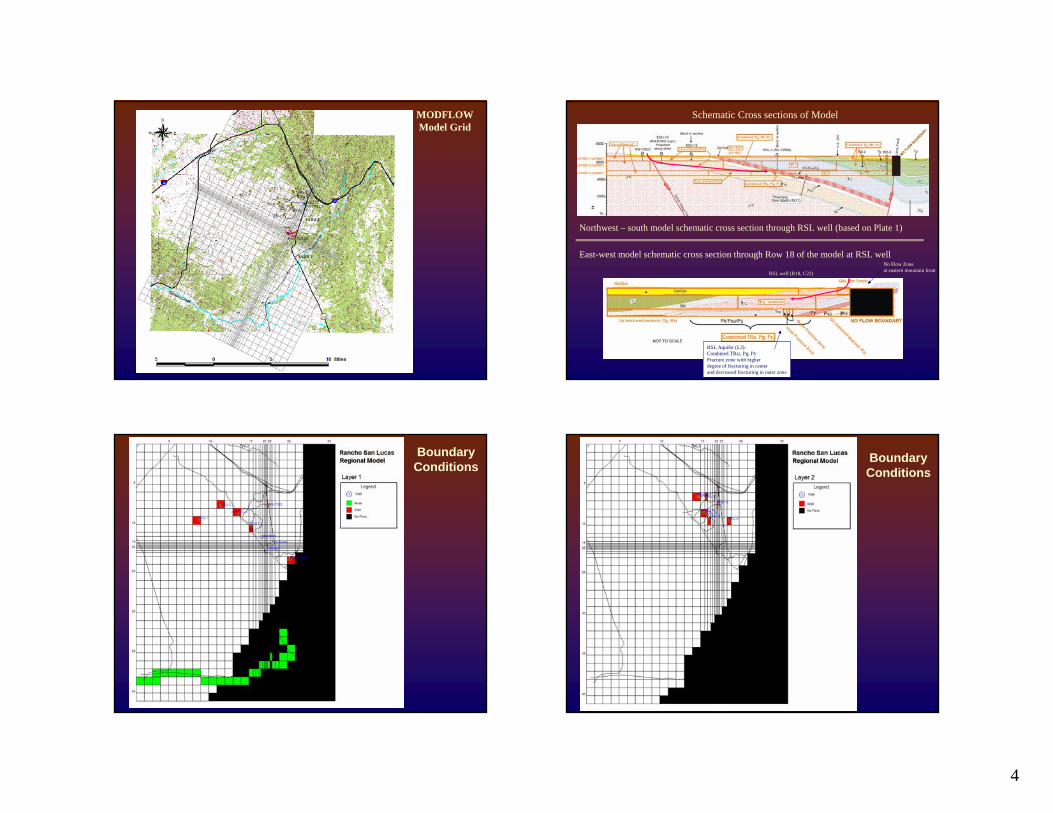
MODFLOW Model Grid
Schematic Cross sections of Model
Northwest – south model schematic cross section through RSL well (based on Plate 1)
East-west model schematic cross section through Row 18 of the model at RSL wellNo Flow Zoneat eastern mountain front
RSL Aquifer (L3):Combined TRsr, Pg, PyFracture zone with higherdegree of fracturing in centerand decreased fracturing in outer zone
RSL well (R18, C22)
Boundary Conditions
Boundary Conditions
5
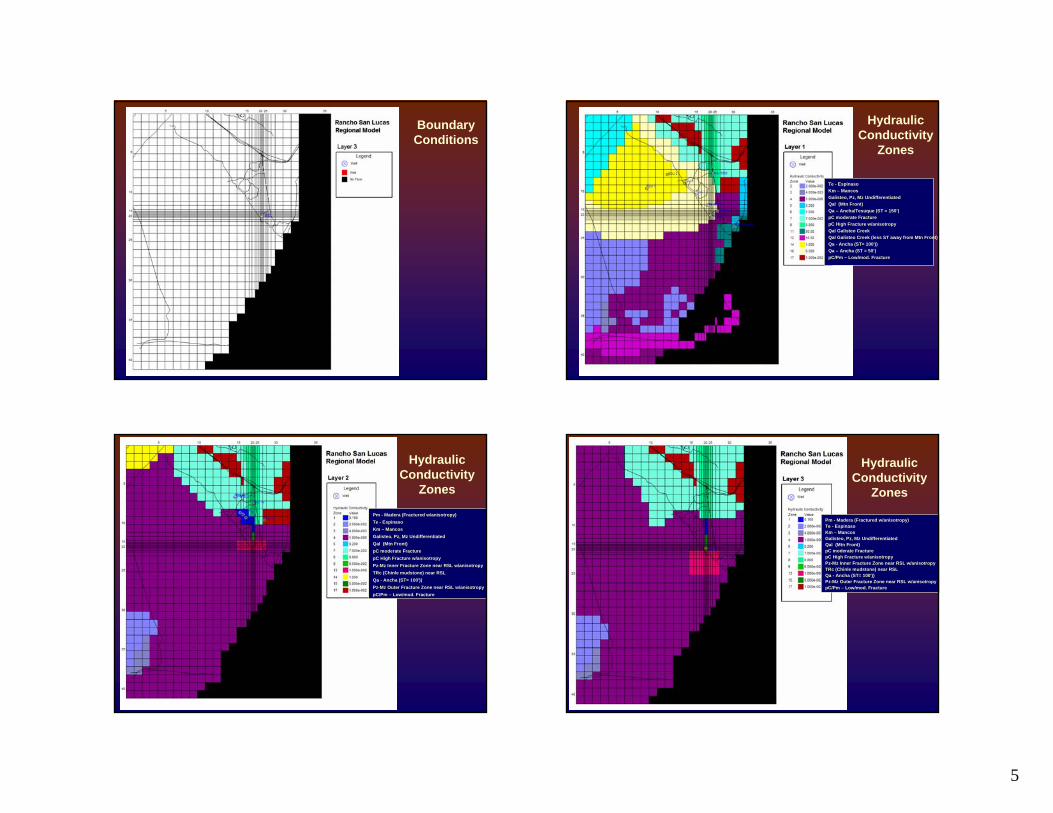
Boundary Conditions
Hydraulic Conductivity
Zones
Te - EspinasoKm – MancosGalisteo, Pz, Mz UndifferentiatedQal (Mtn Front)Qa – Ancha/Tesuque (ST = 150’)pC moderate FracturepC High Fracture w/anisotropyQal Galisteo CreekQal Galisteo Creek (less ST away from Mtn Front)Qa - Ancha (ST= 100'))Qa – Ancha (ST = 50’)pC/Pm – Low/mod. Fracture
Hydraulic Conductivity
Zones
Pm - Madera (Fractured w/anisotropy)Te - EspinasoKm – MancosGalisteo, Pz, Mz UndifferentiatedQal (Mtn Front)pC moderate FracturepC High Fracture w/anisotropyPz-Mz Inner Fracture Zone near RSL w/anisotropyTRc (Chinle mudstone) near RSLQa - Ancha (ST= 100'))Pz-Mz Outer Fracture Zone near RSL w/anisotropypC/Pm – Low/mod. Fracture

6
Specific Yield Zones
Storage Zones
Storage Zones
96-hour Pumping Test
Modeled Drawdown
7
0
50
100
150
200
250
1 10 100 1000 10000 100000 1000000 10000000
Time, min
Dra
wdo
wn,
ft
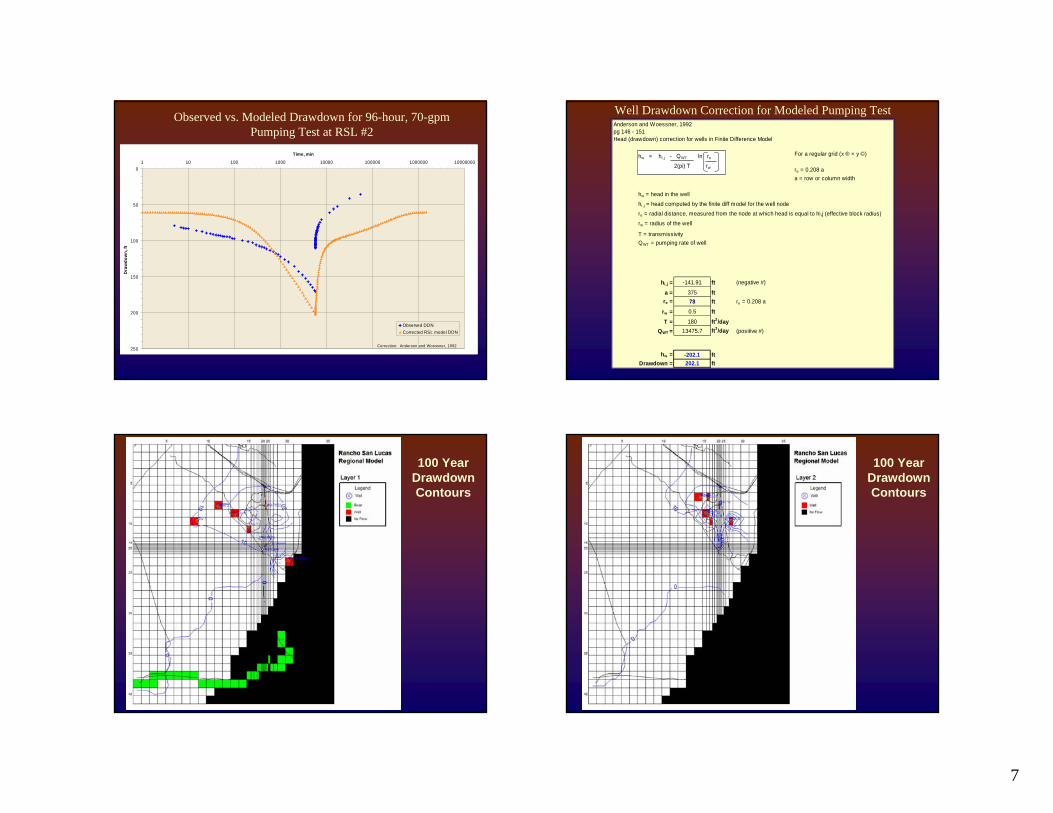
Observed DDNCorrected RSL model DDN
Correction: Anderson and Woessner, 1992
Observed vs. Modeled Drawdown for 96-hour, 70-gpm Pumping Test at RSL #2
Well Drawdown Correction for Modeled Pumping TestAnderson and Woessner, 1992pg 146 - 151Head (drawdown) correction for wells in Finite Difference Model
For a regular grid (x ® = y ©)
re = 0.208 aa = row or column width
hw = head in the well
hi,j = head computed by the finite diff model for the well nodere = radial distance, measured from the node at which head is equal to hi,j (effective block radius)
rw = radius of the well
T = transmissivityQWT = pumping rate of well
hi,j = -141.91 ft (negative #)
a = 375 ftre = 78 ft re = 0.208 a
rw = 0.5 ft
T = 180 ft2/dayQWT = 13475.7 ft3/day (positive #)
hw = -202.1 ftDrawdown = 202.1 ft
hw = hi ,j - QWT ln re
2(pi) T rw
100 Year Drawdown Contours
100 Year Drawdown Contours

8
100 Year Drawdown Contours
Well Name EDU 1 EDU 2 EDU 3 EDU 4 EDU 5
W/RSL pumping 12.23 21.27 29.06 30.37 26.24W/out RSL pumping 12.20 21.17 28.72 30.05 25.78
Effects from RSL pumping (subtract bottom from top row) 0.04 0.10 0.34 0.31 0.46
Well Name EDU 6 EDU 7 EDU 8 EDU 9 (Lamy) EDU 12
W/RSL pumping 23.16 25.92 104.47 46.25 25.00
W/out RSL pumping 22.84 24.86 103.58 46.25 24.36
Effects from RSL pumping (subtract bottom from top row) 0.32 1.06 0.89 0.00 0.64
Well Name EDU 13 EDU 14 EDU 15
W/RSL pumping 42.20 51.20 31.43
W/out RSL pumping 41.42 50.56 30.46
Effects from RSL pumping (subtract bottom from top row) 0.78 0.64 0.96
Off-site Commercial
Well Name RG-75522 RG-62896 RG-60406 RG-65040
W/RSL pumping 25.18 11.20 0.05 16.39
W/out RSL pumping 24.51 8.75 0.03 13.33
Effects from RSL pumping (subtract bottom from top row) 0.67 2.46 0.01 3.07
Eldorado Utilities (EDU) wells
nearby Off-site Domestic
Off-site Effects After 100 Years of Pumping
Drawdown Effects After 100 Years of
Pumping (in Feet of Drawdown in the Well)
Well Name RSL
W/RSL pumping 192.17
W/out RSL pumping 14.77
Effects from RSL pumping (subtract bottom from top row) 177.40
On-site Effect After 100 years of Pumping
ConclusionsThe Rancho San Lucas Well is capable of providing a 100-year supply for the proposed subdivisionThe anisotropic groundwater model is a conservative estimate of on-site and off-site effects of pumping
blank slide
9
rsl #2 geophys Change model construction
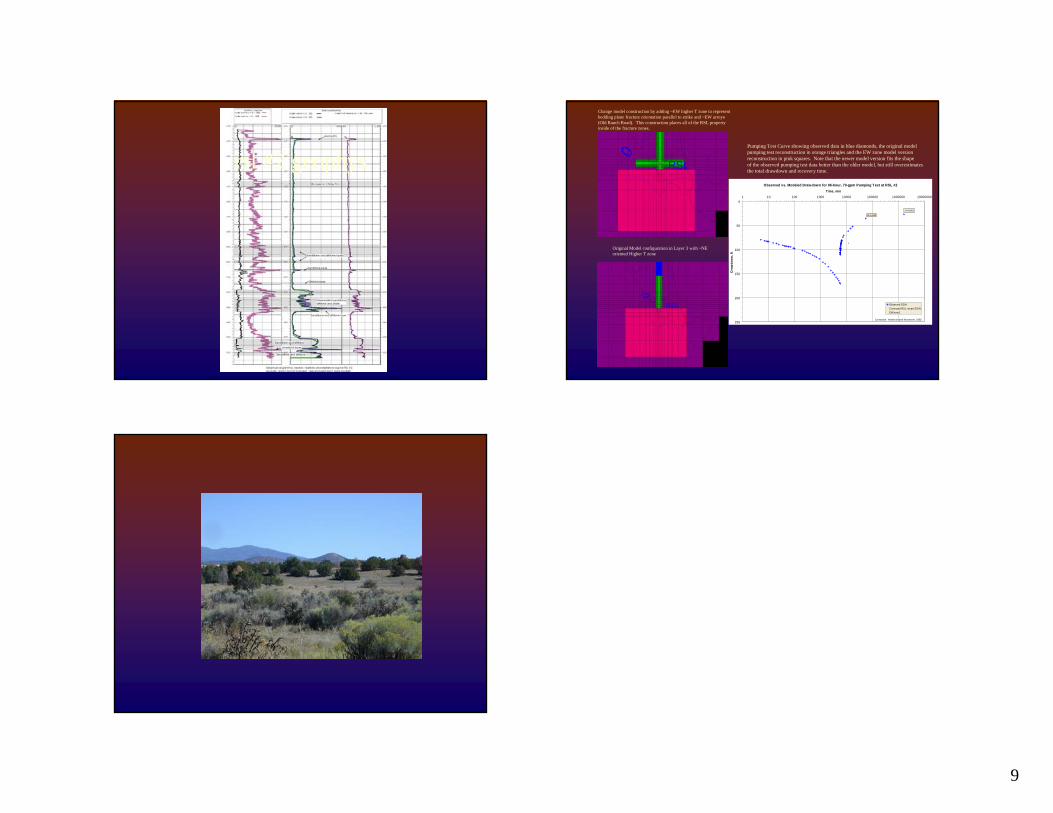
Change model construction by adding ~EW higher T zone to representbedding plane fracture orientation parallel to strike and ~EW arroyo (Old Ranch Road). This construction places all of the RSL property inside of the fracture zones.
Original Model configuration in Layer 3 with ~NE oriented Higher T zone
Pumping Test Curve showing observed data in blue diamonds, the original modelpumping test reconstruction in orange triangles and the EW zone model version reconstruction in pink squares. Note that the newer model version fits the shape of the observed pumping test data better than the older model, but still overestimatesthe total drawdown and recovery time.
Observed vs. Modeled Drawdow n for 96-hour, 70-gpm Pumping Test at RSL #2
0
50
100
150
200
250
1 10 100 1000 10000 100000 1000000 10000000
Time, min
Dra
wdo
wn,
ft
Observed DDNCorrected RSL model DDNEWzone1
Correction: Anderson and Woessner, 1992
12-1-1999
1-14-2001