Embed Size (px)
Citation preview
Mp
Da
b
a
ARRAA
KAISTW
1
oguieisatt
0d
Journal of Membrane Science 373 (2011) 178–188
Contents lists available at ScienceDirect
Journal of Membrane Science
journa l homepage: www.e lsev ier .com/ locate /memsci
odification and characterization of ultrafiltration membranes for treatment ofroduced water
aniel Wanderaa, S. Ranil Wickramasingheb, Scott M. Hussona,∗
Department of Chemical and Biomolecular Engineering and Center for Advanced Engineering Fibers and Films, Clemson University, 127 Earle Hall, Clemson, SC 29634, USADepartment of Chemical and Biological Engineering, Colorado State University, Fort Collins, CO 80523, USA
r t i c l e i n f o
rticle history:eceived 4 October 2010eceived in revised form 2 February 2011ccepted 4 March 2011vailable online 12 March 2011
eywords:ntifouling
mpaired waterustainabilityemperature-responsiveater treatment
a b s t r a c t
This contribution describes the surface modification of low molecular weight cutoff regeneratedcellulose ultrafiltration membranes by grafting poly(N-isopropylacrylamide) (PNIPAAm)-block-poly(oligoethylene glycol methacrylate) (PPEGMA) nanolayers from the membrane surface usingsurface-initiated atom transfer radical polymerization. The objective of the work was to change the mem-brane surface properties in ways that limit foulant accumulation on these membranes and provide aneasy, chemical-free way to remove any attached foulants during produced water filtration. ATR-FTIRspectra confirmed the successful grafting of both polymers from the membrane surface. Analysis of AFMtopographical images indicated that membrane surface roughness decreased slightly from 2.6 nm forthe unmodified membrane to 1.7 nm following PNIPAAm-b-PPEGMA modification. The performance ofthe modified membranes was tested by measuring water flux using synthetic produced water devel-oped from an oil-in-water emulsion. Polymer grafting led to a roughly 40% decrease in the water flux,but the final flux was comparable to commercial membranes used for removal of organics with highsalt passage. Furthermore, modified membranes showed slower flux decline than unmodified mem-branes, and, hence, the modified membranes allowed a 13.8% higher cumulative volume of water tobe processed over a 40 h cross-flow filtration run. To test potential for chemical-free cleaning, filtra-tion runs were carried out before and after a temperature-controlled water rinse. Flux recovery was
better for the modified membranes after a cold water rinse. The flux recovered fully to initial valuesfor both the PNIPAAm- and PNIPAAm-b-PPEGMA-modified membranes; while only ∼81% of the initialflux was recovered for the unmodified membrane. All three membranes exhibited poor salt rejection, aswould be expected for ultrafiltration membranes. However, TOC removal efficiencies were higher than97% for PNIPAAm-b-PPEGMA-modified membranes. Taken together, results from this work indicate thatdifiedd wa
PNIPAAm-b-PPEGMA molarge volumes of produce
. Introduction
Produced water (PW) is oily water that is co-produced duringil and gas exploration and production. The volume of PW that isenerated depends on how much is present in the reservoir as a nat-ral water layer (formation water) and whether additional water is
njected into the reservoir to force the oil to the surface. Increasingnergy demands coupled with high oil and gas prices are driving thencreased production of oil and gas from non-traditional sources
uch as tar sands, oil shale and coal bed methane (CBM) [1]. Heregain, oil and gas production generates large volumes of PW, par-icularly from CBM wells, which contain many fractures and poreshat can contain and transmit large volumes of water.∗ Corresponding author. Tel.: +1 864 656 4502; fax: +1 864 656 0784.E-mail address: [email protected] (S.M. Husson).
376-7388/$ – see front matter © 2011 Elsevier B.V. All rights reserved.oi:10.1016/j.memsci.2011.03.010
ultrafiltration membranes could be used to separate emulsified oils fromter at high flux.
© 2011 Elsevier B.V. All rights reserved.
In the United States, PW accounted for 88% of the total volume ofexploration and production material brought to the surface by theoil and gas industry in 2007. The total volume of PW generated frommost of the nearly 1 million actively producing oil and gas wellsin the United States in 2007 was estimated to be about 21 billionbarrels (bbl) [2]. Khatib and Verbeek [3] reported that worldwidedaily PW generation in 1999 was more than 210 million bbl whichrepresents about 77 billion bbl of PW for the entire year, about threetimes the world oil production.
The volume of PW from conventional oil and gas wells does notremain constant, as the water-to-oil ratio increases over the life-time of the well. For example, Khatib and Verbeck [3] reported
that PW generated from several Shell operating units increasedfrom 2.1 million bbl per day in 1990 to more than 6 million bblper day in 2002. Clark and Veil [2] reported that US wells gen-erated an average of more than 5 bbl of PW for each bbl of oilin 2007. For crude oil wells nearing the end of their productive
mbra
lPt1d[
dorr1aoo
ttta“iptwpotUt2cavam
ucTtmosctoitweaptoa(pbanffotl
D. Wandera et al. / Journal of Me
ives, as much as 98% of the material brought to the surface can beW. CBM wells, in contrast, produce a large volume of PW early inheir life and the volume declines over time. For example, between999 and 2001, the volume of PW generated per well in the Pow-er River Basin dropped from 396 bbl per day to 177 bbl per day4].
PW characteristics and physical properties vary considerablyepending on the geographical location of the field, compositionf the rocks surrounding the reservoir, the amount of time theocks and water react and the origin of the water entering theeservoir. The total dissolved solids (TDS) ranges from 200 mg/L to70,000 mg/L [5]. Recommended TDS for potable water is 500 mg/Lnd 1000–2000 mg/L for other beneficial uses such as stock pondsr irrigation. As a point of reference, average sea water has a TDSf 35,000 mg/L.
The proper management of PW is becoming a major issue forhe public and regulators due to the high volumes generated andhe disposal practices of many gas and oil companies. At the sameime, oil and gas producing areas, especially for CBM, are located inrid areas of the United States where questions arise concerning thewasting” of water through the generation and disposal of PW dur-ng production. Costs associated with PW management impact therofits of the oil and gas industry and potentially could halt produc-ion operations. In 2007, more than 98% of PW from onshore wellsas injected underground with approximately 59% injected intoroducing formations to maintain formation pressure and increaseutput, while another 40% was injected into nonproducing forma-ions for storage [2]. Injection of PW for storage in deep wells costs.S. $0.50–$1.75 per bbl in wells that cost U.S. $400,000–$3,000,000
o install [6]. Four percent of the total PW (onshore and offshore) in007 was surface discharged after some pre-treatment, which canause adverse effects to the environment [7]. Therefore, identifyingnd implementing appropriate beneficial uses for PW should pro-ide overwhelming benefits for local communities and ecosystemsnd provide oil and gas companies with flexible, cost-saving wateranagement options.Conventional wastewater treatment technologies such as coag-
lation, flocculation, air flotation and gravity separation normallyannot meet the high purity requirements for discharge of PW [8].here is a growing tendency to use membrane technology for PWreatment, and a number of studies have shown successful treat-
ent of oily water using membranes [1,9–13]. Distinct advantagesf membrane technology for treatment of PW include reducedludge, high quality permeate and the possibility of total recy-le water systems. These advantages, when considered along withhe small space requirements, moderate capital costs, and ease ofperation make membrane technology an economically compet-tive alternative or addition to traditional wastewater treatmentechnologies [10,13,14]. Although membranes can treat PW, theiridespread use is hindered by a decline in permeate flux experi-
nced as a result of fouling. The flux decline is due to the adsorptionnd accumulation of rejected oil, suspended solids and other com-onents in PW on the membrane surface (external fouling) and inhe membrane pores (internal fouling). Fouling can be irreversibler resistant to cleaning, hence making the original flux unrecover-ble. Physical cleaning techniques including membrane relaxationwhere filtration is paused) and membrane backwashing (whereermeate is pumped in the reverse direction through the mem-rane) have been incorporated in most membrane process designss standard operating strategies to limit fouling [15]. These tech-iques have been shown to be effective for dealing with reversible
ouling; however, they are less effective at limiting irreversibleouling. In addition to physical cleaning strategies, different typesf chemical cleaning have been recommended. However, the harshreatment procedure can damage the membrane and shorten itsife span.
ne Science 373 (2011) 178–188 179
In this article, we present an approach to control membranefouling during filtration of PW and to provide a chemical-freestrategy to reverse foulant accumulation. Commercial, regeneratedcellulose (RC) ultrafiltration membranes were surface modifiedby growing block copolymer nanolayers from the membrane sur-faces by surface-initiated atom transfer radical polymerization(ATRP). Our hypothesis is that by controlling both the chemical andenvironmentally responsive conformational properties of thesepolymer layers at the nano-scale, we will limit foulant accumula-tion on these membranes and provide an easy, chemical-free wayto remove any attached foulants. During ATRP, only surface boundradicals are formed; therefore, no radicals are co-produced in solu-tion. Hence, polymer chains grow from the surface only and nopolymer is co-produced in solution. As a controllable chain growthtechnique, ATRP allows for control of chain molecular weight(nanolayer thickness) to avoid pore filling [16]. Polymerization canbe stopped by removal of the membrane from solution and thenrestarted by placing the membrane back into solution and reiniti-ating polymer chains. The controlled nature of the polymerizationensures that a high percentage of polymer chains remain active forreinitiation. This feature makes ATRP highly attractive for prepar-ing block copolymers [17–20]. Modification can be done withinmembrane modules normally used for water purification since itis activated by a solution-phase catalyst. Our group [16,21–25] andothers [19,20,26–28] have used ATRP to graft polymers with con-trolled architectures from flat and porous membrane surfaces.
Membranes were modified by grafting poly(N-isopropylacrylamide) (PNIPAAm)-block-poly(oligoethylene glycolmethacrylate) (PPEGMA) nanolayers from the membrane surfaces.PNIPAAm exhibits a lower critical solution temperature (LCST)at 32 ◦C, as first reported by Heskins and Guillet [29]. PNIPAAmchains hydrate to form a random coil structure below LCST andcollapse to form a globular structure above LCST. Since its physicaland chemical properties are controlled easily by changing thetemperature, PNIPAAm is used widely to prepare temperature-responsive materials, including many examples with membranes[19,20,30]. Therefore, PNIPAAm was grafted from membranesurfaces to make them temperature responsive. Previous work byour group has shown that PPEGMA can be grafted by ATRP frompolyamide nanofiltration membranes to improve their antifoulingproperties [22]. Therefore, PPEGMA was grafted as the secondblock from PNIPAAm-modified membrane surfaces to improvetheir antifouling properties.
In previous work [22], our group used surface-initiated ATRPto graft block copolymers from commercial polyamide thin-filmnanofiltration membranes for produced water treatment. Oneproblem that was identified was the significant decrease of flux tounacceptable values due to modification. In this work, we set outto overcome that problem by moving to a more “open” ultrafiltra-tion base membrane. Modification of these UF membranes impartsresponsive chemistry to the surface and maintains high flux. Usinga more open membrane will allow optimization of water qualityversus permeate flux. We also switched the base material to regen-erated cellulose, which itself has good fouling resistance towardshydrophobic compounds.
Initial measurements were made to determine the thicknessevolution of the PNIPAAm nanolayers and to show that PNIPAAmchains remain active for relatively long polymerization times, mak-ing it possible to use polymerization time to adjust the nanolayerthickness while preserving some fraction of chain ends for subse-quent reinitiation to graft the PPEGMA block. These studies also
demonstrated the responsive nature of the PNIPAAm nanolayersand quantified the degree of layer swelling for grafted PNIPAAm.Thereafter, PNIPAAm-b-PPEGMA was grafted by surface-initiatedATRP from regenerated cellulose UF membranes. ATR-FTIR andAFM were used to characterize changes in the surface chemical
1 embra
fcw
2
2
i1BMto
sT
at(2>ln(dIa(S
((ia(pf
bpa
2s
2
foT((cw
atmsuwi
80 D. Wandera et al. / Journal of M
unctionality and roughness of membranes as a result of modifi-ation. Short- and long-term water flux measurements were doneith synthetic produced water.
. Experimental
.1. Materials
Commercial, composite ultrafiltration membranes with a nom-nal molecular weight cut-off (MWCO) of 5 kDa (Hydrosart,4429-47, 47 mm dia.) were purchased from Sartorius Stedimiotech. Commercial, composite UF membranes with a nominalWCO of 1000 kDa (PLCXK) were provided by Millipore Corpora-
ion. These membranes comprise a thin regenerated cellulose layern a polypropylene support.
Single-sided polished silicon wafers (1 cm × 3 cm) were used asubstrates for studying the kinetics of PNIPAAm polymerization.hese were purchased from Silicon Quest International.
The following chemicals were purchased from Sigma–Aldrichnd used as received unless stated otherwise: azobisisobu-yronitrile (AIBN, 98%), benzene (>99.5%), 2,2′-bipyridyl>99%), 2-bromoisobutyryl bromide (2-BIB, 98%), 2-bromo--methylpropionic acid (BPA, 98%), copper(I) chloride (CuCl,99.995%), copper(II) chloride (CuCl2, 99.99%), glycidyl methacry-ate (GMA, 95%), hydrogen peroxide (50% in water, ACROS),eutral aluminum oxide (∼150 mesh, 58 A), sodium chlorideNaCl, >99%), sulfuric acid (96% in water, ACROS), tris(2-imethylaminoethyl)amine (Me6TREN, >98%, ATRP Solutions,
nc.). HPLC grade solvents were purchased from Fisher Scientific,nd these included chloroform, methanol, methyl ethyl ketoneMEK), n-hexane, water, and tetrahydrofuran (THF, anhydrous).oybean oil (SO255) was purchased from Spectrum Chemicals.
Poly(ethylene glycol) methacrylate (PEGMA) macromonomerMn ≈ 360 g/mol) containing monomethyl ether hydroquinone650 ppm) inhibitor was purchased from Sigma–Aldrich. Thenhibitor was removed before use by passing the PEGMA through
column of neutral aluminum oxide. N-isopropylacrylamideNIPAAm, 97%) was purchased from Sigma–Aldrich and purifiedrior to use by dissolving it in benzene and then re-crystallizing itrom n-hexane.
Deionized (DI) water used for flux measurements was preparedy passing distilled water through a compact Milli-Q Integral waterurification system (Millipore Corporation) that was equipped with0.22 �m Millipax® sterile filter.
.2. Kinetic study of polymer nanolayer growth from siliconubstrates
.2.1. Preparation and activation of silicon substratesBefore use, the silicon wafers were cleaned in deionized water
or 30 min using an ultrasonic bath for agitation. To ensure thor-ugh cleaning, the deionized water was changed every 10 min.he clean wafers were then treated with a freshly prepared 3:1v/v) mixture of concentrated sulfuric acid and hydrogen peroxidepiranha solution, use with caution: highly reactive with organicompounds) for 1 h at 60 ◦C, rinsed thoroughly with deionizedater and then dried using a stream of high-purity nitrogen.
Surface activation with ATRP initiator groups was done usingprotocol described in detail previously [31]. Briefly, to begin
he surface activation process, a reactive layer of poly(glycidyl
ethacrylate) (PGMA) was deposited on the cleaned silicon sub-trates by dip coating from a 0.1 wt.% PGMA solution in chloroformsing a speed of 0.14 cm/s. The PGMA-coated silicon substratesere annealed for 30 min at 110 ◦C under vacuum (∼500 Pa). ATRP
nitiation sites were incorporated into the PGMA layer by reaction
ne Science 373 (2011) 178–188
with vapor-phase BPA at ∼130 Pa and 110 ◦C for 18 h. The ATRP-activated silicon substrates were soaked in chloroform for 10 min,rinsed with chloroform three times, and dried using a stream ofhigh-purity nitrogen.
2.2.2. Polymerization from activated silicon substratesSurface-initiated ATRP of PNIPAAm was carried out from
initiator groups on the activated silicon substrate. A typicalpolymerization solution comprised monomer, NIPAAm (50.0 mM,94.0 mg), dissolved in a 4:1 (v/v) solvent mixture of HPLC water andmethanol (16.7 mL). Other formulations were studied, and resultsare available in Supplemental Information. Before transferring thepolymerization solution to a nitrogen atmosphere glove box, thesolution was de-oxygenated by three cycles of freeze–pump–thaw.In the glove box, all components of the catalyst system wereadded to the de-oxygenated solution. Because the mass and vol-ume amounts of catalyst components were small, we prepared onelarge volume of catalyst solution for a use with a number of sam-ples. To improve the precision of volume measurements, we usedsyringes (Hamilton, Inc.) with range of 0–50 �L or 0–100 �L and aprecision of ±1 �L. In the sections that follow, we give the mass orvolume used per silicon substrate or membrane sample, along withthe final solution concentration of each component. Componentsof the catalyst included activator, CuCl (0.50 mM, 0.83 mg), deac-tivator, CuCl2 (0.10 mM, 0.22 mg), and ligand, Me6TREN (1.2 mM,5.5 �L). A previously activated silicon substrate was then placed inthe solution to begin polymerization. PNIPAAm polymerization wascarried out at room temperature for times up to 60 min. PNIPAAm-grafted silicon substrates were removed from the polymerizationsolution at fixed time intervals, thoroughly washed with methanoland HPLC water and then dried using a stream of nitrogen.
2.3. Membrane modification
Scheme 1 illustrates the three step procedure to modify aregenerated cellulose membrane with PNIPAAm-b-PPEGMA bysurface-initiated ATRP. ATRP initiator molecules were attachedto the membrane, and then surface-initiated ATRP was done tograft PNIPAAm chains from the initiator groups. PPEGMA was thengrafted as the second polymer block by re-initiation of PNIPAAmchains.
2.3.1. Membrane activationThe membranes were immersed in methanol for 15 min to
remove glycerin, which is used as a structural preservative forthese membranes; rinsed thoroughly with HPLC water to removemethanol; and then equilibrated with THF. Membranes wereremoved from the THF, dried with a stream of nitrogen, and trans-ferred into the glove box. Membrane activation (i.e., incorporationof ATRP initiator groups) was done according to Bhut et al. [21].After activation, the membranes were removed from the solution,washed thoroughly with THF and HPLC water and stored in THFuntil polymerization.
2.3.2. Polymerization from activated membranesSurface-initiated ATRP of PNIPAAm was carried out from initia-
tor groups on the activated membrane surface. The polymerizationformulation and protocol were the same as that used for sil-icon substrates. PNIPAAm polymerization was carried out atroom temperature for 1 h. PNIPAAm-modified membranes wereremoved from the polymerization solution, thoroughly washed
with methanol and HPLC water and stored in methanol.For modification with block copolymer nanolayers, PPEGMAwas grafted from the PNIPAAm-modified membranes. The poly-merization solution comprised monomer, PEGMA (0.10 M, 1.6 mL)dissolved in a 4:1 (v/v) solvent mixture of HPLC water and methanol

D. Wandera et al. / Journal of Membrane Science 373 (2011) 178–188 181
of PN
(gaarptwntwmPPta
2
pmmatsiususm
tC3lt
foulants that had accumulated on the membrane surface duringthe first filtration step. Control measurements were done with awarm water (45 ◦C) rinse.
Long-term cross-flow (CF) membrane filtration experimentsusing our model synthetic PW were carried out using a high
Table 1Characteristics of model synthetic produced water.
Scheme 1. Surface-initiated ATRP
50 mL). The solution was de-oxygenated and transferred to thelove box, where all components of the catalyst system weredded. These included CuCl (0.50 mM), CuCl2 (0.10 mM) and lig-nd, 2,2′-bipyridyl (1.2 mM). A PNIPAAm-modified membrane wasemoved from methanol, dried and placed into the solution to beginolymerization. PPEGMA polymerization was carried out at roomemperature for 3 h. This protocol was followed based on previousork from our group on the surface-initiated growth of PPEGMAanolayers at room temperature from silicon substrates [16]. Fromhe silicon surfaces, the growth rates of PNIPAAm and PPEGMAere 54 and 0.48 nm/h, respectively. Thus, a 1 h PNIPAAm poly-erization yields a layer thickness of about 54 nm, while a 3 h
PEGMA polymerization yields a layer thickness of about 1.4 nm.NIPAAm-b-PPEGMA modified membranes were removed fromhe polymerization solution, thoroughly washed with methanolnd HPLC water and stored in DI water.
.4. Water flux measurements
A model, synthetic produced water was prepared to test theerformance of pristine and modified membranes through fluxeasurements. The synthetic produced water was prepared byixing soybean oil (5.44 mL), NaCl (500 mg), and DI water (1 L)
nd stirring the mixture with a magnetic stir bar (3/8 in. diame-er, 2 in. length) in a 1 L flat-bottom Erlenmeyer flask at a constantpeed of 600 rpm at 60 ◦C for 24 h. Soybean oil was used because its commercially available with consistent properties. Experimentssing soybean oil are therefore highly reproducible. Using the den-ity of the soybean oil (0.919 g/mL) and the volume of soybean oilsed (5.44 mL/L), we calculated the mass of dispersed oil in ourynthetic model solution. Table 1 gives the characteristics of theodel, synthetic produced water.Water flux measurements were carried using 45 mm diame-
er membranes. A stirred ultrafiltration cell (model 8050, Milliporeorporation) was modified to increase the volumetric capacity to00 mL by increasing the height of the cylinder. Membranes were
oaded into the cell, which was filled with 300 mL of the syn-hetic produced water. The cell was connected to a nitrogen gas
IPAAm-b-PPEGMA from cellulose.
cylinder via high-pressure tubing. The system was placed on a mag-netic stirring plate, which provided constant agitation at a speedof ∼320 rpm during filtration. A constant pressure of 207 kPa wasused for all of the experiments. The filtration cell was filled withfresh feed at 45 ◦C every 5 min to maintain a constant feed tem-perature during the course of the 60 min filtration experiment. Weused warm (45 ◦C) PW because it is common for PW coming out ofdeep oil wells to be warm (above 40 ◦C). Permeate was collected ina beaker when the permeate outlet was opened, and the mass ofpermeate collected over time was measured using a balance. Per-meate flux was calculated using Eq. (1), where M is the mass ofpermeate collected, � is the density, A is the effective membranefiltration area, and t is the time:
Permeate flux = M/P
At(1)
The experimental procedure for the filtration experimentsincluded carrying out a warm (45 ◦C) produced water filtration for60 min, rinsing the membrane with cold (15 ◦C) DI water, and carry-ing out another warm produced water filtration for 30 min. Rinsingthe membrane was done by filling the filtration cell containing themembrane with cold DI water and stirring for 5 min. The rinse solu-tion was discarded from the cell, and the cell was filled again withwarm produced water. This sequence of measurements was doneto study the effectiveness of a cold water rinse at detaching any
Parameter Value
Dispersed oil 5000 mg/LConductivity 1108 �s/cmTotal dissolved solids (TDS) 543 mg/LTotal organic carbon (TOC) 82.23 mg/L
1 embra
pt1aum(atv
2
2
nthwt5ems
ttscabrotAw[
2
tpbTdp
2
csI((aRiTds
siP
82 D. Wandera et al. / Journal of M
ressure Septa® CF II medium/high foulant membrane cell sys-em (GE Osmonics). The membrane cell system accommodates a9 cm × 14 cm flat sheet membrane with an effective membranerea of 140 cm2. The system was operated in recirculation modesing a Hydra-Cell pump (Wanner Engineering, Inc.). All experi-ents were carried out using a constant transmembrane pressure
TMP) and temperature of 414 kPa and 50 ◦C. The system was oper-ted for at least 1 h before any permeate flux measurements wereaken. Permeate flux values were calculated from the permeateolumes collected at different times.
.5. Characterization
.5.1. EllipsometryMulti-angle ellipsometry was used to measure the dry
anolayer (PNIPAAm) thickness on the silicon substrates as a func-ion of polymerization time. Measurement and instrument detailsave been described elsewhere [31]. A refractive index of 1.525as used for PGMA, 1.500 for BPA, 1.460 for PNIPAAm layers less
han 50 nm thick and 1.470–1.490 for PNIPAAm layers greater than0 nm thick [32]. Measurements were done at three locations forach sample and the data represent average values among the threeeasurements. In all cases, the coefficient of variance for the ellip-
ometric measurements was ≤3.5%.Solvent-swollen layer thicknesses were measured as a func-
ion of temperature to analyze the temperature responsiveness ofhe grafted PNIPAAm layers. For these measurements, the siliconubstrates were placed inside a specially designed cylindrical flowell (Beaglehole Instruments) and contacted with solvent (water)t different temperatures supplied by a temperature-controlledath. Data fitting was done using a fixed, temperature-dependentefractive index for the solvent and allowing the refractive indexf the polymer nanolayer to vary. Both the refractive index ofhe nanolayer and its thickness were used as fitting parameters.dditional details of the flow cell and measurement procedureere given in the Supplemental Information of Samadi et al.
31].
.5.2. ATR-FTIRAttenuated total reflectance Fourier-transform infrared spec-
roscopy (ATR-FTIR) was used to characterize surface chemicalroperties of the unmodified, PNIPAAm-modified and PNIPAAm--PPEGMA-modified membranes. Spectra were obtained using ahermo-Nicolet Magna 550 FTIR spectrometer equipped with aiamond ATR accessory. Measurements were done according to arocedure detailed elsewhere [24].
.5.3. AFMAtomic force microscopy (AFM) was used to characterize the
hanges in the surface topography and morphology of the siliconubstrates and membranes resulting from surface modification.mages of the dry samples were obtained using a BioScope AFMVeeco) with a NanoScope IIIA controller and a silicon cantileverMikroMasch, NSC15/Si3N4/AIBS). Tapping mode AFM was donet a frequency of 1.0 Hz, and 256 scans were taken per image.oot-mean square (RMS) surface roughness of the 1.0 �m × 1.0 �m
mages was calculated using NanoScope software version 5.12.hree scans were done at three different places on the same 45 mmiameter membrane for unmodified and modified membranes. The
tandard deviation among roughness values was ±0.1 nm.AFM images also were collected for PNIPAAm-modified siliconubstrates in water at different temperatures using contact moden order to analyze the temperature responsiveness of the graftedNIPAAm layers.
ne Science 373 (2011) 178–188
2.6. Water quality analysis
2.6.1. Conductivity and TDSThe conductivity and total dissolved solids (TDS) concentra-
tion of the feed and permeate were measured using a multipleparameter SympHonyTM meter (VWR). Salt concentrations weredetermined by measuring electrical conductivities and using a stan-dard calibration; TDS was used as an indicator of the total amountof inorganic foulant material in the water.
2.6.2. TOCTotal organic carbon (TOC) concentrations of the feed and per-
meate were determined using a high temperature total organiccarbon analyzer (Shimadzu TOC-VCSH) that operates on a catalyticcombustion method. Details about the instrument and operatingconditions have been provided previously [33].
3. Results and discussion
3.1. Kinetics of surface-initiated ATRP of PNIPAAm
To study the thickness evolution of the grafted polymer nanolay-ers and to understand how different conditions influence polymergrowth, a kinetic study of the surface-initiated ATRP of PNIPAAmwas conducted using silicon substrates. Experiments were carriedout for PNIPAAm only, as a kinetic study of surface-initiated ATRPof PPEGMA was conducted by our group previously [16]. Data fromthis part of the study were used to guide membrane modificationwork. The modified silicon surfaces were characterized by ellip-sometry to measure nanolayer thickness versus polymerizationtime. AFM was used to determine changes in the surface topog-raphy and roughness of the silicon substrates. The reason siliconsubstrates were used is that ellipsometry cannot be used for directmeasurements on the membranes.
Silicon substrates were activated by coating with PGMA andthen functionalizing the PGMA with an ATRP initiator. Thisprocedure was done to create a surface that mimics the three-dimensional nature of the membrane ‘surface’. In a previous workfrom our group [25], it has been noted that PGMA on flat siliconsubstrates offers a more appropriate model than self-assembledmonolayers for characterizing polymer growth kinetics, as it gen-erates high initiator densities that better reflect the true nature ofinitiator incorporation within the membrane structure.
After annealing the PGMA-coated silicon substrates, the PGMAdry layer thicknesses were measured to be 6.0 ± 0.2 nm. Theuncertainty represents the standard deviation in thickness amongmultiple locations on the silicon substrate surfaces. After incorpo-ration of initiator groups, the dry layer thicknesses increased to9.0 ± 0.5 nm. This increase in thickness indicates clearly that masswas added to the layer. Using the difference in these values, we esti-mated the density of initiator sites to be 15 ± 2 initiator moleculesper nm2.
Fig. 1 shows the increase in PNIPAAm dry layer thickness asa function of time following surface-initiated ATRP. These resultsshow that the rate of PNIPAAm growth increased with increasingmonomer concentration from 0.01 M to 0.05 M, which is a charac-teristic of surface-initiated ATRP.
A well-documented characteristic of controlled, surface-initiated ATRP from a low surface area substrate is a linearrelationship between polymer layer thickness and time. As seenin Fig. 1, our polymerization protocol did not yield well-controlled
growth. We conducted a control study in which fresh catalystwas added to the polymerization system once the layer thicknessreached a plateau value. No additional growth was observed; hence,we attribute the nonlinear growth to chain termination and notcatalyst deactivation.
D. Wandera et al. / Journal of Membra
0
20
40
60
706050403020100
Thi
ckne
ss (
nm)
Time (min)
[NIPAAm] = 0.01 M
[NIPAAm] = 0.05 M
Fsi
ecmtfwtIrsmUfs
a temperature range of 20–35 ◦C, with the majority of the transi-
Fs
ig. 1. Dependence of dry polymer layer thickness on polymerization time forurface-initiated ATRP of PNIPAAm from initiator-functionalized, PGMA-coated sil-con substrates.
While well-controlled growth would improve the reinitiationfficiency of PPEGMA in block copolymer nanolayers, our resultslearly show that the chains remain active for relatively long poly-erization times, and, hence, it is possible to use polymerization
ime to adjust the PNIPAAm layer thickness and still preserve someraction of chain ends for subsequent reinitiation. Significant effortas made to vary the polymerization conditions and formulation
o improve control. Results are presented in the Supplementalnformation. In one experiment, we used the same formulation andeaction conditions as Masci et al. [34], who reported controlledolution-phase polymerization of PNIPAAm by ATRP in a 50:50 (v/v)
ixed solvent system of dimethylformamide and water at 20 ◦C.sing their formulation for surface-initiated ATRP of PNIPAAmailed to give controlled growth. It is not completely surprising toee such differences between solution-phase and surface-initiated
ig. 2. AFM topographical images (1 �m × 1 �m) of PNIPAAm nanolayers on silicon suburface, RMS roughness = 0.6 nm.
ne Science 373 (2011) 178–188 183
ATRP, since higher chain density on the surface leads to higherprobability for chain termination [35].
Surface topography and roughness of the silicon substratesbefore and after modification were determined by AFM. Fig. 2shows representative 1 �m × 1 �m topographical images of theunmodified and PNIPAAm-modified silicon surface. The RMSroughness value increased from 0.4 nm for unmodified surfaces(Fig. 2A) to 0.6 nm for surfaces modified for 1 h with NIPAAm atconcentration of 0.1 M (Fig. 2B). Tu et al. [32] fabricated patternedPNIPAAm brushes on oxidized silicon wafers by surface-initiatedATRP from a micro-patterned initiator and obtained RMS surfaceroughness of 2–4 nm from AFM topographical analysis. Cheng et al.[36] used plasma polymerization to surface immobilize PNIPAAmon silicon wafers and the surface RMS roughness at 25 ◦C was5.3 ± 1.1 nm. Therefore, the low surface roughness values are con-sistent with the findings from other groups, and it appears that ourATRP protocol provides somewhat smoother surfaces than foundpreviously.
3.2. Temperature responsiveness of PNIPAAm nanolayers onsilicon substrate
Ellipsometry swelling measurements were conducted to inves-tigate thickness responsiveness to temperature change of thePNIPAAm nanolayers grafted from the silicon substrates. AFMphase imaging was used to visualize the temperature respon-siveness of these nanolayers. The measurements were done inwater, such that the grafted polymer chains would be solvated.Ellipsometry data in Fig. 3 show that the PNIPAAm nanolayerresponded to temperature change; the swollen polymer layerthickness decreased with increasing temperature. The LCST tran-sition occurs over a broad temperature range (25–40 ◦C), yet it isknown that the LCST for PNIPAAm in water occurs within ±2 ◦Cof 32 ◦C [37]. This result also was observed by Tu et al. [32] whoreported a broad LCST transition for surface grafted PNIPAAm over
tion occurring between 28 and 32 ◦C. For surface grafted chains,the high grafting density leads to strong inter-chain interactionsand these affect the observed LCST. Due to the strong inter-chaininteractions, the observed LCST is not truly a second-order tran-
strates. (A) Unmodified surface, RMS roughness = 0.4 nm. (B) PNIPAAm-modified
184 D. Wandera et al. / Journal of Membra
90
100
110
120
130
140
55453525
Swol
len
PN
IPA
Am
Thi
ckne
ss (
nm)
Fs
ssg4wt
Piwhtc
e�T[of
N
vuTdecSwr
�
Td
Temperature (°C)
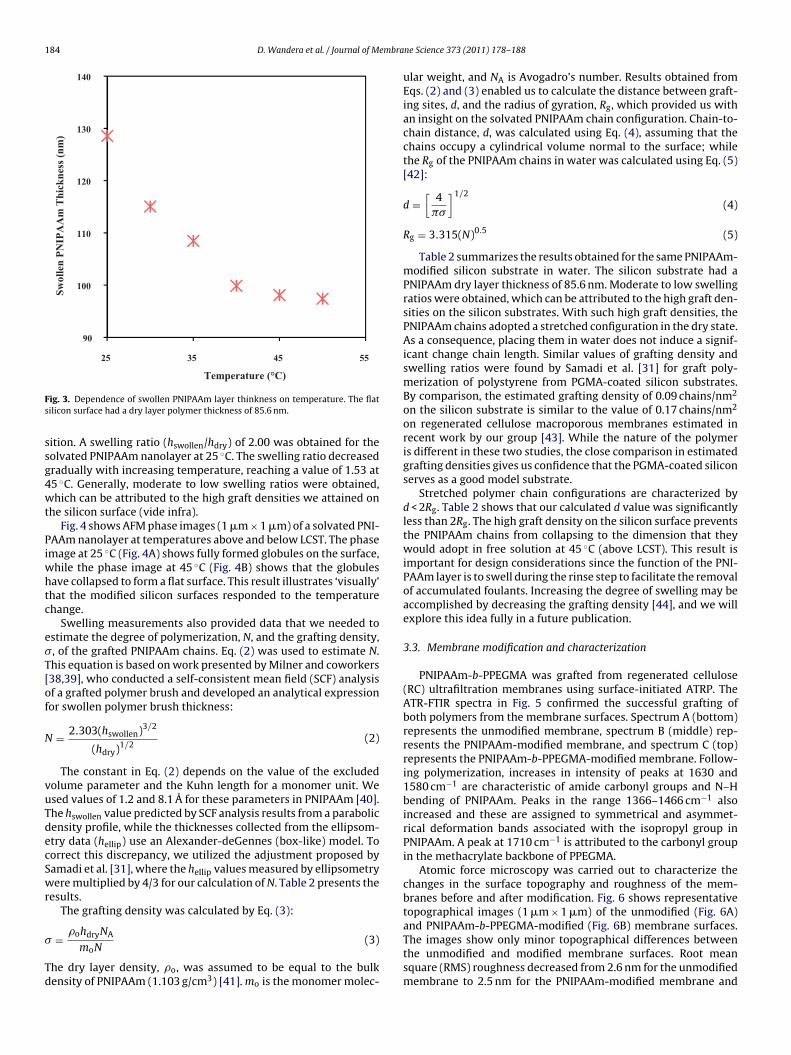
ig. 3. Dependence of swollen PNIPAAm layer thinkness on temperature. The flatilicon surface had a dry layer polymer thickness of 85.6 nm.
ition. A swelling ratio (hswollen/hdry) of 2.00 was obtained for theolvated PNIPAAm nanolayer at 25 ◦C. The swelling ratio decreasedradually with increasing temperature, reaching a value of 1.53 at5 ◦C. Generally, moderate to low swelling ratios were obtained,hich can be attributed to the high graft densities we attained on
he silicon surface (vide infra).Fig. 4 shows AFM phase images (1 �m × 1 �m) of a solvated PNI-
AAm nanolayer at temperatures above and below LCST. The phasemage at 25 ◦C (Fig. 4A) shows fully formed globules on the surface,
hile the phase image at 45 ◦C (Fig. 4B) shows that the globulesave collapsed to form a flat surface. This result illustrates ‘visually’hat the modified silicon surfaces responded to the temperaturehange.
Swelling measurements also provided data that we needed tostimate the degree of polymerization, N, and the grafting density,, of the grafted PNIPAAm chains. Eq. (2) was used to estimate N.his equation is based on work presented by Milner and coworkers38,39], who conducted a self-consistent mean field (SCF) analysisf a grafted polymer brush and developed an analytical expressionor swollen polymer brush thickness:
= 2.303(hswollen)3/2
(hdry)1/2(2)
The constant in Eq. (2) depends on the value of the excludedolume parameter and the Kuhn length for a monomer unit. Wesed values of 1.2 and 8.1 A for these parameters in PNIPAAm [40].he hswollen value predicted by SCF analysis results from a parabolicensity profile, while the thicknesses collected from the ellipsom-try data (hellip) use an Alexander-deGennes (box-like) model. Toorrect this discrepancy, we utilized the adjustment proposed byamadi et al. [31], where the hellip values measured by ellipsometryere multiplied by 4/3 for our calculation of N. Table 2 presents the
esults.The grafting density was calculated by Eq. (3):
= �ohdryNA
moN(3)
he dry layer density, �o, was assumed to be equal to the bulkensity of PNIPAAm (1.103 g/cm3) [41]. mo is the monomer molec-
ne Science 373 (2011) 178–188
ular weight, and NA is Avogadro’s number. Results obtained fromEqs. (2) and (3) enabled us to calculate the distance between graft-ing sites, d, and the radius of gyration, Rg, which provided us withan insight on the solvated PNIPAAm chain configuration. Chain-to-chain distance, d, was calculated using Eq. (4), assuming that thechains occupy a cylindrical volume normal to the surface; whilethe Rg of the PNIPAAm chains in water was calculated using Eq. (5)[42]:
d =[
4��
]1/2(4)
Rg = 3.315(N)0.5 (5)
Table 2 summarizes the results obtained for the same PNIPAAm-modified silicon substrate in water. The silicon substrate had aPNIPAAm dry layer thickness of 85.6 nm. Moderate to low swellingratios were obtained, which can be attributed to the high graft den-sities on the silicon substrates. With such high graft densities, thePNIPAAm chains adopted a stretched configuration in the dry state.As a consequence, placing them in water does not induce a signif-icant change chain length. Similar values of grafting density andswelling ratios were found by Samadi et al. [31] for graft poly-merization of polystyrene from PGMA-coated silicon substrates.By comparison, the estimated grafting density of 0.09 chains/nm2
on the silicon substrate is similar to the value of 0.17 chains/nm2
on regenerated cellulose macroporous membranes estimated inrecent work by our group [43]. While the nature of the polymeris different in these two studies, the close comparison in estimatedgrafting densities gives us confidence that the PGMA-coated siliconserves as a good model substrate.
Stretched polymer chain configurations are characterized byd < 2Rg. Table 2 shows that our calculated d value was significantlyless than 2Rg. The high graft density on the silicon surface preventsthe PNIPAAm chains from collapsing to the dimension that theywould adopt in free solution at 45 ◦C (above LCST). This result isimportant for design considerations since the function of the PNI-PAAm layer is to swell during the rinse step to facilitate the removalof accumulated foulants. Increasing the degree of swelling may beaccomplished by decreasing the grafting density [44], and we willexplore this idea fully in a future publication.
3.3. Membrane modification and characterization
PNIPAAm-b-PPEGMA was grafted from regenerated cellulose(RC) ultrafiltration membranes using surface-initiated ATRP. TheATR-FTIR spectra in Fig. 5 confirmed the successful grafting ofboth polymers from the membrane surfaces. Spectrum A (bottom)represents the unmodified membrane, spectrum B (middle) rep-resents the PNIPAAm-modified membrane, and spectrum C (top)represents the PNIPAAm-b-PPEGMA-modified membrane. Follow-ing polymerization, increases in intensity of peaks at 1630 and1580 cm−1 are characteristic of amide carbonyl groups and N–Hbending of PNIPAAm. Peaks in the range 1366–1466 cm−1 alsoincreased and these are assigned to symmetrical and asymmet-rical deformation bands associated with the isopropyl group inPNIPAAm. A peak at 1710 cm−1 is attributed to the carbonyl groupin the methacrylate backbone of PPEGMA.
Atomic force microscopy was carried out to characterize thechanges in the surface topography and roughness of the mem-branes before and after modification. Fig. 6 shows representativetopographical images (1 �m × 1 �m) of the unmodified (Fig. 6A)
and PNIPAAm-b-PPEGMA-modified (Fig. 6B) membrane surfaces.The images show only minor topographical differences betweenthe unmodified and modified membrane surfaces. Root meansquare (RMS) roughness decreased from 2.6 nm for the unmodifiedmembrane to 2.5 nm for the PNIPAAm-modified membrane and
D. Wandera et al. / Journal of Membrane Science 373 (2011) 178–188 185
Fig. 4. AFM phase images (1 �m × 1 �m) of PNIPAAm-modified silicon surface in water at 25 ◦C (A) and at 45 ◦C (B).
Table 2Swelling experiment results for PNIPAAm nanolayers grafted from silicon substrates.
Temperature (◦C) hdry (nm) hellip (nm) hswollen (nm) N Rg (nm) � (chains/nm2) d (nm) Swelling ratio
25 85.6 128.6 171.4 5600 25 0.090 3.8 2.0030 85.6 115.1 153.4 1.79
tglOiost[
Fboco
35 85.6 108.5 144.640 85.6 99.9 133.245 85.6 98.1 130.850 85.6 97.4 129.9
o 1.7 nm for the PNIPAAm-b-PPEGMA-modified membrane. Ourroup previously has observed decreased surface roughness fol-owing modification of microporous membranes by ATRP [21,24].ther groups also have reported that surface-initiated polymer-
zation tends to make rougher surfaces smoother [45,46]. Thisbservation is particularly important since earlier studies havehown that decreasing surface roughness leads to less adsorp-ion of organic compounds and, hence, decreases surface fouling1]. Results have shown that colloidal fouling of reverse osmosis
ig. 5. ATR-FTIR spectra for (A, bottom) unmodified regenerated cellulose UF mem-rane, (B, middle) membrane following modification with NIPAAm at concentrationf 0.1 M for 1 h, and (C, top) membrane following modification with NIPAAm at con-entration of 0.1 M for 1 h followed by modification with PEGMA at concentrationf 0.1 M for 3 h.
1.691.561.531.52
and nanofiltration membranes is correlated nearly perfectly withmembrane surface roughness in all cases, regardless of physicaland chemical operating conditions. Colloidal particles (foulants)accumulate preferentially in valleys of relatively open and roughmembrane surfaces causing valley clogging and increasing resis-tance to water transport [47].
3.4. Membrane performance
Performance of the surface-modified membranes was evalu-ated by carrying out permeate flux experiments using syntheticproduced water. The reason to use synthetic PW was to ensureconstant properties that allow repeatable testing of membranes.Many possibilities exist for developing an artificial PW. Our solu-tion was developed to have representative values for oil content,conductivity and TDS. Having said that, the properties of producedwater vary and depend on the geography, geological formation,and type of hydrocarbon produced by the field (oil production, coalbed methane production). PW properties also may change duringthe lifetime of the reservoir. Components may include dispersedoil, soluble organics (PAHs, phenols, organic acids, etc.), treatmentchemicals (corrosion inhibitors, scale inhibitors, biocides, emul-sion breakers, etc.), carbonate and sulfate salts, silicates, bacteria,metals, etc. The USGS has established a database of analyzed PWs[48].
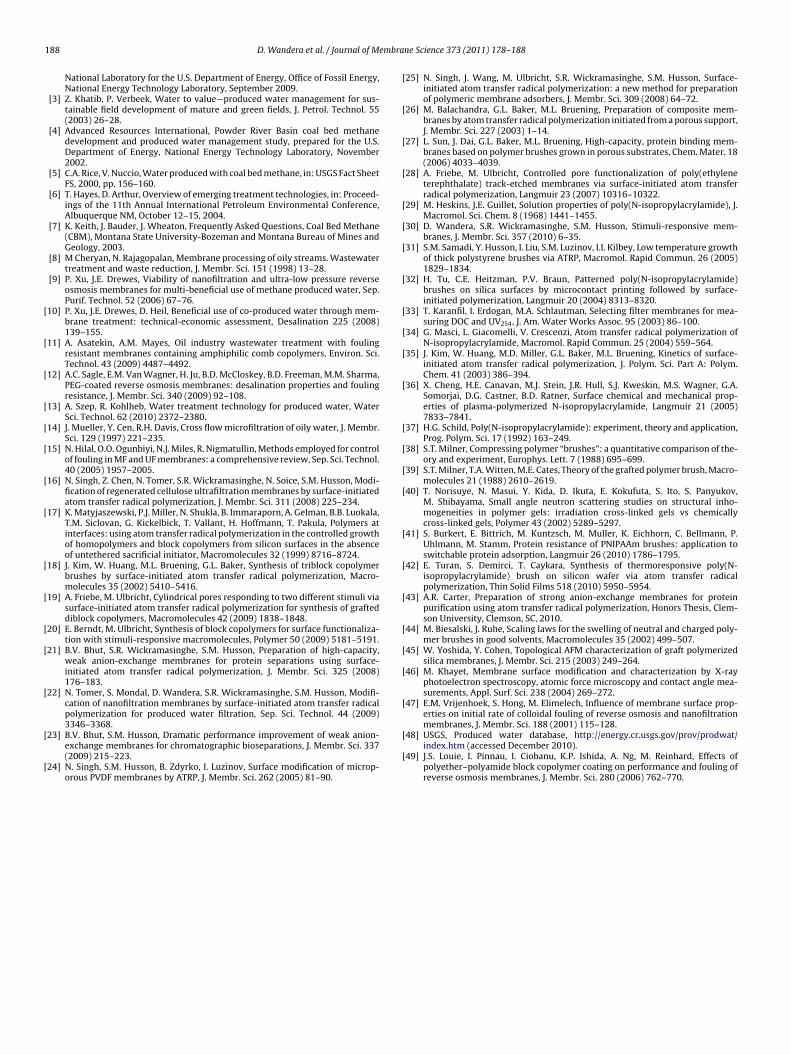
Synthetic produced water composed of soybean oil, NaCl andwater was used to measure the flux of the unmodified and
surface-modified RC UF membranes at 207 kPa. Fig. 7 shows dataon flux versus filtration time for unmodified, PNIPAAm-modifiedand PNIPAAm-b-PPEGMA-modified membranes. To study howeffective cold DI water was at detaching any foulants that had accu-mulated on the membrane surface during the first filtration run,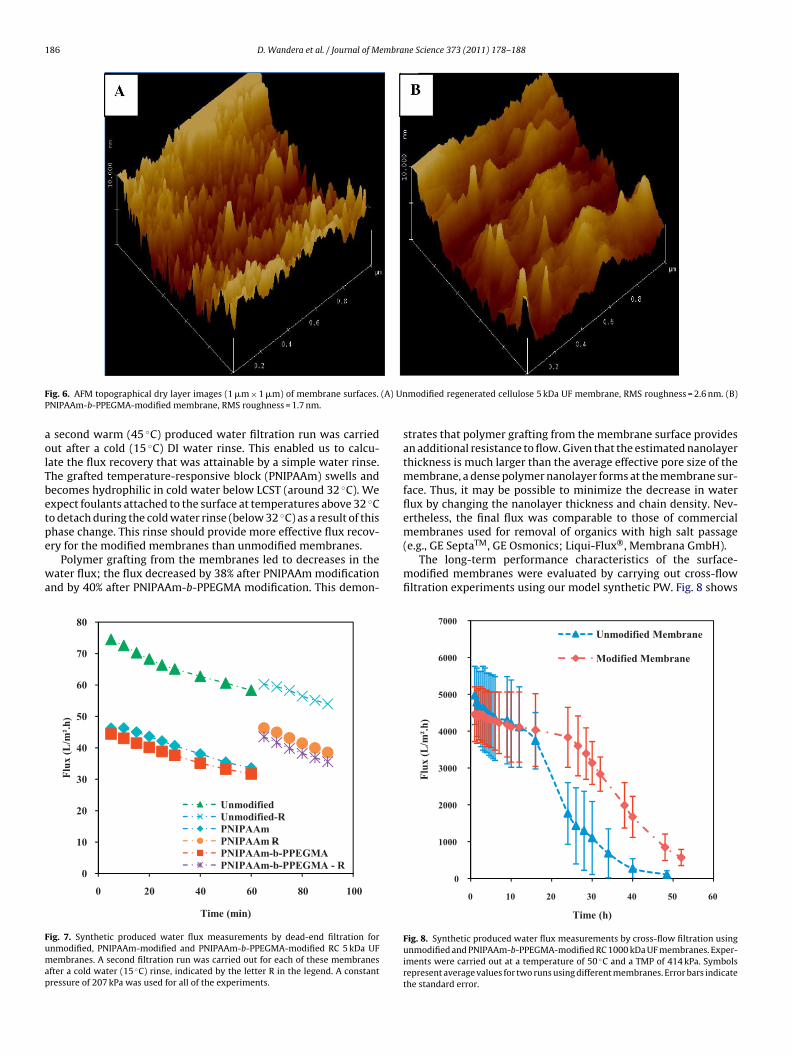
186 D. Wandera et al. / Journal of Membrane Science 373 (2011) 178–188
F (A) UnP
aolTbetpe
wa
Fumap
ig. 6. AFM topographical dry layer images (1 �m × 1 �m) of membrane surfaces.NIPAAm-b-PPEGMA-modified membrane, RMS roughness = 1.7 nm.
second warm (45 ◦C) produced water filtration run was carriedut after a cold (15 ◦C) DI water rinse. This enabled us to calcu-ate the flux recovery that was attainable by a simple water rinse.he grafted temperature-responsive block (PNIPAAm) swells andecomes hydrophilic in cold water below LCST (around 32 ◦C). Wexpect foulants attached to the surface at temperatures above 32 ◦Co detach during the cold water rinse (below 32 ◦C) as a result of this
hase change. This rinse should provide more effective flux recov-ry for the modified membranes than unmodified membranes.Polymer grafting from the membranes led to decreases in theater flux; the flux decreased by 38% after PNIPAAm modification
nd by 40% after PNIPAAm-b-PPEGMA modification. This demon-
0
10
20
30
40
50
60
70
80
100806040200
Flu
x (L
/m².h
)
Time (min)
UnmodifiedUnmodified-RPNIPAAm
RPNIPAAm -PNIPAAm-b-PPEGMAPNIPAAm-b-PPEGMA - R
ig. 7. Synthetic produced water flux measurements by dead-end filtration fornmodified, PNIPAAm-modified and PNIPAAm-b-PPEGMA-modified RC 5 kDa UFembranes. A second filtration run was carried out for each of these membranes
fter a cold water (15 ◦C) rinse, indicated by the letter R in the legend. A constantressure of 207 kPa was used for all of the experiments.
modified regenerated cellulose 5 kDa UF membrane, RMS roughness = 2.6 nm. (B)
strates that polymer grafting from the membrane surface providesan additional resistance to flow. Given that the estimated nanolayerthickness is much larger than the average effective pore size of themembrane, a dense polymer nanolayer forms at the membrane sur-face. Thus, it may be possible to minimize the decrease in waterflux by changing the nanolayer thickness and chain density. Nev-ertheless, the final flux was comparable to those of commercial
membranes used for removal of organics with high salt passage(e.g., GE SeptaTM, GE Osmonics; Liqui-Flux®, Membrana GmbH).The long-term performance characteristics of the surface-modified membranes were evaluated by carrying out cross-flowfiltration experiments using our model synthetic PW. Fig. 8 shows
0
1000
2000
3000
4000
5000
6000
7000
6050403020100
Flu
x (L
/m².h
)
Time (h)
Unmodified Membrane
Modified Membrane
Fig. 8. Synthetic produced water flux measurements by cross-flow filtration usingunmodified and PNIPAAm-b-PPEGMA-modified RC 1000 kDa UF membranes. Exper-iments were carried out at a temperature of 50 ◦C and a TMP of 414 kPa. Symbolsrepresent average values for two runs using different membranes. Error bars indicatethe standard error.

D. Wandera et al. / Journal of Membrane Science 373 (2011) 178–188 187
Table 3Permeate quality after filtration of synthetic produced water using unmodified, PNIPAAm-modified and PNIPAAm-b-PPEGMA-modified RC 5 kDa membranes.
Membrane Conductivity(�S/cm)
TDS (mg/L) TOC (mg/L) TOC removal (%)
Unmodified 1038 508 4.91 94.02502500
sbmvAatueaettutm4cctattaci(abfi
mfPwwflflstsaf
aPmitwtihmet
PNIPAAm 1024PNIPAAm-b-PPEGMA 1021
ynthetic PW flux measurements (permeate flux versus time)y cross-flow filtration for unmodified and PNIPAAm-b-PPEGMA-odified RC 1000 kDa UF membranes. Symbols represent average
alues measured for two runs using two different membranes.ll experiments were carried out at a temperature of 50 ◦C andTMP of 414 kPa. Not surprisingly, permeate flux at the start of
he experiment was lower for the modified membrane than for thenmodified membrane. However, the modified membrane experi-nced a slower rate of flux decline than the unmodified membrane,nd, as a result, the instantaneous fluxes of both membranes werequal after 12 h. Permeate fluxes through both membranes con-inued to decline, but, after this cross-over point, permeate fluxhrough the modified membrane always exceeded flux through thenmodified membrane. The total volume of permeate processedhrough modified membrane was 13.8% more than the total per-
eate that was processed through the unmodified membrane after0 h of operation. Clearly, the modified membrane allowed higherumulative volumes of water to be processed over time prior toleaning. This same observation was made by Louie et al. [49] inheir work on physical coating of reverse osmosis membranes withpolyether–polyamide block copolymer (PEBAX®). They reported
hat despite the significant flux loss observed post modification,he modified membranes showed slower flux decline over timend allowed for higher cumulative volumes of water to be pro-essed. Percentage flux decline for the block copolymer nanolayers lower than the PNIPAAm layer alone. When carrying out warm45 ◦C) water filtration runs, we expect the PNIPAAm to collapsend become hydrophobic; thus, PPEGMA, which is the upperlock, is important for suppression of foulant attachment duringltration.
Our results also showed that the flux recovery was better for theodified membranes after a cold water rinse. The flux recovered
ully to initial values for both the PNIPAAm- and PNIPAAm-b-PEGMA-modified membranes; while only ∼81% of the initial fluxas recovered for the unmodified membrane. Control experimentsith a warm water rinse (above LCST for PNIPAAm) yielded lowerux recoveries than results with the cold water rinse. The highux recovery for the unmodified membranes was not surprisingince the regenerated cellulose layer is hydrophilic and resistanto irreversible fouling. It also should be noted from our AFM mea-urements that all three membranes had low surface roughness,
characteristic that should lead to less adsorption of organicoulants.
Table 3 shows results of the permeate quality measurementsfter filtration of our synthetic produced water using unmodified,NIPAAm-modified and PNIPAAm-b-PPEGMA-modified RC 5 kDaembranes. All three membranes yielded poor salt rejection as
ndicated by the high permeate conductivity and TDS concentra-ions. Ultrafiltration membranes are not used for salt rejection inater treatment applications, and, as we discovered, even reducing
he average effective pore size through membrane surface mod-
fication did not improve their salt rejection. TOC removal wasigh; removal efficiencies were higher than 94% for all the threeembranes. The significance of the differences in the TOC removalfficiencies of the unmodified and modified membranes was rela-ively small.
3.30 95.992.02 97.54
4. Conclusions
We have demonstrated that by grafting PNIPAAm-b-PPEGMAnanolayers from regenerated cellulose membranes we can changethe membrane surface properties in ways that limit foulant accu-mulation on these membranes and provide an easy, chemical-freeway to remove any attached foulants. The dual functionality pro-vided by this block copolymer system yields fouling-resistantand temperature-responsive membranes for the treatment of oilywater.
Surface-initiated polymerization of PNIPAAm from silicon sub-strates that were designed to mimic a polymeric membrane surfaceshowed that PNIPAAm chains remain active for relatively long poly-merization times, and, hence, it is possible to use polymerizationtime to adjust the nanolayer thickness and still preserve some frac-tion of chain ends for subsequent reinitiation. These studies alsodemonstrated the responsive nature of the PNIPAAm nanolayersand quantified the degree of layer swelling for grafted PNIPAAm.
PNIPAAm-b-PPEGMA was grafted by surface-initiated ATRPfrom regenerated cellulose UF membranes. ATR-FTIR spectra con-firmed the successful grafting of both polymers from the membranesurface. From AFM topographical images, we observed that themembrane surface roughness decreased following PNIPAAm-b-PPEGMA modification.
Polymer grafting led to decreases in the water flux but themodified membranes showed slower flux decline over time. Themodified membranes allowed higher cumulative volumes of waterto be processed over time prior to cleaning. Flux recovery wasbetter for the modified membranes after a cold water rinse. Mod-ified membranes achieved 100% flux recovery, while only ∼81%of the initial flux was recovered for the unmodified membrane.TOC removal efficiencies were higher than 94% for all the threemembranes studied and increased slightly with increasing degreeof modification. However, all the three membranes exhibited poorsalt rejection, indicating that a polishing step such as reverse osmo-sis would be needed to recover the water for beneficial use. Themodification strategy can be transferred easily to other mem-brane support materials where irreversible fouling may be moredetrimental to performance than we have found for regeneratedcellulose membranes.
Acknowledgement
The authors thank the National Science Foundation for supportunder award CBET 0651646.
Appendix A. Supplementary data
Supplementary data associated with this article can be found, inthe online version, at doi:10.1016/j.memsci.2011.03.010.
References
[1] S. Mondal, S.R. Wickramasinghe, Produced water treatment by nanofiltrationand reverse osmosis membranes, J. Membr. Sci. 322 (2008) 162–170.
[2] C.E. Clark, J.A. Veil, Produced water volumes and management practices inthe United States, prepared by the Environmental Science Division, Argonne
1 embra
[
[
[
[
[
[
[
[
[
[
[
[
[
[
[
[
[
[
[
[
[
[
[
[
[
[
[
[
[
[
[
[
[
[
[
[
[
[
88 D. Wandera et al. / Journal of M
National Laboratory for the U.S. Department of Energy, Office of Fossil Energy,National Energy Technology Laboratory, September 2009.
[3] Z. Khatib, P. Verbeek, Water to value—produced water management for sus-tainable field development of mature and green fields, J. Petrol. Technol. 55(2003) 26–28.
[4] Advanced Resources International, Powder River Basin coal bed methanedevelopment and produced water management study, prepared for the U.S.Department of Energy, National Energy Technology Laboratory, November2002.
[5] C.A. Rice, V. Nuccio, Water produced with coal bed methane, in: USGS Fact SheetFS, 2000, pp. 156–160.
[6] T. Hayes, D. Arthur, Overview of emerging treatment technologies, in: Proceed-ings of the 11th Annual International Petroleum Environmental Conference,Albuquerque NM, October 12–15, 2004.
[7] K. Keith, J. Bauder, J. Wheaton, Frequently Asked Questions, Coal Bed Methane(CBM), Montana State University-Bozeman and Montana Bureau of Mines andGeology, 2003.
[8] M Cheryan, N. Rajagopalan, Membrane processing of oily streams. Wastewatertreatment and waste reduction, J. Membr. Sci. 151 (1998) 13–28.
[9] P. Xu, J.E. Drewes, Viability of nanofiltration and ultra-low pressure reverseosmosis membranes for multi-beneficial use of methane produced water, Sep.Purif. Technol. 52 (2006) 67–76.
10] P. Xu, J.E. Drewes, D. Heil, Beneficial use of co-produced water through mem-brane treatment: technical-economic assessment, Desalination 225 (2008)139–155.
11] A. Asatekin, A.M. Mayes, Oil industry wastewater treatment with foulingresistant membranes containing amphiphilic comb copolymers, Environ. Sci.Technol. 43 (2009) 4487–4492.
12] A.C. Sagle, E.M. Van Wagner, H. Ju, B.D. McCloskey, B.D. Freeman, M.M. Sharma,PEG-coated reverse osmosis membranes: desalination properties and foulingresistance, J. Membr. Sci. 340 (2009) 92–108.
13] A. Szep, R. Kohlheb, Water treatment technology for produced water, WaterSci. Technol. 62 (2010) 2372–2380.
14] J. Mueller, Y. Cen, R.H. Davis, Cross flow microfiltration of oily water, J. Membr.Sci. 129 (1997) 221–235.
15] N. Hilal, O.O. Ogunbiyi, N.J. Miles, R. Nigmatullin, Methods employed for controlof fouling in MF and UF membranes: a comprehensive review, Sep. Sci. Technol.40 (2005) 1957–2005.
16] N. Singh, Z. Chen, N. Tomer, S.R. Wickramasinghe, N. Soice, S.M. Husson, Modi-fication of regenerated cellulose ultrafiltration membranes by surface-initiatedatom transfer radical polymerization, J. Membr. Sci. 311 (2008) 225–234.
17] K. Matyjaszewski, P.J. Miller, N. Shukla, B. Immaraporn, A. Gelman, B.B. Luokala,T.M. Siclovan, G. Kickelbick, T. Vallant, H. Hoffmann, T. Pakula, Polymers atinterfaces: using atom transfer radical polymerization in the controlled growthof homopolymers and block copolymers from silicon surfaces in the absenceof untethered sacrificial initiator, Macromolecules 32 (1999) 8716–8724.
18] J. Kim, W. Huang, M.L. Bruening, G.L. Baker, Synthesis of triblock copolymerbrushes by surface-initiated atom transfer radical polymerization, Macro-molecules 35 (2002) 5410–5416.
19] A. Friebe, M. Ulbricht, Cylindrical pores responding to two different stimuli viasurface-initiated atom transfer radical polymerization for synthesis of grafteddiblock copolymers, Macromolecules 42 (2009) 1838–1848.
20] E. Berndt, M. Ulbricht, Synthesis of block copolymers for surface functionaliza-tion with stimuli-responsive macromolecules, Polymer 50 (2009) 5181–5191.
21] B.V. Bhut, S.R. Wickramasinghe, S.M. Husson, Preparation of high-capacity,weak anion-exchange membranes for protein separations using surface-initiated atom transfer radical polymerization, J. Membr. Sci. 325 (2008)176–183.
22] N. Tomer, S. Mondal, D. Wandera, S.R. Wickramasinghe, S.M. Husson, Modifi-cation of nanofiltration membranes by surface-initiated atom transfer radicalpolymerization for produced water filtration, Sep. Sci. Technol. 44 (2009)
3346–3368.23] B.V. Bhut, S.M. Husson, Dramatic performance improvement of weak anion-exchange membranes for chromatographic bioseparations, J. Membr. Sci. 337(2009) 215–223.
24] N. Singh, S.M. Husson, B. Zdyrko, I. Luzinov, Surface modification of microp-orous PVDF membranes by ATRP, J. Membr. Sci. 262 (2005) 81–90.
[
[
ne Science 373 (2011) 178–188
25] N. Singh, J. Wang, M. Ulbricht, S.R. Wickramasinghe, S.M. Husson, Surface-initiated atom transfer radical polymerization: a new method for preparationof polymeric membrane adsorbers, J. Membr. Sci. 309 (2008) 64–72.
26] M. Balachandra, G.L. Baker, M.L. Bruening, Preparation of composite mem-branes by atom transfer radical polymerization initiated from a porous support,J. Membr. Sci. 227 (2003) 1–14.
27] L. Sun, J. Dai, G.L. Baker, M.L. Bruening, High-capacity, protein binding mem-branes based on polymer brushes grown in porous substrates, Chem. Mater. 18(2006) 4033–4039.
28] A. Friebe, M. Ulbricht, Controlled pore functionalization of poly(ethyleneterephthalate) track-etched membranes via surface-initiated atom transferradical polymerization, Langmuir 23 (2007) 10316–10322.
29] M. Heskins, J.E. Guillet, Solution properties of poly(N-isopropylacrylamide), J.Macromol. Sci. Chem. 8 (1968) 1441–1455.
30] D. Wandera, S.R. Wickramasinghe, S.M. Husson, Stimuli-responsive mem-branes, J. Membr. Sci. 357 (2010) 6–35.
31] S.M. Samadi, Y. Husson, I. Liu, S.M. Luzinov, I.I. Kilbey, Low temperature growthof thick polystyrene brushes via ATRP, Macromol. Rapid Commun. 26 (2005)1829–1834.
32] H. Tu, C.E. Heitzman, P.V. Braun, Patterned poly(N-isopropylacrylamide)brushes on silica surfaces by microcontact printing followed by surface-initiated polymerization, Langmuir 20 (2004) 8313–8320.
33] T. Karanfil, I. Erdogan, M.A. Schlautman, Selecting filter membranes for mea-suring DOC and UV254, J. Am. Water Works Assoc. 95 (2003) 86–100.
34] G. Masci, L. Giacomelli, V. Crescenzi, Atom transfer radical polymerization ofN-isopropylacrylamide, Macromol. Rapid Commun. 25 (2004) 559–564.
35] J. Kim, W. Huang, M.D. Miller, G.L. Baker, M.L. Bruening, Kinetics of surface-initiated atom transfer radical polymerization, J. Polym. Sci. Part A: Polym.Chem. 41 (2003) 386–394.
36] X. Cheng, H.E. Canavan, M.J. Stein, J.R. Hull, S.J. Kweskin, M.S. Wagner, G.A.Somorjai, D.G. Castner, B.D. Ratner, Surface chemical and mechanical prop-erties of plasma-polymerized N-isopropylacrylamide, Langmuir 21 (2005)7833–7841.
37] H.G. Schild, Poly(N-isopropylacrylamide): experiment, theory and application,Prog. Polym. Sci. 17 (1992) 163–249.
38] S.T. Milner, Compressing polymer “brushes”: a quantitative comparison of the-ory and experiment, Europhys. Lett. 7 (1988) 695–699.
39] S.T. Milner, T.A. Witten, M.E. Cates, Theory of the grafted polymer brush, Macro-molecules 21 (1988) 2610–2619.
40] T. Norisuye, N. Masui, Y. Kida, D. Ikuta, E. Kokufuta, S. Ito, S. Panyukov,M. Shibayama, Small angle neutron scattering studies on structural inho-mogeneities in polymer gels: irradiation cross-linked gels vs chemicallycross-linked gels, Polymer 43 (2002) 5289–5297.
41] S. Burkert, E. Bittrich, M. Kuntzsch, M. Muller, K. Eichhorn, C. Bellmann, P.Uhlmann, M. Stamm, Protein resistance of PNIPAAm brushes: application toswitchable protein adsorption, Langmuir 26 (2010) 1786–1795.
42] E. Turan, S. Demirci, T. Caykara, Synthesis of thermoresponsive poly(N-isopropylacrylamide) brush on silicon wafer via atom transfer radicalpolymerization, Thin Solid Films 518 (2010) 5950–5954.
43] A.R. Carter, Preparation of strong anion-exchange membranes for proteinpurification using atom transfer radical polymerization, Honors Thesis, Clem-son University, Clemson, SC, 2010.
44] M. Biesalski, J. Ruhe, Scaling laws for the swelling of neutral and charged poly-mer brushes in good solvents, Macromolecules 35 (2002) 499–507.
45] W. Yoshida, Y. Cohen, Topological AFM characterization of graft polymerizedsilica membranes, J. Membr. Sci. 215 (2003) 249–264.
46] M. Khayet, Membrane surface modification and characterization by X-rayphotoelectron spectroscopy, atomic force microscopy and contact angle mea-surements, Appl. Surf. Sci. 238 (2004) 269–272.
47] E.M. Vrijenhoek, S. Hong, M. Elimelech, Influence of membrane surface prop-erties on initial rate of colloidal fouling of reverse osmosis and nanofiltration
membranes, J. Membr. Sci. 188 (2001) 115–128.48] USGS, Produced water database, http://energy.cr.usgs.gov/prov/prodwat/index.htm (accessed December 2010).
49] J.S. Louie, I. Pinnau, I. Ciobanu, K.P. Ishida, A. Ng, M. Reinhard, Effects ofpolyether–polyamide block copolymer coating on performance and fouling ofreverse osmosis membranes, J. Membr. Sci. 280 (2006) 762–770.