Embed Size (px)
Citation preview
Modification of red cell membrane structure by cholesterol-richlipid dispersions. A model for the primary spur cell defect.
R A Cooper, … , J S Wiley, S J Shattil
J Clin Invest. 1975;55(1):115-126. https://doi.org/10.1172/JCI107901.
Cholesterol-rich membranes are the hallmark of "spur" red cells. Spur cells accumulate cholesterol from cholesterol-richserum lipoproteins. Previous studies suggested that this added cholesterol is responsible for both the altered morphologyand the destruction of spur cells. To examine this process in the absence of other serum factors, cholesterol-lecithindispersions with varying amounts of unesterified cholesterol (C) relative to phospholipid (P) were prepared, and theirinfluence on normal human red cells was studied. Cholesterol-rich lipid dispersions (C/P mole ration greater 1.0)transferred cholesterol to both red cell membranes and serum lipoproteins, and cholesterol-poor dispersions (C/P moleration less 1.0) depleted red cells of cholesterol. Changes in membrane cholesterol paralleled changes in membranesurface area, as calculated from osmotic fragility, with a 0.22 percent variation in surface area per 1.0 percent variation incholesterol content. Cold-induced compression of membrane surface area was increased in cholesterol-poor red cells(C/P equals 0.4), whereas the surface area of cholesterol-rich membranes (C/P equals 1.80) underwent no compression.Although the Na and K permeability of red cells severely depleted of cholesterol was increased, lesser degrees ofdepletion had no effect, and the permeability of cholesterol-rich cells was normal. However, increasing membranecholesterol caused a progressive decrease in red cell deformability, as measured by filtration. Cholesterol-poor red cellswere spherocytic in appearance and cholesterol-rich cells were broad […]
Research Article
Find the latest version:
https://jci.me/107901/pdf
Modification of Red Cell Membrane Structure
by Cholesterol-Rich Lipid Dispersions
A MODELFORTHE PRIMARYSPURCELL DEFECT
RIcHAw A. COOPER,ELIZABETH C. ARNER, JAMESS. WILEY, andSANFORDJ. SHAnTTJL
From the Hematology-Oncology Section, Department of Medicine, Universityof Pennsylvania School of Medicine, Philadelphia, Pennsylvania 19104
A B S T R A C T Cholesterol-rich membranes are the hall-mark of "spur" red cells. Spur cells accumulate choles-terol from cholesterol-rich serum lipoproteins. Previousstudies suggested that this added cholesterol is responsi-ble for both the altered morphology and the destructionof spur cells. To examine this process in the absence ofother serum factors, cholesterol-lecithin dispersions withvarying amounts of unesterified cholesterol (C) relativeto phospholipid (P) were prepared, and their influenceon normal human red cells was studied.
Cholesterol-rich lipid dispersions (C/P mole ratio> 1.0) transferred cholesterol to both red cell mem-branes and serum lipoproteins, and cholesterol-poor dis-persions (C/P mole ratio < 1.0) depleted red cells ofcholesterol. Changes in membrane cholesterol paralleledchanges in membrane surface area, as calculated fromosmotic fragility, with a 0.22% variation in surface areaper 1.0% variation in cholesterol content. Cold-inducedcompression of membrane surface area was increasedin cholesterol-poor red cells (C/P = 0.4), whereas thesurface area of cholesterol-rich membranes (C/P = 1.80)underwent no compression. Although the Na and Kpermeability of red cells severely depleted of cholesterolwas increased, lesser degrees of depletion had no effect,and the permeability of cholesterol-rich cells was nor-mal. However, increasing membrane cholesterol caused aprogressive decrease in red cell deformability, as mea-sured by filtration.
Cholesterol-poor red cells were spherocytic in appear-ance and cholesterol-rich cells were broad and flat, in-dicative of their surface areas. In addition, cholesterol-
Received for publication 21 June 1974 and in revisedform 4 September 1974.
rich cells had an irregular contour due to folding of theperiphery of the cell. This shape abnormality was iden-tical to that of both spur cells after splenectomy andnormal red cells incubated in spur serum. Normalizationof the C/P of spur serum by added phospholipid pre-vented the increase in membrane cholesterol and sur-face area and the transformation of cell shape.
These studies establish that the cholesterol content ofred cells is dependent on the C/P of their milieu, eitherlipoproteins or cholesterol-lecithin dispersions. More-over, the surface area, deformability, and contour ofcholesterol-rich red cells are a direct function of theirincreased membrane C/P. Although cholesterol-richspur cells are further modified in the circulation of pa-tients with spleens, this abnormality of the membranelipid bilayer, induced by cholesterol-rich cholesterol-lecithin dispersions, represents the primary spur celldefect.
INTRODUCTION
Spur cell anemia is an acquired hemolytic process occur-ring in patients with severe liver disease, usually alco-holic cirrhosis (1-3). Recent studies have shown that inpatients with spur cells there is an increase in the ratioof free (or unesterified) cholesterol relative to phos-pholipid both in serum and in red cells; moreover astrong correlation exists between this cholesterol-to-phospholipid disproportion in serum low-density lipo-proteins (LDL)1 and the same disproportion in red cell
1Abbreviation used in this paper: C/P, cholesterol-to-phospholipid mole ratio; HDL, high-density lipoprotein;LCAT, lecithin-cholesterol acyl transferase; LDL, low-density lipoprotein.
The Journal of Clinical Investigation Volume 55 January 1975*115-126 115
membranes (4). Because the spur cell phenomenon isacquired by normal red cells incubated in serum frompatients with spur cells or by normal red cells infusedinto patients with spur cells, we have suggested that theserum lipoprotein abnormality is etiologic in the genesisof spur cells. However, other factors in patients' serumthat might be active in vitro or in vivo could not beexcluded. Therefore, we undertook to establish an arti-ficial system that reproduced the cholesterol dispropor-tion in the serum of patients with spur cells to studythis factor in the absence of other influences.
The sonication of phospholipids, such as lecithin,alone or with varying amounts of cholesterol, dispersesthe lipid in aqueous buffers (5). In 1968 Bruckdorfer,Edwards, Graham, and Green demonstrated that thecholesterol in sonicated mixtures of cholesterol and leci-thin exchanges with the cholesterol in both LDL and redcell membranes (6, 7). When red cells were incubatedin sonicated mixtures that contained a cholesterol-to-phospholipid mole ratio (C/P) of 1.0, they underwentno change in cholesterol content; however red cell mem-branes lost cholesterol when incubated with cholesterol-phospholipid mixtures having a C/P of < 1.0. Wehaveused cholesterol-rich sonicated mixtures (C/P > 1.0)similarly prepared to reproduce the serum lipoproteinabnormality of patients with spur cells. The finding thatthese cholesterol-rich dispersions were capable of in-ducing the spur cell defect in vitro afforded us an op-portunity to assess certain physical characteristics ofcholesterol-rich red cells and to apply this to a furtherunderstanding of the pathophysiology of spur cell anemia.
METHODSPreparation and analysis of sonicated lipids and serum
lipoproteins. L-a-dipalmitoyl lecithin (General Biochemi-cals Div., Mogul Corp., Chagrin Falls, Ohio), 40 mg, andcholesterol (Sigma Chemical Co., Inc., St. Louis, Mo.) inamounts up to 80 mg were added to 10 ml of 0.155 M NaClin a fluted metal container surrounded by an ice slurry andsubjected to 70 W for 60 min with a Branson sonifier(Branson Instruments Co., Stamford, Conn.) with a stan-dard tip. After sonication, 4.0 ml of normal human serumpreviously heated to 560C for 30 min or 4.0 ml of humanserum albumin (Sigma Chemical Co.) in 0.155 M NaCl ata concentration of 2.0 g/100 ml was added, and the serum-sonicate or albumin-sonicate mixture was centrifuged at21,800 g for 30 min to sediment undispersed lipid. Exceptin dispersons containing more than 40 mg of cholesterol,only trace amounts of lipid were sedimented.
Serum and sonicate lipids were extracted with acetone:ethanol ( 1: 1) for measurement of cholesterol (8), freecholesterol (9), and lipid phosphorus (10). Phospholipidvalues were calculated by multiplying lipid phosphorusvalues times 25. Individual phospholipids were quantitatedby thin layer chromatography with chloroform: methanol:glacial acetic acid:water (25: 15:4:2) (11).
Individual serum lipoproteins were separated by densitycentrifugation with KBr (12). The density of sonicatedlipids was determined by centrifugation at 108,000 g for16 h at various KBr concentrations.
Serum and sonicate free cholesterol were labeled with['H]cholesterol by the addition of 50 pCi in 10 ,.d ofethanol to either 10 ml of serum or albumin-sonicate andsubsequent incubation for 6 h at 370C.
Incitbation of red cells and analysis of red cell membranes.For incubation, freshly obtained normal human red cellswere washed three times with Hanks' balanced salt solu-tion and resuspended at a hematocrit of 10% in Hanks' con-taining penicillin (100 U/ml). Red cell suspensions weremixed with equal volumes of serum-sonicate or albumin-sonicate mixtures and incubated in stoppered 16 X 150-mmtest tubes or stoppered 250-ml Ehrlenmeyer flasks in ashaking water bath for varying times up to 24 h.
Cell morphology was assessed in wet preparations anddried, Wright's-stained smears. For scanning electron mi-croscopy, cell suspensions were fixed with 2%o glutaralde-hyde (Polysciences, Inc., Warrington, Pa.) in 0.1 M phos-phate buffer, and electron micrographs were kindly pre-pared by Dr. Ronald Weinstein, Tufts University Schoolof Medicine.
The osmotic fragility of red cells after incubation wasdetermined after further dilution with 1.5 vol of Hanks', asdescribed previously (3). Except where noted, all determi-nations were made at room temperature. For variations intemperature, red cells and lysing solutions were brought toa constant temperature and held there during lysis. Red cellswere sedimented within 5 min of addition to lysing solutionsby centrifugation for 2 min in a Serofuge (Clay-Adams,Div. of Becton, Dickinson & Co., Parsippany, N. J.). Formeasurement of critical hemolytic volume, 0.2 ml of cellsuspension was added to 0.6 ml of lysing solution. Micro-hematocrits were determined in triplicate after centrifuga-tion for 5 min in a microhematocrit centrifuge (Interna-tional Equipment Company, Needham Heights, Mass.).Surface area was calculated from osmotic fragility accord-ing to Castle and Daland (13) as described previously (14).
For measurement of red cell membrane lipids, red cellswere washed three times with 0.155 M NaCl and ex-tracted with isopropanol and chloroform (15) for measure-ment of cholesterol (8), lipid phosphorus (10) and indi-vidual phospholipids (11) as described previously (3). Redcell ghosts were prepared according to Dodge, Mitchell,and Hanahan (16).
For measurement of Na and K fluxes after incubation,inosine (10 mM) and adenine (2 mM) were added to cellsuspensions 1 h before the end of incubation to assure thatadenine nucleotides were normal during these measure-ments (17). Cell cation concentration, sodium influx, so-dium efflux, and potassium influx were measured as de-scribed previously (18).
For measurement of cell filtration, red cells after incu-bation were adjusted to an hematocrit of 0.1% by theaddition of Hanks' balanced salt solution, and triplicate10-ml aliquots were filtered through 2.5 cm, 8.0 /m Milli-pore filters (Millipore Corp., Bedford, Mass.) at 10 mmHgnegative pressure. The time for evacuation of fluid fromthe chamber above the filter was taken as filtration time.
RESULTS
Characteristics of lipid dispersions. The C/P of dis-persions prepared by sonication was similar to the C/Pof lipids added before sonication for all mixtures exceptthat obtained by the addition of more than 40 mg of cho-lesterol to 40 mg of lecithin, and only in the latter casewas there a significant amount of lipid in the pellet
116 R. A. Cooper, E. C. Arner, J. S. Wiley, and S. J. Shattil
after centrifugation at 21,800 g. Thus, for example, theC/P of dispersions prepared from a mixture of 23 mgcholesterol plus 40 mg lecithin was 1.0; 40 mg+ 40 mg= 1.9; 80 mg+ 40 mg= 2.2. 84% of both the choles-terol and phospholipid present in dispersions with aC/P of 1.0 passed through Millipore filters of 0.45 Ampore size.
To assess the chemical stability of dispersions, thecholesterol and phospholipid content of sonicated lipids,with and without added serum, was measured at varioustimes during storage at 0C and 370C. Samples werecentrifuged immediately before lipid determinations.There was no change in the total lipid content or theC/P ratio over the course of 30 days at either tempera-ture. When analyzed by thin layer chromatography,more than 95% of the phospholipid both before and af-ter sonication was lecithin, 1-2% was recovered in thearea of phosphatidyl-serine, and the remainder was re-covered in the region of lysolecithin. Thus, it appearsthat neither sonication itself nor storage after sonicationhad a discernible effect on the synthetic lipids studied.
The buoyant density of sonicated lipids was deter-mined by measuring their flotation in varying concen-trations of KBr at 108,000 g for 16 h. At the density of0.155 M NaCl, all sonicated lipids were sedimented bytheir centrifugation. Pure phospholipid dispersionsfloated incompletely at d = 1.063 and completely at d =1.21. Cholesterol-containing dispersions with a C/P of1.0 and 2.2 floated partially at d = 1.022 and completelyat d = 1.035. It therefore was possible to separate cho-lesterol-containing dispersions from high-density lipo-protein (HDL), but it was not possible to separate thesedispersions from LDL.
To examine the interaction of lipid dispersions andserum lipoproteins, dispersions with a C/P of 2.2 wereincubated with normal HDL for 20 h at 37°C, andthereafter HDL and the dispersions were separated bycentrifugation at d = 1.063. The C/P of HDL increasedfrom 0.22 before incubation to 0.41 when HDL wasseparated immediately after mixing. The C/P of HDLincreased thereafter to 1.04 at 2 h, 1.23 at 8 h, and 1.44at 20 h. Thus, although cholesterol-rich lecithin disper-sions did not fuse with HDL, their excess cholesteroltransferred to HDL.
Effect of cholesterol-lecithin dispersions on red cellmembrane lipids. Previous investigators have demon-strated that an equilibrium exchange exists between thecholesterol in red cells and that in whole serum (19),isolated serum lipoproteins (20, 21) or cholesterol-lecithin dispersions (7). In each case, 50% equilibriumis reached in approximately 2 h. Red cells at a hemato-crit of 10% were incubated with equal volumes ofeither serum or dispersions with a C/P of 1.0, eachcontaining ['H]cholesterol. The incorporation of radio-activity into red cells was measured over the course
of 24 h. Under both conditions the time to 50%equilibration was 2.3 h. Thus, the exchange equilibriumof free cholesterol between red cells and cholesterol-lecithin dispersions follows the same time course asthe exchange rate with human serum lipoproteins.
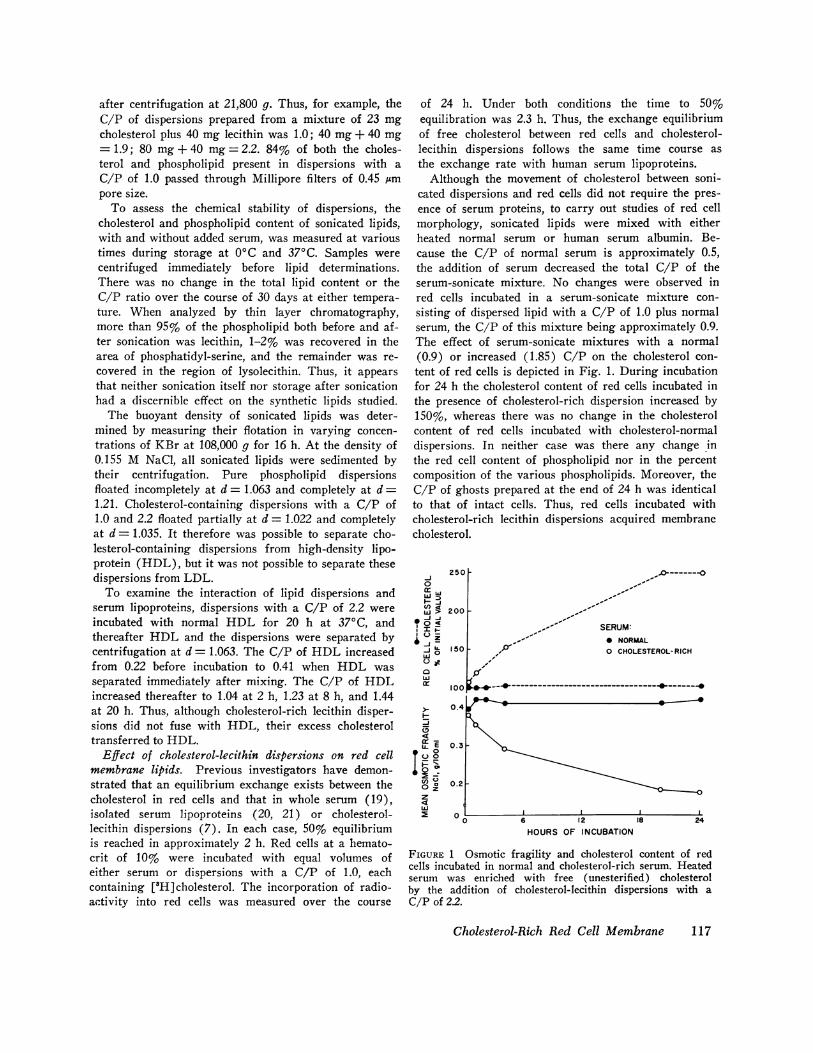
Although the movement of cholesterol between soni-cated dispersions and red cells did not require the pres-ence of serum proteins, to carry out studies of red cellmorphology, sonicated lipids were mixed with eitherheated normal serum or human serum albumin. Be-cause the C/P of normal serum is approximately 0.5,the addition of serum decreased the total C/P of theserum-sonicate mixture. No changes were observed inred cells incubated in a serum-sonicate mixture con-sisting of dispersed lipid with a C/P of 1.0 plus normalserum, the C/P of this mixture being approximately 0.9.The effect of serum-sonicate mixtures with a normal(0.9) or increased (1.85) C/P on the cholesterol con-tent of red cells is depicted in Fig. 1. During incubationfor 24 h the cholesterol content of red cells incubated inthe presence of cholesterol-rich dispersion increased by150%, whereas there was no change in the cholesterolcontent of red cells incubated with cholesterol-normaldispersions. In neither case was there any change inthe red cell content of phospholipid nor in the percentcomposition of the various phospholipids. Moreover, theC/P of ghosts prepared at the end of 24 h was identicalto that of intact cells. Thus, red cells incubated withcholesterol-rich lecithin dispersions acquired membranecholesterol.
250 0---0
LJW
,Jj 200_-,200
tIF,,-' SERUM:zJ- ,,- * NORMAL
- o 150 - 0 CHOLESTEROL-RICH
w
100 *-p------------------------------ ----_------
> 0.4
I-oo 0.30
N i
100
0 0.2z
6 12 18 24HOURSOF INCUBATION
FIGURE 1 Osmotic fragility and cholesterol content of redcells incubated in normal and cholesterol-rich serum. Heatedserum was enriched with free (unesterified) cholesterolby the addition of cholesterol-lecithin dispersions with aC/P of 2.2.
Cholesterol-Rich Red Cell Membrane 117
Q 2.0
i-J0
1.6% I
)EL) I 0.8
o0 a.t4
tu 0.4
-o 0.Z 0.4 0.6 0.8 IDU 1.2 IA~ 1.6SERUM-SONICATE
FREECHOLESTEROLIPHOSPHOLIPID(mole/mole)
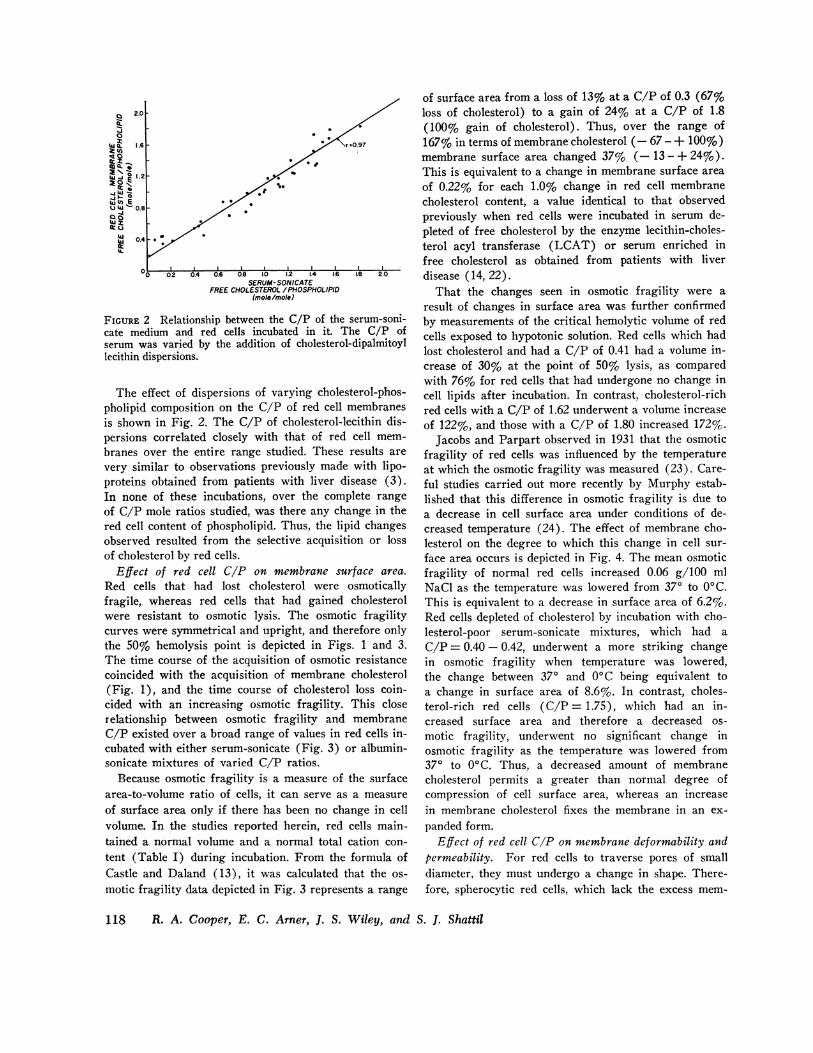
FIGURE 2 Relationship between the C/P of the serum-soni-cate medium and red cells incubated in it. The C/P ofserum was varied by the addition of cholesterol-dipalmitoyllecithin dispersions.
The effect of dispersions of varying cholesterol-phos-pholipid composition on the C/P of red cell membranesis shown in Fig. 2. The C/P of cholesterol-lecithin dis-persions correlated closely with that of red cell mem-branes over the entire range studied. These results arevery similar to observations previously made with lipo-proteins obtained from patients with liver disease (3).In none of these incubations, over the complete rangeof C/P mole ratios studied, was there any change in thered cell content of phospholipid. Thus, the lipid changesobserved resulted from the selective acquisition or lossof cholesterol by red cells.
Effect of red cell C/P on membrane surface area.Red cells that had lost cholesterol were osmoticallyfragile, whereas red cells that had gained cholesterolwere resistant to osmotic lysis. The osmotic fragilitycurves were symmetrical and upright, and therefore onlythe 50% hemolysis point is depicted in Figs. 1 and 3.The time course of the acquisition of osmotic resistancecoincided with the acquisition of membrane cholesterol(Fig. 1), and the time course of cholesterol loss coin-cided with an increasing osmotic fragility. This closerelationship between osmotic fragility and membraneC/P existed over a broad range of values in red cells in-cubated with either serum-sonicate (Fig. 3) or albumin-sonicate mixtures of varied C/P ratios.
Because osmotic fragility is a measure of the surfacearea-to-volume ratio of cells, it can serve as a measureof surface area only if there has been no change in cellvolume. In the studies reported herein, red cells main-tained a normal volume and a normal total cation con-tent (Table I) during incubation. From the formula ofCastle and Daland (13), it was calculated that the os-motic fragility data depicted in Fig. 3 represents a range
of surface area from a loss of 13% at a C/P of 0.3 (67%loss of cholesterol) to a gain of 24% at a C/P of 1.8(100% gain of cholesterol). Thus, over the range of167% in terms of membrane cholesterol (-67 - + 100%)membrane surface area changed 37% (-13 - + 24%).This is equivalent to a change in membrane surface areaof 0.22% for each 1.0% change in red cell membranecholesterol content, a value identical to that observedpreviously when red cells were incubated in serum de-pleted of free cholesterol by the enzyme lecithin-choles-terol acyl transferase (LCAT) or serum enriched infree cholesterol as obtained from patients with liverdisease (14, 22).
That the changes seen in osmotic fragility were aresult of changes in surface area was further confirmedby measurements of the critical hemolytic volume of redcells exposed to hypotonic solution. Red cells which hadlost cholesterol and had a C/P of 0.41 had a volume in-crease of 30% at the point of 50% lysis, as comparedwith 76% for red cells that had undergone no change incell lipids after incubation. In contrast, cholesterol-richred cells with a C/P of 1.62 underwent a volume increaseof 122%, and those with a C/P of 1.80 increased 172%.
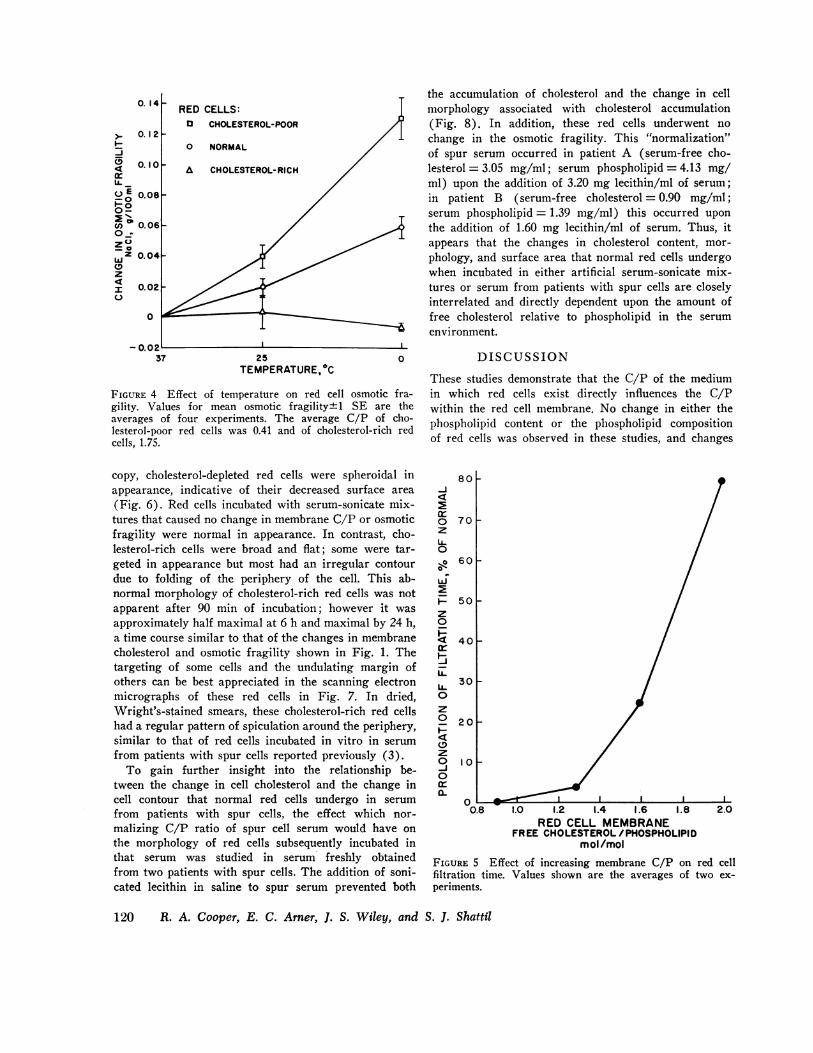
Jacobs and Parpart observed in 1931 that the osmoticfragility of red cells was influenced by the temperatureat which the osmotic fragility was measured (23). Care-ful studies carried out more recently by Murphy estab-lished that this difference in osmotic fragility is due toa decrease in cell surface area under conditions of de-creased temperature (24). The effect of membrane cho-lesterol on the degree to which this change in cell sur-face area occurs is depicted in Fig. 4. The mean osmoticfragility of normal red cells increased 0.06 g/100 mlNaCl as the temperature was lowered from 370 to 0C.This is equivalent to a decrease in surface area of 6.2%.Red cells depleted of cholesterol by incubation with cho-lesterol-poor serum-sonicate mixtures, which had aC/P = 0.40 - 0.42, underwent a more striking changein osmotic fragility when temperature was lowered,the change between 37° and 0°C being equivalent toa change in surface area of 8.6%. In contrast, choles-terol-rich red cells (C/P = 1.75), which had an in-creased surface area and therefore a decreased os-motic fragility, underwent no significant change inosmotic fragility as the temperature was lowered from370 to 0°C. Thus, a decreased amount of membranecholesterol permits a greater than normal degree ofcompression of cell surface area, whereas an increasein membrane cholesterol fixes the membrane in an ex-panded form.
Effect of red cell C/P on membrane deformability andpermeability. For red cells to traverse pores of smalldiameter, they must undergo a change in shape. There-fore, spherocytic red cells, which lack the excess mem-
118 R. A. Cooper, E. C. Arner, J. S. Wiley, and S. J. Shattil
0
0.97
-f
%o
0
0
0
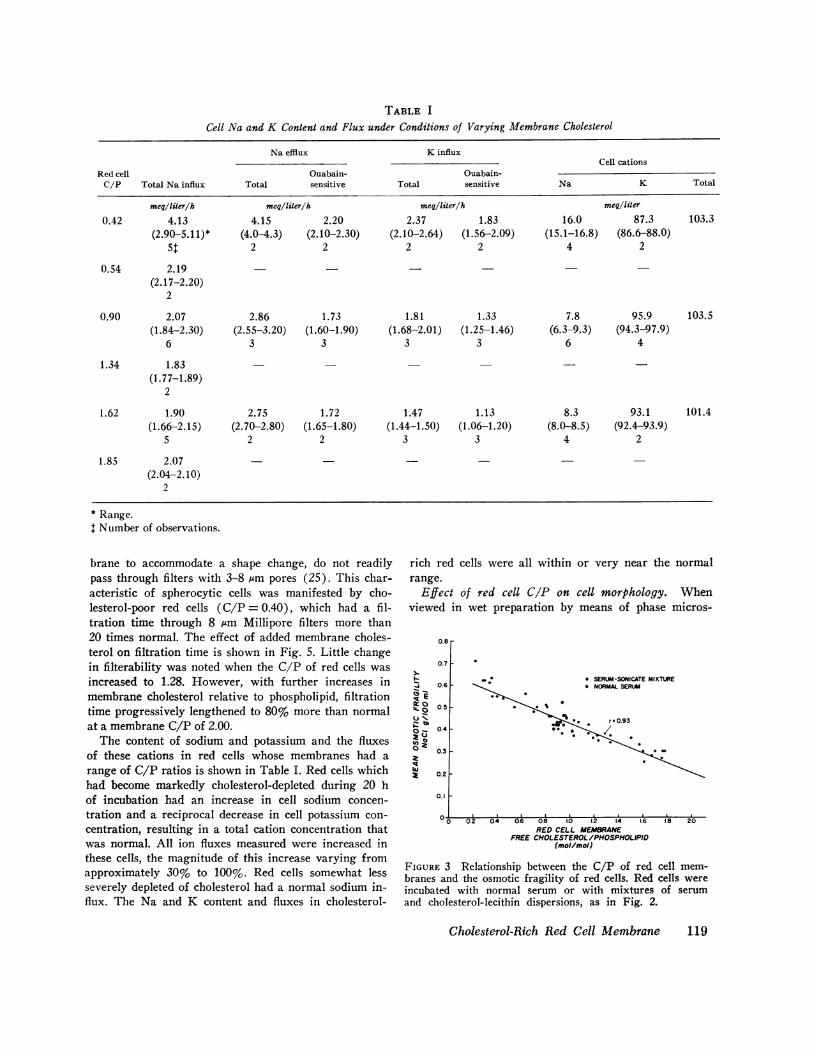
TABLE I
Cell Na and K Content and Flux under Conditions of Varying Membrane Cholesterol
Na efflux K influxCell cations
Red cell Ouabain- Ouabain-C/P Total Na influx Total sensitive Total sensitive Na K Total
meg/liter/h meq/liter/h meq/liter/h meq/liter
0.42 4.13 4.15 2.20 2.37 1.83 16.0 87.3 103.3(2.90-5.11)* (4.0-4.3) (2.10-2.30) (2.10-2.64) (1.56-2.09) (15.1-16.8) (86.6-88.0)
5$ 2 2 2 2 4 2
0.54 2.19 - - -(2.17-2.20)
2
0.90 2.07 2.86 1.73 1.81 1.33 7.8 95.9 103.5(1.84-2.30) (2.55-3.20) (1.60-1.90) (1.68-2.01) (1.25-1.46) (6.3-9.3) (94.3-97.9)
6 3 3 3 3 6 4
1.34 1.83(1.77-1.89)
2
1.62 1.90 2.75 1.72 1.47 1.13 8.3 93.1 101.4(1.66-2.15) (2.70-2.80) (1.65-1.80) (1.44-1.50) (1.06-1.20) (8.0-8.5) (92.4-93.9)
5 2 2 3 3 4 2
1.85 2.07(2.04-2.10)
2
* Range.t Number of observations.
brane to accommodate a shape change, do not readilypass through filters with 3-8 Am pores (25). This char-acteristic of spherocytic cells was manifested by cho-lesterol-poor red cells (C/P=0.40), which had a fil-tration time through 8 /Am Millipore filters more than20 times normal. The effect of added membrane choles-terol on filtration time is shown in Fig. 5. Little changein filterability was noted when the C/P of red cells wasincreased to 1.28. However, with further increases inmembrane cholesterol relative to phospholipid, filtrationtime progressively lengthened to 80% more than normalat a membrane C/P of 2.00.
The content of sodium and potassium and the fluxesof these cations in red cells whose membranes had arange of C/P ratios is shown in Table I. Red cells whichhad become markedly cholesterol-depleted during 20 hof incubation had an increase in cell sodium concen-tration and a reciprocal decrease in cell potassium con-centration, resulting in a total cation concentration thatwas normal. All ion fluxes measured were increased inthese cells, the magnitude of this increase varying fromapproximately 30% to 100%. Red cells somewhat lessseverely depleted of cholesterol had a normal sodium in-flux. The Na and K content and fluxes in cholesterol-
rich red cells were all within or very near the normalrange.
Effect of red cell C/P on cell morphology. Whenviewed in wet preparation by means of phase micros-
0.8 r
-
I-
0-
I isx' aQ)0
0.6 F * SERUM-SONICATEMIXTURE* NORMALSERUM
r-0.930.4k
0.3 F
0.2 F
0.1
-0.5 0.4 06 0. I.U i. 14 1.6REDCELL MEMBRANE
FREE CHOLESTEROL/PHOSPHOLIPID(mol/mol)
FIGURE 3 Relationship between the C/P of red cell mem-branes and the osmotic fragility of red cells. Red cells wereincubated with normal serum or with mixtures of serumand cholesterol-lecithin dispersions, as in Fig. 2.
Cholesterol-Rich Red Cell Membrane 119
0
0 NORMAL
o0.104 r° -10^ACHOLESTEROL-RICH
E 0.08 _-o-00U°'0.06 /-/0-
, ZO0.04 -
0-ZC
I 0. 02 / i0
0
- 0.021I37 25 0
TEMPERATURE,0C
FIGURE 4 Effect of temperature on red cell osmotic fra-gility. Values for mean osmotic fragility±+1 SE are theaverages of four experiments. The average C/P of cho-lesterol-poor red cells was 0.41 and of cholesterol-rich redcells, 1.75.
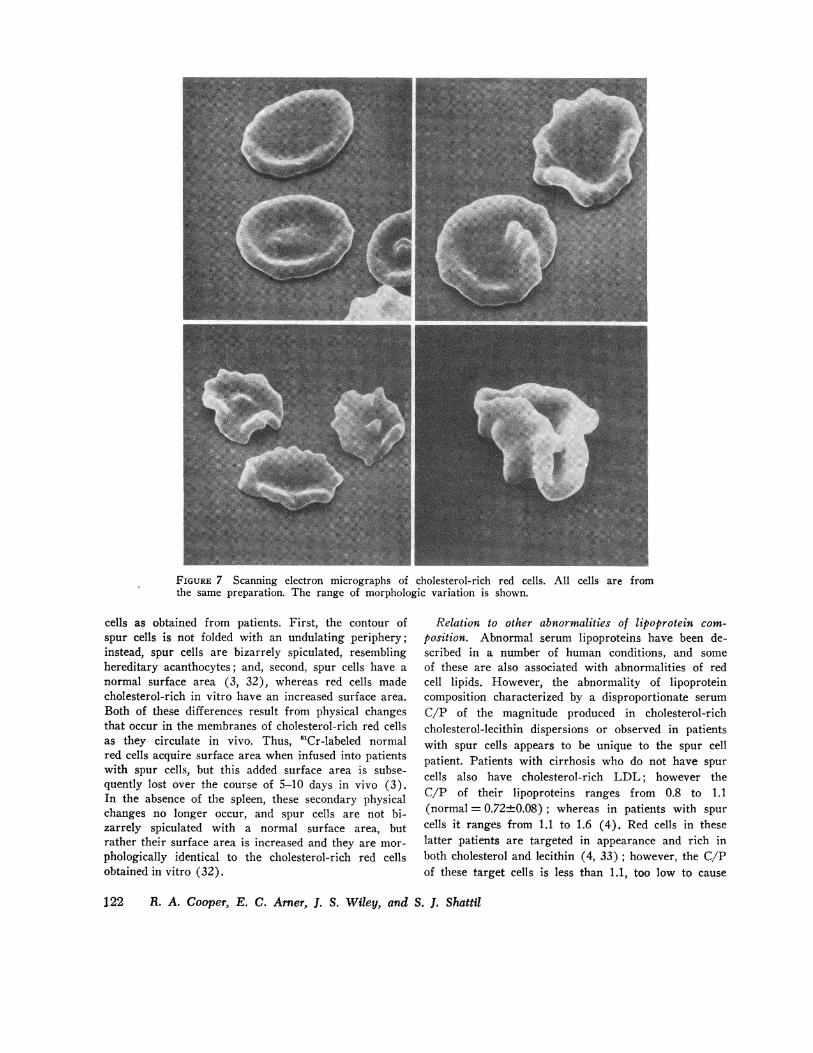
copy, cholesterol-depleted red cells were spheroidal inappearance, indicative of their decreased surface area(Fig. 6). Red cells incubated with serum-sonicate mix-tures that caused no change in membrane C/P or osmoticfragility were normal in appearance. In contrast, cho-lesterol-rich cells were broad and flat; some were tar-geted in appearance but most had an irregular contourdue to folding of the periphery of the cell. This ab-normal morphology of cholesterol-rich red cells was notapparent after 90 min of incubation; however it wasapproximately half maximal at 6 h and maximal by 24 h,a time course similar to that of the changes in membranecholesterol and osmotic fragility shown in Fig. 1. Thetargeting of some cells and the undulating margin ofothers can be best appreciated in the scanning electronmicrographs of these red cells in Fig. 7. In dried,Wright's-stained smears, these cholesterol-rich red cellshad a regular pattern of spiculation around the periphery,similar to that of red cells incubated in vitro in serumfrom patients with spur cells reported previously (3).
To gain further insight into the relationship be-tween the change in cell cholesterol and the change incell contour that normal red cells undergo in serumfrom patients with spur cells, the effect which nor-malizing C/P ratio of spur cell serum would have onthe morphology of red cells subsequently incubated inthat serum was studied in serum freshly obtainedfrom two patients with spur cells. The addition of soni-cated lecithin in saline to spur serum prevented both
the accumulation of cholesterol and the change in cellmorphology associated with cholesterol accumulation(Fig. 8). In addition, these red cells underwent nochange in the osmotic fragility. This "normalization"of spur serum occurred in patient A (serum-free cho-lesterol = 3.05 mg/ml; serum phospholipid = 4.13 mg/ml) upon the addition of 3.20 mg lecithin/ml of serum;in patient B (serum-free cholesterol = 0.90 mg/ml;serum phospholipid = 1.39 mg/ml) this occurred uponthe addition of 1.60 mg lecithin/ml of serum. Thus, itappears that the changes in cholesterol content, mor-phology, and surface area that normal red cells undergowhen incubated in either artificial serum-sonicate mix-tures or serum from patients with spur cells are closelyinterrelated and directly dependent upon the amount offree cholesterol relative to phospholipid in the serumenvironment.
DISCUSSION
These studies demonstrate that the C/P of the mediumin which red cells exist directly influences the C/Pwithin the red cell membrane. No change in either thephospholipid content or the phospholipid compositionof red cells was observed in these studies, and changes
-J4
cr0zLLj00,
z0
(r5t]4HLL.
LL.0z0
(Dz0-J0cr
80-
70F
60G
5 0
40F
30-
20 -
I 0
0 L0.8
I I I
1.0 1.2 1.4 1.6 1.8RED CELL MEMBRANE
FREE CHOLESTEROL/PPHOSPHOLIPIDmol /mol
2.0
FIGURE 5 Effect of increasing membrane C/P on red cellfiltration time. Values shown are the averages of two ex-periments.
120 R. A. Cooper, E. C. Arner, J. S. Wiley, and S. J. Shattil
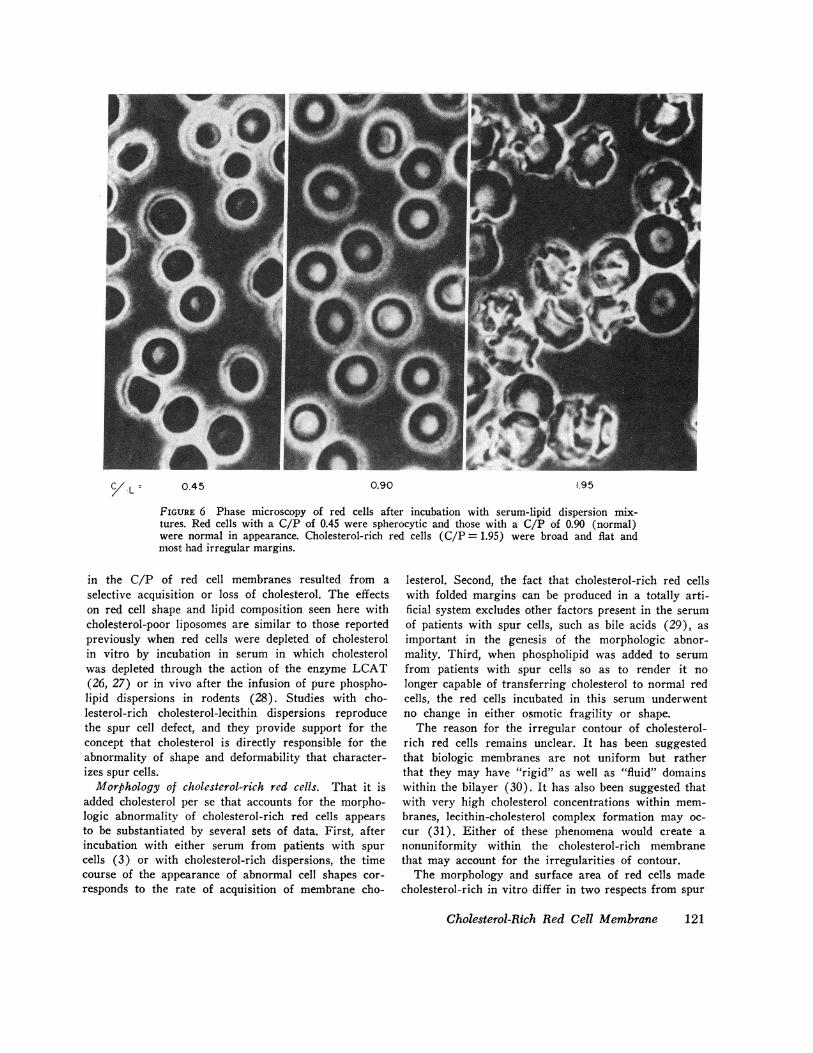
C/LL 0.45 0.90 1.95
FIGURE 6 Phase microscopy of red cells after incubation with serum-lipid dispersion mix-tures. Red cells with a C/P of 0.45 were spherocytic and those with a C/P of 0.90 (normal)were normal in appearance. Cholesterol-rich red cells (C/P = 1.95) were broad and flat andmost had irregular margins.
in the C/P of red cell membranes resulted from aselective acquisition or loss of cholesterol. The effectson red cell shape and lipid composition seen here withcholesterol-poor liposomes are similar to those reportedpreviously when red cells were depleted of cholesterolin vitro by incubation in serum in which cholesterolwas depleted through the action of the enzyme LCAT(26, 27) or in vivo after the infusion of pure phospho-lipid dispersions in rodents (28). Studies with cho-lesterol-rich cholesterol-lecithin dispersions reproducethe spur cell defect, and they provide support for theconcept that cholesterol is directly responsible for theabnormality of shape and deformability that character-izes spur cells.
Morphology of cholesterol-rich red cells. That it isadded cholesterol per se that accounts for the morpho-logic abnormality of cholesterol-rich red cells appearsto be substantiated by several sets of data. First, afterincubation with either serum from patients with spurcells (3) or with cholesterol-rich dispersions, the timecourse of the appearance of abnormal cell shapes cor-responds to the rate of acquisition of membrane cho-
lesterol. Second, the fact that cholesterol-rich red cellswith folded margins can be produced in a totally arti-ficial system excludes other factors present in the serumof patients with spur cells, such as bile acids (29), asimportant in the genesis of the morphologic abnor-mality. Third, when phospholipid was added to serumfrom patients with spur cells so as to render it nolonger capable of transferring cholesterol to normal redcells, the red cells incubated in this serum underwentno change in either osmotic fragility or shape.
The reason for the irregular contour of cholesterol-rich red cells remains unclear. It has been suggestedthat biologic membranes are not uniform but ratherthat they may have "rigid" as well as "fluid" domainswithin the bilayer (30). It has also been suggested thatwith very high cholesterol concentrations within mem-branes, lecithin-cholesterol complex formation may oc-cur (31). Either of these phenomena would create anonuniformity within the cholesterol-rich membranethat may account for the irregularities of contour.
The morphology and surface area of red cells madecholesterol-rich in vitro differ in two respects from spur
Cholesterol-Rich Red Cell Membrane 121
__ _, Bea; 1 Ad ....., : s :vv;S _ _ ................................................................................................................... It_3i_ _ Act::__
_____ l=__=_ 1|___
_|_-A___|1 __| . ... .... .... , ...I | .ILllLl.ll,|l
FIGURE 7 Scanning electron micrographs of cholesterol-rich red cells. All cells are fromthe same preparation. The range of morphologic variation is shown.
cells as obtained from patients. First, the contour ofspur cells is not folded with an undulating periphery;instead, spur cells are bizarrely spiculated, resemblinghereditary acanthocytes; and, second, spur cells have anormal surface area (3, 32), whereas red cells madecholesterol-rich in vitro have an increased surface area.Both of these differences result from physical changesthat occur in the membranes of cholesterol-rich red cellsas they circulate in vivo. Thus, 'Cr-labeled normalred cells acquire surface area when infused into patientswith spur cells, but this added surface area is subse-quently lost over the course of 5-10 days in vivo (3).In the absence of the spleen, these secondary physicalchanges no longer occur, and spur cells are not bi-zarrely spiculated with a normal surface area, butrather their surface area is increased and they are mor-phologically identical to the cholesterol-rich red cellsobtained in vitro (32).
Relation to other abnormalities of lipoprotein com-position. Abnormal serum lipoproteins have been de-scribed in a number of human conditions, and someof these are also associated with abnormalities of redcell lipids. However, the abnormality of lipoproteincomposition characterized by a disproportionate serumC/P of the magnitude produced in cholesterol-richcholesterol-lecithin dispersions or observed in patientswith spur cells appears to be unique to the spur cellpatient. Patients with cirrhosis who do not have spurcells also have cholesterol-rich LDL; however theC/P of their lipoproteins ranges from 0.8 to 1.1(normal = 0.72±0.08); whereas in patients with spurcells it ranges from 1.1 to 1.6 (4). Red cells in theselatter patients are targeted in appearance and rich inboth cholesterol and lecithin (4, 33); however, the C/Pof these target cells is less than 1.1, too low to cause
122 R. A. Cooper, E. C. Armer, J. S. Wiley, and S. J. Shattil

Red
Cholesterol =100% 171% 132 % 111% 100%
FIGURE 8 Cholesterol content and morphology of normal red cells incubated in normal serum(left panel) or serum from a patient with spur cells to which had been added dipalmitoyllecithin dispersions increasing (left to right) from 0 to 3.2 mg/ml of serum.
a prolongation of filtration time in vitro or prematurecell destruction in vivo.
In obstructive jaundice of long duration and infamilial LCAT deficiency, abnormal lipoprotein par-ticles accumulate in plasma, consisting primarily, ifnot exclusively, of phospholipid (mainly lecithin) andcholesterol in a C/P close to 1.0 (34, 35), and, likepatients with cirrhosis, these patients have targetedred cells rich in both cholesterol and lecithin (4, 33,36). While the current studies explain the accumula-tion of cholesterol by red cells incubated with lipo-somes or lipoproteins disproportionately rich in freecholesterol, they do not shed light on the mechanismof accumulation of lecithin in cirrhosis, obstructiv-jaundice, and familial LCAT deficiency.
Although apparently unique among human conditions,the spur cell abnormality is very similar to the ab-normality acquired by guinea pig red cells under condi-tions of prolonged cholesterol feeding. In these animals,LDL is rich in free cholesterol, and, in addition, a newspecies of LDL appears containing free cholesteroland phospholipid in a C/P of approximately 2.0 (37).Studies using guinea pig serum in vitro demonstratethe same phenomena seen in human red cells incubatedwith serum from patients with spur cells or with cho-lesterol-rich liposomes in vitro (38).
Effect of cholesterol on Na and K permeability. Thepermeability of red cells to Na and K was increasedonly in those red cells depleted of 67% of their cho-lesterol. These red cells also had an increase in Naconcentration and a reciprocal decrease in K concen-tration. Na influx was within the normal range in redcells that had lost only 40% of their cholesterol. In
contrast, Poznansky, Kirkwood, and Solomon have re-ported a 15-45% decrease in K influx in red cells thathad lost only 30% of their cholesterol (39). Red cellsthat had gained cholesterol had normal Na and K con-centrations and normal permeabilities to Na and K.This differs from observations made in cholesterol-richguinea pig red cells, in which a 60% decrease in oua-bain-sensitive Na efflux and a 30% decrease in theouabain-insensitive Na efflux have been demonstrated(40). It should be noted that the previously reporteddecreased erythritol permeability of cholesterol-richguinea pig red cells (40) and the increased glycerolpermeability of cholesterol-depleted human red cells(41) are probably in error, since, as Gottfried andRobertson have recently shown (42), the methods usedto study the permeability of these nonelectrolytes arestrongly influenced by the osmotic fragility of the redcell.
Contribution of cholesterol to red cell surface area.It appears from the present study, as well as from ourprevious studies with serum from patients with liverdisease and serum with an active LCAT (22), thatthere is a variation in surface area of approximately0.22% for every 1% variation in red cell cholesterolcontent, suggesting that cholesterol accounts for 22%of red cell surface area. This value is consistent withcurrent views of membrane structure that indicate thatthe red cell membrane is a lipid bilayer with associatedand intercalated protein (43). Cholesterol contributesapproximately 38 A2/molecule to the surface area of thecell (44), and, at low surface tension, phospholipidmolecules each contribute approximately 85 A' (45).If glycolipids and free fatty acids contribute 3-5% to
Cholesterol-Rich Red Cell Membrane 123
cell surface area and that, in addition, protein con-tributes 15-20%, then the cholesterol of a normalhuman red cell would account for 20-25% of membranesurface area, a value close to that observed in thesestudies.
Immobilization of the lipid bilayer in cholesterol-richred cells. Although the lipid composition of red cellsvaries among mammals, cholesterol accounts for arelatively constant percent (46). The interaction be-tween cholesterol and the hydrocarbon chains of phos-pholipid within the membrane appears to restrict themotion of the first six (47) to eight (48) phospho-lipid carbon atoms from the bilayer surface, permittingincreased motion of the remainder of the hydrocarbonchain in the hydrophobic region of the membrane bi-layer. In this way cholesterol maintains the membranebilayer in an "intermediate fluid condition," permittinggreater fluidity of hydrocarbon chains in the gel phasewhile restricting molecular motion in the liquid crystalphase (49). This concept is supported by a variety ofphysical measurements, including differential scanningcalorimetry (50), laser-Raman spectroscopy (51), pro-ton nuclear magnetic resonance (52), electron para-magnetic resonance (48), and X-ray diffraction (53).The intermediate fluid condition is apparent at a C/Pof approximately 1.0, i.e. at a ratio of one choles-terol to two hydrocarbon chains. In the current studies,the C/P approached 2.0, i.e one cholesterol for everyone hydrocarbon chain. The effect of this added cho-lesterol on the molecular motion, or fluidity, of themembrane was seen in three ways: First, as we havereported separately, motion of the fluorescent probe,12- (9-anthroyl) stearic acid, is decreased in the re-gion of the hydrocarbon chains nearest the surface ofboth spur cells obtained from patients and cholesterol-rich cells prepared in vitro (54). Similar observationshave been made in cholesterol-rich guinea pig red cells(55). Second, the ability of the lipid bilayer to undergocompression as lateral motion of the hydrocarbon chainswas decreased in the cold (56) was not observed incholesterol-rich red cells. This is consistent with theconcept that lateral motion was already restricted byexcess membrane cholesterol, which fixed the mem-brane in an expanded form. Third, immobilization ofthe lipid bilayer in cholesterol-rich red cells was seengrossly as an impaired ability of these cells to changeshape and pass through filters of small pore size. Sim-ilar results have been obtained with normal red cellsmade cholesterol-rich by incubation in spur serum (3).
Inhibition of molecular motion by excess membranecholesterol is not unique to red cells, but appears to bea general property of mammalian cell membranes. Inplatelets it causes an increased sensitivity to epinephrine
(57), and in murine lymphoma cells it results in adecreased malignant potential (58). In red cells, re-stricted motion at the molecular level is translated todecreased deformability at the macroscopic level, andthis appears to underlie the premature destruction ofspur cells in vivo.
ACKNOWLEDGMENTSThe authors are grateful to Dr. Ronald Weinstein forpreparing the scanning electron micrographs shown inFig. 7.
These studies were supported by a research grant (AM-15441) from the National Institutes of Health. Dr. Cooperis a recipient of a Research Career Development Award(AM 38,345) from the National Institutes of Health.
REFERENCES1. Smith, J. A., E. T. Lonergan, and K. Sterling. 1964.
Spur-cell anemia. Hemolytic anemia with red cells re-sembling acanthocytes in alcoholic cirrhosis. N. Engl. J.Med. 271: 396-398.
2. Siiber, R., E. Amorosi, J. Lhowe, and H. J. Kayden.1966. Spur-shaped erythrocytes in Laennec's cirrhosis.N. Engl. J. Med. 275: 639-643.
3. Cooper, R. A. 1969. Anemia with spur cells: a red celldefect acquired in serum and modified in the circulation.J. Clin. Invest. 48: 1820-1831.
4. Cooper, R. A., M. Diloy-Puray, P. Lando, and M. S.Greenberg. 1972. An analysis of lipoproteins, bile acids,and red cell membranes associated with target cellsand spur cells in patients with liver disease. J. Clin.Invest. 51: 3182-3192.
5. Sessa, G., and G. Weissmann. 1968. Phospholipid sphe-rules (liposomes) as a model for biological membranes.J. Lipid Res. 9: 310-318.
6. Bruckdorfer, K. R., P. A. Edwards, and C. Green.1968. Properties of aqueous dispersions of phospholipidand cholesterol. Eur. J. Biochem. 4: 506-511.
7. Bruckdorfer, K. R., J. M. Graham, and C. Green. 1968.The incorporation of steroid molecules into lecithinsols, ,8-lipoproteins and cellular membranes. Eur. J. Bio-chem. 4: 512-518.
8. Zlatkis, A., B. Zak, and A. J. Boyle. 1953. A newmethod for the direct determination of serum choles-terol. J. Lab. Clin. Med. 41: 486-492.
9. Brown, H. H., A. Zlatkis, B. Zak, and A. J. Boyle.1954. Rapid procedure for determination of free serumcholesterol. Anal. Chem. 26: 397-399.
10. Bartlett, G. R. 1959. Phosphorus assay in column chro-matography. J. Biol. Chem. 234: 466-468.
11. Skipski, V. P., R. F. Peterson, and M. Barclay. 1964.Quantitative analysis of phospholipids by thin-layerchromatography: Biochem. J. 90: 374-378.
12. Havel, R. J., H. A. Eder, and J. H. Bragdon. 1955.The distribution and chemical composition of ultra-centrifugally separated lipoproteins in human serum.J. Clin. Invest. 34: 1345-1353.
13. Castle, W. B., and G. A. Daland. 1937. Susceptibilityof erythrocytes to hypotonic lysis as a function of dis-coidal form. Am. J. Physiol. 120: 371-383.
14. Cooper, R. A., and J. H. Jandl. 1968. Bile salts andcholesterol in the pathogenesis of target cells in ob-structive jaundice. J. Clin. Invest. 47: 809-822.
15. Rose, H. G., and M. Oklander. 1965. Improved proce-
124 R. A. Cooper, E. C. Arner, J. S. Wiley, and S. J. Shattil
dure for the extraction of lipids from human erythro-cytes. J. Lipid Res. 6: 428-431.
16. Dodge, J. T., C. Mitchell, and D. J. Hanahan. 1963.The preparation and chemical characteristics of hemo-globin-free ghosts of human erythrocytes. Arch. Bio-chem. Biophys. 100: 119-130.
17. Whittam, R., and J. S. Wiley. 1968. Some aspects ofadenosine triphosphate synthesis from adenine and aden-osine in human red blood cells. J. Physiol. (Lond.).199: 485-494.
18. Wiley, J. S., and R A. Cooper. 1974. A furosemide-sensitive cotransport of sodium plus potassium in humanred cells. J. Clin. Invest. 53: 745-755.
19. Hagerman, J. S., and R. G. Gould. 1951. The in vitrointerchange of cholesterol between plasma and red cells.Proc. Soc. Exp. Biol. Med. 78: 329-332.
20. Ashworth, L. A. E., and C. Green. 1964. The transferof lipids between human a-lipoprotein and erythrocytes.Biochim. Biophys. Acta. 84: 182-187.
21. Basford, J. M., J. Glover, and C. Green. 1964. Exchangeof cholesterol between human 8-lipoproteins and eryth-rocytes. Biochim. Biophys. Acta. 84: 764-766.
22. Cooper, R. A., and J. H. Jandl. 1969. Red cell choles-terol content: a manifestation of the serum affinity forfree cholesterol. Trants. Assoc. Am. Physicians Phila.82: 324-330.
23. Jacobs, M. H., and A. K. Parpart. 1931. Osmotic prop-erties of the erythrocyte. II. The influence of pH, tem-perature and oxygen tension on hemolysis by hypotonicsolutions. Biol. Bull. (Woods Hole). 60: 95-119.
24. Murphy, J. R. 1967. The influence of pH and tem-perature on some physical properties of normal erythro-cytes and erythrocytes from patients with hereditaryspherocytosis. J. Lab. Clin. Med. 69: 758-775.
25. Jandl, J. H., R. L. Simmons, and W. B. Castle. 1961.Red cell filtration and the pathogenesis of certain hemo-lytic anemias. Blood J. Hematol. 18: 133-148.
26. Murphy, J. R. 1962. Erythrocyte metabolism. III. Re-lationship of energy metabolism and serum factors tothe osmotic fragility following incubation. J. Lab. Clin.Med. 60: 86-109.
27. Cooper, R. A., and J. H. Jandl. 1969. The selectiveand conjoint loss of red cell lipids. J. Clin. Invest. 48:906-914.
28. Robins, S. J., and A. Miller. 1974. Red cell cholesteroldepletion and the formation of spiculated cells in vivo.J. Lab. Clin. Med. 83: 436-443.
29. Cooper, R. A., F. A. Garcia, and C. Trey. 1972. Theeffect of lithocholic acid on red cell membranes in vivo.J. Lab. Clin. Med. 79: 7-18.
30. Oldfield, E., and D. Chapman. 1972. Dynamics of lipidsin membranes: Heterogeneity and the role of choles-terol. FEBS (Fed. Eur. Biocheem. Soc.) Lett. 23: 285-297.
31. Darke, A., E. G. Finer, A. G. Flook, and M. C.Phillips. 1971. Complex and cluster formation in mixedlecithin/cholesterol bilayers. Cooperativity of motion inlipid systems. FEBS (Fed. Eur. Biochem. Soc.) Lett.18: 326-330.
32. Cooper, R. A., D. B. Kimball, and J. R. Durocher. 1974.The role of the spleen in membrane conditioning andhemolysis of spur cells in liver disease. N. Engl. J.Med. 290: 1279-1284.
33. Neerhout, R. C. 1968. Abnormalities of erythrocytestromal lipids in hepatic disease. J. Lab. Clin. Med. 71:438447.
34. Hamilton, R. L., R. J. Havel, J. P. Kane, A. E. Blau-rock, and T. Sata. 1971. Cholestasis: lamellar structureof the abnormal human serum lipoprotein. Science(Wash. D. C.). 172: 475-478.
35. Glomset, J. A., K. R. Norum, and W. King. 1970.Plasma lipoproteins in familial lecithin: cholesterol acyl-transferase deficiency: lipid composition and reactivityin vitro. J. Clin. Invest. 49: 1827-1837.
36. Gjone, E., H. Torsvik, and K. R. Norum. 1968. Familialplasma cholesterol ester deficiency. A study of the ery-throcytes. Scand. J. Clin. Lab. Invest. 21: 327-332.
37. Sardet, C., H. Hansma, and R. Ostwald. 1972. Charac-terization of guinea pig plasma lipoproteins: the ap-pearance of new lipoproteins in response to dietarycholesterol. J. Lipid Res. 13: 624-639.
38. Sardet, C., H. Hansma, and R. Ostwald. 1972. Effectsof plasma lipoproteins from control and cholesterol-fedguinea pigs on red cell morphology and cholesterolcontent: an in vitro study. J. Lipid Res. 13: 705-715.
39. Poznansky, M., D. Kirkwood, and A. K. Solomon.1973. Modulation of red cell K+ transport by membranelipids. Biochim. Biophys. Acta. 330: 351-355.
40. Kroes, J., and R. Ostwald. 1971. Erythrocyte membranes-effect of increased cholesterol content on permeability.Biochim. Biophys. Acta. 249: 647-650.
41. Bruckdorfer, K. R., R. A. Demel, J. De Gier, and L.L. M. Van Deenan. 1969. The effect of partial replace-ments of membrane cholesterol by other steroids on theosmotic fragility and glycerol permeability of erythro-cytes. Biochim. Biophys. Acta. 183: 334-345.
42. Gottfried, E. L., and N. A. Robertson. 1974. Glycerollysis time as a screening test for erythrocyte disorders.J. Lab. Clin. Med. 83: 323-333.
43. Singer, S. J., and G. L. Nicolson. 1972. The fluid mosaicmodel of the structure of cell membranes. Science(Wash. D. C.). 175: 720-731.
44. Vandenheuvel, F. A. 1963. Study of biological structureat the molecular level with stereomodel proj ections. I.The lipids in the myelin sheath of nerve. J. Am. OilChem. Soc. 40: 455-471.
45. Bar, R. S., D. W. Deamer, and D. G. Cornwell. 1966.Surface area of human erythrocyte lipids: reinvestiga-tion of experiments on plasma membrane. Science(Wash. D. C.). 153: 1010-1012.
46. Rouser, G., G. J. Nelson, S. Fleischer, and G. Simon.1968. Lipid composition of animal cell membranes, or-ganelles and organs. In Biological Membranes: PhysicalFact and Function. D. Chapman, editor. Academic Press.London. 5-70.
47. Verma, S. P., and D. F. H. Wallach. 1973. Effectsof cholesterol on the infrared dichroism of phosphotidemultibilayers. Biochim. Biophys. Acta. 330: 122-131.
48. Hubbell, W. L., and H. M. McConnell. 1971. Molecularmotion in spin-labeled phospholipids and membranes.J. Am. Chem. Soc. 93: 314-326.
49. Chapman, D. 1968. Recent physical studies of phospho-lipids and natural membranes. In Biological Mem-branes: Physical Fact and Function. D. Chapman, edi-tor. Academic Press, Inc., New York. 125-202.
50. Ladbrooke, B. D., R. H. Williams, and D. Chapman.1968. Studies on lecithin-cholesterol-water interactionsby differential scanning calorimetry and X-ray diffrac-tion. Biochim. Biophys. Acta. 150: 333-340.
51. Lippert, J. L., and W. L. Peticolas. 1971. Laser Ramaninvestigation of the effect of cholesterol on conforma-
Cholesterol-Rich Red Cell Membrane 125
tional changes in dipalmitoyl lecithin multilayers. Proc.Nati. Acad. Sci. U. S. A. 68: 1572-1576.
52. Penkett, S. A., A. G. Flook, and D. Chapman. 1968.Physical studies of phospholipids. IX. Nuclear reso-nance studies of lipid-water systems. Chem. Phys.Lipids. 2: 273-290.
53. Levine, Y. K, and M. H. F. Wilkins. 1971. Structureof oriented lipid bilayers. Nat. (New Biol.). 230: 69-72.
54. Vanderkooi, J., S. Fischkoff, B. Chance, and R. A.Cooper. 1974. Fluorescent probe analysis of the lipidarchitecture of natural and experimental cholesterol-rich membranes. Biochemistry. 13: 1589-1595.
55. Kroes, J., R. Ostwald, and A. Keith. 1972. Erythrocyte
membranes-compression of lipid phases by increasedcholesterol content. Biochim. Biophys. Acta. 274: 71-74.
56. Luzzati, V. 1968. X-ray diffraction studies of lipid-water systems. In Biological Membranes: Physical Factand Function. D. Chapman, editor. Academic Press, Inc.,New York. 71-123.
57. Shattil, S. J., R. Anaya-Galindo, R. A. Cooper, and R.W. Colman. 1974. Platelet hypersensitivity induced bycholesterol incorporation. Clin. Res. 22: 405a.
58. Shinitsky, M., and M. Inbar. 1974. Difference in micro-viscosity induced by different cholesterol levels in sur-face membrane lipid layer of normal lymphocytes andmalignant lymphoma cells. J. Mol. Biol. 85: 603-615.
126 R. A. Cooper, E. C. Arner, J. S. Wiley, and S. J. Shattil