Embed Size (px)
Citation preview
ORIGINAL INNOVATION Open Access
Modified spectral format based onprobability level using site-specific uniformhazard spectrumAli Ahmed
Correspondence: [email protected] of Civil Engineering,Bangladesh University of Businessand Technology, 77-78, Rupnagar,Mirpur 2, Dhaka 1216, Bangladesh
Abstract
Deficiencies of the four spectral formats i.e., 2%/50-yr, 5%/50-yr, 10%/50-yr and AASHTO(American Association of State Highway Officials) 2009 demand modification of the spectralformats for bridge design application in Canada. Among them the 10%/50-yr spectrum isdropped from current investigation as its difference with Canadian Highway Bridge DesignCode (CHBDC) 2006 is too large to modify. This study introduces an approach calibratingon the values of elastic seismic response coefficient to provide a new shape of theCanadian bridge design spectrum based on modified 2%/50-yr, modified 5%/50-yr andmodified AASHTO spectral formats. A Digital Visual Fortran program was prepared todetermine the optimum values of the modification factors incorporated into the threespectral formats calibrated on the data of 389 cities of Canada. Thus, here it is developedthe strategies of modifying the three spectral formats based on the best probability level forCHBDC using site-specific Uniform Hazard Spectrum (UHS). Finally, select the most suitablespectral format to apply for the design base shear calculations for the bridges of Canada.
Keywords: Design spectrum, Probability level, Seismic hazard map, Uniform HazardSpectrum, Elastic seismic response coefficient
1 IntroductionThe standardized spectrum, which is constructed using an idealized shape anchoring
on a single control point and has long been used in codes demonstrates several short-
falls. Seismic provisions of many codes in the world, e.g., NBCC (National Building
Code of Canada) in Canada, UBC (Uniform Building Code), IBC (International Build-
ing Code) and AASHTO in the USA (United States of America) etc. have already
adopted uniform hazard spectrum construction method and formats. The concept of
UHS that uses of multiple control points having corresponding site-specific spectral
values does not differ from code to code. But their formats are different depending on
many factors. Such factors include seismic performance of target structures of code ap-
plication, seismic data specific to local geological conditions, modeling techniques of
ground motion characterization, diverse perspective of acceptable risk level among
code writers, and historical performances of structures (Naumoski et al. 2000).
© The Author(s). 2021 Open Access This article is licensed under a Creative Commons Attribution 4.0 International License, whichpermits use, sharing, adaptation, distribution and reproduction in any medium or format, as long as you give appropriate credit to theoriginal author(s) and the source, provide a link to the Creative Commons licence, and indicate if changes were made. The images orother third party material in this article are included in the article's Creative Commons licence, unless indicated otherwise in a creditline to the material. If material is not included in the article's Creative Commons licence and your intended use is not permitted bystatutory regulation or exceeds the permitted use, you will need to obtain permission directly from the copyright holder. To view acopy of this licence, visit http://creativecommons.org/licenses/by/4.0/.
Advances inBridge Engineering
Ahmed Advances in Bridge Engineering (2021) 2:13 https://doi.org/10.1186/s43251-021-00033-y
In Canada, major changes in the seismic provisions for building design have been
made in NBCC (2005). The most noticeable changes include: (i) adoption of UHS as a
spectral shape, and (ii) lowering the probability level for hazard maps. AASHTO (2009)
has also embraced similar seismic provisions in the USA. For bridge design, CHBDC
require similar steps toward that direction.
From the few decades back, several researchers are introduced a number of pro-
cedures keeping low probability level of hazard map to predict the seismic risk.
Joyner with other researchers (1981) developed quarter-wave length approximation
which was widely applied by Boore and Joyner (1997) to derive site amplification
based on local Vs30 measurements. The technique does not create peaks for
ground-motion amplification function because of considering limited facts of seis-
mic wave propagation within geotechnical layers. This procedure calculates average
responses and models considering velocity gradients of that approach may under-
estimate the responses (Boore 2013).
Other researchers revised the empirical approach of Pacific Earthquake Engineering
Research Center (PEER), Next Generation Attenuation (NGA) ground-motion predic-
tion equations (GMPEs) (Boore and Atkinson 2008; Atkinson and Morrison 2009;
Chiou et al. 2010), which is originally developed by Atkinson (2008) and found that
GMPEs have inherent nature of overpredict the ground motions in the range from
small-to-moderate ground-motion amplitudes. Atkinson and Boore’s GMPE eqs. (2006)
highly underestimate the ground-motion amplitudes at higher frequencies comparing
with the recent moderate earthquake events occurred in eastern North America. Later
those equations were incorporated by a regression analysis of the PEER-NGA strong-
motion information compiled from shallow crustal earthquakes in active tectonic re-
gions and adjusted by a ratio of observed and predicted ground-motion amplitudes (At-
kinson and Boore 2011). Later, Atkinson and Adams developed an advanced model of
GMPEs and their epistemic uncertainty directly applicable to the seismic hazard map
in Canada (Atkinson and Adams 2013).
Further development on the NGA models had been initiated from the original NGA-
West1 GMPEs and improved these GMPEs as a partial task of the large multidisciplin-
ary NGA-West2 project to estimate ground motion and aleatory variability for shallow
crustal earthquakes in active tectonic regions (Bozorgnia et al. 2014; Campbell and
Bozorgnia 2014). NGA-West2 project was organized by the PEER. More than 30 NGA
GMPE researchers and developers were collaborated and interacted closely to study a
number of key issues in ground-motion seismic hazard and updated the NGA database
in between the earthquake magnitude range of 3.0 and 7.9 (Ancheta et al. 2013, 2014).
Accordingly, Bozorgnia and Campbell’s (2004) simplified vertical design spectra for
near-source ground motion developed based on the NEHRP Provisions (BSSC 2009)
were updated to NGA-West2 ground-motion models implementing extensive NGA-
West2 database (PEER 2013).
Besides the effort of other researchers, an approach of determining the elastic seismic
response coefficient, Csm using various design spectra of (i) NBCC (2005) format using
4th generation seismic hazard maps of 2% in 50-yr, 5% in 50-yr, 10% in 50-yr as defined
in CHBDC (2006), (ii) AASHTO (2009) format, and (iii) CHBDC (2006) format has
been evaluated in the most recent study. It compared the Csm values with those of
CHBDC (2006), tracked the magnification and reduction of Csm for a set of periods and
Ahmed Advances in Bridge Engineering (2021) 2:13 Page 2 of 24
investigated the best probability level for CHBDC using site-specific UHS. The outcome
of that study indicated that those spectral formats need modification in order to bring
the base shear level in an acceptable range for CHBDC incorporation (Ahmed et al.
2016).
The implication of adopting the uniform hazard spectrum (UHS) in association with
recently published seismic hazard maps for Canada into CHBDC is investigated in this
phase of study. To have a statistically justifiable and broad based conclusion, this re-
search used seismic data for 389 Canadian cities. Three issues are intricately associated
in the analyses: (i) the spectral format, (ii) the probability level of seismic hazard maps,
and (iii) confidence levels of hazard maps. Two code (UHS) formats are considered to
be most relevant for CHBDC application: NBCC (2005) and AASHTO (2009). It is rele-
vant to recall that current and past seismic maps and elastic design spectra of CHBDC
(e.g., those of CHBDC 2006 and previous editions) are primarily developed based on
NBCC and AASHTO provisions.
As far as probability level of hazard maps is associated, during the process of
UHS implementation into the NBCC (2005), the Geological Survey of Canada
(GSC) 2009 published 4th generation seismic hazard maps for several probability
levels such as 2%, 5%, 10% and 40% probability of exceedance in 50 years. NBCC
lowered the probability level from 10% to 2% during its most recent revision.
Other major building codes in North America also lowered the probability level to
2% while incorporating UHS and updated maps into the codes (e.g., UBC and IBC
in the USA). One thing is also important to recall that 4th generation seismic haz-
ard maps used 50th percentile confidence level while the old maps for NBCC
(1995) used 84th percentile. The influence of changing confidence level is signifi-
cant. Heidebrecht (1997, 1999) reported that the ratios of 4th generation hazard
values of 84th and 50th percentiles vary in the range of 1.5 s to 3.0 s. Similar ob-
servations are made in this study. On the other hand, for bridge application,
AASHTO (2009) also lowered the probability level but not to the level of 2% but
of 5%. In this backdrop, this study brought three sets of hazard maps correspond-
ing to 2%, 5% and 10% probability of exceedance in 50 years developed by the GSC
under investigations.
Following five spectral shapes are studied and their description is repeated here for
clarity of presentation:
a. 2%/50-yr – a spectrum that is drawn using spectral coefficients Sa(0.2), Sa(0.5),
Sa(1.0) and Sa(2.0) of 4th generation seismic hazard maps with 2% probability of
exceedance in 50-year according to Section 4.1.8.4 of NBCC (2005).
b. 5%/50-yr – a spectrum that is drawn using spectral coefficients Sa(0.2), Sa(0.5),
Sa(1.0) and Sa(2.0) of 4th generation seismic hazard maps with 5% probability of
exceedance in 50-year according to Section 4.1.8.4 of NBCC (2005).
c. 10%/50-yr – a spectrum that is drawn using spectral coefficients Sa(0.2), Sa(0.5),
Sa(1.0) and Sa(2.0) of 4th generation seismic hazard maps with 10% probability of
exceedance in 50-year according to Section 4.1.8.4 of NBCC (2005).
d. CHBDC – a spectrum that is drawn using zonal acceleration ratio A of CHBDC
(2006) with 10% probability of exceedance in 50-year according to Section 4.4.7 of
CHBDC (2006).
Ahmed Advances in Bridge Engineering (2021) 2:13 Page 3 of 24
e. AASHTO – a spectrum that is drawn using spectral coefficients Sa(0.2) and Sa(1.0)
of 4th generation seismic hazard maps with 5% probability of exceedance in 50-
year according to Section 3.4.1 of AASHTO (2009).
The statistical analysis conducted for the 10%/50-yr spectrum shows that more than
95% of the cities (i.e., about 370 cities out of 389) will have significant drop of base
shear comparing with current shear level of CHBDC (2006). The extents of reduction
of base shear are also quite high: at least 50% reduction for 90% of the 389 cities. There
is a general trend of more reduction with increasing period. This result is neither sur-
prising nor unexpected. Despite the fact that both CHBDC (2006) and 10%/50-yr spec-
tra use maps of the same probability level (i.e., 10% probability of exceedance in 50
years), the reason of big differences of base shears between two spectra is that they use
hazard maps of two different confidence levels; i.e., CHBDC (2006) uses 50th percentile
but 10%/50-yr uses 84th percentile. The big drop of base shear makes the 10%/50-yr
spectrum unacceptable of use in the future CHBDC. In other words, 4th generation
seismic hazard maps with 10% probability of exceedance in 50-year should not be used
for next CHBDC edition.
The statistical analyses conducted for the 5%/50-yr spectrum show similar trend of
10%/50-yr spectrum but the extents of amplification happen in a lesser scale. Again the
drop of base shear is observed for most of the cities. The magnitudes of reduction of
base shear are big enough to be concerned. Same general trend of more reduction with
increasing periods are noticeable. In general, it is concluded that the adoption of this
spectrum in its present shape into CHBDC is not practical. However, the nature of base
shear level variation suggests that this spectrum can be ‘modified’ to bring the base
shear level in an acceptable range.
For the 2%/50-yr spectrum, the statistical analyses reveal that for shorter period
range, there will be an increase but for longer period range, there will be signifi-
cant decrease of base shear from that of the current CHBDC provision. Similar to
the 5%/50-yr spectrum, the nature of base shear level variation for 2%/50-yr sug-
gests that this spectrum can also be ‘modified’ to bring the base shear level in an
acceptable range. However, the degree of modification will not be as high as of
5%/50-yr spectrum.
Since, AASHTO uses 4th generation seismic hazard maps with 5% probability of ex-
ceedance in 50-year, the comments made for the statistical analyses of 5%/50-yr
spectrum work well for AASHTO spectrum. Again, the nature of base shear level vari-
ation suggests that this spectrum needs to be ‘modified’ for CHBDC incorporation to
bring the base shear level in an acceptable range. However, a different approach is
needed for modification.
On the backdrop of the aforementioned observations made from the statistical
analyses, it is observed that the design spectra under consideration need to be
fixed if the concept of UHS and the new hazard maps are to be implemented into
CHBDC. An approach to select an appropriate design spectrum likely to be imple-
mented in the next CHBDC will require a combination of engineering judgment
and calibration to existing practice. The spectral shapes represent the hazard which
must be the same for any type of bridges. From that perspective, variations on
how to resist the hazard should be handled in the design approach. Therefore, this
Ahmed Advances in Bridge Engineering (2021) 2:13 Page 4 of 24
extended study work outs the strategies of modifying the three spectral formats
(i.e., 2%/50-yr, 5%/50-yr and AASHTO). Eventually, the most suitable spectral for-
mat from those modified spectra is recommended for next CHBDC edition.
2 General trend of design spectra based on 4th generation seismic hazardmapsThe statistical analyses using the seismic hazard data of 389 cities well demon-
strated the fact that none of the uniform hazard spectral formats based on 4th
generation seismic hazard maps (2%/50-yr, 5%/50-yr, 10%/50-yr and AASHTO)
produces consistent results in terms of normalized elastic seismic coefficient C�sm
across the geographical boundary of application as well as across the range of
period (Ahmed et al. 2016). The major concern of using the 4th generation seismic
hazard maps is that the resultant base shear will be very low irrespective of period
range based on 4th generation hazard maps compared to current level. The impli-
cation here is that the seismic hazard maps of CHBDC (2006) and NBCC (1995)
are ‘very conservative’. It is also noteworthy that the degree of conservatism is not
constant with period and varies with period and probability level. Any new spectral
format based on 4th generation seismic hazard maps (of any probability levels
under consideration) is bound to reduce the magnitude of base shear values from
the current CHBDC (2006) level for most of the cases. There will be a huge dis-
comfort to adopt the 4th generation seismic hazard maps in the CHBDC with such
prospects because the historical performances of thousands of bridges which have
been designed and constructed during last several decades in Canada do not have
any noticeable records of poor performances during and after the seismic events
occurred. Such history of satisfactory performance of bridges in Canada does not
permit big change in the level of current base shear. On the other hand, the 4th
generation seismic hazard maps are based on enriched inventory of seismic data/
events, better hazard modeling techniques and significant progress on ground mo-
tion characterization. The same is true for uniform hazard spectral format. Adop-
tion of these two important facets of seismic engineering development into
CHBDC is inevitable and unavoidable. To that end, this study proposes some
modification of the 2%/50-yr, 5%/50-yr and AASHTO formats and establishes the
validity of such modification.
3 Approach for spectra modificationPresent analysis is focused on introducing and applying modification factors to the
code specified formats that will bring improvement of C�sm distribution corresponding
to 389 Canadian cities in the C�sm vs. T diagram, where C�
sm is defined as
C�sm Tð Þ ¼ Csm − sq Tð Þ=Csm − CHBDC Tð Þ ð1Þ
where Csm-sq(T) is the elastic seismic coefficient for a period T obtained from the
spectrum in question, and.
Csm-CHBDC(T) is the elastic seismic coefficient for a period T obtained from the
spectrum defined by CHBDC (2006).
As this study is in search of a UHS spectrum in a modified format that does not bring
a radical change in the magnitude of current CHBDC base shear level (i.e., no large
Ahmed Advances in Bridge Engineering (2021) 2:13 Page 5 of 24
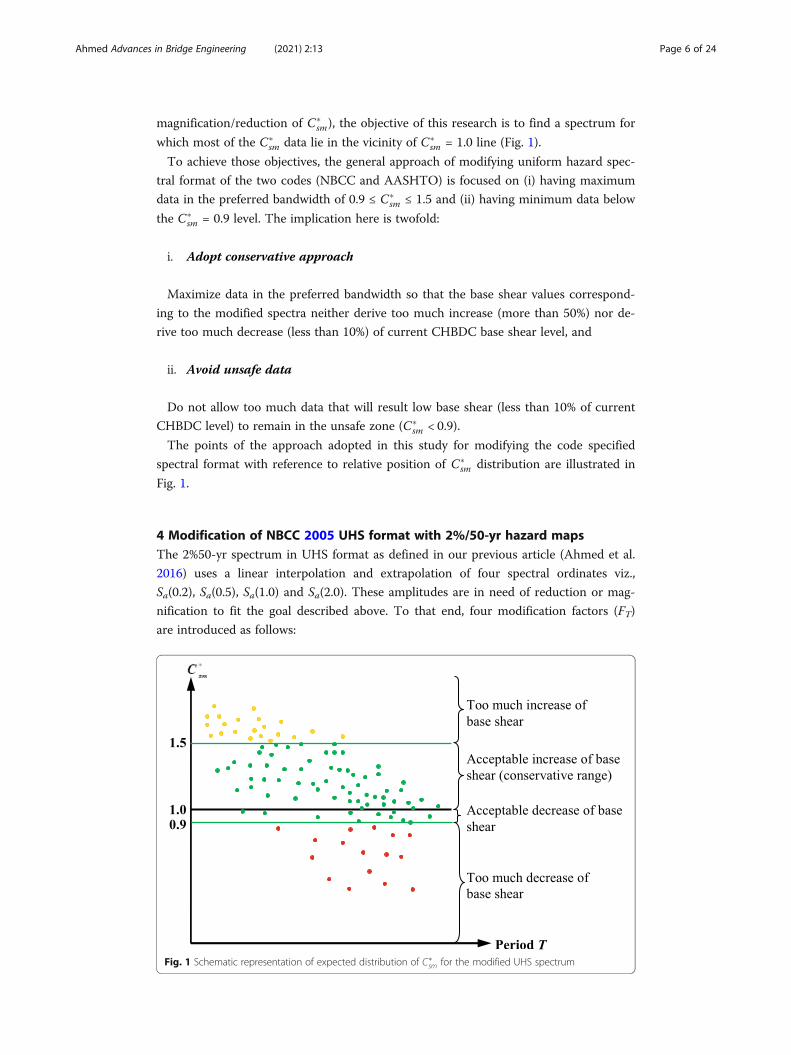
magnification/reduction of C�sm), the objective of this research is to find a spectrum for
which most of the C�sm data lie in the vicinity of C�
sm = 1.0 line (Fig. 1).
To achieve those objectives, the general approach of modifying uniform hazard spec-
tral format of the two codes (NBCC and AASHTO) is focused on (i) having maximum
data in the preferred bandwidth of 0.9 ≤ C�sm ≤ 1.5 and (ii) having minimum data below
the C�sm = 0.9 level. The implication here is twofold:
i. Adopt conservative approach
Maximize data in the preferred bandwidth so that the base shear values correspond-
ing to the modified spectra neither derive too much increase (more than 50%) nor de-
rive too much decrease (less than 10%) of current CHBDC base shear level, and
ii. Avoid unsafe data
Do not allow too much data that will result low base shear (less than 10% of current
CHBDC level) to remain in the unsafe zone (C�sm < 0.9).
The points of the approach adopted in this study for modifying the code specified
spectral format with reference to relative position of C�sm distribution are illustrated in
Fig. 1.
4 Modification of NBCC 2005 UHS format with 2%/50-yr hazard mapsThe 2%50-yr spectrum in UHS format as defined in our previous article (Ahmed et al.
2016) uses a linear interpolation and extrapolation of four spectral ordinates viz.,
Sa(0.2), Sa(0.5), Sa(1.0) and Sa(2.0). These amplitudes are in need of reduction or mag-
nification to fit the goal described above. To that end, four modification factors (FT)
are introduced as follows:
Fig. 1 Schematic representation of expected distribution of C�sm for the modified UHS spectrum
Ahmed Advances in Bridge Engineering (2021) 2:13 Page 6 of 24
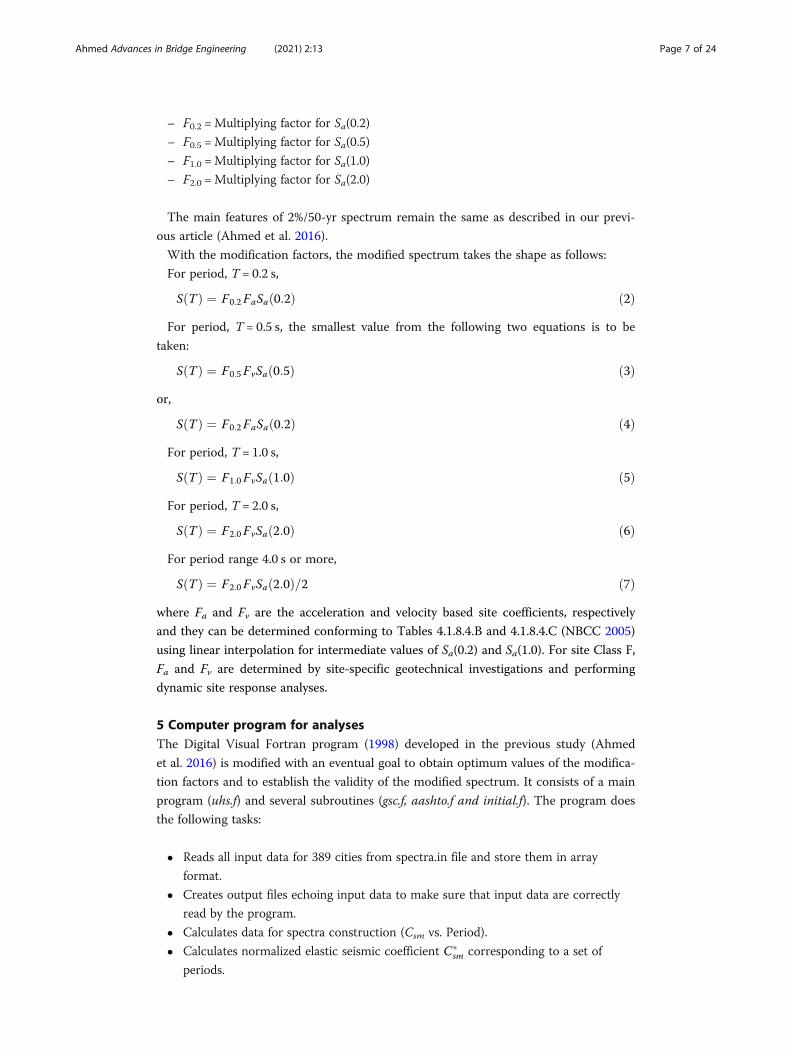
– F0.2 =Multiplying factor for Sa(0.2)
– F0.5 =Multiplying factor for Sa(0.5)
– F1.0 =Multiplying factor for Sa(1.0)
– F2.0 =Multiplying factor for Sa(2.0)
The main features of 2%/50-yr spectrum remain the same as described in our previ-
ous article (Ahmed et al. 2016).
With the modification factors, the modified spectrum takes the shape as follows:
For period, T = 0.2 s,
S Tð Þ ¼ F0:2FaSa 0:2ð Þ ð2ÞFor period, T = 0.5 s, the smallest value from the following two equations is to be
taken:
S Tð Þ ¼ F0:5FvSa 0:5ð Þ ð3Þor,
S Tð Þ ¼ F0:2FaSa 0:2ð Þ ð4ÞFor period, T = 1.0 s,
S Tð Þ ¼ F1:0FvSa 1:0ð Þ ð5Þ
For period, T = 2.0 s,
S Tð Þ ¼ F2:0FvSa 2:0ð Þ ð6Þ
For period range 4.0 s or more,
S Tð Þ ¼ F2:0FvSa 2:0ð Þ=2 ð7Þ
where Fa and Fv are the acceleration and velocity based site coefficients, respectively
and they can be determined conforming to Tables 4.1.8.4.B and 4.1.8.4.C (NBCC 2005)
using linear interpolation for intermediate values of Sa(0.2) and Sa(1.0). For site Class F,
Fa and Fv are determined by site-specific geotechnical investigations and performing
dynamic site response analyses.
5 Computer program for analysesThe Digital Visual Fortran program (1998) developed in the previous study (Ahmed
et al. 2016) is modified with an eventual goal to obtain optimum values of the modifica-
tion factors and to establish the validity of the modified spectrum. It consists of a main
program (uhs.f) and several subroutines (gsc.f, aashto.f and initial.f). The program does
the following tasks:
� Reads all input data for 389 cities from spectra.in file and store them in array
format.
� Creates output files echoing input data to make sure that input data are correctly
read by the program.
� Calculates data for spectra construction (Csm vs. Period).
� Calculates normalized elastic seismic coefficient C�sm corresponding to a set of
periods.
Ahmed Advances in Bridge Engineering (2021) 2:13 Page 7 of 24
� Does the statistical analyses from the distribution of C�sm of 389 cities to examine
the trend of magnification/reduction of Csm values corresponding to those of
current CHBDC [2006] along the range of period.
� Writes several output files to save the aforementioned numerical results for
subsequent analyses and plotting.
� Present and discuss the aggregate results based on statistical analyses using all data
corresponding to 389 cities.
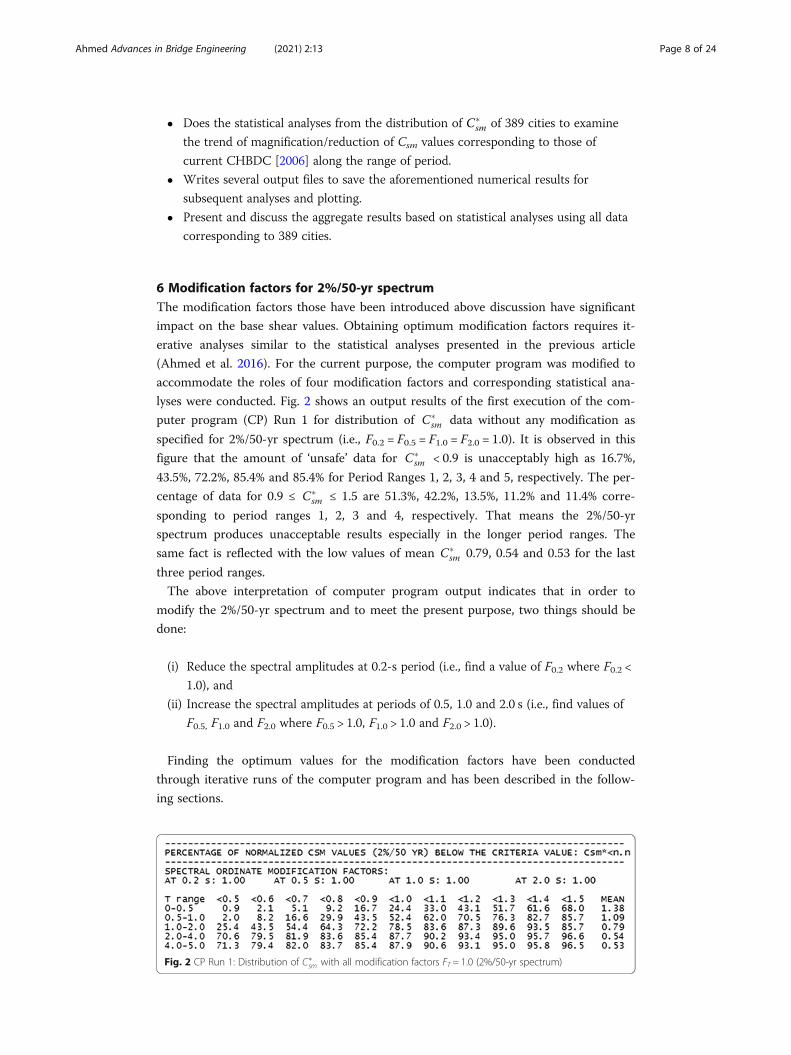
6 Modification factors for 2%/50-yr spectrumThe modification factors those have been introduced above discussion have significant
impact on the base shear values. Obtaining optimum modification factors requires it-
erative analyses similar to the statistical analyses presented in the previous article
(Ahmed et al. 2016). For the current purpose, the computer program was modified to
accommodate the roles of four modification factors and corresponding statistical ana-
lyses were conducted. Fig. 2 shows an output results of the first execution of the com-
puter program (CP) Run 1 for distribution of C�sm data without any modification as
specified for 2%/50-yr spectrum (i.e., F0.2 = F0.5 = F1.0 = F2.0 = 1.0). It is observed in this
figure that the amount of ‘unsafe’ data for C�sm < 0.9 is unacceptably high as 16.7%,
43.5%, 72.2%, 85.4% and 85.4% for Period Ranges 1, 2, 3, 4 and 5, respectively. The per-
centage of data for 0.9 ≤ C�sm ≤ 1.5 are 51.3%, 42.2%, 13.5%, 11.2% and 11.4% corre-
sponding to period ranges 1, 2, 3 and 4, respectively. That means the 2%/50-yr
spectrum produces unacceptable results especially in the longer period ranges. The
same fact is reflected with the low values of mean C�sm 0.79, 0.54 and 0.53 for the last
three period ranges.
The above interpretation of computer program output indicates that in order to
modify the 2%/50-yr spectrum and to meet the present purpose, two things should be
done:
(i) Reduce the spectral amplitudes at 0.2-s period (i.e., find a value of F0.2 where F0.2 <
1.0), and
(ii) Increase the spectral amplitudes at periods of 0.5, 1.0 and 2.0 s (i.e., find values of
F0.5, F1.0 and F2.0 where F0.5 > 1.0, F1.0 > 1.0 and F2.0 > 1.0).
Finding the optimum values for the modification factors have been conducted
through iterative runs of the computer program and has been described in the follow-
ing sections.
Fig. 2 CP Run 1: Distribution of C�sm with all modification factors FT = 1.0 (2%/50-yr spectrum)
Ahmed Advances in Bridge Engineering (2021) 2:13 Page 8 of 24
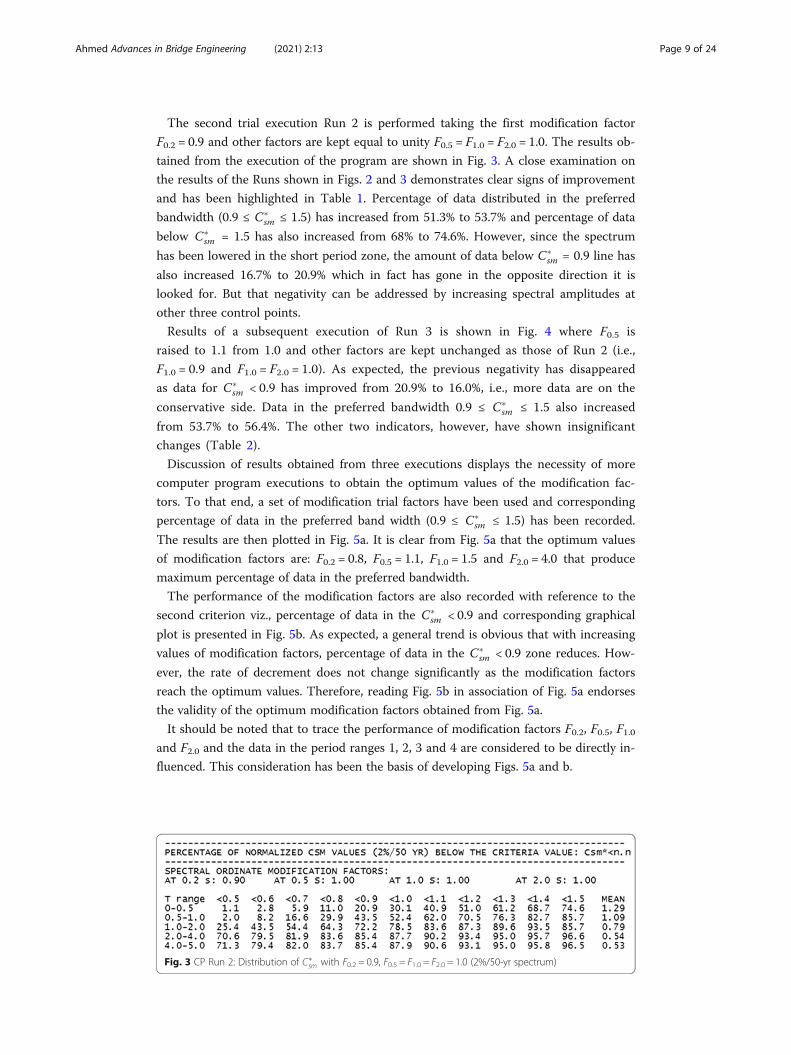
The second trial execution Run 2 is performed taking the first modification factor
F0.2 = 0.9 and other factors are kept equal to unity F0.5 = F1.0 = F2.0 = 1.0. The results ob-
tained from the execution of the program are shown in Fig. 3. A close examination on
the results of the Runs shown in Figs. 2 and 3 demonstrates clear signs of improvement
and has been highlighted in Table 1. Percentage of data distributed in the preferred
bandwidth (0.9 ≤ C�sm ≤ 1.5) has increased from 51.3% to 53.7% and percentage of data
below C�sm = 1.5 has also increased from 68% to 74.6%. However, since the spectrum
has been lowered in the short period zone, the amount of data below C�sm = 0.9 line has
also increased 16.7% to 20.9% which in fact has gone in the opposite direction it is
looked for. But that negativity can be addressed by increasing spectral amplitudes at
other three control points.
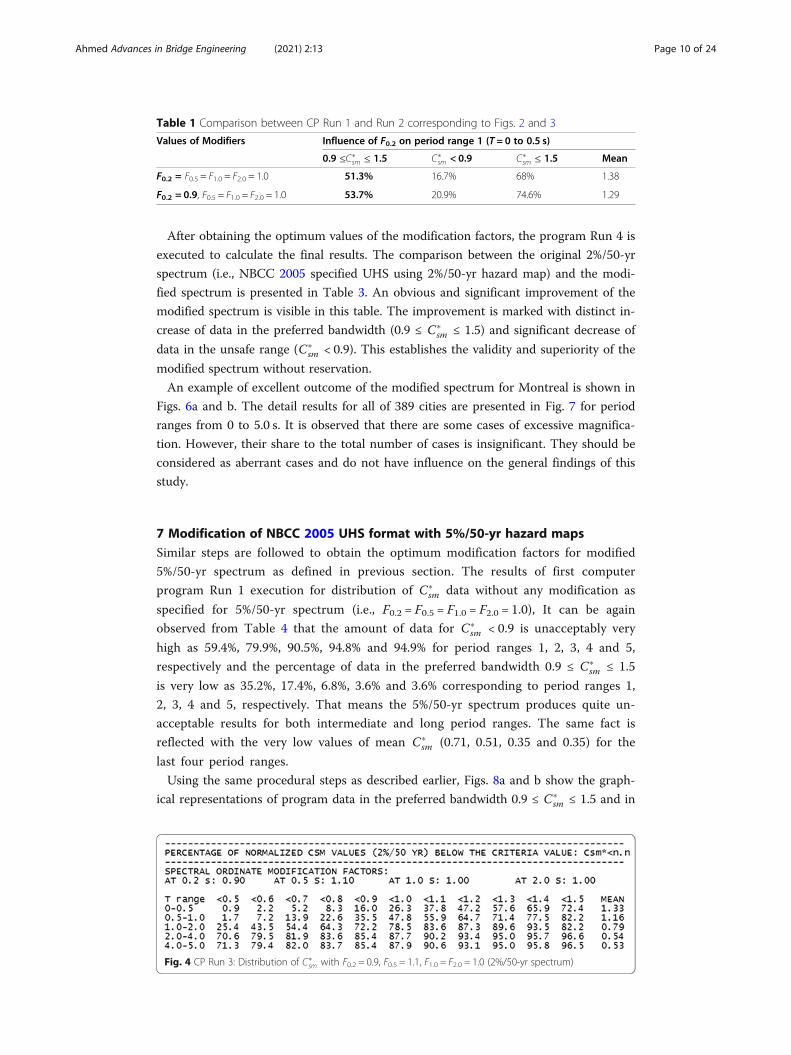
Results of a subsequent execution of Run 3 is shown in Fig. 4 where F0.5 is
raised to 1.1 from 1.0 and other factors are kept unchanged as those of Run 2 (i.e.,
F1.0 = 0.9 and F1.0 = F2.0 = 1.0). As expected, the previous negativity has disappeared
as data for C�sm < 0.9 has improved from 20.9% to 16.0%, i.e., more data are on the
conservative side. Data in the preferred bandwidth 0.9 ≤ C�sm ≤ 1.5 also increased
from 53.7% to 56.4%. The other two indicators, however, have shown insignificant
changes (Table 2).
Discussion of results obtained from three executions displays the necessity of more
computer program executions to obtain the optimum values of the modification fac-
tors. To that end, a set of modification trial factors have been used and corresponding
percentage of data in the preferred band width (0.9 ≤ C�sm ≤ 1.5) has been recorded.
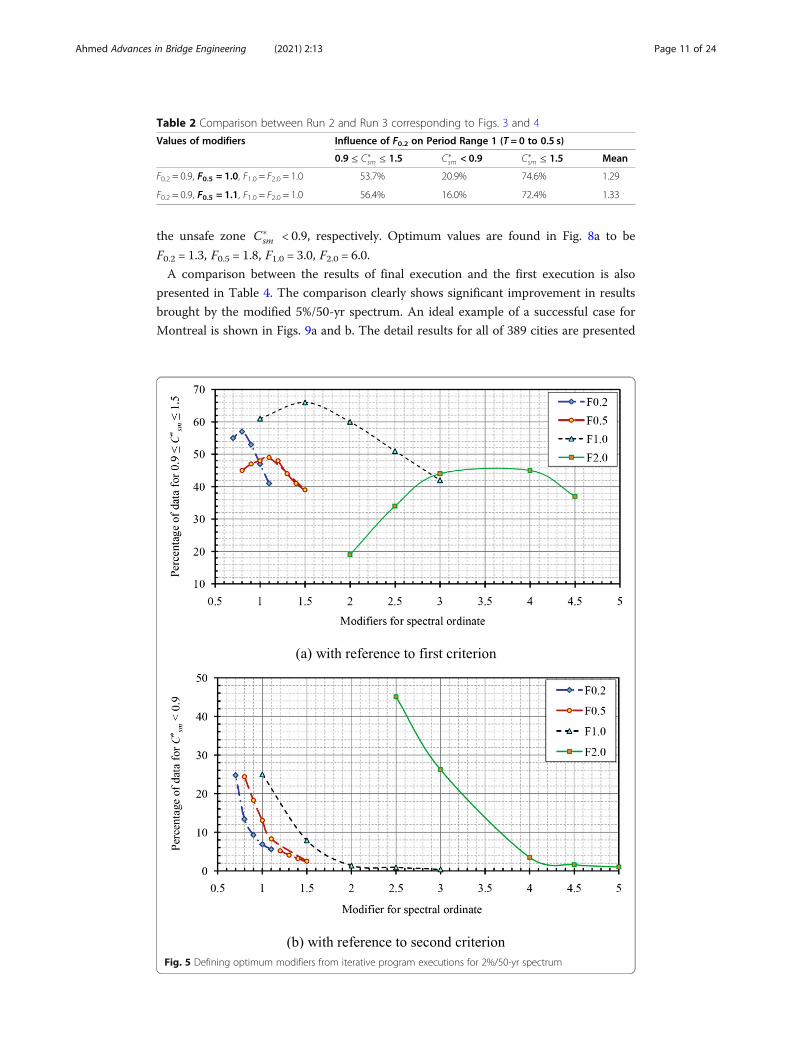
The results are then plotted in Fig. 5a. It is clear from Fig. 5a that the optimum values
of modification factors are: F0.2 = 0.8, F0.5 = 1.1, F1.0 = 1.5 and F2.0 = 4.0 that produce
maximum percentage of data in the preferred bandwidth.
The performance of the modification factors are also recorded with reference to the
second criterion viz., percentage of data in the C�sm < 0.9 and corresponding graphical
plot is presented in Fig. 5b. As expected, a general trend is obvious that with increasing
values of modification factors, percentage of data in the C�sm < 0.9 zone reduces. How-
ever, the rate of decrement does not change significantly as the modification factors
reach the optimum values. Therefore, reading Fig. 5b in association of Fig. 5a endorses
the validity of the optimum modification factors obtained from Fig. 5a.
It should be noted that to trace the performance of modification factors F0.2, F0.5, F1.0and F2.0 and the data in the period ranges 1, 2, 3 and 4 are considered to be directly in-
fluenced. This consideration has been the basis of developing Figs. 5a and b.
Fig. 3 CP Run 2: Distribution of C�sm with F0.2 = 0.9, F0.5 = F1.0 = F2.0 = 1.0 (2%/50-yr spectrum)
Ahmed Advances in Bridge Engineering (2021) 2:13 Page 9 of 24
After obtaining the optimum values of the modification factors, the program Run 4 is
executed to calculate the final results. The comparison between the original 2%/50-yr
spectrum (i.e., NBCC 2005 specified UHS using 2%/50-yr hazard map) and the modi-
fied spectrum is presented in Table 3. An obvious and significant improvement of the
modified spectrum is visible in this table. The improvement is marked with distinct in-
crease of data in the preferred bandwidth (0.9 ≤ C�sm ≤ 1.5) and significant decrease of
data in the unsafe range (C�sm < 0.9). This establishes the validity and superiority of the
modified spectrum without reservation.
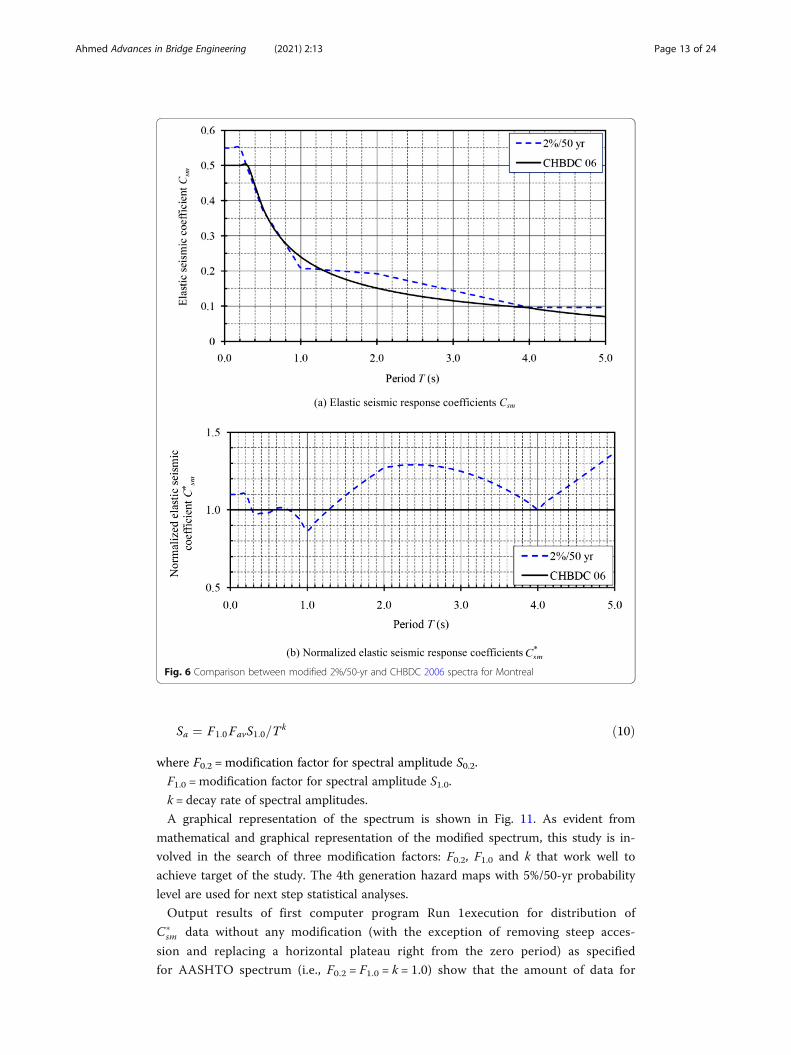
An example of excellent outcome of the modified spectrum for Montreal is shown in
Figs. 6a and b. The detail results for all of 389 cities are presented in Fig. 7 for period
ranges from 0 to 5.0 s. It is observed that there are some cases of excessive magnifica-
tion. However, their share to the total number of cases is insignificant. They should be
considered as aberrant cases and do not have influence on the general findings of this
study.
7 Modification of NBCC 2005 UHS format with 5%/50-yr hazard mapsSimilar steps are followed to obtain the optimum modification factors for modified
5%/50-yr spectrum as defined in previous section. The results of first computer
program Run 1 execution for distribution of C�sm data without any modification as
specified for 5%/50-yr spectrum (i.e., F0.2 = F0.5 = F1.0 = F2.0 = 1.0), It can be again
observed from Table 4 that the amount of data for C�sm < 0.9 is unacceptably very
high as 59.4%, 79.9%, 90.5%, 94.8% and 94.9% for period ranges 1, 2, 3, 4 and 5,
respectively and the percentage of data in the preferred bandwidth 0.9 ≤ C�sm ≤ 1.5
is very low as 35.2%, 17.4%, 6.8%, 3.6% and 3.6% corresponding to period ranges 1,
2, 3, 4 and 5, respectively. That means the 5%/50-yr spectrum produces quite un-
acceptable results for both intermediate and long period ranges. The same fact is
reflected with the very low values of mean C�sm (0.71, 0.51, 0.35 and 0.35) for the
last four period ranges.
Using the same procedural steps as described earlier, Figs. 8a and b show the graph-
ical representations of program data in the preferred bandwidth 0.9 ≤ C�sm ≤ 1.5 and in
Table 1 Comparison between CP Run 1 and Run 2 corresponding to Figs. 2 and 3
Values of Modifiers Influence of F0.2 on period range 1 (T = 0 to 0.5 s)
0.9 ≤C�sm ≤ 1.5 C�
sm < 0.9 C�sm ≤ 1.5 Mean
F0.2 = F0.5 = F1.0 = F2.0 = 1.0 51.3% 16.7% 68% 1.38
F0.2 = 0.9, F0.5 = F1.0 = F2.0 = 1.0 53.7% 20.9% 74.6% 1.29
Fig. 4 CP Run 3: Distribution of C�sm with F0.2 = 0.9, F0.5 = 1.1, F1.0 = F2.0 = 1.0 (2%/50-yr spectrum)
Ahmed Advances in Bridge Engineering (2021) 2:13 Page 10 of 24
the unsafe zone C�sm < 0.9, respectively. Optimum values are found in Fig. 8a to be
F0.2 = 1.3, F0.5 = 1.8, F1.0 = 3.0, F2.0 = 6.0.
A comparison between the results of final execution and the first execution is also
presented in Table 4. The comparison clearly shows significant improvement in results
brought by the modified 5%/50-yr spectrum. An ideal example of a successful case for
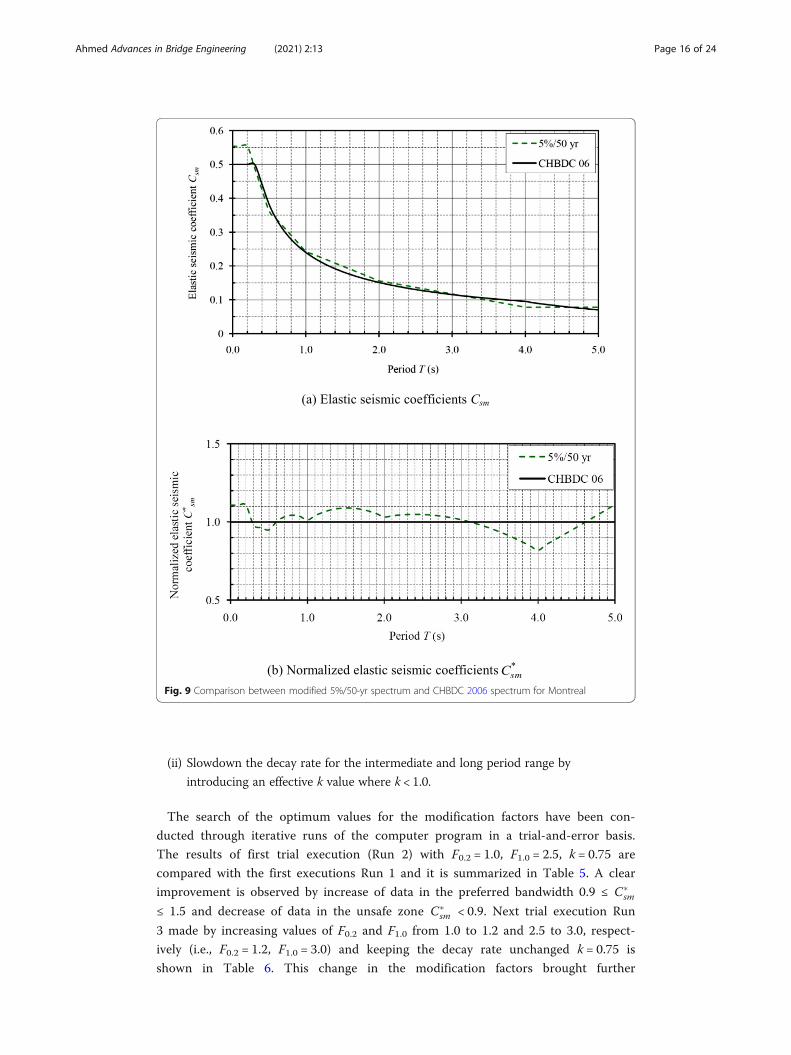
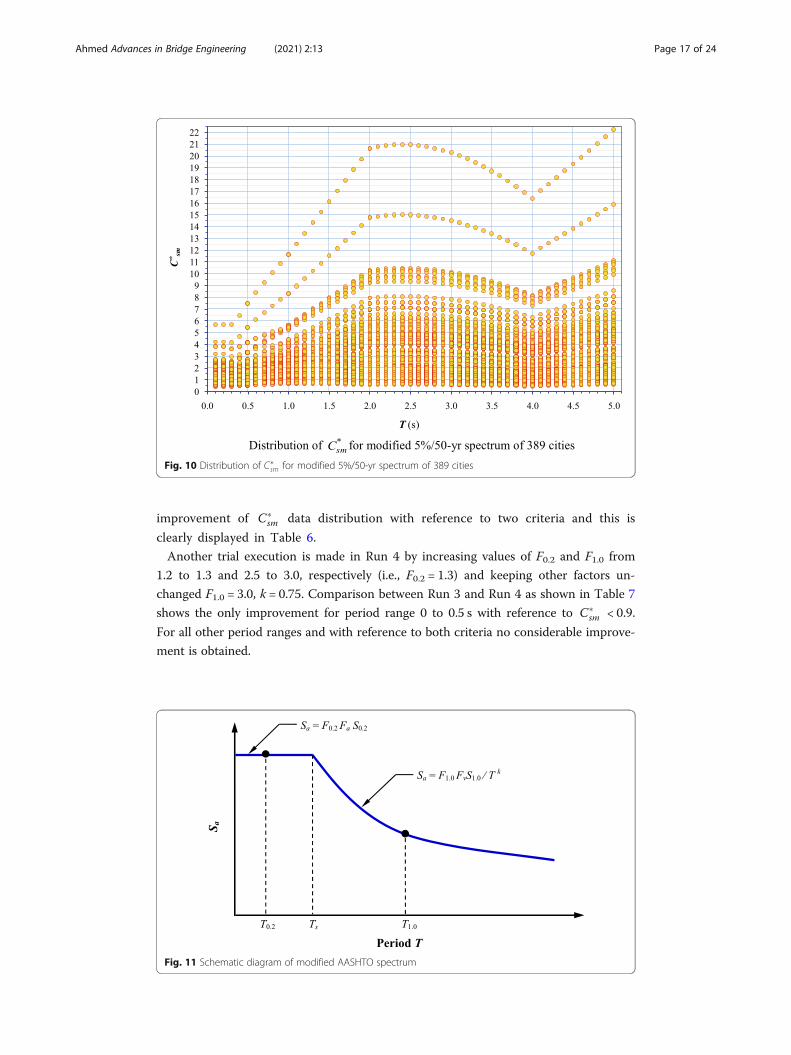
Montreal is shown in Figs. 9a and b. The detail results for all of 389 cities are presented
Table 2 Comparison between Run 2 and Run 3 corresponding to Figs. 3 and 4
Values of modifiers Influence of F0.2 on Period Range 1 (T = 0 to 0.5 s)
0.9 ≤ C�sm ≤ 1.5 C�
sm < 0.9 C�sm ≤ 1.5 Mean
F0.2 = 0.9, F0.5 = 1.0, F1.0 = F2.0 = 1.0 53.7% 20.9% 74.6% 1.29
F0.2 = 0.9, F0.5 = 1.1, F1.0 = F2.0 = 1.0 56.4% 16.0% 72.4% 1.33
Fig. 5 Defining optimum modifiers from iterative program executions for 2%/50-yr spectrum
Ahmed Advances in Bridge Engineering (2021) 2:13 Page 11 of 24
in Fig. 10 for period ranges from 0 to 5.0 s. There are some cases of excessive magnifi-
cation and other cases of far below from C�sm = 0.9 level; however, their share to the
total number of case is insignificant. They should be treated as divergent issues and do
not have any effect on the general findings of this study.
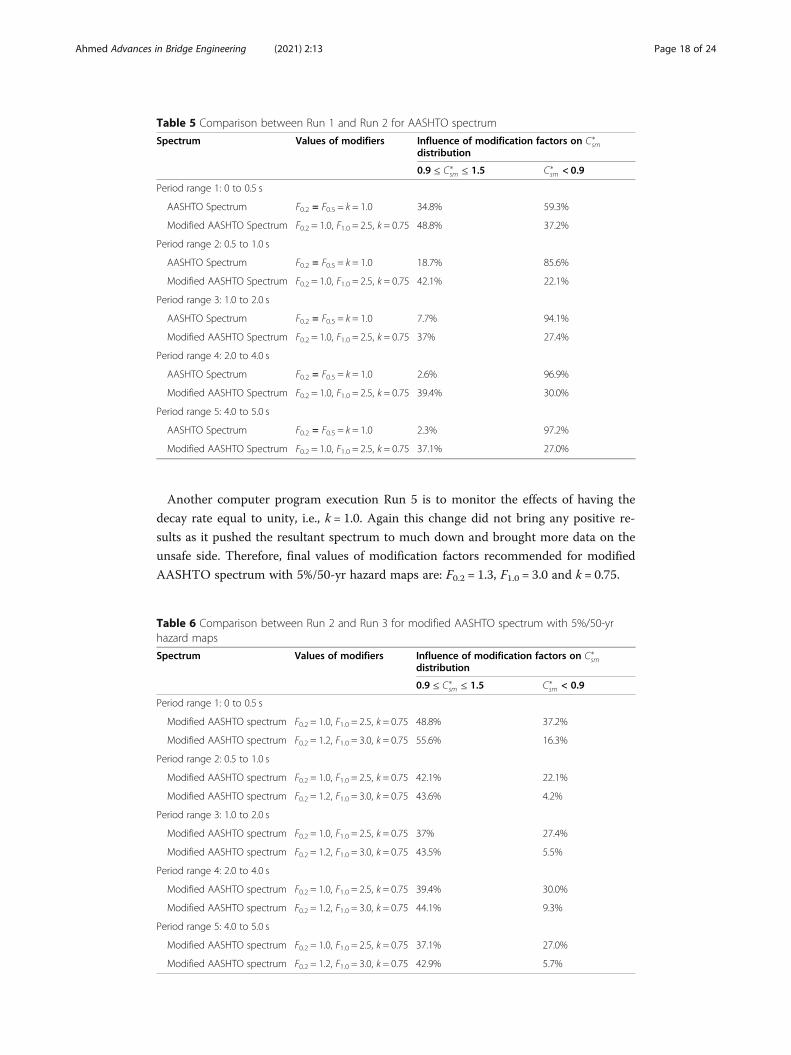
8 Modification of AASHTO 2009 UHS format with 5%/50-yr hazard mapsThe modified version of the AASHTO spectrum proposed here consists of two line
segments: (i) one horizontal line starting right from zero period until a period TS which
marks the end point of constant pseudo-acceleration region and (ii) an exponential line
segment as a function of T k starting from the period TS and continued until the prac-
tical range of period of applicability marking typically the zones of constant pseudo-
velocity and constant displacement zones. The exponential k is introduced here to con-
trol the decay rate of spectral amplitudes in the intermediate and long range periods
with an objective to avoid the too much reduction of elastic seismic response coeffi-
cient Csm comparing to current CHBDC provision. Similar approach is adopted to ob-
tain TS as given by AASHTO (2009).
The mathematical expressions of the modified AASHTO spectrum are given in the
following equations:
For T ≤ TS, the design response spectral acceleration coefficient Sa is
Sa ¼ F0:2FaS0:2 ð8Þ
in which
Ts ¼ F1:0FvS1:0ð Þ= F0:2FaS0:2ð Þð Þ1=k ð9Þ
The design response spectral acceleration coefficient Sa is defined for periods greater
than TS as follows:
Table 3 Comparison between Run 1 and Run 4 for 2%/50-yr spectrum
Spectrum Values of Modifiers Influence of modification factors on C�sm
distribution
0.9 ≤ C�sm ≤ 1.5 C�
sm < 0.9
Period range 1: 0 to 0.5 s
2%/50-yr NBCC spectrum F0.2 = F0.5 = F1.0 = F2.0 = 1.0 51.3% 16.7%
Modified spectrum F0.2 = 0.8, F0.5 = 1.1, F1.0 = 1.5, F2.0 = 4.0 57.9% 21.3%
Period range 2: 0.5 to 1.0 s
2%/50-yr NBCC spectrum F0.2 = F0.5 = F1.0 = F2.0 = 1.0 42.2% 43.5%
Modified spectrum F0.2 = 0.8, F0.5 = 1.1, F1.0 = 1.5, F2.0 = 4.0 51.4% 18.2%
Period range 3: 1.0 to 2.0 s
2%/50-yr NBCC spectrum F0.2 = F0.5 = F1.0 = F2.0 = 1.0 13.5% 72.2%
Modified spectrum F0.2 = 0.8, F0.5 = 1.1, F1.0 = 1.5, F2.0 = 4.0 61.7% 7.9%
Period range 4: 2.0 to 4.0 s
2%/50-yr NBCC spectrum F0.2 = F0.5 = F1.0 = F2.0 = 1.0 11.2% 85.4%
Modified spectrum F0.2 = 0.8, F0.5 = 1.1, F1.0 = 1.5, F2.0 = 4.0 45.1% 3.5%
Period range 5: 4.0 to 5.0 s
2%/50-yr NBCC spectrum F0.2 = F0.5 = F1.0 = F2.0 = 1.0 11.1% 85.4%
Modified spectrum F0.2 = 0.8, F0.5 = 1.1, F1.0 = 1.5, F2.0 = 4.0 45.6% 3.5%
Ahmed Advances in Bridge Engineering (2021) 2:13 Page 12 of 24
Sa ¼ F1:0FavS1:0=Tk ð10Þ
where F0.2 = modification factor for spectral amplitude S0.2.
F1.0 = modification factor for spectral amplitude S1.0.
k = decay rate of spectral amplitudes.
A graphical representation of the spectrum is shown in Fig. 11. As evident from
mathematical and graphical representation of the modified spectrum, this study is in-
volved in the search of three modification factors: F0.2, F1.0 and k that work well to
achieve target of the study. The 4th generation hazard maps with 5%/50-yr probability
level are used for next step statistical analyses.
Output results of first computer program Run 1execution for distribution of
C�sm data without any modification (with the exception of removing steep acces-
sion and replacing a horizontal plateau right from the zero period) as specified
for AASHTO spectrum (i.e., F0.2 = F1.0 = k = 1.0) show that the amount of data for
Fig. 6 Comparison between modified 2%/50-yr and CHBDC 2006 spectra for Montreal
Ahmed Advances in Bridge Engineering (2021) 2:13 Page 13 of 24
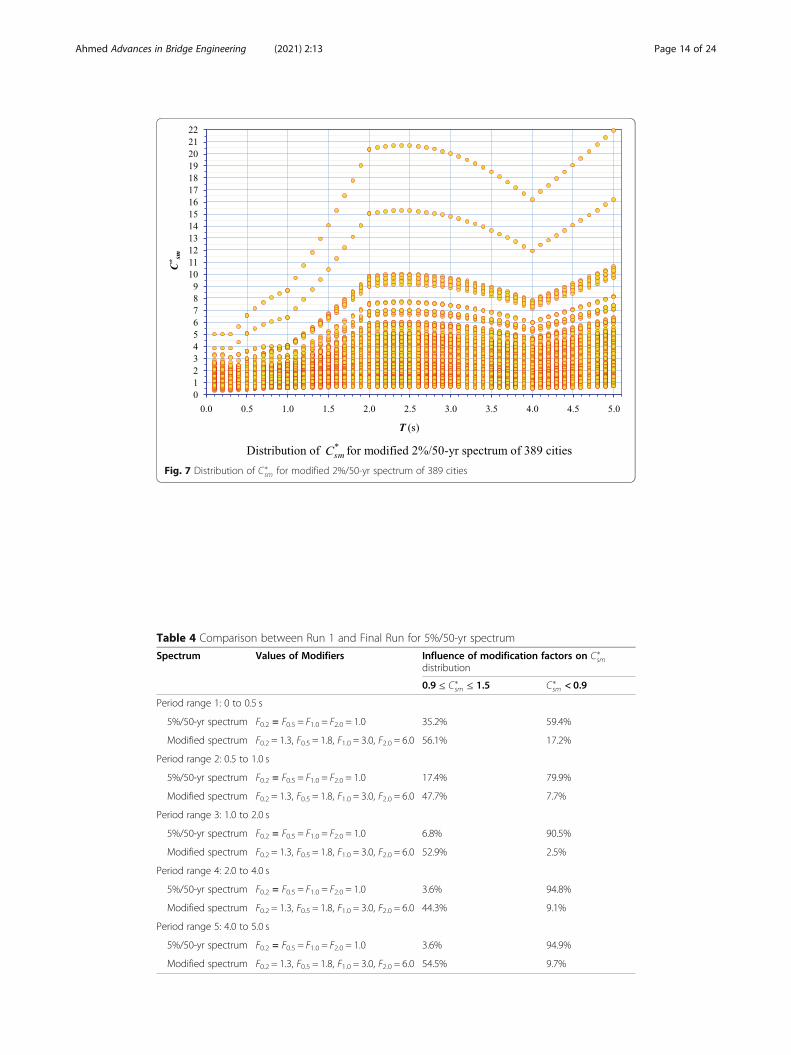
Fig. 7 Distribution of C�sm for modified 2%/50-yr spectrum of 389 cities
Table 4 Comparison between Run 1 and Final Run for 5%/50-yr spectrum
Spectrum Values of Modifiers Influence of modification factors on C�sm
distribution
0.9 ≤ C�sm ≤ 1.5 C�
sm < 0.9
Period range 1: 0 to 0.5 s
5%/50-yr spectrum F0.2 = F0.5 = F1.0 = F2.0 = 1.0 35.2% 59.4%
Modified spectrum F0.2 = 1.3, F0.5 = 1.8, F1.0 = 3.0, F2.0 = 6.0 56.1% 17.2%
Period range 2: 0.5 to 1.0 s
5%/50-yr spectrum F0.2 = F0.5 = F1.0 = F2.0 = 1.0 17.4% 79.9%
Modified spectrum F0.2 = 1.3, F0.5 = 1.8, F1.0 = 3.0, F2.0 = 6.0 47.7% 7.7%
Period range 3: 1.0 to 2.0 s
5%/50-yr spectrum F0.2 = F0.5 = F1.0 = F2.0 = 1.0 6.8% 90.5%
Modified spectrum F0.2 = 1.3, F0.5 = 1.8, F1.0 = 3.0, F2.0 = 6.0 52.9% 2.5%
Period range 4: 2.0 to 4.0 s
5%/50-yr spectrum F0.2 = F0.5 = F1.0 = F2.0 = 1.0 3.6% 94.8%
Modified spectrum F0.2 = 1.3, F0.5 = 1.8, F1.0 = 3.0, F2.0 = 6.0 44.3% 9.1%
Period range 5: 4.0 to 5.0 s
5%/50-yr spectrum F0.2 = F0.5 = F1.0 = F2.0 = 1.0 3.6% 94.9%
Modified spectrum F0.2 = 1.3, F0.5 = 1.8, F1.0 = 3.0, F2.0 = 6.0 54.5% 9.7%
Ahmed Advances in Bridge Engineering (2021) 2:13 Page 14 of 24
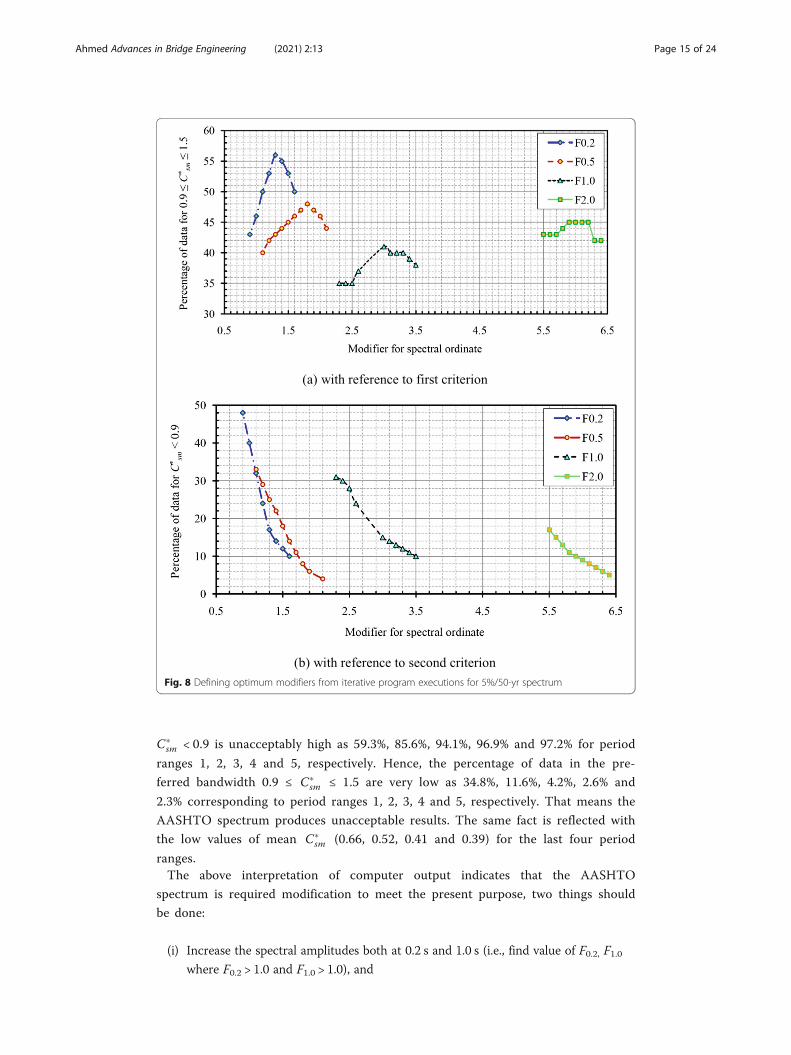
C�sm < 0.9 is unacceptably high as 59.3%, 85.6%, 94.1%, 96.9% and 97.2% for period
ranges 1, 2, 3, 4 and 5, respectively. Hence, the percentage of data in the pre-
ferred bandwidth 0.9 ≤ C�sm ≤ 1.5 are very low as 34.8%, 11.6%, 4.2%, 2.6% and
2.3% corresponding to period ranges 1, 2, 3, 4 and 5, respectively. That means the
AASHTO spectrum produces unacceptable results. The same fact is reflected with
the low values of mean C�sm (0.66, 0.52, 0.41 and 0.39) for the last four period
ranges.The above interpretation of computer output indicates that the AASHTO
spectrum is required modification to meet the present purpose, two things should
be done:
(i) Increase the spectral amplitudes both at 0.2 s and 1.0 s (i.e., find value of F0.2, F1.0where F0.2 > 1.0 and F1.0 > 1.0), and
Fig. 8 Defining optimum modifiers from iterative program executions for 5%/50-yr spectrum
Ahmed Advances in Bridge Engineering (2021) 2:13 Page 15 of 24
(ii) Slowdown the decay rate for the intermediate and long period range by
introducing an effective k value where k < 1.0.
The search of the optimum values for the modification factors have been con-
ducted through iterative runs of the computer program in a trial-and-error basis.
The results of first trial execution (Run 2) with F0.2 = 1.0, F1.0 = 2.5, k = 0.75 are
compared with the first executions Run 1 and it is summarized in Table 5. A clear
improvement is observed by increase of data in the preferred bandwidth 0.9 ≤ C�sm
≤ 1.5 and decrease of data in the unsafe zone C�sm < 0.9. Next trial execution Run
3 made by increasing values of F0.2 and F1.0 from 1.0 to 1.2 and 2.5 to 3.0, respect-
ively (i.e., F0.2 = 1.2, F1.0 = 3.0) and keeping the decay rate unchanged k = 0.75 is
shown in Table 6. This change in the modification factors brought further
Fig. 9 Comparison between modified 5%/50-yr spectrum and CHBDC 2006 spectrum for Montreal
Ahmed Advances in Bridge Engineering (2021) 2:13 Page 16 of 24
improvement of C�sm data distribution with reference to two criteria and this is
clearly displayed in Table 6.
Another trial execution is made in Run 4 by increasing values of F0.2 and F1.0 from
1.2 to 1.3 and 2.5 to 3.0, respectively (i.e., F0.2 = 1.3) and keeping other factors un-
changed F1.0 = 3.0, k = 0.75. Comparison between Run 3 and Run 4 as shown in Table 7
shows the only improvement for period range 0 to 0.5 s with reference to C�sm < 0.9.
For all other period ranges and with reference to both criteria no considerable improve-
ment is obtained.
Fig. 10 Distribution of C�sm for modified 5%/50-yr spectrum of 389 cities
Fig. 11 Schematic diagram of modified AASHTO spectrum
Ahmed Advances in Bridge Engineering (2021) 2:13 Page 17 of 24
Another computer program execution Run 5 is to monitor the effects of having the
decay rate equal to unity, i.e., k = 1.0. Again this change did not bring any positive re-
sults as it pushed the resultant spectrum to much down and brought more data on the
unsafe side. Therefore, final values of modification factors recommended for modified
AASHTO spectrum with 5%/50-yr hazard maps are: F0.2 = 1.3, F1.0 = 3.0 and k = 0.75.
Table 5 Comparison between Run 1 and Run 2 for AASHTO spectrum
Spectrum Values of modifiers Influence of modification factors on C�sm
distribution
0.9 ≤ C�sm ≤ 1.5 C�
sm < 0.9
Period range 1: 0 to 0.5 s
AASHTO Spectrum F0.2 = F0.5 = k = 1.0 34.8% 59.3%
Modified AASHTO Spectrum F0.2 = 1.0, F1.0 = 2.5, k = 0.75 48.8% 37.2%
Period range 2: 0.5 to 1.0 s
AASHTO Spectrum F0.2 = F0.5 = k = 1.0 18.7% 85.6%
Modified AASHTO Spectrum F0.2 = 1.0, F1.0 = 2.5, k = 0.75 42.1% 22.1%
Period range 3: 1.0 to 2.0 s
AASHTO Spectrum F0.2 = F0.5 = k = 1.0 7.7% 94.1%
Modified AASHTO Spectrum F0.2 = 1.0, F1.0 = 2.5, k = 0.75 37% 27.4%
Period range 4: 2.0 to 4.0 s
AASHTO Spectrum F0.2 = F0.5 = k = 1.0 2.6% 96.9%
Modified AASHTO Spectrum F0.2 = 1.0, F1.0 = 2.5, k = 0.75 39.4% 30.0%
Period range 5: 4.0 to 5.0 s
AASHTO Spectrum F0.2 = F0.5 = k = 1.0 2.3% 97.2%
Modified AASHTO Spectrum F0.2 = 1.0, F1.0 = 2.5, k = 0.75 37.1% 27.0%
Table 6 Comparison between Run 2 and Run 3 for modified AASHTO spectrum with 5%/50-yrhazard maps
Spectrum Values of modifiers Influence of modification factors on C�sm
distribution
0.9 ≤ C�sm ≤ 1.5 C�
sm < 0.9
Period range 1: 0 to 0.5 s
Modified AASHTO spectrum F0.2 = 1.0, F1.0 = 2.5, k = 0.75 48.8% 37.2%
Modified AASHTO spectrum F0.2 = 1.2, F1.0 = 3.0, k = 0.75 55.6% 16.3%
Period range 2: 0.5 to 1.0 s
Modified AASHTO spectrum F0.2 = 1.0, F1.0 = 2.5, k = 0.75 42.1% 22.1%
Modified AASHTO spectrum F0.2 = 1.2, F1.0 = 3.0, k = 0.75 43.6% 4.2%
Period range 3: 1.0 to 2.0 s
Modified AASHTO spectrum F0.2 = 1.0, F1.0 = 2.5, k = 0.75 37% 27.4%
Modified AASHTO spectrum F0.2 = 1.2, F1.0 = 3.0, k = 0.75 43.5% 5.5%
Period range 4: 2.0 to 4.0 s
Modified AASHTO spectrum F0.2 = 1.0, F1.0 = 2.5, k = 0.75 39.4% 30.0%
Modified AASHTO spectrum F0.2 = 1.2, F1.0 = 3.0, k = 0.75 44.1% 9.3%
Period range 5: 4.0 to 5.0 s
Modified AASHTO spectrum F0.2 = 1.0, F1.0 = 2.5, k = 0.75 37.1% 27.0%
Modified AASHTO spectrum F0.2 = 1.2, F1.0 = 3.0, k = 0.75 42.9% 5.7%
Ahmed Advances in Bridge Engineering (2021) 2:13 Page 18 of 24
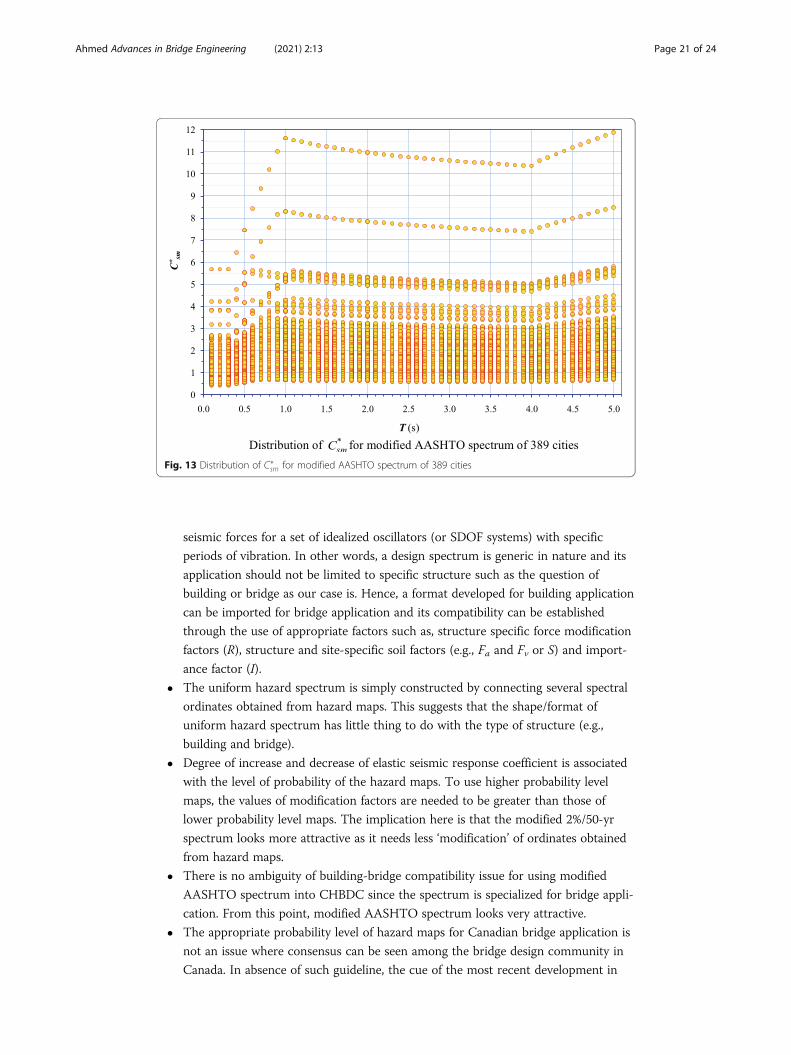
An example of success in modifying AASHTO spectrum for Montreal is shown in
Fig. 12a and b. The detail results for of all 389 cities are presented in Fig. 13 for period
ranges from 0 to 5.0 s. It is observed in the figure that there are some cases of excessive
magnification and other cases of staying below C�sm = 0.9 level. However, their number
in comparison to total number of cases is insignificant. They should be considered as
outliers. Therefore, those irregular cases do not have any influences on the applicability
of the proposed spectrum.
9 Selecting the most suitable spectrum among the three modified spectraThe performances of the three modified spectra, viz. 2%/50-yr, 5%/50-yr and AASHTO,
have been elaborately examined in this phase of study. In general, without modification
the application of uniform hazard spectral format with 4th generation seismic hazard
maps brings dramatic changes from the current CHBDC base shear values. That means
from statistical point of view, many cities will see huge increase in base shear and many
cities will see huge decrease in base shear from current practice if the new concept of
spectra construction and new hazard maps are adopted in CHBDC. The too low reduc-
tion for too many cities is of major concern considering the perceived and long-built
confidence of historical performances of Canadian bridges constructed on the basis of
CHBDC codes. Therefore, as a practical solution, modification of the probable candi-
date spectra is sought in this section.
Interestingly, the 4th generation maps intended for the uniform hazard spectra show
huge increase in the low period range and significant decrease in the intermediate and
long period ranges. As the uniform hazard spectral format uses period dependent spectral
amplitudes, local adjustments are proposed to meet the objectives. To that end, more than
one modification factors are introduced based on statistical analysis of 389 cities.
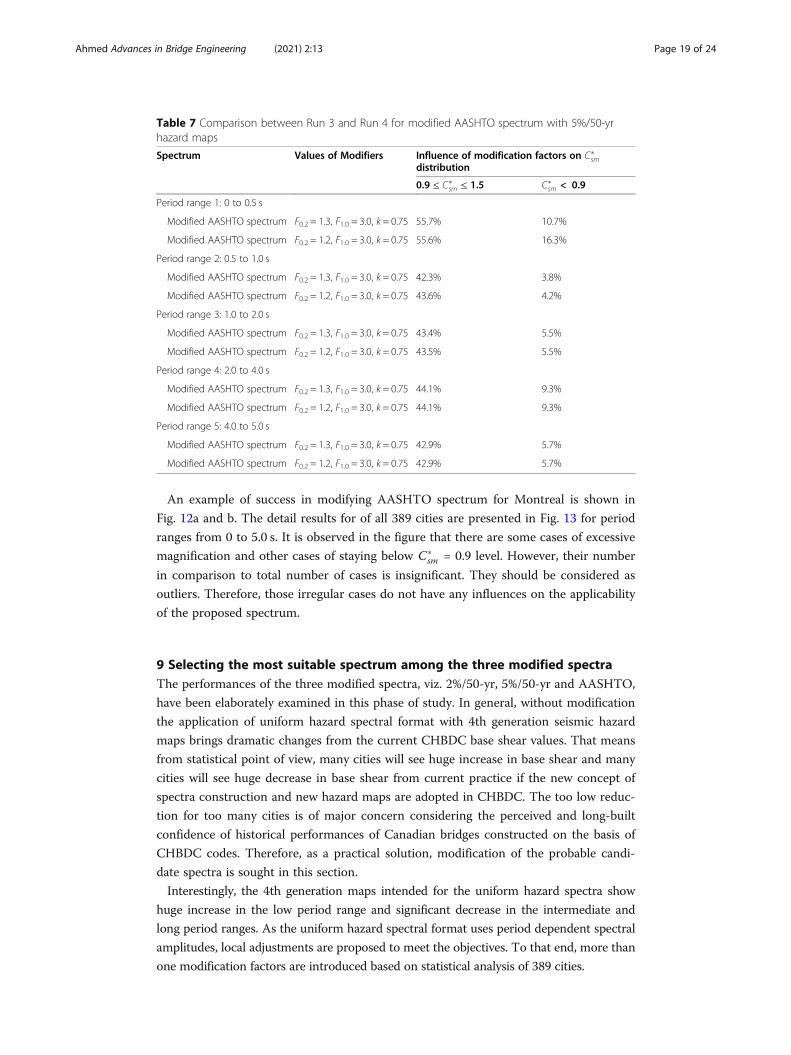
Table 7 Comparison between Run 3 and Run 4 for modified AASHTO spectrum with 5%/50-yrhazard maps
Spectrum Values of Modifiers Influence of modification factors on C�sm
distribution
0.9 ≤ C�sm ≤ 1.5 C�
sm < 0.9
Period range 1: 0 to 0.5 s
Modified AASHTO spectrum F0.2 = 1.3, F1.0 = 3.0, k = 0.75 55.7% 10.7%
Modified AASHTO spectrum F0.2 = 1.2, F1.0 = 3.0, k = 0.75 55.6% 16.3%
Period range 2: 0.5 to 1.0 s
Modified AASHTO spectrum F0.2 = 1.3, F1.0 = 3.0, k = 0.75 42.3% 3.8%
Modified AASHTO spectrum F0.2 = 1.2, F1.0 = 3.0, k = 0.75 43.6% 4.2%
Period range 3: 1.0 to 2.0 s
Modified AASHTO spectrum F0.2 = 1.3, F1.0 = 3.0, k = 0.75 43.4% 5.5%
Modified AASHTO spectrum F0.2 = 1.2, F1.0 = 3.0, k = 0.75 43.5% 5.5%
Period range 4: 2.0 to 4.0 s
Modified AASHTO spectrum F0.2 = 1.3, F1.0 = 3.0, k = 0.75 44.1% 9.3%
Modified AASHTO spectrum F0.2 = 1.2, F1.0 = 3.0, k = 0.75 44.1% 9.3%
Period range 5: 4.0 to 5.0 s
Modified AASHTO spectrum F0.2 = 1.3, F1.0 = 3.0, k = 0.75 42.9% 5.7%
Modified AASHTO spectrum F0.2 = 1.2, F1.0 = 3.0, k = 0.75 42.9% 5.7%
Ahmed Advances in Bridge Engineering (2021) 2:13 Page 19 of 24
After threadbare statistical analyses, here it is recommended three sets of modifica-
tion factors:
– F0.2 = 0.8, F0.5 = 1.1, F1.0 = 1.5, F2.0 = 4.0 for modified 2%/50-yr spectrum
– F0.2 = 1.3, F0.5 = 1.8, F1.0 = 3.0, F2.0 = 6.0 for modified 5%/50-yr spectrum
– F0.2 = 1.3, F1.0 = 3.0, k = 0.75 for modified AASHTO spectrum
In overall consideration, all three modified spectra stand more or less on the
same or similar performance level. Before choosing the most suitable one, some
relevant arguments/counter arguments are discussed in the following:
� Since the format of 2%/50-yr and 5%/50-yr spectra is developed for adoption in
NBCC (2005), the question of applicability of this format for bridge design can be
raised. It must not be forgotten that a design spectrum represents estimates of
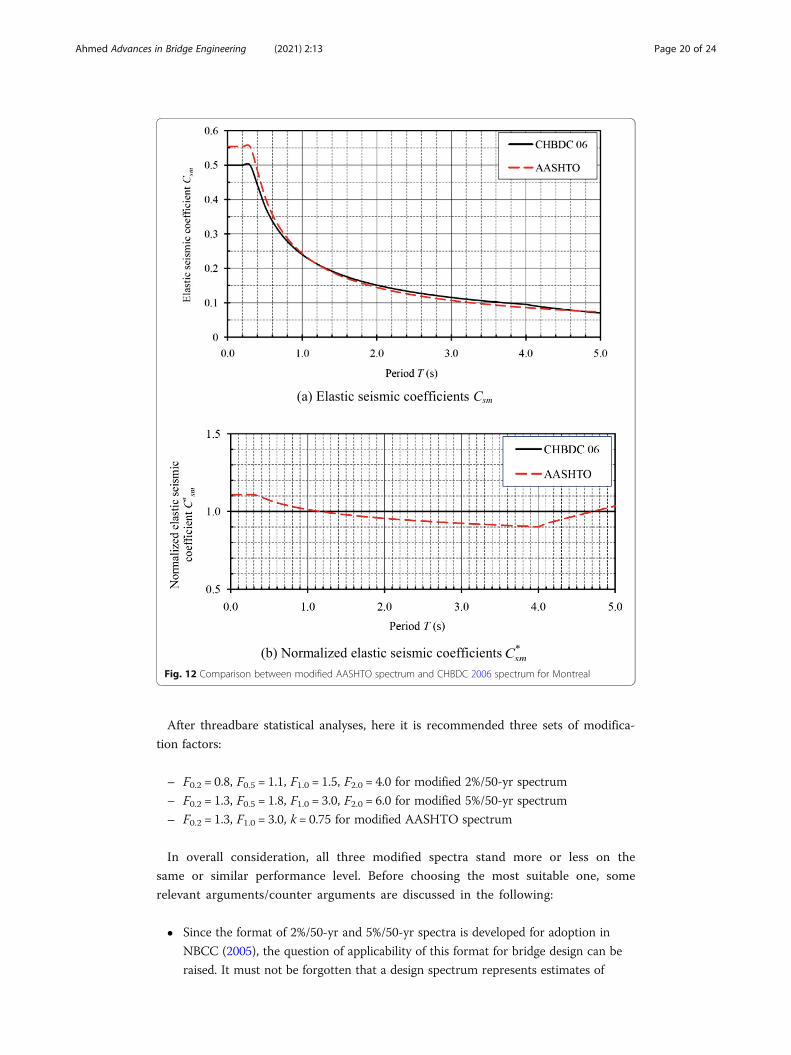
Fig. 12 Comparison between modified AASHTO spectrum and CHBDC 2006 spectrum for Montreal
Ahmed Advances in Bridge Engineering (2021) 2:13 Page 20 of 24
seismic forces for a set of idealized oscillators (or SDOF systems) with specific
periods of vibration. In other words, a design spectrum is generic in nature and its
application should not be limited to specific structure such as the question of
building or bridge as our case is. Hence, a format developed for building application
can be imported for bridge application and its compatibility can be established
through the use of appropriate factors such as, structure specific force modification
factors (R), structure and site-specific soil factors (e.g., Fa and Fv or S) and import-
ance factor (I).
� The uniform hazard spectrum is simply constructed by connecting several spectral
ordinates obtained from hazard maps. This suggests that the shape/format of
uniform hazard spectrum has little thing to do with the type of structure (e.g.,
building and bridge).
� Degree of increase and decrease of elastic seismic response coefficient is associated
with the level of probability of the hazard maps. To use higher probability level
maps, the values of modification factors are needed to be greater than those of
lower probability level maps. The implication here is that the modified 2%/50-yr
spectrum looks more attractive as it needs less ‘modification’ of ordinates obtained
from hazard maps.
� There is no ambiguity of building-bridge compatibility issue for using modified
AASHTO spectrum into CHBDC since the spectrum is specialized for bridge appli-
cation. From this point, modified AASHTO spectrum looks very attractive.
� The appropriate probability level of hazard maps for Canadian bridge application is
not an issue where consensus can be seen among the bridge design community in
Canada. In absence of such guideline, the cue of the most recent development in
Fig. 13 Distribution of C�sm for modified AASHTO spectrum of 389 cities
Ahmed Advances in Bridge Engineering (2021) 2:13 Page 21 of 24
the USA can be adopted for Canadian application. That means, as AASHTO 2009
has adopted, the seismic hazard maps of the Geological Survey of Canada with 5%
probability of exceedance in 50 years should be used for CHBDC.
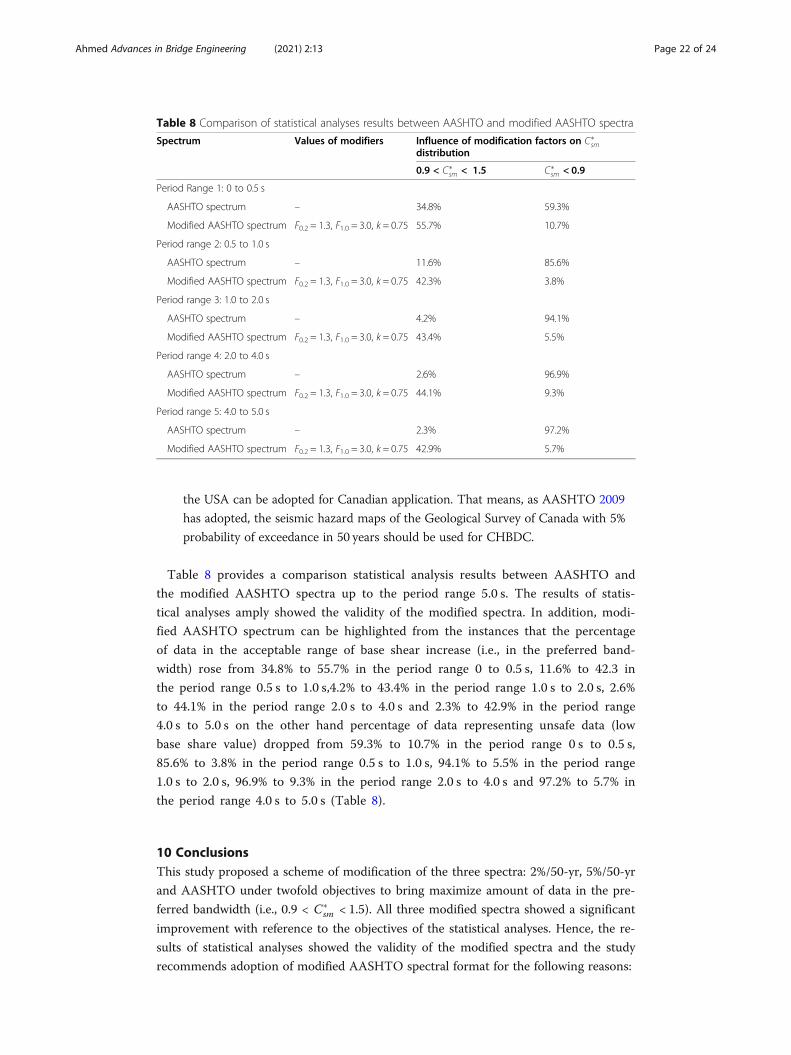
Table 8 provides a comparison statistical analysis results between AASHTO and
the modified AASHTO spectra up to the period range 5.0 s. The results of statis-
tical analyses amply showed the validity of the modified spectra. In addition, modi-
fied AASHTO spectrum can be highlighted from the instances that the percentage
of data in the acceptable range of base shear increase (i.e., in the preferred band-
width) rose from 34.8% to 55.7% in the period range 0 to 0.5 s, 11.6% to 42.3 in
the period range 0.5 s to 1.0 s,4.2% to 43.4% in the period range 1.0 s to 2.0 s, 2.6%
to 44.1% in the period range 2.0 s to 4.0 s and 2.3% to 42.9% in the period range
4.0 s to 5.0 s on the other hand percentage of data representing unsafe data (low
base share value) dropped from 59.3% to 10.7% in the period range 0 s to 0.5 s,
85.6% to 3.8% in the period range 0.5 s to 1.0 s, 94.1% to 5.5% in the period range
1.0 s to 2.0 s, 96.9% to 9.3% in the period range 2.0 s to 4.0 s and 97.2% to 5.7% in
the period range 4.0 s to 5.0 s (Table 8).
10 ConclusionsThis study proposed a scheme of modification of the three spectra: 2%/50-yr, 5%/50-yr
and AASHTO under twofold objectives to bring maximize amount of data in the pre-
ferred bandwidth (i.e., 0.9 < C�sm < 1.5). All three modified spectra showed a significant
improvement with reference to the objectives of the statistical analyses. Hence, the re-
sults of statistical analyses showed the validity of the modified spectra and the study
recommends adoption of modified AASHTO spectral format for the following reasons:
Table 8 Comparison of statistical analyses results between AASHTO and modified AASHTO spectra
Spectrum Values of modifiers Influence of modification factors on C�sm
distribution
0.9 < C�sm < 1.5 C�
sm < 0.9
Period Range 1: 0 to 0.5 s
AASHTO spectrum – 34.8% 59.3%
Modified AASHTO spectrum F0.2 = 1.3, F1.0 = 3.0, k = 0.75 55.7% 10.7%
Period range 2: 0.5 to 1.0 s
AASHTO spectrum – 11.6% 85.6%
Modified AASHTO spectrum F0.2 = 1.3, F1.0 = 3.0, k = 0.75 42.3% 3.8%
Period range 3: 1.0 to 2.0 s
AASHTO spectrum – 4.2% 94.1%
Modified AASHTO spectrum F0.2 = 1.3, F1.0 = 3.0, k = 0.75 43.4% 5.5%
Period range 4: 2.0 to 4.0 s
AASHTO spectrum – 2.6% 96.9%
Modified AASHTO spectrum F0.2 = 1.3, F1.0 = 3.0, k = 0.75 44.1% 9.3%
Period range 5: 4.0 to 5.0 s
AASHTO spectrum – 2.3% 97.2%
Modified AASHTO spectrum F0.2 = 1.3, F1.0 = 3.0, k = 0.75 42.9% 5.7%
Ahmed Advances in Bridge Engineering (2021) 2:13 Page 22 of 24
� Since the format of 2%/50-yr and 5%/50-yr spectra is developed for adoption in
NBCC (2005), the question of applicability of this format for bridge design can be
raised.
� There is no ambiguity of building-bridge compatibility issue for using modified
AASHTO spectrum into CHBDC since the spectrum is specialized for bridge appli-
cation. From this point modified AASHTO spectrum looks very attractive.
� The appropriate probability level of hazard maps for Canadian bridge application is
not an issue where consensus can be seen among the bridge design community in
Canada. In absence of such guideline, the cue of the most recent development in
the USA can be adopted for Canadian application. That means as AASHTO (2009)
has adopted, the seismic hazard maps of the Geological Survey of Canada with 5%
probability of exceedance in 50 years should be used for CHBDC.
� The modified AASHTO spectrum is simple to construct and uses only two spectral
amplitudes. That means for this spectrum, the least number of hazard maps is
needed.
� The results of statistical analyses amply showed the validity of the modified spectra.
The success of the modified AASHTO spectrum can be highlighted as the
percentage of data in the acceptable range of base shear increased up to 55.7% at
low period range, 43.4% at intermediate period range and 44.1% at higher period
range and percentage of data representing low base share value decreased to 10.7%
at low period range, 3.8% at intermediate period range and 5.7% at higher period
range.
To this backdrop, the study recommends adoption of modified AASHTO spectrum
with modification factors: F0.2 = 1.3, F1.0 = 3.0 and k = 0.75 to apply for the calculations
of design base shear of the bridges in Canada.
AbbreviationsAASHTO: American Association of State Highway Officials; CHBDC: Canadian Highway Bridge Design Code;UHS: Uniform Hazard Spectrum; NBCC: National Building Code of Canada; UBC: Uniform Building Code;IBC: International Building Code; PEER: Pacific Earthquake Engineering Research Center; NGA: Next GenerationAttenuation; GMPE: Ground-motion prediction equation; NEHRP: National Earthquake Hazards Reduction Program;BSSC: Building Seismic Safety Council; GSC: Geological Survey of Canada; CP: Computer Program
AcknowledgementsThe author gratefully acknowledges valuable insights and suggestions from Dr. Rafiq Hasan, Senior BridgeManagement and Design System Engineer of the Ministry of Transportation of Ontario.
Author’s contributionsThe authors read and approved the final manuscript.
Author’s informationA.A. received his PhD degree in March 2002 from the Department of Civil Engineering, Muroran Institute ofTechnology, Japan. His research interests include Modeling, FE analysis and behavior of semi-rigid beam-to-columnsteel frame bolted connections; Evaluation of design response spectrum based on uniform hazard spectral formatusing updated seismic hazard data and map; Modeling and behavior of reinforced concrete buildings subjected toprogressive collapse due to blast action; Earthquake behavior of structures and structural members. He worked as a Re-search Fellow at the Department of Civil Engineering, Muroran Institute of Technology, Japan and Professor of the De-partment of Civil Engineering, Stamford University Bangladesh. Currently, A.A. works as a Dean of the Faculty ofEngineering and Applied Sciences, Bangladesh University of Business and Technology. He is also working as a super-visor/advisor of PhD students. He reviewed several published research articles for publishers like Techno-Press andUITS.
FundingNot applicable.
Ahmed Advances in Bridge Engineering (2021) 2:13 Page 23 of 24
Availability of data and materialsThe datasets used and/or analysed during the current study are available from Geological Survey of Canada (2009)Interpolate 2005 National Building Code of Canada. Seismic hazard map database, Natural Res. 2011 Dec.
Competing interestsThe author declares that he has no competing interests.
Received: 24 November 2020 Accepted: 17 January 2021
ReferencesAASHTO (2009) AASHTO guide specifications for LRFD seismic bridge design. American Association of State Highway and
Transportation Officials, Washington, USAAhmed A, Hasan R, Pekau OA (2016) Evaluation of seismic design spectrum based on UHS implementing fourth generation
seismic hazard maps of Canada. Int J Adv Struct Eng 8(4):411–422Ancheta TD, Darragh RB, Stewart JP, Seyhan E, Silva WJ, Chiou BSJ, Wooddell KE, Graves RW, Kottke AR, Boore DM, Kishida T,
Donahue JL (2013) PEER NGA-West2 database. PEER Report No. 2013/03. Pacific earthquake engineering research center,University of California, Berkeley, CA pp 134
Ancheta TD, Darragh RB, Stewart JP, Seyhan E, Silva WJ, Chiou BSJ, Wooddell KE, Graves RW, Kottke AR, Boore DM, Kishida T,Donahue JL (2014) NGA-West2 database. Eq Spectra 30:989–1005
Atkinson G, Adams J (2013) Ground motion prediction equations for application to the 2015 Canadian national seismichazard maps. Can J CE 40(10):988–998
Atkinson G, Boore D (2006) Ground motion prediction equations for earthquakes in eastern North America. Bull Seismol SocAm 96:2181–2205
Atkinson G, Boore D (2011) Modifications to existing ground-motion prediction equations in light of new data. Bull SeismolSoc Am 101(3):1121–1135
Atkinson G, Morrison M (2009) Observations on regional variability in ground-motion amplitudes for small-to-moderateearthquakes in North America. Bull Seismol Soc Am 99:2393–2409
Boore D (2013) The uses and limitations of the square-root-impedance method for computing site amplification. Bull SeismolSoc Am 103(4):2356–2368
Boore D, Atkinson G (2008) Ground-motion prediction equations for the average horizontal component of PGA, PGV, and5%-damped PSA at spectral periods between 0.01s and 10.0s. Eq Spectra 24:99–138
Boore D, Joyner WB (1997) Site amplifications for generic rock sites. Bull Seismol Soc Am 87(2):327–341Bozorgnia Y, Campbell KW (2004) Vertical-to-horizontal response spectra ratio and tentative procedures for developing
simplified V/H and vertical design spectra. J Eq Eng 8(2):175–207Bozorgnia Y et al (2014) NGA-West2, research project. Eq Spectra 30(3):973–987BSSC (2009) NEHRP recommended seismic provisions for new buildings and other structures (FEMA P-750). 2009 ed. Report
prepared for the Federal Emergency Management Agency (FEMA), building seismic safety council. National Institute ofbuilding sciences, Washington
Campbell KW, Bozorgnia Y (2014) NGA-West2 ground motion model for the horizontal components of PGA, PGV, and 5%-damped elastic pseudo-acceleration response spectra for periods ranging from 0.01 to 10 sec. Eq Spectra 30(3):1087–1115
CHBDC (2006) Canadian highway bridge design code. Canadian Standard Association, MississaugaChiou B, Youngs R, Abrahamson N, Addo K (2010) Ground-motion attenuation model for small-to-moderate shallow crustal
earthquakes in California and its implications for regionalization of ground-motion prediction models. Eq Spectra 26(4):907–926
Digital Visual FORTRAN (1998) Ver 6.0. Stand Ed. Digital Equipment Corporation, Maynard, Massachusetts, USAGeological Survey of Canada (2009) Interpolate 2005 National Building Code of Canada. Seismic Hazard map database,
Natural Res 2011 Dec. http://earthquakescanada.nrcan.gc.ca/hazard-alea/interpolat/index-eng.phpHeidebrecht AC (1997) Seismic level of protection for building structures. Can J CE 24(1):20–33Heidebrecht AC (1999) Implications of new Canadian uniform hazard spectra for seismic design and the seismic level of
protection of building structures. 8th Canadian conference on earthquake engineering, Canadian Association forEarthquake Engineering, Vancouver. 13-16 June. Pp 213-218
Joyner WB, Warrick RE, Fumal TE (1981) The effect of quaternary alluvium on strong ground motion in the coyote Lake,California, earthquake of 1979. Bull Seismol Soc Am 71:1333–1349
Naumoski N, Cheung MS, Foo S (2000) Evaluation of the seismic response coefficient introduced in the Canadian highwaybridge design code. Can J CE 27(6):1183–1191
NBCC (2005) National Building Code of Canada. Institute for Research in construction. National Research Council of Canada,Ottawa
PEER (2013) NGA-West2 ground motion prediction equations for vertical ground motion. PEER Report No. 2013/24, Pacificearthquake engineering research center. University of California, Berkeley
Publisher’s NoteSpringer Nature remains neutral with regard to jurisdictional claims in published maps and institutional affiliations.
Ahmed Advances in Bridge Engineering (2021) 2:13 Page 24 of 24