Embed Size (px)
Citation preview
Journal of Engineering Science and Technology Vol. 7, No. 5 (2012) 646 - 660 © School of Engineering, Taylor’s University
646
MODIFIED VOLUMETRIC JOINT COUNT TO CHECK FOR SUITABILITY OF GRANITE OUTCROPS
FOR DIMENSION STONE PRODUCTION
SALIU M. ALADE*, OLALEYE B. MURIANA, HALEEM J. OLAYINKA
Department of Mining Engineering,
The Federal University Technology, Akure Ondo State, Nigeria
*Corresponding Author: [email protected]
Abstract
This study compares the characterization of fractures of some granite outcrops
in Southwestern Nigeria. Some geometrical properties of discontinuity
(orientation, persistence, aperture, infilling and spacing) were evaluated. On the
granite studied, most of the mapped joints have orientations that fall within
84○/020○ and 86○/300○. These patterns are compatible with the regional
fracturing, which is predominantly shaped by NW-SE, NE-SW, NNE-SSW,
ENE-WSW and WNW-ESE structure of tectonic origin. The XX type joint
persistence is dominant while RR type is in minority. Closed aperture was
observed at Ore, Awo and Ikole granite outcrops. The infilling materials are
mica and quartz; their percentages are constant for all the outcrops studied. The
modified volumetric joint count ranges from 0.67 m-1 to 1.24 m-1 and the
average spacing of all sets varies from 1.62 m to 2.50 m. Fracture network
characterization as carried out revealed that, for an outcrop to be economically
suitable for dimension stone production, the modified volumetric joint count
should not be above 1.7 m-1 and must be at least ‘good’ rock according to
conventional rock mass classification. Numerical modeling of block size
distributions of selected granites in Southwestern Nigeria was done using
AutoCADTM 3D.
Keywords: Granite, Dimension stone, Volumetric joint count, Economical
exploitation.
1. Introduction
Identification of suitable location of good quality granite rock outcrops
for aggregates and/ or dimension stone blocks production is one of the
major problems confronting engineers in most tropical countries like Nigeria. The
Modified Volumetric Joint Count to Check for Suitability of Granite Outcrops… 647
Journal of Engineering Science and Technology October 2012, Vol. 7(5)
Nomencalture
Ja Joint Alteration
Jn Joint Set Number
Jr Joint Roughness
Jv Modified Volumetric Joint curve
L Length of scanline
N Number of joint set
S True spacing
Abbreviations
3D 3 Dimensional
DD Discontinuous between fracture
DX Discontinuous in Curve
ENE East North East
ESE East South East
GSI Geological Strength Index
NE North East
NW North west
RMR Rock Mass Rating
ROD Rock Quality Designation
RR Discontinuous Joint
RX Discontinuous in Rock and Fracture
SE South East
SW South west
UCS Uniaxial Compressive Strength
WNW West North West
WSW West South West
XX Continuous Joint
present technology and mechanization used in extracting and processing granite in
Nigeria measures up to the most advanced countries in the world. Industrial
processing of granites requires large block size, and the large block size yield is
controlled by the natural fracture pattern of the outcrops. According to Brandy and
Brown [1], engineering properties such as cavability, fragmentation characteristics
and rock mass permeability also vary with discontinuity spacing. Discontinuity
spacing is one of the important parameters in describing the quality of a complete
rock mass. According to Tomasic [2] and Sonnez et al. [3], several researchers have
worked on the fracture patterns of rock mass to evaluate the possibility of obtaining
appropriate block size in commercial quantity. The geometrical properties of joints
and their networks that can be measured is an important factor for identifying
suitability of rock mass for dimension stones production.
Guohua and Xing [4] noticed that joints are the most common and generally
the most geotechnically significant structural features in rocks. Bell [5] stated that
joints are breaks of geological origin along which there has been no visible
displacement, and can also be described as fractures along which little or no
displacement has occurred and is present within all types of rocks. At the surface,
joints may open as a consequence of stress release and weathering. A group of
joints which run parallel to each other is termed a joint set, whilst two or more
joint sets which intersect at a more or less constant angle are referred to as a joint
648 Saliu M. Alade et al.
Journal of Engineering Science and Technology October 2012, Vol. 7(5)
system. If joints are planar and parallel or sub-parallel, they are described as
systematic. Conversely, when they are irregular they are termed non-systematic.
If one set of joints is dominant, then these joints are known as primary joints, the
other set of joints being termed secondary. There are several ways of joint
formation and systematic sets can be distinguished from non-systematic sets when
recording discontinuities in the field Bell [5]. It should be noted that a complete
description of joints is difficult because of their three-dimensional nature and their
limited exposure in outcrops [6].
The characteristics of individual joints such as orientation, trace length or size,
aperture, planarity, roughness, surface morphology and location are used in
classification of joints. Joint trace length is one of the most important parameters
for evaluating the geomechanical properties of rock mass and these have been
studied by many researchers [7, 8].
In fracture network characterization, it was observed that the density and
persistence of fractures are critical in determining the in-situ block size
distribution of granite outcrop [9]. For an outcrop to produce commercial block, it
is recommended that the size must be at least (2.4 m × 1.3 m × 0.7 m). It is also
observed that the surface area of a block which is formed by interception of the
sub-vertical fracture, for commercial block exploitation, must be at least 2 m2
[10]. The possible methods used for fracture measurement include geophysical
acoustic method, drill hole method and surface exposure method which include
both hand mapping [11], and more recent application of remote methods such as
photogrammetry [12]. A combination of both scanline and window mapping are
suitable for dimension stone exploitation where detailed fracture characterization
is required for in-situ block size estimation. Blocks are formed by interception of
fracture sets. The size of these blocks can be estimated using either empirical
methods [6] or numerical methods. Among the empirical methods are volumetric
joint counts, joint spacing and block volume methods. In empirical methods the
average block size is obtained. The limitation of joint spacing method includes
exaggeration of the in-situ block size results and cannot be used where there is
occurrence of too many random joints [6].
Persistency of joints is characterized by their termination in accordance with the
suggested procedures [13]. Volumetric Joint Count (Jv) is a tool proposed for
assessing block sizes [14]. The modified volumetric joint count is proposed for use
in this study because only the sub-vertical joints were taken into consideration.
The volumetric joint count is given as follows [15]:
n
n
vL
N
L
N
L
NJ ......
2
2
1
1 [m-1
] (1)
or
n
vSSS
J1
......11
21
[m-1
] (2)
where S is the true spacing, N is the number of joint sets along the scanline, L
is the length of scanline and n is the number of joint sets mapped.
When the rock is highly fractured, the formula below is suggested:
Modified Volumetric Joint Count to Check for Suitability of Granite Outcrops… 649
Journal of Engineering Science and Technology October 2012, Vol. 7(5)
z
z
y
y
x
x
vL
N
L
N
L
NJ ...... [m
-1] (3)
where Nx, Ny and Nz are number of joint sets counted along the scanline (Lx,
Ly and Lz) perpendicular to each other. But since this condition of perpendicular is
hardly met, Eq. (3) is modified to:
3
L
NJ
v [m
-3] (4)
where L is the respective scanline length (m).
The use of numerical methods for block size estimation has been done by
many authors [16-18], working on the same principle of statistical simulation to
obtain the block size distribution. The conditional simulation of point by point
occurrences of the fractures along the scanline as well as along the window may
be impossible using these programmes. A new approach is introduced in this
study using AutoCADTM
to run a simulation of all the fractures as they occur
along the scanline or within the window to obtain an explicit estimate of block
sizes, assuming continuous jointing.
Modeling is a straightforward task but involves many complexities and
compromises. In essence, the key components of any satisfactory modeling
approach are data and understanding [19]. The purpose of this model is to create a
new approach that maximizes the use of feasibly available data and obtain the
block size distribution in the outcrop under consideration.
AutoCADTM
has become a standard program for producing technical drawings
of all types [20]. Since not all mining operators may have access to FracMan
software, incorporating AutoCADTM
to this research work as an alternative to
FracMan in determination of block size distribution of an outcrop is considered a
useful approach. The advantage of this approach, compared to conventional
methods for fracture analysis, is that it provides a better 3D description of the
fracture geometry as the entity of position, extent and orientation of single
fractures with respect to their surrounding neighbours is conserved.
2. Geology of the Studied Area
The study area lies in south western Nigeria. The granite rocks under studies are
located in Ekiti State (Ikere, Ewu and Ikole Ekiti), Ondo State (Ore and Supare)
and Osun State (Awo). The area is the part of the West African Craton comprising
of rocks affected by the late Precambrian to early Paleozoic orogenesis. The
Nigerian basement complex extends westwards and is continuous with the
Dahomeyan of the Dahomey - Togo - Ghana region. To the east and the south the
basement complex is covered by the Mesozoic - Recent sediments of the
Dahomey and Anambra Basins.
The Nigerian basement complex comprise predominantly of magmatitic and
granitic gneisses; quartzites; slightly migmatised to unmigmatised
metasedimentary schists and metaigneous rocks; charnockitic, gabbroic and
dioritic rocks; and the member of the Older Granites, granodiorite and syenites.
Migmatites are found to be abundant in south western Nigeria.
650 Saliu M. Alade et al.
Journal of Engineering Science and Technology October 2012, Vol. 7(5)
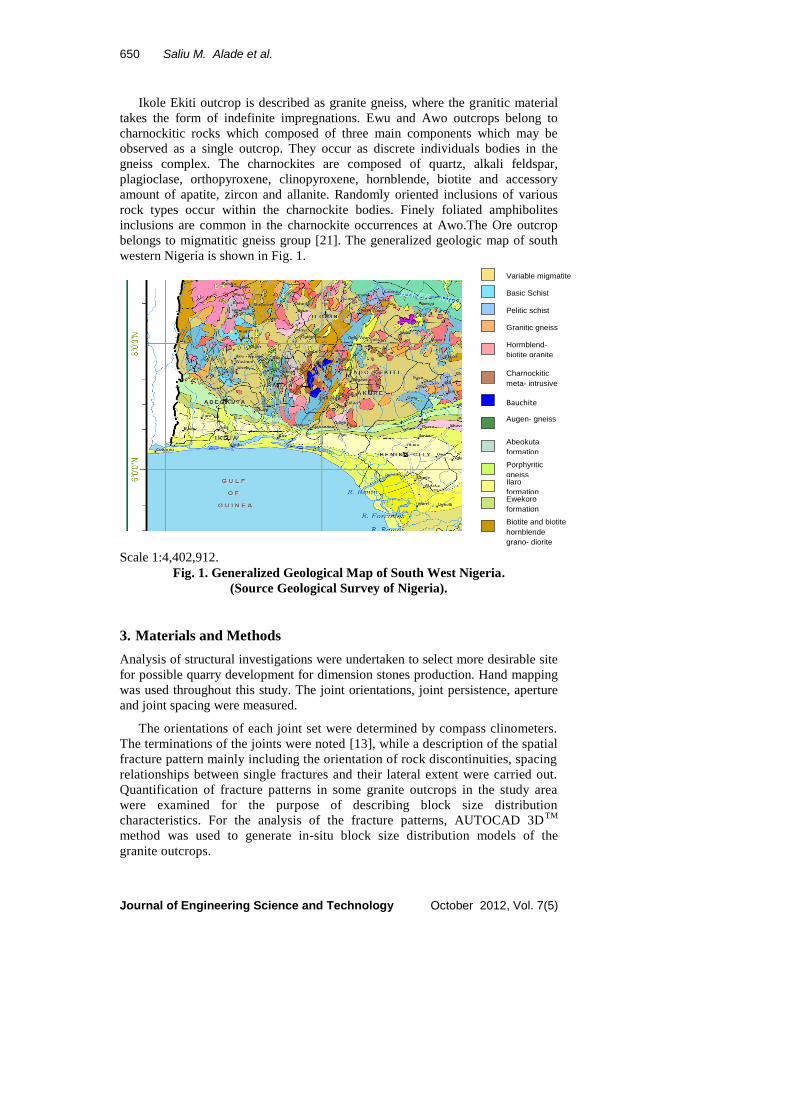
Ikole Ekiti outcrop is described as granite gneiss, where the granitic material
takes the form of indefinite impregnations. Ewu and Awo outcrops belong to
charnockitic rocks which composed of three main components which may be
observed as a single outcrop. They occur as discrete individuals bodies in the
gneiss complex. The charnockites are composed of quartz, alkali feldspar,
plagioclase, orthopyroxene, clinopyroxene, hornblende, biotite and accessory
amount of apatite, zircon and allanite. Randomly oriented inclusions of various
rock types occur within the charnockite bodies. Finely foliated amphibolites
inclusions are common in the charnockite occurrences at Awo.The Ore outcrop
belongs to migmatitic gneiss group [21]. The generalized geologic map of south
western Nigeria is shown in Fig. 1.
Variable migmatite
Basic Schist
Pelitic schist
Granitic gneiss
Hormblend-
biotite granite
Charnockitic
meta- intrusive
Bauchite
Augen- gneiss
Abeokuta
formation
Porphyritic
gneiss Ilaro
formation Ewekoro
formation
Biotite and biotite
hornblende
grano- diorite Scale 1:4,402,912.
Fig. 1. Generalized Geological Map of South West Nigeria.
(Source Geological Survey of Nigeria).
3. Materials and Methods
Analysis of structural investigations were undertaken to select more desirable site
for possible quarry development for dimension stones production. Hand mapping
was used throughout this study. The joint orientations, joint persistence, aperture
and joint spacing were measured.
The orientations of each joint set were determined by compass clinometers.
The terminations of the joints were noted [13], while a description of the spatial
fracture pattern mainly including the orientation of rock discontinuities, spacing
relationships between single fractures and their lateral extent were carried out.
Quantification of fracture patterns in some granite outcrops in the study area
were examined for the purpose of describing block size distribution
characteristics. For the analysis of the fracture patterns, AUTOCAD 3DTM
method was used to generate in-situ block size distribution models of the
granite outcrops.
Modified Volumetric Joint Count to Check for Suitability of Granite Outcrops… 651
Journal of Engineering Science and Technology October 2012, Vol. 7(5)
AutoCADTM
creates 3D models for engineering drawings that can be adapted
for geotechnical fracture model. In the AutoCAD model used for this study, the
geotechnical data required for fracture model include the following:
Relative position of the outcrop on the surface of the earth.
spacing of the joints
persistence of the fracture
orientation of the joint sets
The stages involved in creating this model can be described as follows:
pole plot of the fracture data to classify the fractures into sets
determination of Fisher k factor in order to know how parallel the joints in
a given set are. The higher the k factor, the more parallel the fractures in a
given set;
generate a rectangle with the same surface area as the outcrop under
consideration using Auto CAD TM
and plot the strike of each of the fracture
as they occurred along the scanline using the relationship between the dip
direction and strike;
individual blocks generated by the intercept of the joints are banded
together and extruded to the required height based on the distance between
sub-vertical features.
From the model created, the surface area and the volume of each block is
estimated to give the distribution of the blocks within the required outcrop.
4. Results and Discussion
4.1. Joint orientation
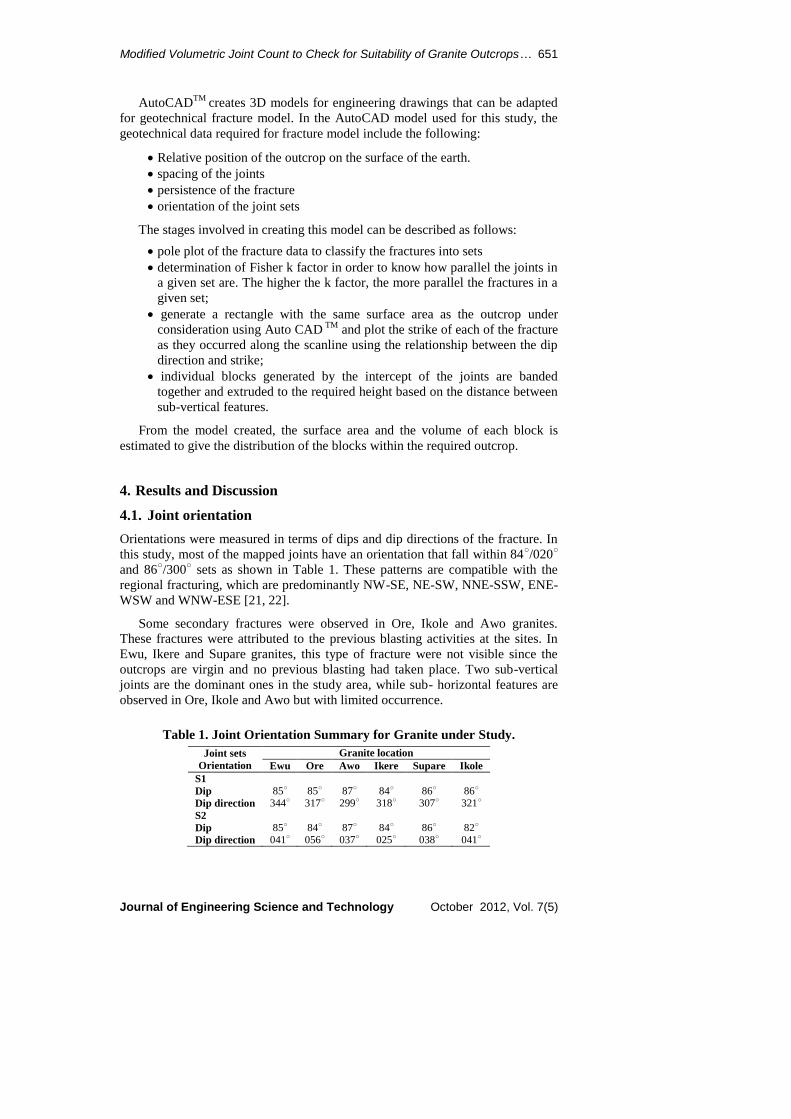
Orientations were measured in terms of dips and dip directions of the fracture. In
this study, most of the mapped joints have an orientation that fall within 84○/020
○
and 86○/300
○ sets as shown in Table 1. These patterns are compatible with the
regional fracturing, which are predominantly NW-SE, NE-SW, NNE-SSW, ENE-
WSW and WNW-ESE [21, 22].
Some secondary fractures were observed in Ore, Ikole and Awo granites.
These fractures were attributed to the previous blasting activities at the sites. In
Ewu, Ikere and Supare granites, this type of fracture were not visible since the
outcrops are virgin and no previous blasting had taken place. Two sub-vertical
joints are the dominant ones in the study area, while sub- horizontal features are
observed in Ore, Ikole and Awo but with limited occurrence.
Table 1. Joint Orientation Summary for Granite under Study.
Joint sets
Orientation
Granite location
Ewu Ore Awo Ikere Supare Ikole
S1
Dip
Dip direction
85○ 344○
85○ 317○
87○ 299○
84○ 318○
86○ 307○
86○ 321○
S2
Dip
Dip direction
85○ 041○
84○ 056○
87○ 037○
84○ 025○
86○ 038○
82○ 041○
652 Saliu M. Alade et al.
Journal of Engineering Science and Technology October 2012, Vol. 7(5)
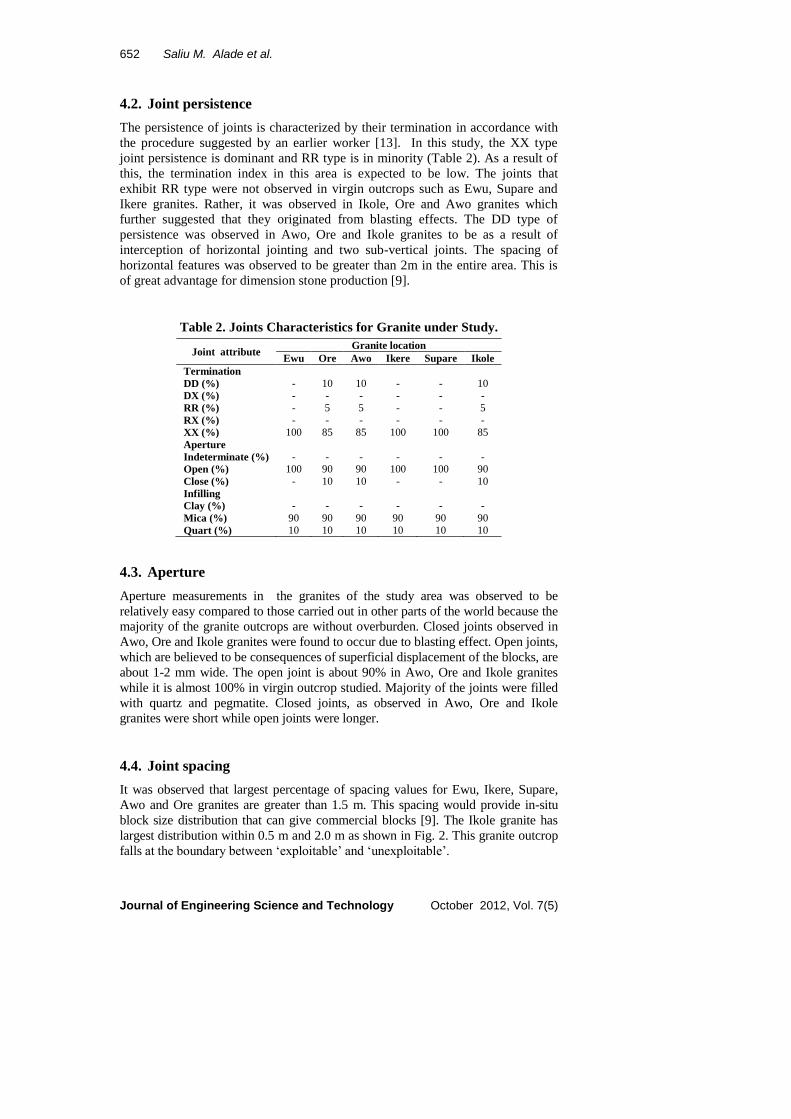
4.2. Joint persistence
The persistence of joints is characterized by their termination in accordance with
the procedure suggested by an earlier worker [13]. In this study, the XX type
joint persistence is dominant and RR type is in minority (Table 2). As a result of
this, the termination index in this area is expected to be low. The joints that
exhibit RR type were not observed in virgin outcrops such as Ewu, Supare and
Ikere granites. Rather, it was observed in Ikole, Ore and Awo granites which
further suggested that they originated from blasting effects. The DD type of
persistence was observed in Awo, Ore and Ikole granites to be as a result of
interception of horizontal jointing and two sub-vertical joints. The spacing of
horizontal features was observed to be greater than 2m in the entire area. This is
of great advantage for dimension stone production [9].
Table 2. Joints Characteristics for Granite under Study.
Joint attribute Granite location
Ewu Ore Awo Ikere Supare Ikole
Termination
DD (%)
DX (%)
RR (%)
RX (%)
XX (%)
- -
-
- 100
10 -
5
- 85
10 -
5
- 85
- -
-
- 100
- -
-
- 100
10 -
5
- 85
Aperture
Indeterminate (%)
Open (%)
Close (%)
- 100
-
- 90
10
- 90
10
- 100
-
- 100
-
- 90
10
Infilling
Clay (%)
Mica (%)
Quart (%)
-
90
10
-
90
10
-
90
10
-
90
10
-
90
10
-
90
10
4.3. Aperture
Aperture measurements in the granites of the study area was observed to be
relatively easy compared to those carried out in other parts of the world because the
majority of the granite outcrops are without overburden. Closed joints observed in
Awo, Ore and Ikole granites were found to occur due to blasting effect. Open joints,
which are believed to be consequences of superficial displacement of the blocks, are
about 1-2 mm wide. The open joint is about 90% in Awo, Ore and Ikole granites
while it is almost 100% in virgin outcrop studied. Majority of the joints were filled
with quartz and pegmatite. Closed joints, as observed in Awo, Ore and Ikole
granites were short while open joints were longer.
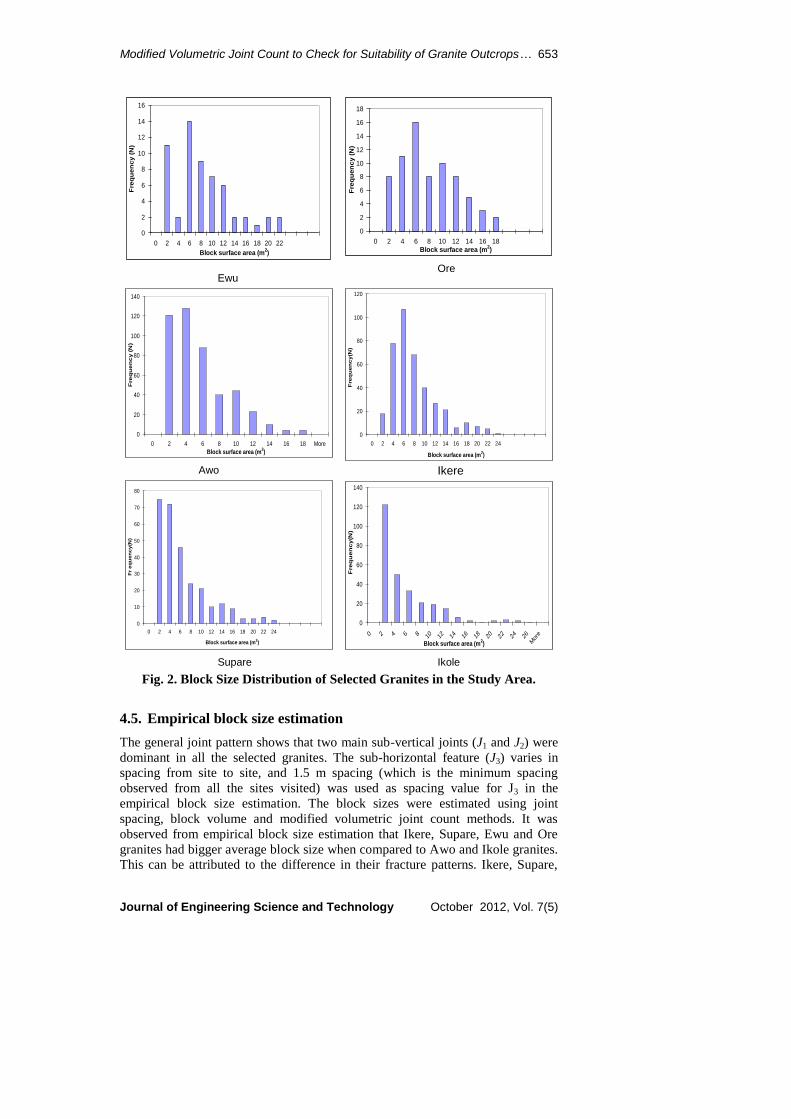
4.4. Joint spacing
It was observed that largest percentage of spacing values for Ewu, Ikere, Supare,
Awo and Ore granites are greater than 1.5 m. This spacing would provide in-situ
block size distribution that can give commercial blocks [9]. The Ikole granite has
largest distribution within 0.5 m and 2.0 m as shown in Fig. 2. This granite outcrop
falls at the boundary between ‘exploitable’ and ‘unexploitable’.
Modified Volumetric Joint Count to Check for Suitability of Granite Outcrops… 653
Journal of Engineering Science and Technology October 2012, Vol. 7(5)
0
2
4
6
8
10
12
14
16
0 2 4 6 8 10 12 14 16 18 20 22
Block surface area (m2)
Fre
qu
en
cy
(N
)
Ewu
0
20
40
60
80
100
120
140
0 2 4 6 8 10 12 14 16 18 More
Block surface area (m2)
Fre
qu
en
cy
(N
)
Awo
0
10
20
30
40
50
60
70
80
0 2 4 6 8 10 12 14 16 18 20 22 24
Block surface area (m2)
Fr
eq
ue
nc
y(N
)
Supare
0
20
40
60
80
100
120
140
0 2 4 6 8 10 12 14 16 18 20 22 24 26
Mor
e
Block surface area (m2)
Fre
qu
en
cy
(N)
Ikole
0
20
40
60
80
100
120
0 2 4 6 8 10 12 14 16 18 20 22 24
Block surface area (m2)
Fre
qu
en
cy
(N)
Ikere
0
2
4
6
8
10
12
14
16
18
0 2 4 6 8 10 12 14 16 18
Block surface area (m2)
Fre
qu
en
cy
(N
)
Ore
Fig. 2. Block Size Distribution of Selected Granites in the Study Area.
4.5. Empirical block size estimation
The general joint pattern shows that two main sub-vertical joints (J1 and J2) were
dominant in all the selected granites. The sub-horizontal feature (J3) varies in
spacing from site to site, and 1.5 m spacing (which is the minimum spacing
observed from all the sites visited) was used as spacing value for J3 in the
empirical block size estimation. The block sizes were estimated using joint
spacing, block volume and modified volumetric joint count methods. It was
observed from empirical block size estimation that Ikere, Supare, Ewu and Ore
granites had bigger average block size when compared to Awo and Ikole granites.
This can be attributed to the difference in their fracture patterns. Ikere, Supare,
654 Saliu M. Alade et al.
Journal of Engineering Science and Technology October 2012, Vol. 7(5)
Ewu and Ore granites were observed to have wider spacing of sub-vertical
fracture compared to Awo and Ikole granites.
4.6. Modified volumetric joint count
The issue of interest here is the relationship between the modified volumetric
joint counts and the average in-situ block sizes. It can be observed that in Ikere,
Supare, Ewu and Ore granites that had larger average block sizes had low
modified volumetric joint counts while the Awo and Ikole granites that had small
average block sizes had high modified volumetric joint counts, in agreement with
earlier studies [9].
Based on the three methods used in this work for empirical block size
estimation, it can be observed that the average block sizes obtained using joint
spacing method is always higher than the value obtained when using block
volume and volumetric joint counts, in agreement with an earlier study [6] which
stated that the average block size obtained from joint spacing method must be
used with care as it often exaggerates the block size. This exaggeration is
significantly observed in all the studied granites in southwestern Nigeria as shown
in Table 3. It is then therefore suggested that care must be taken when using the
joint spacing method for block size estimation in detailed studies.
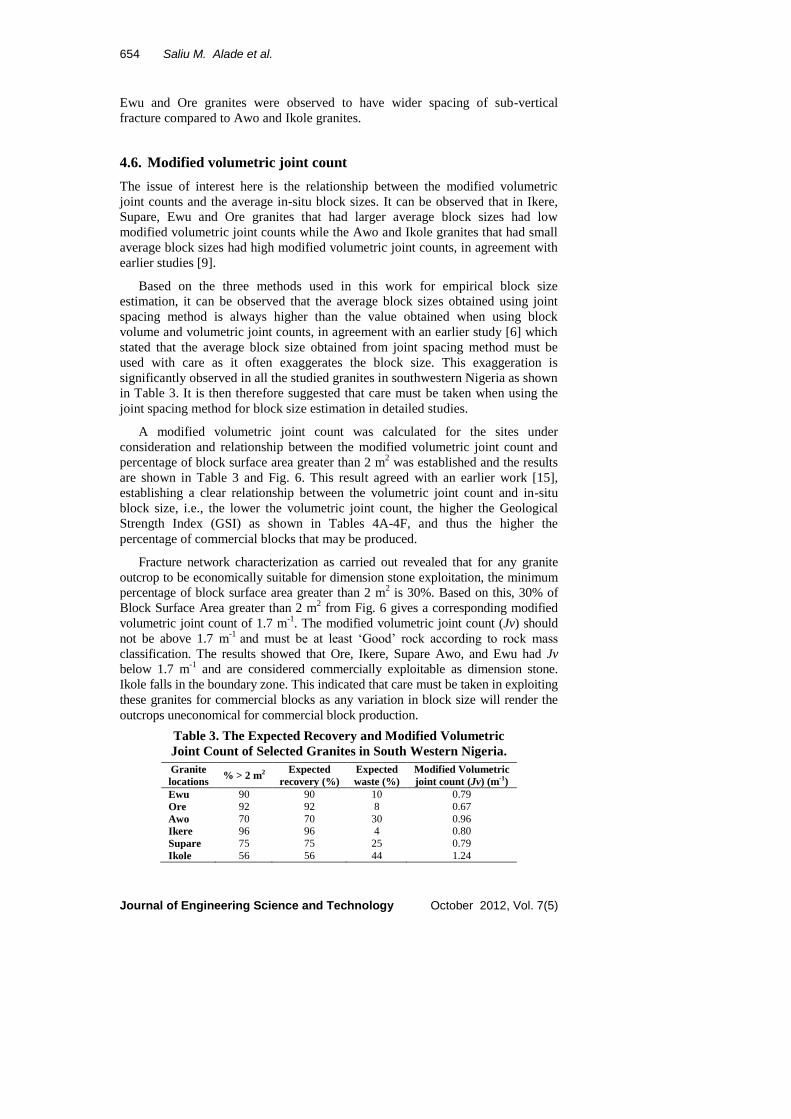
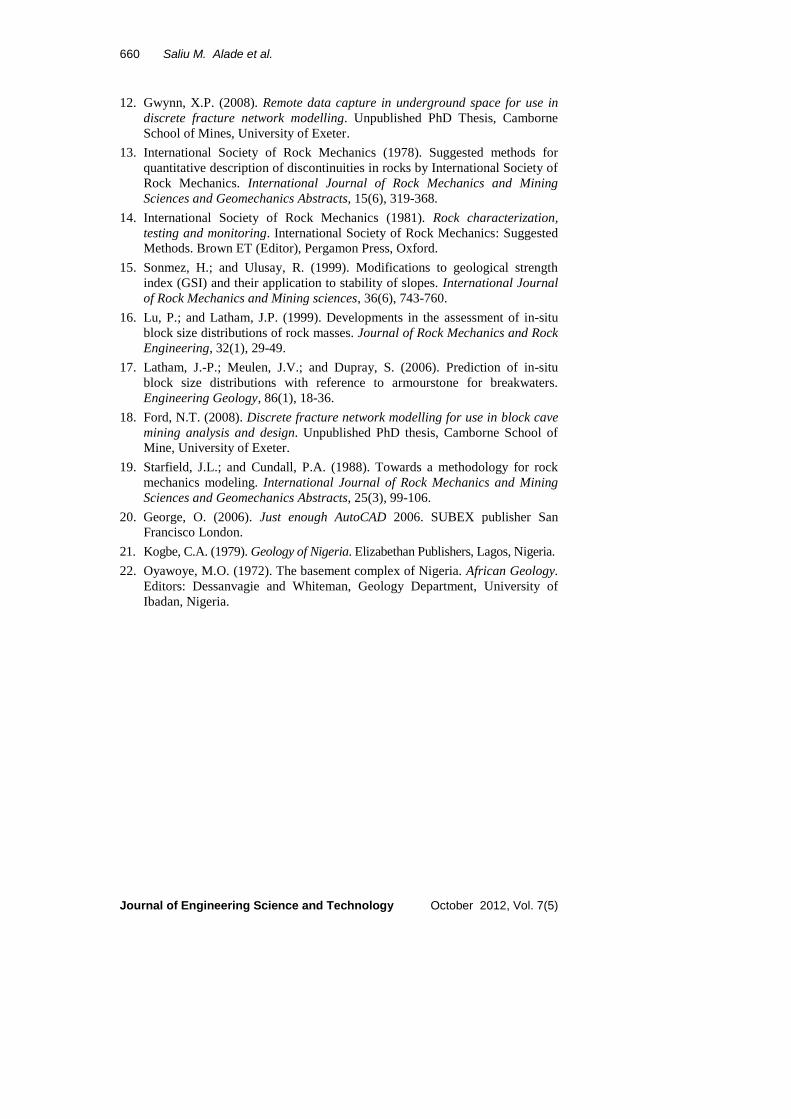
A modified volumetric joint count was calculated for the sites under
consideration and relationship between the modified volumetric joint count and
percentage of block surface area greater than 2 m2 was established and the results
are shown in Table 3 and Fig. 6. This result agreed with an earlier work [15],
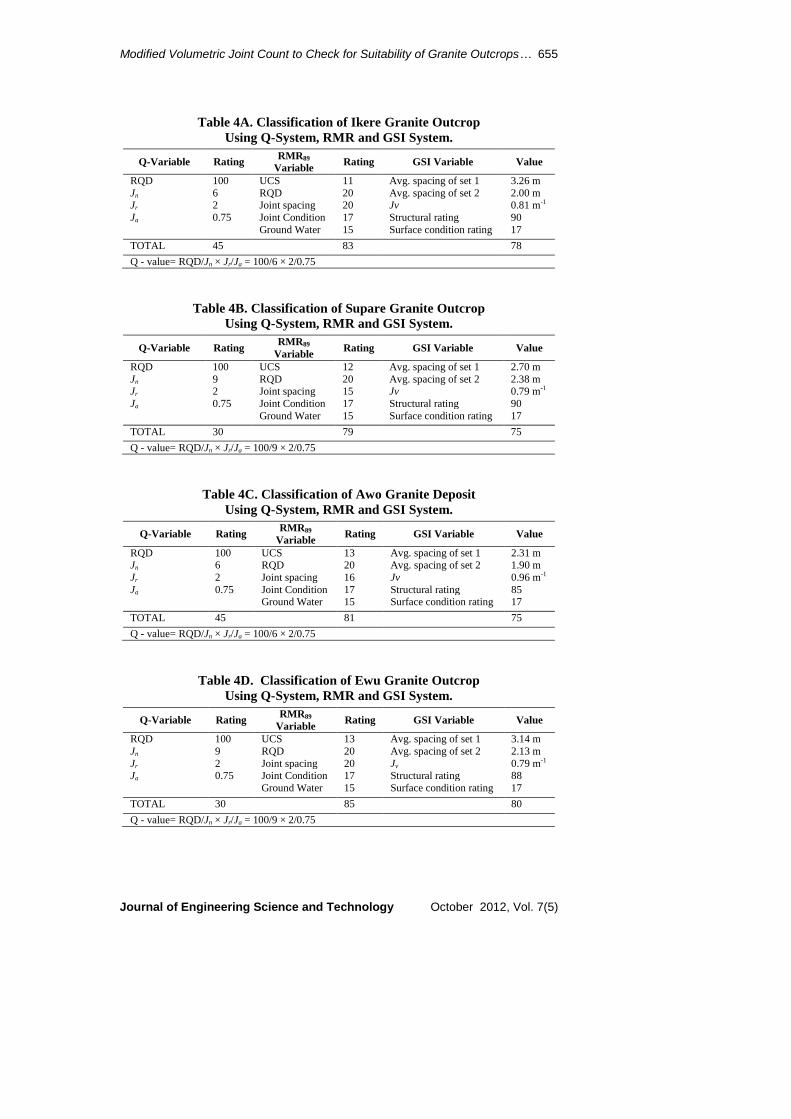
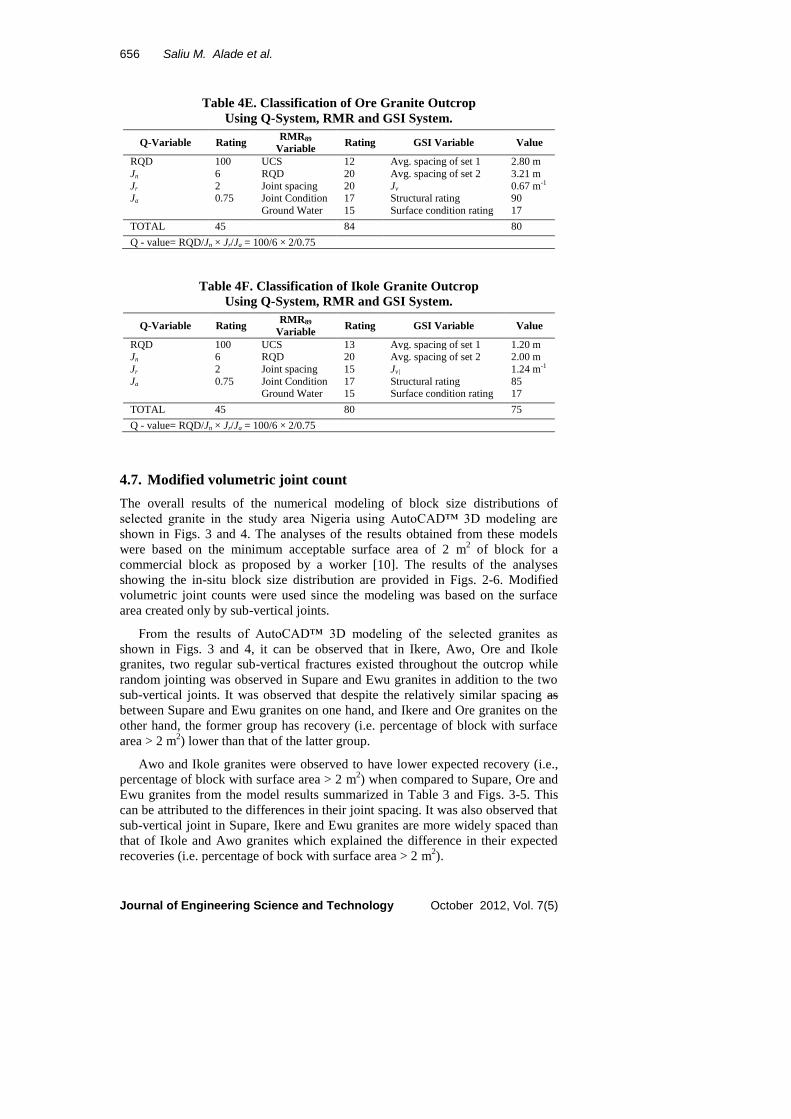
establishing a clear relationship between the volumetric joint count and in-situ
block size, i.e., the lower the volumetric joint count, the higher the Geological
Strength Index (GSI) as shown in Tables 4A-4F, and thus the higher the
percentage of commercial blocks that may be produced.
Fracture network characterization as carried out revealed that for any granite
outcrop to be economically suitable for dimension stone exploitation, the minimum
percentage of block surface area greater than 2 m2 is 30%. Based on this, 30% of
Block Surface Area greater than 2 m2 from Fig. 6 gives a corresponding modified
volumetric joint count of 1.7 m-1
. The modified volumetric joint count (Jv) should
not be above 1.7 m-1
and must be at least ‘Good’ rock according to rock mass
classification. The results showed that Ore, Ikere, Supare Awo, and Ewu had Jv
below 1.7 m-1
and are considered commercially exploitable as dimension stone.
Ikole falls in the boundary zone. This indicated that care must be taken in exploiting
these granites for commercial blocks as any variation in block size will render the
outcrops uneconomical for commercial block production.
Table 3. The Expected Recovery and Modified Volumetric
Joint Count of Selected Granites in South Western Nigeria.
Granite
locations % > 2 m2
Expected
recovery (%)
Expected
waste (%)
Modified Volumetric
joint count (Jv) (m-1)
Ewu 90 90 10 0.79
Ore 92 92 8 0.67
Awo 70 70 30 0.96
Ikere 96 96 4 0.80
Supare 75 75 25 0.79
Ikole 56 56 44 1.24
Modified Volumetric Joint Count to Check for Suitability of Granite Outcrops… 655
Journal of Engineering Science and Technology October 2012, Vol. 7(5)
Table 4A. Classification of Ikere Granite Outcrop
Using Q-System, RMR and GSI System.
Q-Variable Rating RMR89
Variable Rating GSI Variable Value
RQD 100 UCS 11 Avg. spacing of set 1 3.26 m Jn 6 RQD 20 Avg. spacing of set 2 2.00 m Jr 2 Joint spacing 20 Jv 0.81 m-1 Ja 0.75 Joint Condition 17 Structural rating 90
Ground Water 15 Surface condition rating 17
TOTAL 45 83 78
Q - value= RQD/Jn × Jr/Ja = 100/6 × 2/0.75
Table 4B. Classification of Supare Granite Outcrop
Using Q-System, RMR and GSI System.
Q-Variable Rating RMR89
Variable Rating GSI Variable Value
RQD 100 UCS 12 Avg. spacing of set 1 2.70 m Jn 9 RQD 20 Avg. spacing of set 2 2.38 m Jr 2 Joint spacing 15 Jv 0.79 m-1 Ja 0.75 Joint Condition 17 Structural rating 90
Ground Water 15 Surface condition rating 17
TOTAL 30 79 75
Q - value= RQD/Jn × Jr/Ja = 100/9 × 2/0.75
Table 4C. Classification of Awo Granite Deposit
Using Q-System, RMR and GSI System.
Q-Variable Rating RMR89
Variable Rating GSI Variable Value
RQD 100 UCS 13 Avg. spacing of set 1 2.31 m Jn 6 RQD 20 Avg. spacing of set 2 1.90 m Jr 2 Joint spacing 16 Jv 0.96 m-1 Ja 0.75 Joint Condition 17 Structural rating 85
Ground Water 15 Surface condition rating 17
TOTAL 45 81 75
Q - value= RQD/Jn × Jr/Ja = 100/6 × 2/0.75
Table 4D. Classification of Ewu Granite Outcrop
Using Q-System, RMR and GSI System.
Q-Variable Rating RMR89
Variable Rating GSI Variable Value
RQD 100 UCS 13 Avg. spacing of set 1 3.14 m Jn 9 RQD 20 Avg. spacing of set 2 2.13 m Jr 2 Joint spacing 20 Jv 0.79 m-1 Ja 0.75 Joint Condition 17 Structural rating 88
Ground Water 15 Surface condition rating 17
TOTAL 30 85 80
Q - value= RQD/Jn × Jr/Ja = 100/9 × 2/0.75
656 Saliu M. Alade et al.
Journal of Engineering Science and Technology October 2012, Vol. 7(5)
Table 4E. Classification of Ore Granite Outcrop
Using Q-System, RMR and GSI System.
Q-Variable Rating RMR89
Variable Rating GSI Variable Value
RQD 100 UCS 12 Avg. spacing of set 1 2.80 m Jn 6 RQD 20 Avg. spacing of set 2 3.21 m Jr 2 Joint spacing 20 Jv 0.67 m-1 Ja 0.75 Joint Condition 17 Structural rating 90
Ground Water 15 Surface condition rating 17
TOTAL 45 84 80
Q - value= RQD/Jn × Jr/Ja = 100/6 × 2/0.75
Table 4F. Classification of Ikole Granite Outcrop
Using Q-System, RMR and GSI System.
Q-Variable Rating RMR89
Variable Rating GSI Variable Value
RQD 100 UCS 13 Avg. spacing of set 1 1.20 m Jn 6 RQD 20 Avg. spacing of set 2 2.00 m Jr 2 Joint spacing 15 Jv| 1.24 m-1 Ja 0.75 Joint Condition 17 Structural rating 85
Ground Water 15 Surface condition rating 17
TOTAL 45 80 75
Q - value= RQD/Jn × Jr/Ja = 100/6 × 2/0.75
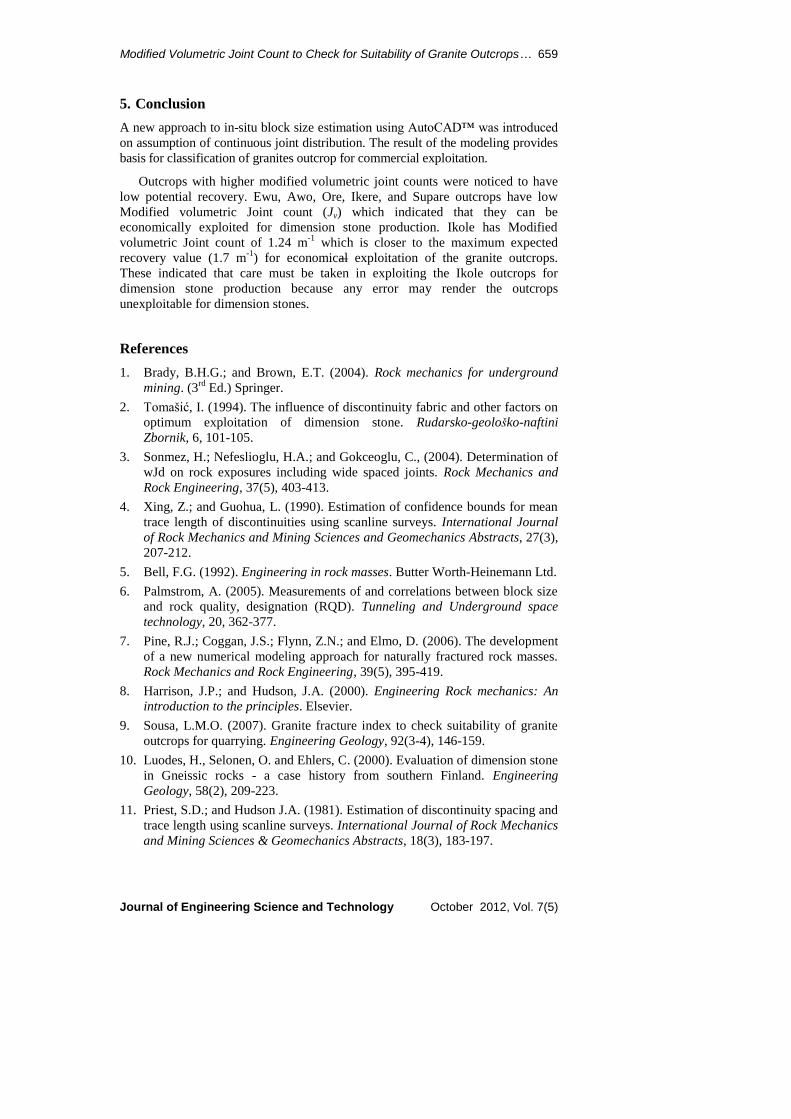
4.7. Modified volumetric joint count
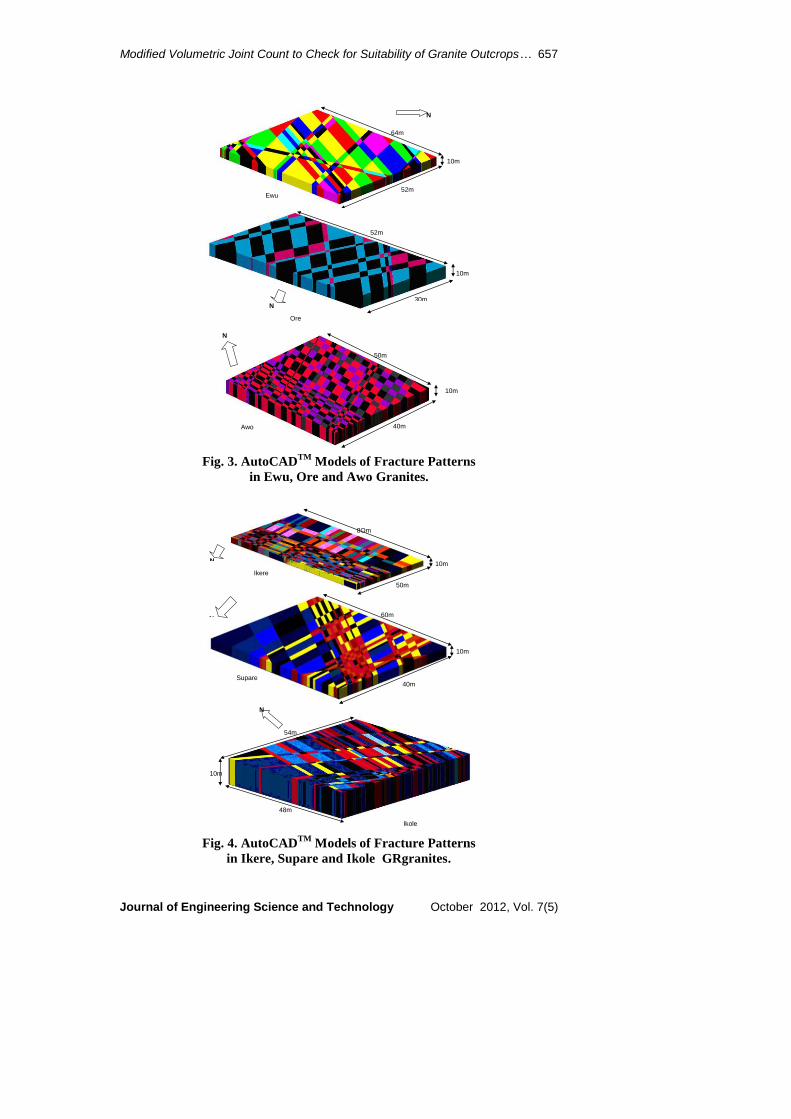
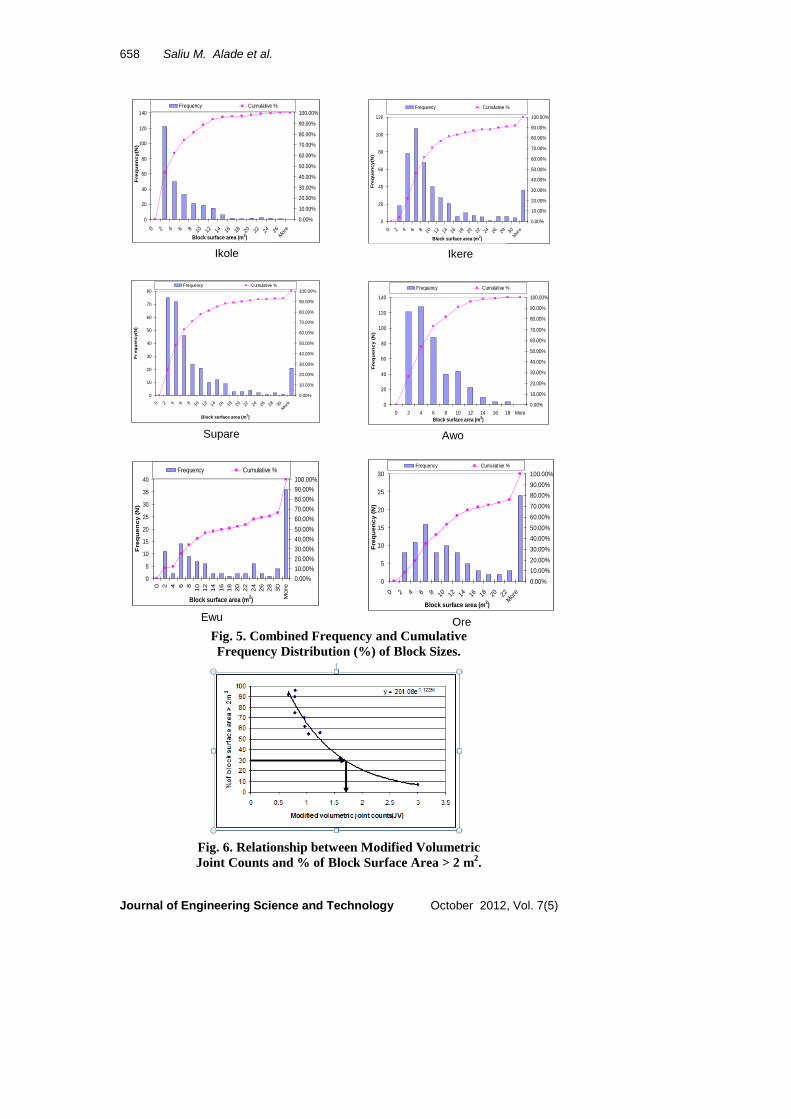
The overall results of the numerical modeling of block size distributions of
selected granite in the study area Nigeria using AutoCAD™ 3D modeling are
shown in Figs. 3 and 4. The analyses of the results obtained from these models
were based on the minimum acceptable surface area of 2 m2 of block for a
commercial block as proposed by a worker [10]. The results of the analyses
showing the in-situ block size distribution are provided in Figs. 2-6. Modified
volumetric joint counts were used since the modeling was based on the surface
area created only by sub-vertical joints.
From the results of AutoCAD™ 3D modeling of the selected granites as
shown in Figs. 3 and 4, it can be observed that in Ikere, Awo, Ore and Ikole
granites, two regular sub-vertical fractures existed throughout the outcrop while
random jointing was observed in Supare and Ewu granites in addition to the two
sub-vertical joints. It was observed that despite the relatively similar spacing as
between Supare and Ewu granites on one hand, and Ikere and Ore granites on the
other hand, the former group has recovery (i.e. percentage of block with surface
area > 2 m2) lower than that of the latter group.
Awo and Ikole granites were observed to have lower expected recovery (i.e.,
percentage of block with surface area > 2 m2) when compared to Supare, Ore and
Ewu granites from the model results summarized in Table 3 and Figs. 3-5. This
can be attributed to the differences in their joint spacing. It was also observed that
sub-vertical joint in Supare, Ikere and Ewu granites are more widely spaced than
that of Ikole and Awo granites which explained the difference in their expected
recoveries (i.e. percentage of bock with surface area > 2 m2).
Modified Volumetric Joint Count to Check for Suitability of Granite Outcrops… 657
Journal of Engineering Science and Technology October 2012, Vol. 7(5)
N
64m
52m
10m
Ewu
N
52m
10m
30m
Ore
N
10m
50m
40m Awo
Fig. 3. AutoCADTM
Models of Fracture Patterns
in Ewu, Ore and Awo Granites.
10m
60m
40m
N
N 10m
8Om
50m
Ikere
Supare
Ikole
N
10m
48m
54m
Fig. 4. AutoCADTM
Models of Fracture Patterns
in Ikere, Supare and Ikole GRgranites.
658 Saliu M. Alade et al.
Journal of Engineering Science and Technology October 2012, Vol. 7(5)
0
20
40
60
80
100
120
140
0 2 4 6 8 10 12 14 16 18 20 22 24 26
Mor
e
Block surface area (m2)
Fre
qu
en
cy
(N)
0.00%
10.00%
20.00%
30.00%
40.00%
50.00%
60.00%
70.00%
80.00%
90.00%
100.00%
Frequency Cumulative %
0
20
40
60
80
100
120
0 2 4 6 8 10 12 14 16 18 20 22 24 26 28 30
Mor
e
Block surface area (m2)
Fre
qu
en
cy
(N)
0.00%
10.00%
20.00%
30.00%
40.00%
50.00%
60.00%
70.00%
80.00%
90.00%
100.00%
Frequency Cumulative %
0
10
20
30
40
50
60
70
80
0 2 4 6 8 10 12 14 16 18 20 22 24 26 28 30
Mor
e
Block surface area (m2)
Fr
eq
ue
nc
y(N
)
0.00%
10.00%
20.00%
30.00%
40.00%
50.00%
60.00%
70.00%
80.00%
90.00%
100.00%
Frequency Cumulative %
0
20
40
60
80
100
120
140
0 2 4 6 8 10 12 14 16 18 More
Block surface area (m2)
Fre
qu
en
cy
(N
)
0.00%
10.00%
20.00%
30.00%
40.00%
50.00%
60.00%
70.00%
80.00%
90.00%
100.00%
Frequency Cumulative %
0
5
10
15
20
25
30
35
40
0 2 4 6 8
10
12
14
16
18
20
22
24
26
28
30
Mo
re
Block surface area (m2)
Fre
qu
en
cy
(N
)
0.00%
10.00%
20.00%
30.00%
40.00%
50.00%
60.00%
70.00%
80.00%
90.00%
100.00%
Frequency Cumulative %
0
5
10
15
20
25
30
0 2 4 6 8 10 12 14 16 18 20 22
Mor
e
Block surface area (m2)
Fre
qu
en
cy
(N
)
0.00%
10.00%
20.00%
30.00%
40.00%
50.00%
60.00%
70.00%
80.00%
90.00%
100.00%
Frequency Cumulative %
Ikole
Ikere
Supare
Awo
Ewu
Ore
Fig. 5. Combined Frequency and Cumulative
Frequency Distribution (%) of Block Sizes.
Fig. 6. Relationship between Modified Volumetric
Joint Counts and % of Block Surface Area > 2 m2.
Modified Volumetric Joint Count to Check for Suitability of Granite Outcrops… 659
Journal of Engineering Science and Technology October 2012, Vol. 7(5)
5. Conclusion
A new approach to in-situ block size estimation using AutoCAD™ was introduced
on assumption of continuous joint distribution. The result of the modeling provides
basis for classification of granites outcrop for commercial exploitation.
Outcrops with higher modified volumetric joint counts were noticed to have
low potential recovery. Ewu, Awo, Ore, Ikere, and Supare outcrops have low
Modified volumetric Joint count (Jv) which indicated that they can be
economically exploited for dimension stone production. Ikole has Modified
volumetric Joint count of 1.24 m-1
which is closer to the maximum expected
recovery value (1.7 m-1
) for economical exploitation of the granite outcrops.
These indicated that care must be taken in exploiting the Ikole outcrops for
dimension stone production because any error may render the outcrops
unexploitable for dimension stones.
References
1. Brady, B.H.G.; and Brown, E.T. (2004). Rock mechanics for underground
mining. (3rd
Ed.) Springer.
2. Tomašić, I. (1994). The influence of discontinuity fabric and other factors on
optimum exploitation of dimension stone. Rudarsko-geološko-naftini
Zbornik, 6, 101-105.
3. Sonmez, H.; Nefeslioglu, H.A.; and Gokceoglu, C., (2004). Determination of
wJd on rock exposures including wide spaced joints. Rock Mechanics and
Rock Engineering, 37(5), 403-413.
4. Xing, Z.; and Guohua, L. (1990). Estimation of confidence bounds for mean
trace length of discontinuities using scanline surveys. International Journal
of Rock Mechanics and Mining Sciences and Geomechanics Abstracts, 27(3),
207-212.
5. Bell, F.G. (1992). Engineering in rock masses. Butter Worth-Heinemann Ltd.
6. Palmstrom, A. (2005). Measurements of and correlations between block size
and rock quality, designation (RQD). Tunneling and Underground space
technology, 20, 362-377.
7. Pine, R.J.; Coggan, J.S.; Flynn, Z.N.; and Elmo, D. (2006). The development
of a new numerical modeling approach for naturally fractured rock masses.
Rock Mechanics and Rock Engineering, 39(5), 395-419.
8. Harrison, J.P.; and Hudson, J.A. (2000). Engineering Rock mechanics: An
introduction to the principles. Elsevier.
9. Sousa, L.M.O. (2007). Granite fracture index to check suitability of granite
outcrops for quarrying. Engineering Geology, 92(3-4), 146-159.
10. Luodes, H., Selonen, O. and Ehlers, C. (2000). Evaluation of dimension stone
in Gneissic rocks - a case history from southern Finland. Engineering
Geology, 58(2), 209-223.
11. Priest, S.D.; and Hudson J.A. (1981). Estimation of discontinuity spacing and
trace length using scanline surveys. International Journal of Rock Mechanics
and Mining Sciences & Geomechanics Abstracts, 18(3), 183-197.
660 Saliu M. Alade et al.
Journal of Engineering Science and Technology October 2012, Vol. 7(5)
12. Gwynn, X.P. (2008). Remote data capture in underground space for use in
discrete fracture network modelling. Unpublished PhD Thesis, Camborne
School of Mines, University of Exeter.
13. International Society of Rock Mechanics (1978). Suggested methods for
quantitative description of discontinuities in rocks by International Society of
Rock Mechanics. International Journal of Rock Mechanics and Mining
Sciences and Geomechanics Abstracts, 15(6), 319-368.
14. International Society of Rock Mechanics (1981). Rock characterization,
testing and monitoring. International Society of Rock Mechanics: Suggested
Methods. Brown ET (Editor), Pergamon Press, Oxford.
15. Sonmez, H.; and Ulusay, R. (1999). Modifications to geological strength
index (GSI) and their application to stability of slopes. International Journal
of Rock Mechanics and Mining sciences, 36(6), 743-760.
16. Lu, P.; and Latham, J.P. (1999). Developments in the assessment of in-situ
block size distributions of rock masses. Journal of Rock Mechanics and Rock
Engineering, 32(1), 29-49.
17. Latham, J.-P.; Meulen, J.V.; and Dupray, S. (2006). Prediction of in-situ
block size distributions with reference to armourstone for breakwaters.
Engineering Geology, 86(1), 18-36.
18. Ford, N.T. (2008). Discrete fracture network modelling for use in block cave
mining analysis and design. Unpublished PhD thesis, Camborne School of
Mine, University of Exeter.
19. Starfield, J.L.; and Cundall, P.A. (1988). Towards a methodology for rock
mechanics modeling. International Journal of Rock Mechanics and Mining
Sciences and Geomechanics Abstracts, 25(3), 99-106.
20. George, O. (2006). Just enough AutoCAD 2006. SUBEX publisher San
Francisco London.
21. Kogbe, C.A. (1979). Geology of Nigeria. Elizabethan Publishers, Lagos, Nigeria.
22. Oyawoye, M.O. (1972). The basement complex of Nigeria. African Geology.
Editors: Dessanvagie and Whiteman, Geology Department, University of
Ibadan, Nigeria.