Embed Size (px)
Citation preview

ORIGINAL RESEARCH
Modifying the minimum criteria for diagnosing amnestic MCI to improveprediction of brain atrophy and progression to Alzheimer’s disease
Eero Vuoksimaa1 & Linda K. McEvoy2 & Dominic Holland3& Carol E. Franz4,5 & William S. Kremen4,5,6
&
for the Alzheimer’s Disease Neuroimaging Initiative
# The Author(s) 2018
AbstractMild cognitive impairment (MCI) is a heterogeneous condition with variable outcomes. Improving diagnosis to increase thelikelihood that MCI reliably reflects prodromal Alzheimer’s Disease (AD) would be of great benefit for clinical practice andintervention trials. In 230 cognitively normal (CN) and 394 MCI individuals from the Alzheimer’s Disease NeuroimagingInitiative, we studied whether an MCI diagnostic requirement of impairment on at least two episodic memory tests improves3-year prediction of medial temporal lobe atrophy and progression to AD. Based on external age-adjusted norms for delayed freerecall on the Rey Auditory Verbal Learning Test (AVLT), MCI participants were further classified as having normal (AVLT+,above −1 SD, n = 121) or impaired (AVLT -, −1 SD or below, n = 273) AVLT performance. CN, AVLT+, and AVLT- groupsdiffered significantly on baseline brain (hippocampus, entorhinal cortex) and cerebrospinal fluid (amyloid, tau, p-tau) bio-markers, with the AVLT- group being most abnormal. The AVLT- group had significantly more medial temporal atrophy anda substantially higher AD progression rate than the AVLT+ group (51% vs. 16%, p < 0.001). The AVLT+ group had similarmedial temporal trajectories compared to CN individuals. Results were similar even when restricted to individuals with aboveaverage (based on the CN group mean) baseline medial temporal volume/thickness. Requiring impairment on at least twomemory tests for MCI diagnosis can markedly improve prediction of medial temporal atrophy and conversion to AD, even inthe absence of baseline medial temporal atrophy. This modification constitutes a practical and cost-effective approach for clinicaland research settings.
Keywords Alzheimer’s disease . Biomarkers . Early detection .Mild cognitive impairment . Neuropsychological testing
Introduction
The pathological process in Alzheimer’s disease (AD) beginslong before the onset of dementia (Braak et al. 2011; Jack et al.2010) making early detection a primary concern. To aid inearly detection, mild cognitive impairment (MCI) has beenintroduced as a prodromal stage of AD. However, MCI canarise from causes other than AD (Albert et al. 2011; Sperlinget al. 2011). Improvement in MCI diagnosis is needed to en-sure that those with MCI are actually at increased risk ofprogressing to AD.
Although individuals with MCI are at elevated risk fordeveloping dementia, there is substantial variation in progres-sion rates across studies (Langa and Levine 2014). Amyloidand tau biomarkers are used to support a diagnosis of AD inresearch studies, and the National Institute on Aging-Alzheimer’s Association (NIA-AA) framework also recom-mends inclusion of these biomarkers for earlier identification
Electronic supplementary material The online version of this article(https://doi.org/10.1007/s11682-018-0019-6) contains supplementarymaterial, which is available to authorized users.
* Eero [email protected]
1 Institute for Molecular Medicine Finland (FIMM), University ofHelsinki, P.O. Box 20 (Tukholmankatu 8), 00014 Helsinki, Finland
2 Department of Radiology, University of California, San Diego, LaJolla, CA, USA
3 Department of Neurosciences, University of California, San Diego,La Jolla, CA, USA
4 Department of Psychiatry, University of California, San Diego, LaJolla, CA, USA
5 Center for Behavior Genetics of Aging, University of California, SanDiego, CA, USA
6 Center of Excellence for Stress and Mental Health, VA San DiegoHealthcare System, San Diego, CA, USA
Brain Imaging and Behaviorhttps://doi.org/10.1007/s11682-018-0019-6

of individuals in preclinical or prodromal stages of the disease(Jack et al. 2018). However, evidence suggests that cognitivedeficits may be able to predict progression to AD at an evenearlier stage (Edmonds et al. 2015; Gomar et al. 2011;Jedynak et al. 2012, 2015).
The core clinical criteria of the NIA-AA definition of MCIrefer to impairment in one or more cognitive domains (Albertet al. 2011); however no definition of cognitive impairment isprovided. Age- and education-adjusted scores falling 1 or 1.5standard deviations below that expected for age and educationlevel may indicate MCI but these are considered as guidelinesrather than diagnostic cut-offs. Importantly, there is no recom-mendation about the number of tests that must show impair-ment within a domain.
The Alzheimer’s Disease Neuroimaging Initiative (ADNI)criteria for amnestic MCI include a score lower than that ex-pected for education level on delayed recall of the WechslerMemory Scale (WMS) story A (Petersen et al. 2010). Priorneuropsychological studies indicate that reliance on a singlemeasure is problematic because impaired scores on at leastone measure are common in neurologically normal adults givena large battery of tests (Heaton et al. 2004). Memory is alsophenotypically and genetically complex. Differentmemory testsare not all influenced by the same genes and do not manifest thesame degree of age-related change (Kremen et al. 2014b;Panizzon et al. 2011; Papassotiropoulos and de Quervain2011). Relying on a single neuropsychological test to defineimpairment is thus likely to be sub-optimal. Because gaugingmemory impairment is easier and less expensive than assessingcerebrospinal fluid (CSF) or neuroimaging biomarkers, it wouldbe advantageous if the simple addition of an extra neuropsycho-logical test could aid in early diagnosis and prognosis of MCI.
Cognitive deficits are, by definition, more subtle in MCIthan in dementia. As such, more extensive testing is importantfor adequate sensitivity (Kremen et al. 2014a). The Jak/Bondiapproach, an actuarial-neuropsychological diagnosis of MCI,provides strong support for this notion (Bondi et al. 2014; Jaket al. 2009). Compared to the ADNI MCI diagnoses, whendiagnosis was based on the Jak/Bondi approach, there was asmaller proportion reverting to normal, a higher proportionprogressing to AD, a higher proportion with at least oneAPOE-ε4 allele, and higher proportions with abnormal CSFlevels of Aβ and tau; thus, this approach appeared to improveidentification of individuals with prodromal AD (Bondi et al.2014; Jak et al. 2009).
Cognitive measures are strong predictors of progressionfrom amnestic MCI to AD, sometimes even better than bio-markers (Apostolova et al. 2010; Chang et al. 2010; Ewers et al.2012; Gomar et al. 2011, 2014; Heister et al. 2011; Landauet al. 2010; Moradi et al. 2016). In computational models ofprogression to AD, changes in delayed recall on the ReyAuditory Verbal Learning Test (AVLT)—a widely used list-learning test—occurred prior to other indicators (Jedynak
et al. 2012, 2015). Such findings challenge the notion that cog-nitive deficits are always identified last in the progression toAD (Edmonds et al. 2015; Jack et al. 2010, 2013). Importantly,some ADNI MCI participants also performed well on theAVLT, indicating a logical inconsistency in the diagnosis ofamnestic MCI that highlights the importance of employingmore than one test. That is, can someone truly have memoryimpairment if they perform normally on the AVLT?
In the present study, we compared three groups of ADNIparticipants: cognitively normal (CN) individuals; amnesticMCI with normal AVLT performance (AVLT+); and amnesticMCI with impaired AVLT performance (AVLT-). The defini-tion of normal and impaired AVLT delayed recall performancewas based on the age-adjusted Mayo Older AmericansNormative Studies (MOANS) (Steinberg et al. 2005). We ex-amined validators of MCI diagnosis: baseline hippocampalvolume and entorhinal cortex thickness; baseline CSF Aβ1–
42, tau and phosphorylated tau (p-tau); change in hippocampalvolume and entorhinal cortex volume over time; and progres-sion to AD. We hypothesized that including just this one ad-ditional memory test would improve diagnostic precision andprediction, i.e., it would result in higher rates of progression toAD and greater medial temporal atrophy over time. We alsotested whether this effect would be present even in those with-out evidence of medial temporal neurodegeneration. If so, itwould constitute a labor- and cost-efficient improvement forthe core clinical and research criteria for MCI.
Materials and methods
Participants
Data were obtained from the ADNI database (http://adni.loni.usc.edu) (Mueller et al. 2005; Petersen et al. 2010). The ADNIbegan in 2003 as a public-private partnership withMichael W.Weiner, M.D. as the principal investigator. Its primary goalhas been to determine whether combinations of longitudinalneuroimaging, other biological markers, and clinical and neu-ropsychological assessments can measure the progression ofMCI and early AD.
The present study included 624 participants with AVLTdata: 394 who fulfilled ADNI criteria for MCI and 230 whowere CN at baseline. CSF measures were available for 308–312 participants. Baseline brain measures were available for569 participants. The number of participants in longitudinalbrain analyses varied for each time point: 6 month [m] = 448;12 m = 402; 18 m = 216; 24 m = 327; 36 m = 169.
ADNI MCI diagnosis
Diagnosis of amnestic MCI was made according Petersenet al. criteria: objective memory impairment defined by
Brain Imaging and Behavior

education-adjusted scores ≥1.5 SDs below the normativemean on delayed recall of WMS Story A; subjective memorycomplaints; global Clinical Dementia Rating Scale score of0.5; and Mini-Mental State Examination score ≥ 24 (Petersenet al. 2010).
Demographics
Demographics included age, sex, education, and theAmerican National Adult Reading Test (ANART) as ameasure of premorbid cognitive ability. APOE genotype sta-tus was based on presence/absence of an ε4 allele.
Rey auditory verbal learning test (AVLT)
The AVLT includes five learning trials of a 15-word listfollowed by an interference list, recall of the first list, and20-min delayed recall of the first list. We used the age-specific norms from the MOANS (Steinberg et al. 2005).We further categorized those with MCI based on a cutoff of1 SD below the mean on AVLT delayed recall: AVLT- (scaledscore ≤ 7); and AVLT+ (scaled score ≥ 8). We used a moreliberal threshold for defining AVLT impairment because, bydefinition, MCI participants were already ≥1.5 SDs below thenormative mean on the WMS (Jak et al. 2009). In a secondaryanalysis, we also investigated progression to AD in scaled-score groups separately.
Biomarkers
The ADNI Biomarker Core Laboratory at the University ofPennsylvania used standardized procedures to measure Aβ1–
42, tau and p-tau181p in CSF (Shaw 2008). Low CSF levels ofAβ1–42 are thought to reflect accumulation of amyloid in se-nile plaques in the brain (Zwan et al. 2016). Elevated CSFlevels of tau and p-tau are thought to reflect neurofibrillarytangles (Zetterberg 2017).We used previously established cut-offs for these measures (Shaw et al. 2009). ADNI participantsunderwent brain magnetic resonance imaging with 1.5 T scan-ners. We examined two key Alzheimer’s-related medial tem-poral lobe regions of interest: bilateral hippocampal volumeand entorhinal cortex thickness based on FreeSurfer 5.1 (Daleet al. 1999; Fischl et al. 1999, 2002). Change over time inthese structures was quantified using Quarc (Holland et al.2011, 2012).
Statistical analysis
We first report prevalence rates, means, SDs, and χ2 and t-testscomparing CN and ADNI-definedMCI participants. Next, wereport corresponding statistics comparing our AVLT+ andAVLT- MCI subgroups. We used linear regression modelswith the AVLT+ group as a reference in analyses of baseline
differences in CSF biomarkers and brain measures.Figures contain raw values for the CSF and brain measures,but the P-values are based on models with age and sex ascovariates in the CSF analyses, and age, sex and estimatedintracranial volume as covariates in the neuroimaginganalyses.
We used mixed models to investigate rate of change inhippocampal volume and entorhinal cortices thickness.Percent change from baseline was assessed at 6, 12, 18, 24and 36months; per the ADNI protocol, CNs were not tested at18months. Slopes for brain atrophy were estimated by includ-ing an interaction term between diagnostic group and visitmonth of follow-up.
Logistic regression models were used to compare the prev-alence of AD for AVLT+ and AVLT- groups at each timepoint. Cox proportional hazard models with the Breslowmethod for ties were used to examine progression to AD inAVLT+ and AVLT- groups. We also examined conversion toAD separately in different AVLT scaled-score categories.
To test whether we could observe cognitive impairment inthe absence of neurodegeneration, we compared subgroups ofindividuals who had no neurodegeneration at baseline. Theseanalyses included only individuals whose hippocampal vol-ume or entorhinal cortex thickness was greater than the CNgroup mean at baseline.
We considered a P value <.05 threshold for statistical sig-nificance. Analyses were performed using Stata version 13.
Results
Descriptive statistics
There were significantly (χ2 = 8.66, P < .01) more men in theMCI group (64%, 254/396) than in the CN group (52%, 120/230). CN participants were older (P < .05) and had higherANARTscores (P < .001) than those withMCI but education-al level did not differ between these two groups (P = .14).Having an APOE ε4 allele was more common (χ2 = 42.52,P < .001) in participants with MCI (54%) than in the CNgroup (27%) (Table 1).
The AVLT- group (n = 273) was younger than the AVLT+group (n = 121) (P < .01), but there were no differences ineducational level (P = .13) or ANART performance(P = .34), and the sex ratios were similar (χ2 = 0.00,P = .999, 64% men in both groups, 176 men in the AVLT-and 78 men in the AVLT+ groups) (Table 1). Having anAPOE-ε4 allele was significantly (χ2 = 14.04, P < .001) morecommon in AVLT- group (60%) than the AVLT+ group(40%). Not surprisingly, these groups also differed significant-ly on other AVLT measures (Table 1, Online Resource:Supplementary Fig. 1).
Brain Imaging and Behavior

Baseline CSF measures
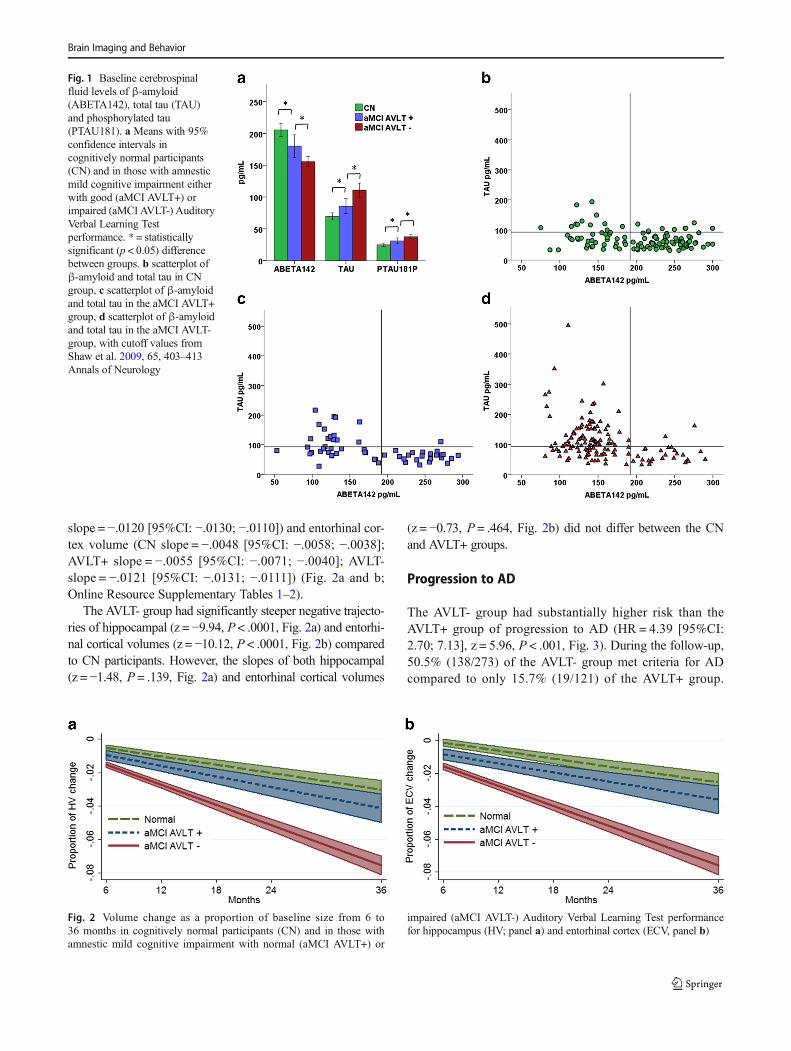
The three groups differed on all CSF biomarkers (Table 2,Fig. 1a–d). Aβ1–42 level was significantly (t = 2.77,P = .006) higher in the CN group than the AVLT+ group,which in turn had significantly higher Aβ1–42 levels com-pared to AVLT– group (t = −3.11, P = .002). Both tau andp-tau181p levels were significantly lower in the CN group(tau: t = −2.06, P = .040; p-tau181p: t = −2.16, P = .031)than the AVLT+ group, and in the AVLT+ group comparedwith the AVLT- group (tau: t = 3.37, P = .001; p-tau181p:t = 2.83, P = .005).
The proportion of those with both abnormal Aβ1–42
(<192 pg/ml) and abnormal t-tau (>93 pg/ml) levels was sig-nificantly (P < .001) higher in AVLT- group (49.6%) than theAVLT+ group (23.6%). Also, the proportion of those withboth Aβ1–42 and tau levels in the normal range was lower inthe AVLT- group (17.3%) (Fig. 1d) compared to AVLT+group (40.0%) (Fig. 1c). In CN participants, just over half
(54.4%) had normal levels of both Aβ1–42 and total tau,whereas only 10.5% had abnormal levels of both (Fig. 1b).
Baseline brain measures
CN participants had significantly greater hippocampal vol-ume (t = 3.49, P = .001) and thicker entorhinal cortex(t = 2.85, P < .001) than the AVLT+ group (Table 2, OnlineResource Supplementary Fig. 2). The AVLT- group had sig-nificantly smaller hippocampal volume (t = −4.86, P < .001)and thinner entorhinal cortex (t = −5.74, P < .001) than theAVLT+ group (Table 2, Online Resource SupplementaryFig. 2).
Longitudinal brain measures
All groups had significant negative slopes for hippocampalvolume (CN slope = −.0050 [95%CI: −.0059; −.0040];AVLT+ slope = −.0064 [95%CI: −.0079; −.0048]; AVLT-
Table 1 Demographic and memory measures in cognitively normalindividuals (CN) and those with amnestic mild cognitive impairment(MCI) according to the Alzheimer’s Disease Neuroimaging Initiative
criteria, and in the two MCI subgroups classified according toperformance on the Rey Auditory Verbal Learning Test (AVLT) delayedfree recall
CN (n = 230) MCI (n = 394) AVLT+ (n = 121) AVLT- (n = 273)
M SD M SD t M SD M SD t
Age 76.12 5.02 74.92 7.44 2.40* 76.77 7.19 74.14 7.36 3.29**
Education 16.03 2.85 15.67 3.04 1.48 16.02 2.84 15.51 3.13 1.52
ANART 40.28 9.13 36.33 9.90 5.02*** 37.06 10.38 36.01 9.68 0.97
AVLT 1 5.17 1.66 4,19 1.53 7.43*** 4.81 1.63 3.92 1.40 5.52***
AVLT 5 11.02 2.35 7.47 2.58 17.01*** 9.76 2.55 6.45 1.85 12.88***
AVLT 1–5 43.35 9.13 30.64 8.97 16.85*** 38.08 9.54 27.34 6.36 11.33***
AVLT delayed 7.42 3.70 2.81 3.26 15.49*** 6.76 2.89 1.07 1.29 20.80***
ANARTAmerican National Adult Reading Test,MCImild cognitive impairment diagnosis according to ADNI criteria; AVLT + =MCI individuals withnormal performance in Rey Auditory Verbal Learning Test, defined as age adjusted score of better than −1 SD; AVLT- =MCI individuals with impairedperformance in Rey Auditory Verbal Learning Test, defined as age adjusted score of −1 SD or below; AVLT 1 = number of correct words in AVLT trial 1;AVLT 5 = number of correct words in AVLT trial 5; AVLT 1–5 = number of correct words in AVLT trials 1–5; AVLT del = number of correct words inAVLT delayed free recall; Education indicate years of education. ANART indicate number of correctly pronounced words
*P < .05; **P < .01; ***P < .001
Table 2 Baseline cerebrospinalfluid (CSF) and brain biomarkersin cognitively normal individuals(CN) and two subgroups ofamnestic mild cognitiveimpairment individuals classifiedaccording to performance on theRey Auditory Verbal LearningTest (AVLT) delayed free recall.AVLT+ group is significantlydifferent from CN and AVLT-groups in all biomarkers
CN AVLT+ AVLT-
M SD M SD M SD
CSFAβ1–42 (pg/ml) 205.59 55.09 181.39 65.81 155.58 47.17
CSF tau (pg/ml) 69.68 30.37 85.69 42.70 110.78 65.72
CSF p-tau181p (pg/ml) 24.86 14.58 30.61 17.14 37.64 18.07
Hippocampal volume (mm3) 3631 440 3432 470 3159 522
Entorhinal cortical thickness (mm) 3.25 0.30 3.12 0.44 2.85 0.45
AVLT + =MCI individuals with normal performance in Rey Auditory Verbal Learning Test, defined as ageadjusted score of better than −1 SD; AVLT - =MCI individuals with impaired performance in Rey AuditoryVerbal Learning Test, defined as age adjusted score of −1 SD or below
Brain Imaging and Behavior
slope = −.0120 [95%CI: −.0130; −.0110]) and entorhinal cor-tex volume (CN slope = −.0048 [95%CI: −.0058; −.0038];AVLT+ slope = −.0055 [95%CI: −.0071; −.0040]; AVLT-slope = −.0121 [95%CI: −.0131; −.0111]) (Fig. 2a and b;Online Resource Supplementary Tables 1–2).
The AVLT- group had significantly steeper negative trajecto-ries of hippocampal (z = −9.94, P < .0001, Fig. 2a) and entorhi-nal cortical volumes (z = −10.12, P < .0001, Fig. 2b) comparedto CN participants. However, the slopes of both hippocampal(z = −1.48, P = .139, Fig. 2a) and entorhinal cortical volumes
(z = −0.73, P = .464, Fig. 2b) did not differ between the CNand AVLT+ groups.
Progression to AD
The AVLT- group had substantially higher risk than theAVLT+ group of progression to AD (HR = 4.39 [95%CI:2.70; 7.13], z = 5.96, P < .001, Fig. 3). During the follow-up,50.5% (138/273) of the AVLT- group met criteria for ADcompared to only 15.7% (19/121) of the AVLT+ group.
Fig. 1 Baseline cerebrospinalfluid levels of β-amyloid(ABETA142), total tau (TAU)and phosphorylated tau(PTAU181). a Means with 95%confidence intervals incognitively normal participants(CN) and in those with amnesticmild cognitive impairment eitherwith good (aMCI AVLT+) orimpaired (aMCI AVLT-) AuditoryVerbal Learning Testperformance. * = statisticallysignificant (p < 0.05) differencebetween groups. b scatterplot ofβ-amyloid and total tau in CNgroup, c scatterplot of β-amyloidand total tau in the aMCI AVLT+group, d scatterplot of β-amyloidand total tau in the aMCI AVLT-group, with cutoff values fromShaw et al. 2009, 65, 403–413Annals of Neurology
Fig. 2 Volume change as a proportion of baseline size from 6 to36 months in cognitively normal participants (CN) and in those withamnestic mild cognitive impairment with normal (aMCI AVLT+) or
impaired (aMCI AVLT-) Auditory Verbal Learning Test performancefor hippocampus (HV; panel a) and entorhinal cortex (ECV, panel b)
Brain Imaging and Behavior
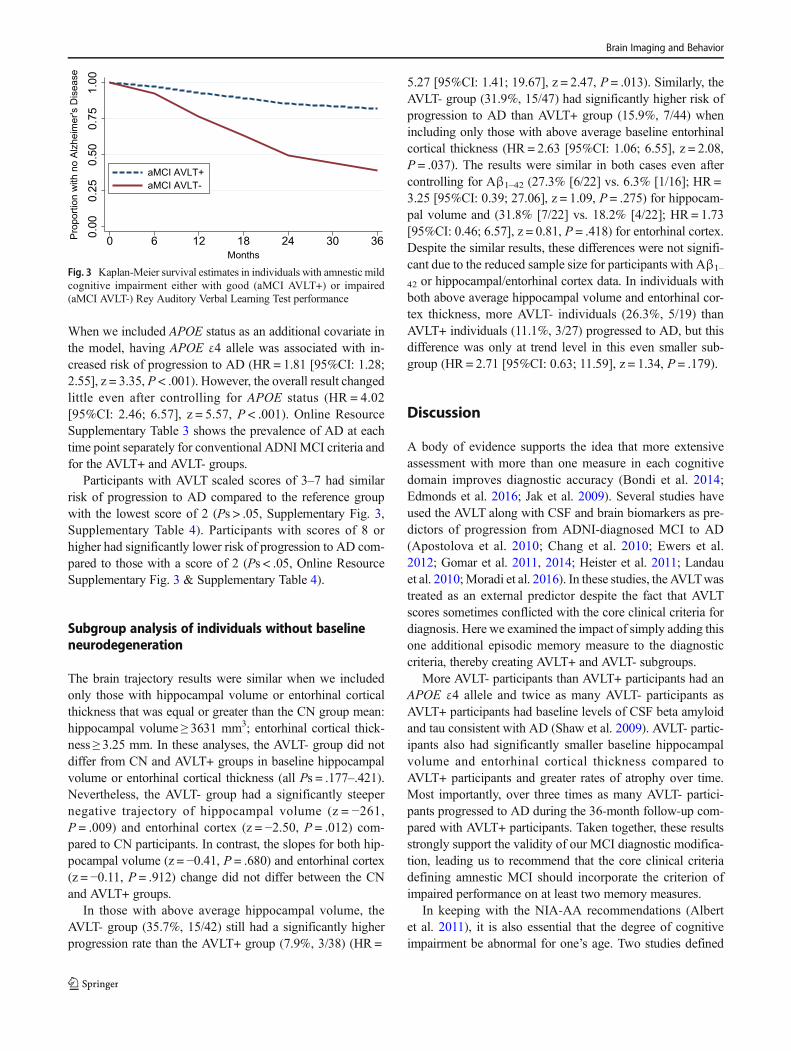
When we included APOE status as an additional covariate inthe model, having APOE ε4 allele was associated with in-creased risk of progression to AD (HR = 1.81 [95%CI: 1.28;2.55], z = 3.35, P < .001). However, the overall result changedlittle even after controlling for APOE status (HR = 4.02[95%CI: 2.46; 6.57], z = 5.57, P < .001). Online ResourceSupplementary Table 3 shows the prevalence of AD at eachtime point separately for conventional ADNIMCI criteria andfor the AVLT+ and AVLT- groups.
Participants with AVLT scaled scores of 3–7 had similarrisk of progression to AD compared to the reference groupwith the lowest score of 2 (Ps > .05, Supplementary Fig. 3,Supplementary Table 4). Participants with scores of 8 orhigher had significantly lower risk of progression to AD com-pared to those with a score of 2 (Ps < .05, Online ResourceSupplementary Fig. 3 & Supplementary Table 4).
Subgroup analysis of individuals without baselineneurodegeneration
The brain trajectory results were similar when we includedonly those with hippocampal volume or entorhinal corticalthickness that was equal or greater than the CN group mean:hippocampal volume ≥ 3631 mm3; entorhinal cortical thick-ness ≥ 3.25 mm. In these analyses, the AVLT- group did notdiffer from CN and AVLT+ groups in baseline hippocampalvolume or entorhinal cortical thickness (all Ps = .177–.421).Nevertheless, the AVLT- group had a significantly steepernegative trajectory of hippocampal volume (z = −261,P = .009) and entorhinal cortex (z = −2.50, P = .012) com-pared to CN participants. In contrast, the slopes for both hip-pocampal volume (z = −0.41, P = .680) and entorhinal cortex(z = −0.11, P = .912) change did not differ between the CNand AVLT+ groups.
In those with above average hippocampal volume, theAVLT- group (35.7%, 15/42) still had a significantly higherprogression rate than the AVLT+ group (7.9%, 3/38) (HR =
5.27 [95%CI: 1.41; 19.67], z = 2.47, P = .013). Similarly, theAVLT- group (31.9%, 15/47) had significantly higher risk ofprogression to AD than AVLT+ group (15.9%, 7/44) whenincluding only those with above average baseline entorhinalcortical thickness (HR = 2.63 [95%CI: 1.06; 6.55], z = 2.08,P = .037). The results were similar in both cases even aftercontrolling for Aβ1–42 (27.3% [6/22] vs. 6.3% [1/16]; HR =3.25 [95%CI: 0.39; 27.06], z = 1.09, P = .275) for hippocam-pal volume and (31.8% [7/22] vs. 18.2% [4/22]; HR = 1.73[95%CI: 0.46; 6.57], z = 0.81, P = .418) for entorhinal cortex.Despite the similar results, these differences were not signifi-cant due to the reduced sample size for participants with Aβ1–
42 or hippocampal/entorhinal cortex data. In individuals withboth above average hippocampal volume and entorhinal cor-tex thickness, more AVLT- individuals (26.3%, 5/19) thanAVLT+ individuals (11.1%, 3/27) progressed to AD, but thisdifference was only at trend level in this even smaller sub-group (HR = 2.71 [95%CI: 0.63; 11.59], z = 1.34, P = .179).
Discussion
A body of evidence supports the idea that more extensiveassessment with more than one measure in each cognitivedomain improves diagnostic accuracy (Bondi et al. 2014;Edmonds et al. 2016; Jak et al. 2009). Several studies haveused the AVLT along with CSF and brain biomarkers as pre-dictors of progression from ADNI-diagnosed MCI to AD(Apostolova et al. 2010; Chang et al. 2010; Ewers et al.2012; Gomar et al. 2011, 2014; Heister et al. 2011; Landauet al. 2010;Moradi et al. 2016). In these studies, the AVLTwastreated as an external predictor despite the fact that AVLTscores sometimes conflicted with the core clinical criteria fordiagnosis. Here we examined the impact of simply adding thisone additional episodic memory measure to the diagnosticcriteria, thereby creating AVLT+ and AVLT- subgroups.
More AVLT- participants than AVLT+ participants had anAPOE ε4 allele and twice as many AVLT- participants asAVLT+ participants had baseline levels of CSF beta amyloidand tau consistent with AD (Shaw et al. 2009). AVLT- partic-ipants also had significantly smaller baseline hippocampalvolume and entorhinal cortical thickness compared toAVLT+ participants and greater rates of atrophy over time.Most importantly, over three times as many AVLT- partici-pants progressed to AD during the 36-month follow-up com-pared with AVLT+ participants. Taken together, these resultsstrongly support the validity of our MCI diagnostic modifica-tion, leading us to recommend that the core clinical criteriadefining amnestic MCI should incorporate the criterion ofimpaired performance on at least two memory measures.
In keeping with the NIA-AA recommendations (Albertet al. 2011), it is also essential that the degree of cognitiveimpairment be abnormal for one’s age. Two studies defined
0.0
00.2
50.5
00.7
51.0
0
Proportion w
ith n
o A
lzheim
er's
Dis
ease
0 6 12 18 24 30 36
Months
aMCI AVLT+
aMCI AVLT-
Fig. 3 Kaplan-Meier survival estimates in individuals with amnestic mildcognitive impairment either with good (aMCI AVLT+) or impaired(aMCI AVLT-) Rey Auditory Verbal Learning Test performance
Brain Imaging and Behavior

single AVLT impairment cutpoints derived by comparing CNand AD ADNI participants (Heister et al. 2011; Landau et al.2010). The goal of these studies was not to modify the MCIdiagnostic criteria, and their uniform cutpoint would not beoptimal for defining MCI because there are substantial agedifferences on AVLT performance. For example, an averagescore for 85-year olds is 1 SD below the mean for 60-year olds(Steinberg et al. 2005). Also, the original ADNI MCI criteriaused education-adjusted scores of WMS story recall, butscores adjusted for both age and education are likely to furtherimprove MCI diagnosis.
One study of ADNI participants categorized individualswith MCI based on the number of impaired tests and found thatthis criterion worked better than the original ADNI MCI clas-sification or the Jak/Bondi actuarial approach in predicting pro-gression from MCI to AD (Oltra-Cucarella et al. 2018). Thisstudy used the average number of low scores in the worstperforming 10% of ADNI CN participants as the basis for di-agnosing MCI. Low scores were defined as performance of≥1.5 SD below the mean of the CN ADNI participants. Outof 9 scores from 6 tests, the lowest 10% of CN participants had≥3 low scores. The highest progression rate (43%) to AD in a 3-year period was in those with single domain amnesticMCI (i.e.,individuals who were ≥ 1.5 SD below the mean in LogicalMemory delayed recall, AVLT delayed recall and AVLT recog-nition) (Oltra-Cucarella et al. 2018). This rate was higher thanthe progression rate of 33% for multiple-domain amnesticMCI,probably because one could meet criteria for multiple-domainamnestic MCI with only one or two impaired memory scoresbut a single-domain diagnosis would require impairment on allthree. This approach may not be easily transferable into clinicaluse for two reasons. First, the cutoff for impairment was basedon the distribution of scores in the ADNI sample rather thanexternal norms. Second, the criterion of three impaired scores inthe lowest 10% subgroup came from a set of 9 scores, but thenumber of impaired tests in the lowest 10% will vary as afunction of how many are administered. Also, caution is war-ranted when counting certain scores from the same test. Forexample, almost all individuals with impaired AVLT recogni-tion will have impaired AVLT recall. It is probably optimal touse recall measures from two different tests, particularly fordiagnosing MCI when recognition deficits will be much lesscommon than in AD. Our approach simply added a secondmemory recall test, and it resulted in a higher 3-year progres-sion rate of 51%.
With 15.7% of the AVLT+ group progressing to AD, itmight be that some people with only one impaired memorymeasure are in earlier stages of MCI. This may raise concernabout false negatives. Our results are consistent with priorneuropsychological studies indicating that threshold yieldstoo many false positives (Heaton et al. 2004; Palmer et al.1998), but direct comparisons of ADNI diagnoses with Jak/Bondi diagnoses have also been consistent with ADNI
diagnoses resulting in more false negatives (Bondi et al.2014; Edmonds et al. 2016). Indeed, 8% of the CN grouphad AVLT scores >1.5 SDs below normative means. If diag-nosis requires only one impaired memory measure, this couldindicate up to 8% false negatives. We also observed a signif-icantly higher proportion of APOE ε4 allele carriers in thosewith two impaired tests. However, the group differences inprogression to AD held up even after controlling for APOEstatus. This suggests that the AVLT- group may be at greatergenetic risk for AD, but it also indicates that the group differ-ences were not simply driven by APOE.
The AVLT- group had the most baseline CSF and brainbiomarker abnormalities. According to the amyloid/tau/neu-rodegeneration (A/T/(N)) framework (Jack et al. 2018, mem-ory impairment occurs subsequent to A/T/(N). However,when we included only individuals with above average hip-pocampal volume, entorhinal cortex thickness, or both, rela-tive to the CN group mean—i.e., those with no medial tem-poral neurodegeneration—the AVLT- group still had signifi-cantly steeper trajectories of brain atrophy and progressionrates than the AVLT+ group. Although power was limited,the magnitude of increased risk in the AVLT- group was sim-ilar even after controlling for Aβ, suggesting that the differ-ences were not driven simply by amyloidosis.
The representativeness of ADNI is a limitation of our study(Petersen et al. 2010). Over 90%ofADNI participants arewhiteand both CN individuals and those with MCI had a mean edu-cation of 16 years, corresponding to four-year university de-gree. In contrast, U.S. census data indicate that only about10% of people with birth years comparable to that of ADNIparticipants have a college education (Ryan andBauman 2016).In line with the high educational level, ADNI participants havehigh estimated premorbid IQ levels, more than 1 SD above thepopulation mean (Petersen et al. 2010). Additionally, ADNIexcluded individuals who were likely to suffer from other dis-eases that can affect cognition. Thus this approach requiresvalidation in a more representative sample.
In sum, we showed that simply employing two recall tests,rather than one, substantially improved the validity of MCIdiagnoses by reducing false positives with respect to predic-tion of medial temporal atrophy and progression to AD over a3-year period. We showed essentially the same pattern even inindividuals with above average baseline medial temporal vol-umes while controlling for biomarker levels. Although there isas yet no definitive determination as to just how extensive atest battery needs to be for optimizing the core clinical criteriafor MCI, we recommend that requiring impairment on morethan one recall memory test should be a criterion for the diag-nosis of amnestic MCI. These findings are consistent with theview that cognitive impairment may not always come afterbiomarker and brain abnormalities in the progression to AD.Of course, assessing biomarkers and brain structures is still ofgreat importance, but it may be that current detection
Brain Imaging and Behavior

thresholds do not always identify the earliest signs of bio-marker or brain abnormalities. Moreover, on a practical levelfor clinical practice or screening for clinical trials, neuropsy-chological testing is low-cost and non-invasive in comparisonto neuroimaging or CSF or PET biomarker assays.
Acknowledgments Open access funding provided by University ofHelsinki including Helsinki University Central Hospital. Data used inpreparation of this article were obtained from the Alzheimer’s DiseaseNeuroimaging Initiative (ADNI) database (adni.loni.usc.edu). As such,the investigators within the ADNI contributed to the design andimplementation of ADNI and/or provided data but did not participate inanalysis or writing of this report. A complete listing of ADNI investiga-tors can be found at: http://adni.loni.usc.edu/wp-content/uploads/how_to_apply/ADNI_Acknowledgement_List.pdf
Funding EV was supported by the Finnish Brain Foundation sr and TheAcademy of Finland (grant 314639). CEF and WSK were supported byNIA grants: R01 AG022381, AG018386, AG018384, AG050595 andR03 AG 046413.
Data collection and sharing for this project was funded by theAlzheimer’s Disease Neuroimaging Initiative (ADNI) (NationalInstitutes of Health Grant U01 AG024904) and DOD ADNI(Department of Defense award number W81XWH-12-2-0012). ADNIis funded by the National Institute on Aging, the National Institute ofBiomedical Imaging and Bioengineering, and through generous contri-butions from the following: AbbVie, Alzheimer’s Association;Alzheimer’s Drug Discovery Foundation; Araclon Biotech; BioClinica,Inc.; Biogen; Bristol-Myers Squibb Company; CereSpir, Inc.; Cogstate;Eisai Inc.; Elan Pharmaceuticals, Inc.; Eli Lilly and Company;EuroImmun; F. Hoffmann-La Roche Ltd. and its affiliated companyGenentech, Inc.; Fujirebio; GE Healthcare; IXICO Ltd.; JanssenAlzheimer Immunotherapy Research & Development, LLC.; Johnson& Johnson Pharmaceutical Research & Development LLC.; Lumosity;Lundbeck; Merck & Co., Inc.; Meso Scale Diagnostics, LLC.; NeuroRxResearch; Neurotrack Technologies; Novartis PharmaceuticalsCorporation; Pfizer Inc.; Piramal Imaging; Servier; TakedaPharmaceutical Company; and Transition Therapeutics. The CanadianInstitutes of Health Research is providing funds to support ADNI clinicalsites in Canada. Private sector contributions are facilitated by theFoundation for the National Institutes of Health (www.fnih.org). Thegrantee organization is the Northern California Institute for Researchand Education, and the study is coordinated by the Alzheimer’sTherapeutic Research Institute at the University of Southern California.ADNI data are disseminated by the Laboratory for Neuro Imaging at theUniversity of Southern California.
Compliance with ethical standards
Conflicts of interest Dr. McEvoy has stock options in CorTechs Labs, Inc.
Ethical approval ADNI was approved by the institutional review boardsof all participating institutions.
Informed consent Written informed consent was obtained from allADNI participants.
Open Access This article is distributed under the terms of the CreativeCommons At t r ibut ion 4 .0 In te rna t ional License (h t tp : / /creativecommons.org/licenses/by/4.0/), which permits unrestricted use,distribution, and reproduction in any medium, provided you giveappropriate credit to the original author(s) and the source, provide a linkto the Creative Commons license, and indicate if changes were made.
Publisher’s Note Springer Nature remains neutral with regard to juris-dictional claims in published maps and institutional affiliations.
References
Albert, M. S., DeKosky, S. T., Dickson, D., Dubois, B., Feldman, H. H.,Fox, N. C., ... Phelps, C. H. (2011). The diagnosis of mild cognitiveimpairment due to Alzheimer’s disease: Recommendations from thenational institute on aging-Alzheimer’s association workgroups ondiagnostic guidelines for Alzheimer’s disease. Alzheimer’s &Dementia : The Journal of the Alzheimer’s Association, 7(3), 270–279. https://doi.org/10.1016/j.jalz.2011.03.008.
Apostolova, L. G., Morra, J. H., Green, A. E., Hwang, K. S., Avedissian,C., Woo, E., .... Alzheimer’s Disease Neuroimaging Initiative.(2010). Automated 3D mapping of baseline and 12-month associa-tions between three verbal memory measures and hippocampal at-rophy in 490 ADNI subjects. NeuroImage, 51(1), 488–499. https://doi.org/10.1016/j.neuroimage.2009.12.125
Bondi, M. W., Edmonds, E. C., Jak, A. J., Clark, L. R., Delano-Wood, L.,McDonald, C. R., ... Salmon, D. P. (2014). Neuropsychologicalcriteria for mild cognitive impairment improves diagnostic preci-sion, biomarker associations, and progression rates. Journal ofAlzheimer's Disease : JAD, 42(1), 275–289. https://doi.org/10.3233/JAD-140276.
Braak, H., Thal, D. R., Ghebremedhin, E., & Del Tredici, K. (2011).Stages of the pathologic process in Alzheimer disease: age catego-ries from 1 to 100 years. Journal of Neuropathology andExperimental Neurology, 70(11), 960–969. https://doi.org/10.1097/NEN.0b013e318232a379.
Chang, Y. L., Bondi, M. W., Fennema-Notestine, C., McEvoy, L. K.,Hagler, D. J., Jr, Jacobson, M. W., ... Alzheimer’s DiseaseNeuroimaging Initiative. (2010). Brain substrates of learning andretention in mild cognitive impairment diagnosis and progressionto Alzheimer’s disease. Neuropsychologia, 48(5), 1237–1247.https://doi.org/10.1016/j.neuropsychologia.2009.12.024.
Dale, A. M., Fischl, B., & Sereno, M. I. (1999). Cortical surface-basedanalysis. I. segmentation and surface reconstruction. NeuroImage,9(2), 179–194.
Edmonds, E. C., Delano-Wood, L., Galasko, D. R., Salmon, D. P., Bondi,M. W., & Alzheimer’s Disease Neuroimaging Initiative. (2015).Subtle cognitive decline and biomarker staging in preclinicalAlzheimer’s disease. Journal of Alzheimer’s Disease : JAD, 47(1),231–242. https://doi.org/10.3233/JAD-150128.
Edmonds, E. C., Delano-Wood, L., Jak, A. J., Galasko, D. R., Salmon, D.P., Bondi, M. W., & Alzheimer’s Disease Neuroimaging Initiative.(2016). BMissed^ mild cognitive impairment: High false-negativeerror rate based on conventional diagnostic criteria. Journal ofAlzheimer’s Disease : JAD, 52(2), 685–691. https://doi.org/10.3233/JAD-150986.
Ewers, M., Walsh, C., Trojanowski, J. Q., Shaw, L. M., Petersen, R. C.,Jack, C. R., Jr, ... North American Alzheimer’s DiseaseNeuroimaging Initiative (ADNI). (2012). Prediction of conversionfrom mild cognitive impairment to Alzheimer’s disease dementiabased upon biomarkers and neuropsychological test performance.Neurobiology of Aging, 33(7), 1203–1214. https://doi.org/10.1016/j.neurobiolaging.2010.10.019.
Fischl, B., Sereno, M. I., & Dale, A. M. (1999). Cortical surface-basedanalysis. II: inflation, flattening, and a surface-based coordinate sys-tem. NeuroImage, 9(2), 195–207.
Fischl, B., Salat, D. H., Busa, E., Albert, M., Dieterich, M., Haselgrove,C., ... Dale, A. M. (2002). Whole brain segmentation: Automatedlabeling of neuroanatomical structures in the human brain. Neuron,33(3), 341–355.
Brain Imaging and Behavior
Gomar, J. J., Bobes-Bascaran, M. T., Conejero-Goldberg, C., Davies, P.,Goldberg, T. E., & Alzheimer’s Disease Neuroimaging Initiative.(2011). Utility of combinations of biomarkers, cognitive markers,and risk factors to predict conversion from mild cognitive impair-ment to Alzheimer disease in patients in the Alzheimer’s diseaseneuroimaging initiative. Archives of General Psychiatry, 68(9),961–969. https://doi.org/10.1001/archgenpsychiatry.2011.96.
Gomar, J. J., Conejero-Goldberg, C., Davies, P., Goldberg, T. E., &Alzheimer’s Disease Neuroimaging Initiative. (2014). Extensionand refinement of the predictive value of different classes of markersin ADNI: four-year follow-up data. Alzheimer’s & Dementia : TheJournal of the Alzheimer’s Association, 10(6), 704–712. https://doi.org/10.1016/j.jalz.2013.11.009.
Heaton, R. K., Miller, S. W., Taylor, M. J., & Grant, I. (2004). Revisedcomprehensive norms for an expanded halstead-reitan battery:Demographically adjusted neuropsychological norms for african-american and caucasian adults. Lutz, FL: PsychologicalAssessment Resources.
Heister, D., Brewer, J. B., Magda, S., Blennow, K., McEvoy, L. K., &Alzheimer’s Disease Neuroimaging Initiative. (2011). PredictingMCI outcome with clinically available MRI and CSF biomarkers.Neurology, 77(17), 1619–1628. https://doi.org/10.1212/WNL.0b013e3182343314.
Holland, D., Dale, A. M., & Alzheimer’s Disease NeuroimagingInitiative. (2011). Nonlinear registration of longitudinal imagesand measurement of change in regions of interest. Medical ImageAnalysis, 15(4), 489–497. https://doi.org/10.1016/j.media.2011.02.005.
Holland, D., McEvoy, L. K., Desikan, R. S., Dale, A. M., &Alzheimer ’s Disease Neuroimaging Initiative. (2012).Enrichment and stratification for predementia Alzheimer diseaseclinical trials. PLoS One, 7(10), e47739. https://doi.org/10.1371/journal.pone.0047739.
Jack, C. R., Jr, Knopman, D. S., Jagust, W. J., Shaw, L. M., Aisen, P. S.,Weiner, M. W., ... Trojanowski, J. Q. (2010). Hypothetical model ofdynamic biomarkers of the Alzheimer’s pathological cascade. TheLancet. Neurology, 9(1), 119–128. https://doi.org/10.1016/S1474-4422(09)70299-6.
Jack, C. R., Jr, Knopman, D. S., Jagust, W. J., Petersen, R. C., Weiner, M.W., Aisen, P. S., ... Trojanowski, J. Q. (2013). Tracking pathophys-iological processes in Alzheimer’s disease: An updated hypotheticalmodel of dynamic biomarkers. The Lancet. Neurology, 12(2), 207–216. https://doi.org/10.1016/S1474-4422(12)70291-0.
Jack, C. R., Jr, Bennett, D. A., Blennow, K., Carrillo, M. C., Dunn, B.,Haeberlein, S. B., ... Contributors. (2018). NIA-AA research frame-work: Toward a biological definition of Alzheimer’s disease.Alzheimer’s & Dementia : The Journal of the Alzheimer’sAssociation, 14(4), 535–562.
Jak, A. J., Bondi, M. W., Delano-Wood, L., Wierenga, C., Corey-Bloom, J., Salmon, D. P., & Delis, D. C. (2009). Quantificationof five neuropsychological approaches to defining mild cogni-tive impairment. The American Journal of Geriatric Psychiatry :Official Journal of the American Association for GeriatricPsychiatry, 17(5), 368–375. https://doi.org/10.1097/JGP.0b013e31819431d5.
Jedynak, B. M., Lang, A., Liu, B., Katz, E., Zhang, Y., Wyman, B. T., ...Alzheimer’s Disease Neuroimaging Initiative. (2012). A computa-tional neurodegenerative disease progression score: Method and re-sults with the Alzheimer’s disease neuroimaging initiative cohort.NeuroImage, 63(3), 1478–1486. https://doi.org/10.1016/j.neuroimage.2012.07.059.
Jedynak, B. M., Liu, B., Lang, A., Gel, Y., Prince, J. L., & Alzheimer’sDisease Neuroimaging Initiative. (2015). A computational methodfor computing an Alzheimer’s disease progression score; experi-ments and validation with the ADNI data set. Neurobiology of
Aging, 36(Suppl 1), S178–S184. https://doi.org/10.1016/j.neurobiolaging.2014.03.043.
Kremen, W. S., Panizzon, M. S., Franz, C. E., Spoon, K. M., Vuoksimaa,E., Jacobson, K. C., ... Lyons, M. J. (2014a). Genetic complexity ofepisodic memory: A twin approach to studies of aging. Psychologyand Aging, 29(2), 404–417. https://doi.org/10.1037/a0035962.
Kremen, W. S., Jak, A. J., Panizzon, M. S., Spoon, K. M., Franz, C. E.,Thompson, W. K., ... Lyons, M. J. (2014b). Early identificationand heritability of mild cognitive impairment. InternationalJournal of Epidemiology, 43(2), 600–610. https://doi.org/10.1093/ije/dyt242.
Landau, S.M., Harvey, D., Madison, C.M., Reiman, E. M., Foster, N. L.,Aisen, P. S., ... Alzheimer’s Disease Neuroimaging Initiative.(2010). Comparing predictors of conversion and decline in mildcognitive impairment. Neurology, 75(3), 230–238. https://doi.org/10.1212/WNL.0b013e3181e8e8b8.
Langa, K.M., & Levine, D. A. (2014). The diagnosis and management ofmild cognitive impairment: a clinical review. Jama, 312(23), 2551–2561. https://doi.org/10.1001/jama.2014.13806.
Moradi, E., Hallikainen, I., Hanninen, T., Tohka, J., & Alzheimer’sDisease Neuroimaging Initiative. (2016). Rey’s auditory verballearning test scores can be predicted from whole brain MRI inAlzheimer’s disease. NeuroImage. Clinical, 13, 415–427. https://doi.org/10.1016/j.nicl.2016.12.011.
Mueller, S. G., Weiner, M. W., Thal, L. J., Petersen, R. C., Jack, C. R.,Jagust, W., ... Beckett, L. (2005). Ways toward an early diagnosis inAlzheimer’s disease: the Alzheimer’s disease neuroimaging initia-tive (ADNI). Alzheimer’s & Dementia : The Journal of theAlzheimer’s Association, 1(1), 55–66. https://doi.org/10.1016/j.jalz.2005.06.003.
Oltra-Cucarella, J., Sanchez-SanSegundo, M., Lipnicki, D. M., Sachdev,P. S., Crawford, J. D., Perez-Vicente, J. A., ... Alzheimer’s DiseaseNeuroimaging Initiative. (2018). Using base rate of low scores toidentify progression from amnestic mild cognitive impairment toAlzheimer’s disease. Journal of the American Geriatrics Society,66(7), 1360–1366. https://doi.org/10.1111/jgs.15412.
Palmer, B. W., Boone, K. B., Lesser, I. M., & Wohl, M. A. (1998). Baserates of Bimpaired^ neuropsychological test performance amonghealthy older adults. Archives of Clinical Neuropsychology : TheOfficial Journal of the National Academy of Neuropsychologists,13(6), 503–511.
Panizzon, M. S., Lyons, M. J., Jacobson, K. C., Franz, C. E., Grant, M.D., Eisen, S. A., ... Kremen, W. S. (2011). Genetic architecture oflearning and delayed recall: a twin study of episodic memory.Neuropsychology, 25(4), 488–498. https://doi.org/10.1037/a0022569.
Papassotiropoulos, A., & de Quervain, D. J. (2011). Genetics of humanepisodic memory: dealing with complexity. Trends in CognitiveSciences, 15(9), 381–387. https://doi.org/10.1016/j.tics.2011.07.005.
Petersen, R. C., Aisen, P. S., Beckett, L. A., Donohue, M. C., Gamst, A.C., Harvey, D. J., ... Weiner, M. W. (2010). Alzheimer’s diseaseneuroimaging initiative (ADNI): Clinical characterization.Neurology, 74(3), 201–209. https://doi.org/10.1212/WNL.0b013e3181cb3e25.
Ryan, C. L., & Bauman, K. (2016). Educational attainment in the unitedstates: 2015. (Population characteristics. Current populationReports. No. P20–578).U.S. Department of Commerce,Economics and Statistics Administration, United States CensusBureau.
Shaw, L. M. (2008). PENN biomarker core of the Alzheimer’s diseaseneuroimaging initiative. Neuro-Signals, 16(1), 19–23.
Shaw, L. M., Vanderstichele, H., Knapik-Czajka, M., Clark, C. M.,Aisen, P. S. , Petersen, R. C., . . . Alzheimer ’s DiseaseNeuroimaging Initiative. (2009). Cerebrospinal fluid biomarkersignature in Alzheimer’s disease neuroimaging initiative
Brain Imaging and Behavior

subjects. Annals of Neurology, 65(4), 403–413. https://doi.org/10.1002/ana.21610.
Sperling, R. A., Aisen, P. S., Beckett, L. A., Bennett, D. A., Craft, S.,Fagan, A. M., ... Phelps, C. H. (2011). Toward defining the preclin-ical stages of Alzheimer’s disease: recommendations from the na-tional institute on aging-Alzheimer’s association workgroups on di-agnostic guidelines for Alzheimer’s disease. Alzheimer’s &Dementia : The Journal of the Alzheimer’s Association, 7(3), 280–292. https://doi.org/10.1016/j.jalz.2011.03.003.
Steinberg, B. A., Bieliauskas, L. A., Smith, G. E., Ivnik, R. J., &Malec, J.F. (2005). Mayo’s older americans normative studies: Age- and IQ-
adjusted norms for the auditory verbal learning test and the visualspatial learning test. The Clinical Neuropsychologist, 19(3–4), 464–523.
Zetterberg, H. (2017). Review: Tau in biofluids - relation to pathology,imaging and clinical features. Neuropathology and AppliedNeurobiology, 43, 194–199. https://doi.org/10.1111/nan.12378.
Zwan, M. D., Rinne, J. O., Hasselbalch, S. G., Nordberg, A., Lleo, A.,Herukka, S. K., ... Visser, P. J. (2016). Use of amyloid-PET to de-termine cutpoints for CSF markers: A multicenter study. Neurology,86(1), 50–58. https://doi.org/10.1212/WNL.0000000000002081.
Brain Imaging and Behavior