Embed Size (px)
Citation preview
Modulation of gold nanoparticle surface chemistry
to target glioblastoma cells for SERS based imaging
Inauguraldissertation
zur
Erlangung der Würde eines Doktors der Philosophie
vorgelegt der
Philosophisch-Naturwissenschaftlichen Fakultät
der Universität Basel
von
Floriana Burgio
von Italien
Basel, 2020
Originaldokument gespeichert auf dem Dokumentenserver der Universität Basel
https://edoc.unibas.ch

2
Genehmigt von der Philosophisch-Naturwissenschaftlichen Fakultät auf Antrag Von
Prof. Dr. Uwe Pieles
Prof. Dr. Jörg Huwyler
Basel, den 19. November 2019
Prof. Dr. Martin Spiess Dekan

3
4
Abstract
Surgery is the mainstay treatment of brain tumors, however complete resection
is rarely achieved, especially when dealing with grade IV glioblastoma (GBM). GBM is
the most lethal brain tumor worldwide with an average survival not longer than 15
months. A reason of this dismal outcome is the lack of intraoperative visualization
techniques for the objective identification of true tumor borders and infiltrating tumor
cells. Hence, the improvement of GBM visualization during surgical operation is the
motivation of this project.
Recent developments of handheld fiber optic probes and lasers for low cost systems,
together with sensitivity enhancement techniques such as surface enhanced Raman
scattering (SERS), have ruled Raman spectroscopy as one of the most promising
technologies for surgical guidance. This technique could overcome the limitations of
current intraoperative modalities such as neuronavigation, magnetic resonance imaging
and fluorescence guided surgery. For increased sensitivity, metallic nanostructures are
preferred because they strongly interact with light, due to surface plasmon resonance
(SPR), and produce a much higher level of amplification compared to flat surfaces.
Among the nanostructures, gold nanoparticles (GNPs) have found wide application in
SERS based imaging studies for their higher biocompatibility and versatile
functionalization. When properly engineered, visualization can be targeted on tumor-
specific biomolecules providing an accurate mapping of tumor spread. For optimized
intraoperative visualization of GBM, detection can be tuned to the near-infrared (NIR)
window by acting both on the size and shape of GNPs. This enables to overcome the
interfering autofluorescence and to reach a deeper tissue penetration. However,
surface chemistry becomes essential to create SERS tags for a fast, sensitive and specific
detection of tumor cells.
Due to the absence of comprehensive studies on the impact of GNPs surface
functionalization on SERS based imaging, this thesis elucidates the effect of Raman
5
reporter, inert protective polyethylene glycol (PEG) and anti-epidermal growth factor
receptor (EGFR) antibody on colloidal stability, cellular binding specificity, detection
sensitivity and speed. EGFR was the target of choice because its gene amplification is
the most common molecular hallmark in about 60% of GBM and protein overexpression
on cell cytoplasmic membrane makes it easily accessible.
Based on the findings, GNPs with dense surface coverage of Raman reporter or
PEG produced the maximum imaging sensitivity and binding specificity, respectively.
However, GNPs with dense Raman reporter surface coverage were liable to non-specific
binding and colloidal aggregation. Conversely, GNPs with dense PEG surface coverage
owned the highest stability but underwent more than 90% reduction of SERS sensitivity.
Higher integration time (from 0.05 to 0.5 sec) or shorter working distance (from 16.5 to
0.3 mm) to counteract the decreased SERS sensitivity were not considered in view of
the final application in vivo. GNPs with surface coverage made of 50% Raman reporter
and 50% PEG owned the optimal mixture for an immediate Raman detection of in vitro
human GBM cells (LN229wtEGFR, BS153 and U87MG) while minimizing non-specific
binding on EGFR-negative cells (IMA2.1). Further, SERS signal was comparable
independently on the different EGFR expression level or the presence of EGFRvIII in
BS153. The latter is the constitutively active receptor whose presence is associated to
the lack of response during fluorescence based visualization of GBM. It was also shown
that excess of Raman reporter did not add any significant contribution to SERS
sensitivity. Similarly, the conjugation efficiency decreased by 35% through the addition
of 10 times the concentration of antibody, compared to the lower concentration. This
excess quantity of antibody showed no improvement of binding affinity of GNPs to
tumor cells.
Because the blood brain barrier (BBB) limits the therapeutic access to brain tumor, the
ability of GNPs to cross an in vitro BBB made of a monoculture of human endothelial
cells (hCMEC/D3) is crucial for successful intraoperative visualization. About 0.1% of
GNPs, with specific ratio of immobilized functionalities, was able to cross the cell
monolayer preserving its integrity and eliciting no cytotoxic effects. Similar results were
obtained in vivo.
By providing an in-depth investigation, this work stresses the significance of
identifying the appropriate surface chemistry to improve the biomedical potential of
6
GNPs in SERS based imaging applications. At the same time, it provides an in vitro
demonstration that SERS based imaging can be implemented intraoperatively for
immediate visualization of GBM offering an adequate alternative for the detection of
those GBM or low-grade brain tumors that show variable or no response to fluorescence
guided surgery, the current state-of-art for GBM intraoperative visualization.

7
8
Table of contents 1. Introduction 11
1.1 Intraoperative glioblastoma guidance technologies 11 1.2 Raman spectroscopy 18 1.2.1 Evolution of Raman spectroscopy 19 1.2.2 Surface enhanced Raman spectroscopy 20 1.2.2.1 Localized surface plasmon resonance 20 1.2.2.2 Substrates for SERS 21 1.2.2.3 Intrinsic and extrinsic detection methods 21 1.2.2.4 Influence of chemico-physical properties of nanoparticles on SERS 22 1.2.2.5 Chemico-physical properties of nanoparticles for SERS based imaging of
glioblastoma 23
1.2.2.6 Passive and active targeting of glioblastoma 24 1.3 Glioblastoma 26 1.3.1 Etiology, incidence and prognosis 27 1.3.2 Unique challenging features 27 1.3.3 Aberrations of epidermal growth factor receptor 28 1.3.4 Diagnosis 29 1.3.5 Treatment 30 1.4 The blood brain barrier 33 1.4.1 Strategies for overcoming the impermeability of the BBB 34 1.4.2 In vitro models of the BBB 35
2. Motivation and aims of the thesis 38
3. Results 41
3.1 SERS tags preparation and characterization 41 3.1.1 Raman reporter coupling for SERS 42 3.1.1.1 SERS signal enhancement 43 3.1.1.2 Influence of Raman reporter surface coverage on SERS intensity 44 3.1.2 PEGylation for improved stability and biocompatibility 44 3.1.3 Anti-EGFR mediated active targeting 45 3.1.4 Anti-EGFR GNPs bio-functionality and stability in cell culture medium 46 3.2 In vitro cancer cell targeting by anti-EGFR GNPs 48 3.2.1 Cellular EGFR expression 48 3.2.2 Cellular viability response to GNPs 49 3.2.3 SERS based imaging of GBM cells 49 3.2.3.1 Time-dependent binding of anti-EGFR GNPs on EGFR-positive GBM cells 50 3.2.3.2 Time-dependent uptake and localization of anti-EGFR GNPs on EGFR-positive
GBM cells 51
3.2.3.3 Influence of cellular EGFR expression level on anti-EGFR GNPs binding 52 3.2.4 Drawbacks of Raman reporter monolayer surface coverage 53 3.2.4.1 Modulation of surface charge of GNPs for minimizing non-specific binding 56 3.2.4.2 Effect of PEG coating on non-specific binding and SERS sensitivity 57 3.3 In vitro studies of GNPs transit through the BBB 61 3.3.1 Characterization of the BBB model 61 3.3.2 Transport of GNPs across the BBB 62
9
4. Discussion 65
4.1 Raman reporter to enhance SERS signal 65 4.2 Inert coating to prevent non-specific adsorption 66 4.3 Antibody concentration for improved active binding 68 4.4 Crossing the BBB 71
5. Conclusions and outlooks 73
6. Materials and methods 76
6.1 Nanoparticles functionalization 76 6.1.1 Nanoparticles characterization 77 6.1.2 Quantification of the number of antibodies per nanoparticle 78 6.1.3 Nanoparticles optical stability in cell culture medium 78 6.1.4 Immuno dot blot 78 6.2 Cell culture 79 6.2.1 Fluorescence staining 79 6.2.2 Western blot 79 6.2.3 Quantitative expression of EGFR at the cell membrane 80 6.2.4 GNPs cytotoxicity 81 6.3 In vitro cancer cell targeting 81 6.4 In vitro BBB model 83 6.4.1 Fluorescence staining of TJs 83 6.4.2 TEER measurement 84 6.4.3 BBB permeability assay 84 6.4.4 Permeation of GNPs through the BBB 84 6.5 Statistical analysis 85
References 87 List of abbreviations 98 Acknowledgments 102 Curriculum vitae 105

10
11
1. Introduction
Up to today, surgery represents the state-of-art treatment in cancer
management [1], [2]. It aims at removing entirely the tumor or, if it is not feasible, at
reducing its size (debulking tumor) in order to relieve the most severe symptoms and to
make subsequent therapies more effective [3]. Complete resection works best for solid
tumors limited in a restricted area [4]. In these cases, surgeons are able to remove the
solid mass together with a rim of normal tissue around it to make sure that the complete
cancer has been excised. However, resection of safety margins is not viable when
surgeons deal with tumors located in a sensitive area such as brain where unnecessary
removal of normal tissue can lead to impairment of neurological functions and quality
of life. Furthermore, a sharp delineation between tumor and healthy brain tissue would
facilitate a more complete tumor resection but remains an unmet challenge in high-
grade brain tumors as GBM. In fact, GBM has blurred tumor borders due to highly
infiltrative tumor cells that invade the surrounding parenchyma hindering the possibility
to remove them entirely. Investigation of brain tumor recurrences has consistently
shown that 80-90% of these occurs within the original treatment field, identifying as the
cause the residual tumor cells due to incomplete resection [5]. Beside subjective
assessments such as texture palpation or visual inspection, neurosurgeons can rely on
the use of a variety of intraoperative guidance technologies as discussed in the following
section.
1.1 Intraoperative glioblastoma guidance technologies
For tailored surgical approach, the state-of-art methods are listed stressing the ‘pros’
and ‘cons’ of each.
Neuronavigation is a computational process that combines pre and

12
intraoperative data creating a translation map between imaging displayed on the screen
and real spatial position [6]. Major limitation is the positional accuracy of only 2-3 mm
because of intraoperative brain shift due to cerebrospinal fluid loss, decompression and
parenchyma displacement [7], [8].
Intraoperative magnetic resonance imaging (iMRI) is based on the same principle
as MRI, and either a specific in situ donut MRI scanner or a parallel stationary MRI
scanner in an adjacent diagnostic room are used [6], [7]. iMRI gives accurate real-time
information to be used for further planning optimization and assessment of the progress
of the surgery [7]. Senft et al. showed its effectiveness: 96% of patients had complete
tumor resection compared to 68% in the control group. Although iMRI value is
undisputed, its use is limited due to additional operating time (average of 1 h more is
required), equipment size and associated costs (5-8 million USD for the installation) [9].
Additional, low magnetic field strength neglects invasive cancer cells and repeated
injections or dosages of gadolinium are necessary due to short blood half-life [6], [7],
[10].
Intraoperative ultrasonography (iUS) is helpful when the tumor is not isoechoic
with the brain or the density difference is greater [11]. Freehand movement of a US
probe allows for acquisition of image volume in three dimensions (3D) at any time
during surgery [6], [7]. Erdogan et al. reported 87% of agreement between iUS and post-
operative contrast enhanced MRI in detecting tumor residue in a prospective study of
32 patients [12]. iUS is cheap and easily repeatable but acquisition is operator
dependent, interpretation of the images requires training and experience and deep
tumors cannot be identified due to low resolution [6], [7].
Intraoperative functional mapping and monitoring are essential for safe excision
of GBM when it is near to eloquent brain areas such as somatosensory, motor and
language cortex with minimal risks for neurological deficits. While motor mapping can
be performed in asleep or awake patients, for language mapping awake surgery is
needed [13]. Using these functional methods, resection can be extended to the
functional borders placed in the peritumoral tissue invaded by the tumor cells beyond

13
the anatomical borders [11].
Intraoperative tissue fluorescence has the power to provide real-time
information with no interference of brain shift while being still affordable. It demands
microscopes equipped with appropriate filters to detect fluorescent light emission of
specific agents. Fluorescence can be induced by: i) metabolic activity; ii) passive
permeability; iii) targeted probes; iv) and autofluorescence [14].
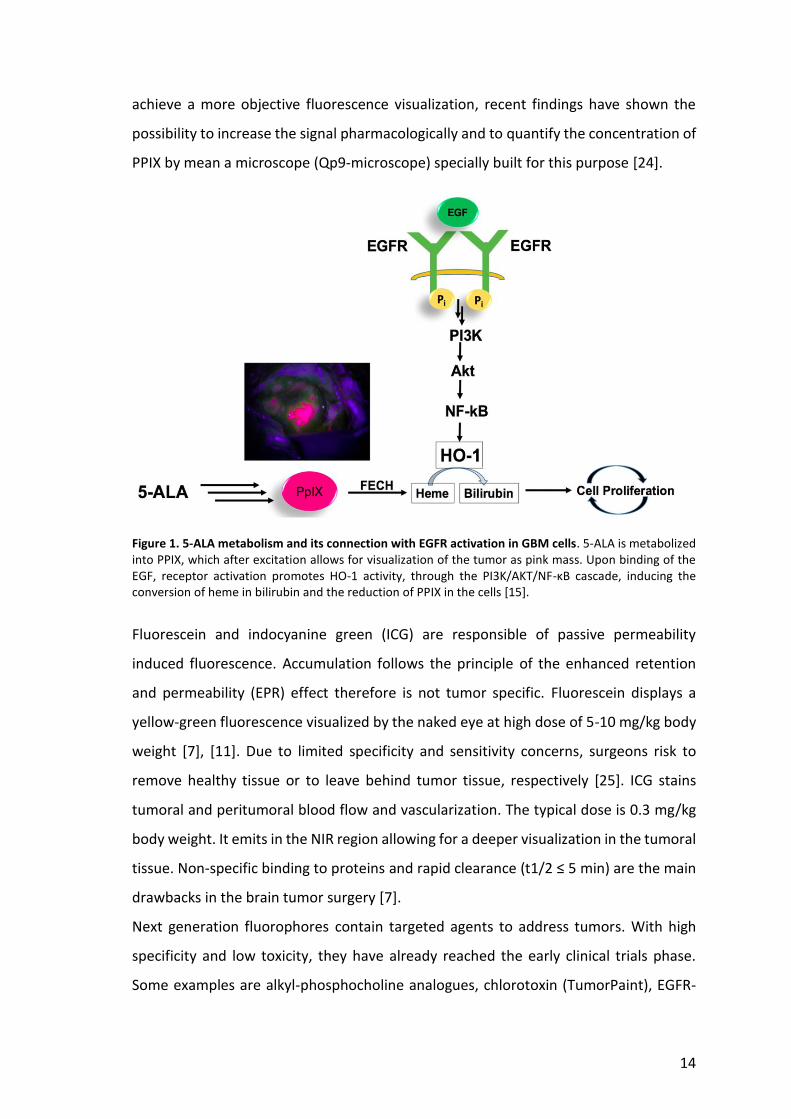
5-aminolevulinic acid (5-ALA) as a fluorescent pro-agent represents the state-of-art for
fluorescence guided surgery of GBM. It was approved in Europe in 2007 while in US in
2017, and it is now used in over 40 countries [7]. 5-ALA is an endogenous metabolite
converted to fluorescent protoporphyrin IX (PPIX), which chelates with iron in presence
of enzyme ferrochelatase (FECH) to produce heme. Heme is then converted into
bilirubin by heme oxygenase-1 (HO-1) [15]. In most of GBM cells, FECH enzyme is
missing or has reduced activity resulting in the accumulation of PPIX into the tumor
tissue. When excited with blue-violet light, PPIX emits a red fluorescence allowing for
differentiation between tumor and healthy cells. 5-ALA derived fluorescence has been
shown to be more sensitive compared to preoperative MRI contrast enhancement and
positron emission tomography (PET) [16], [17]. Higher sensitivity enabled surgeons to
achieve a double rate of complete resection and 6 months progression-free survival
rates than patients who underwent conventional microsurgery under white light.
Typically, 5-ALA is administered orally to the patients 4 h before the operation at a dose
of 20 mg/kg body weight [18]. Nonetheless, this methodology faces several hurdles: i)
low-grade gliomas do not respond to the administration; ii) fluorescence is not
homogeneous in the periphery of the tumor and depends on the cell density; iii) false
positive cases have been reported due to the presence of reactive astrocytes and
macrophages [14], [19]–[22]; iv) sensitivity to prolonged exposure of light decreases the
contrast; v) and penetration depth achieved with blue light is shallow [23]. Conversely,
GBM cells do not show fluorescence depending on the EGFR activation and the presence
of its constitutively active variant, EGFRvIII. Indeed, receptor activation has a
downstream effect on HO-1, whose activity results in accelerated heme depletion with
consequent shift of enzymatic activity in favor of increased PPIX metabolism by FECH
(Figure 1) [15]. In attempt to reduce fluorescence variability in GBM cell lines and to
14
achieve a more objective fluorescence visualization, recent findings have shown the
possibility to increase the signal pharmacologically and to quantify the concentration of
PPIX by mean a microscope (Qp9-microscope) specially built for this purpose [24].
Figure 1. 5-ALA metabolism and its connection with EGFR activation in GBM cells. 5-ALA is metabolized into PPIX, which after excitation allows for visualization of the tumor as pink mass. Upon binding of the EGF, receptor activation promotes HO-1 activity, through the PI3K/AKT/NF-κB cascade, inducing the conversion of heme in bilirubin and the reduction of PPIX in the cells [15].
Fluorescein and indocyanine green (ICG) are responsible of passive permeability
induced fluorescence. Accumulation follows the principle of the enhanced retention
and permeability (EPR) effect therefore is not tumor specific. Fluorescein displays a
yellow-green fluorescence visualized by the naked eye at high dose of 5-10 mg/kg body
weight [7], [11]. Due to limited specificity and sensitivity concerns, surgeons risk to
remove healthy tissue or to leave behind tumor tissue, respectively [25]. ICG stains
tumoral and peritumoral blood flow and vascularization. The typical dose is 0.3 mg/kg
body weight. It emits in the NIR region allowing for a deeper visualization in the tumoral
tissue. Non-specific binding to proteins and rapid clearance (t1/2 ≤ 5 min) are the main
drawbacks in the brain tumor surgery [7].
Next generation fluorophores contain targeted agents to address tumors. With high
specificity and low toxicity, they have already reached the early clinical trials phase.
Some examples are alkyl-phosphocholine analogues, chlorotoxin (TumorPaint), EGFR-
15
targeted or αvβ3 integrin-targeted agents and phospholipids nanoparticles. All of them
are usually conjugated to NIR fluorophores [14].
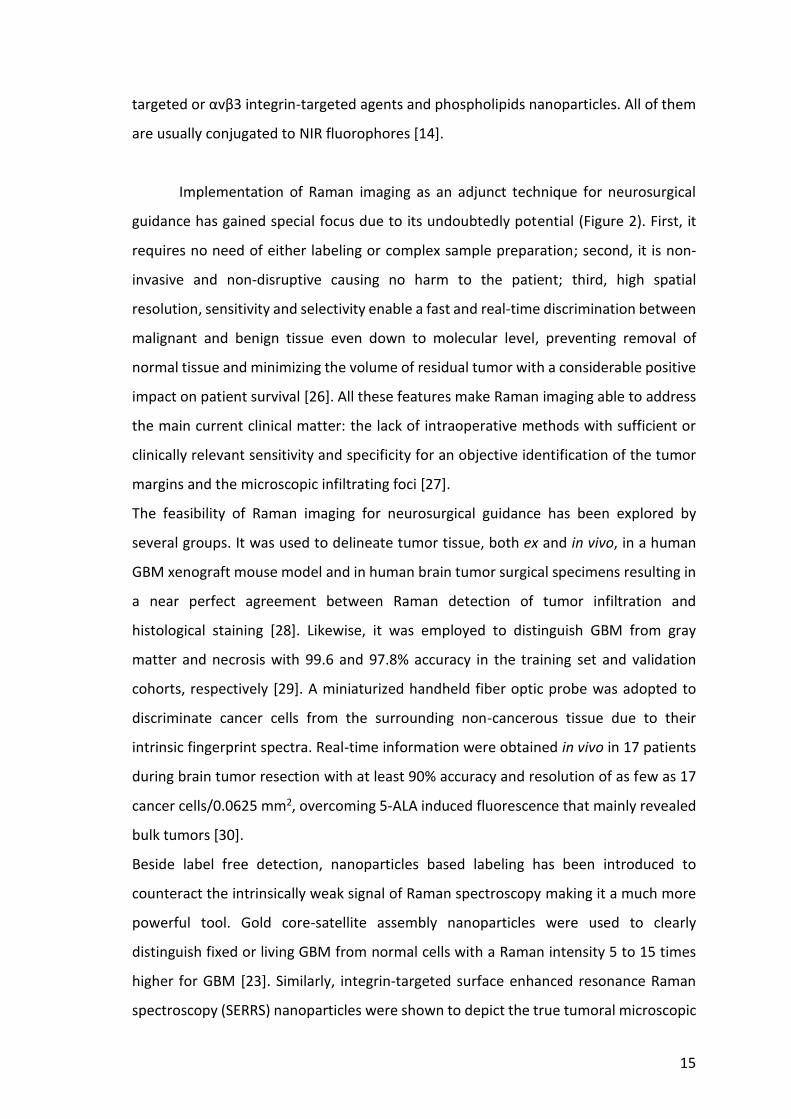
Implementation of Raman imaging as an adjunct technique for neurosurgical
guidance has gained special focus due to its undoubtedly potential (Figure 2). First, it
requires no need of either labeling or complex sample preparation; second, it is non-
invasive and non-disruptive causing no harm to the patient; third, high spatial
resolution, sensitivity and selectivity enable a fast and real-time discrimination between
malignant and benign tissue even down to molecular level, preventing removal of
normal tissue and minimizing the volume of residual tumor with a considerable positive
impact on patient survival [26]. All these features make Raman imaging able to address
the main current clinical matter: the lack of intraoperative methods with sufficient or
clinically relevant sensitivity and specificity for an objective identification of the tumor
margins and the microscopic infiltrating foci [27].
The feasibility of Raman imaging for neurosurgical guidance has been explored by
several groups. It was used to delineate tumor tissue, both ex and in vivo, in a human
GBM xenograft mouse model and in human brain tumor surgical specimens resulting in
a near perfect agreement between Raman detection of tumor infiltration and
histological staining [28]. Likewise, it was employed to distinguish GBM from gray
matter and necrosis with 99.6 and 97.8% accuracy in the training set and validation
cohorts, respectively [29]. A miniaturized handheld fiber optic probe was adopted to
discriminate cancer cells from the surrounding non-cancerous tissue due to their
intrinsic fingerprint spectra. Real-time information were obtained in vivo in 17 patients
during brain tumor resection with at least 90% accuracy and resolution of as few as 17
cancer cells/0.0625 mm2, overcoming 5-ALA induced fluorescence that mainly revealed
bulk tumors [30].
Beside label free detection, nanoparticles based labeling has been introduced to
counteract the intrinsically weak signal of Raman spectroscopy making it a much more
powerful tool. Gold core-satellite assembly nanoparticles were used to clearly
distinguish fixed or living GBM from normal cells with a Raman intensity 5 to 15 times
higher for GBM [23]. Similarly, integrin-targeted surface enhanced resonance Raman
spectroscopy (SERRS) nanoparticles were shown to depict the true tumoral microscopic
16
extent in vivo in a GBM mouse model with a detection sensitivity in the femtomolar
range [31]. The handheld fiber optic probe described above was adopted in conjugation
with silica SERS nanoparticles in a GBM mouse model reducing the acquisition time from
10-20 to 0.1 s. Furthermore, SERS nanoparticles suffer from negligible loss in signal over
time. Compared to the instrumentation commonly present in the operation room, the
handheld scanner has the advantage of being easy to handle and flexible allowing to
investigate the tumor resection bed from any directions [5].
In attempt to improve surgical outcomes, multimodal brain imaging has been assumed.
Triple-modality nanoparticles were designed to combine MRI, photoacoustic and
Raman imaging and the key factors of each of these techniques: localization of brain
tumor and delineation of its margins before and during the operation using MRI; high
spatial resolution and 3D imaging using photoacoustic; high-sensitivity, specificity and
surface resolution of tumor margins using Raman [10]. pH-responsive nanoparticles
were designed for guiding brain tumor visualization and resection by sensing acidic
tumor microenvironments via simultaneous activation of MRI and SERRS. The acidic
environment, typical of solid tumor, promoted nanoparticles self-assembly while those
diffusing in the normal brain, at neutral pH environment, were washed away. Since
extracellular acidification is a hallmark of all solid tumors, this strategy does not depend
on tumor genotypes or phenotypes [32].
Figure 2. Schematic representation of Raman guided surgery. A) The main tumor mass is resected (black shadow). B) Raman fingerprint spectrum allows to identify and to remove residual cancer cells and infiltrating foci on the edges and beyond the resection cavity. C) Complete removal of tumor mass is achieved.
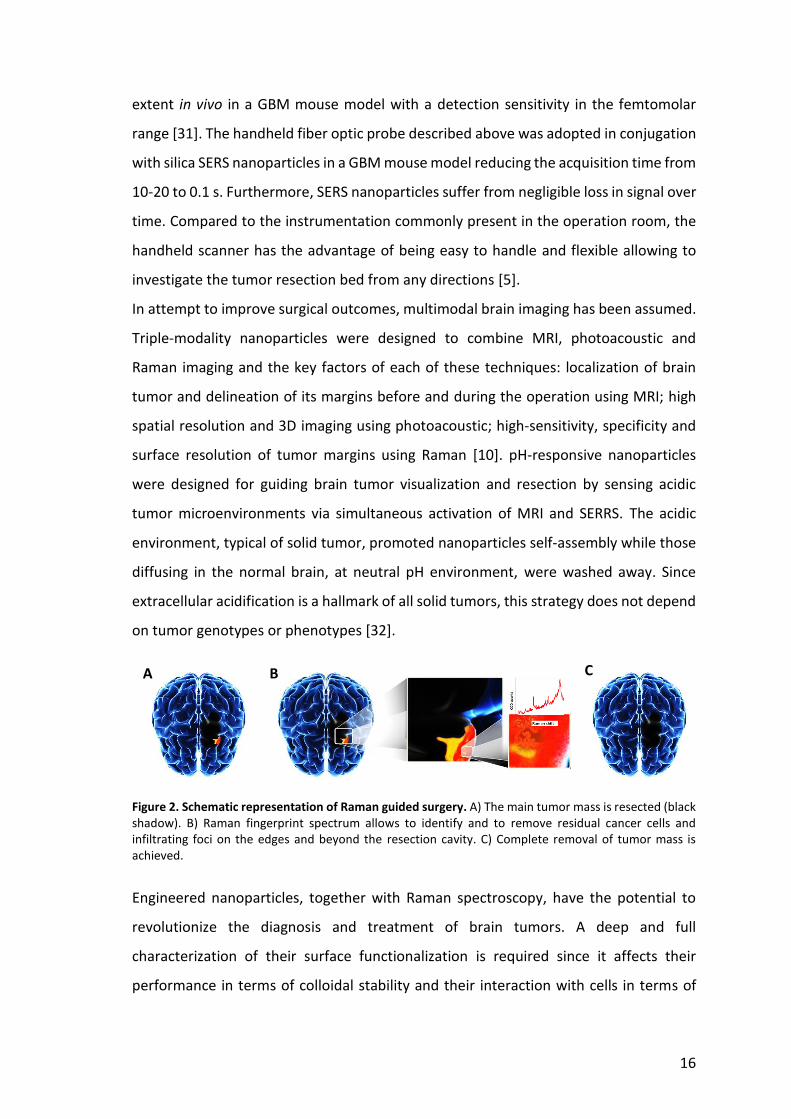
Engineered nanoparticles, together with Raman spectroscopy, have the potential to
revolutionize the diagnosis and treatment of brain tumors. A deep and full
characterization of their surface functionalization is required since it affects their
performance in terms of colloidal stability and their interaction with cells in terms of
A B C
17
sedimentation, dissolution, formation of a protein corona and binding specificity. The
most common approach to functionalize nanoparticles as SERS tags is illustrated in
figure 3.
Figure 3. Schematic structure of a SERS tag. The Raman reporter molecules encase the nanoparticle. A protective shell made of a polymer increases the stability and provides the surface to attach the antibodies.
A nanoparticle is surrounded by a layer of Raman reporter (a Raman active molecule),
followed by a protective shell. To target specifically SERS tags to tumor, antibodies or
other affinities ligands are used [33].
Non-specific binding can represent a bottleneck in improving detection sensitivity and
tagging specificity. Nanoparticles tend to be “sticky” and to bind non-specifically to the
cellular membrane causing high levels of background that degrades the signal-to-noise
ratio and produces false positives [26], [34], [35]. This effect highlights the importance
of controlling surface modification to find an optimum balance between inert and
receptor specific active functionalities in order to achieve maximum SERS intensity and
minimize nanoparticle non-specific interactions [35].
In this thesis, SERS based imaging is the technique that has been investigated for
improved intraoperative visualization of GBM cells. Hence, elucidation of the optical
methodology behind this technique as well as of its evolution over the time is reported
in the upcoming section.
Nanoparticle Raman reporter Antibody Protecting shell

18
1.2 Raman spectroscopy
Raman spectroscopy is an optical methodology measuring the frequency shift of the
inelastic scattering of light. When a monochromatic laser beam hits the molecule,
energy is exchanged between intramolecular vibrations bonds and photons producing
a change in the bond's vibrational state. Most of the scattered photons has unaltered
energy (elastic or Rayleigh scattering). Minor part of scattered photons experiences a
change of energy (inelastic or Raman scattering). Gain of energy is termed anti-Stokes,
whereas loss of energy is termed Stokes (Figure 4) [36].
Figure 4. Jablonski diagram representing quantum energy transitions for Rayleigh and Raman scattering. After interaction with the incident photon, the molecule is excited to a virtual energy state. If the energy of the emitted photon, when the molecule relaxes to a lower energy level, is equal to that of the incident photon, the process is elastic and it is known as Rayleigh scattering. If the energy is lower or higher, the process is inelastic and it is known as Stokes or Anti-Stokes scattering, respectively [37].
This change in the photon's energy is known as ‘Raman shift’. Collision of photons with
different biochemical bonds within the tissue generates several Raman shifts, which
taken together generate the ‘Raman spectrum’. The Raman spectrum gives fingerprint
information that resolve the molecular composition in cells or tissues providing a truly
objective picture of the pathology. The intensity of Raman scattering is proportional to
the magnitude of the change in the molecular polarization where polarizability results
from the displacement of the electrons from the equilibrium position as a consequence
of the molecular vibrations [36]. However, the weakness of spontaneous Raman
scattering (for every 1-10 million photons bombarding a sample, only one will result in

19
Raman scattering) has hindered the spread of Raman spectroscopy until advanced
instrumentation and enhancement Raman techniques have been discovered (Figure 5).
Figure 5. Evolution of Raman spectroscopy. Raman spectroscopy timeline from its discovery to the most recent advanced techniques [38].
1.2.1 Evolution of Raman spectroscopy
In resonance Raman scattering (RRS) the excitation wavelength is chosen to
overlap with (or be very close to) an electronic transition. This typically means in an area
of ultraviolet-visible (UV-Vis) absorption. Such overlap boosts the scattering efficiency
by factors of 102-106. However, since the excitation falls in the UV-Vis region,
fluorescence background represents a substantial problem [39].
Coherent anti-Stokes Raman scattering (CARS) uses three laser fields instead of
the traditional single laser. They are a pump field at frequency of ωp, a Stokes field at ωS
and a probe field at ωpr. When the energy difference of the pump and Stokes beams
(ωp−ωS) equals the frequency of a molecular vibration mode (Ω), the Raman resonance
occurs. This resonance is then probed by the third field at ωpr generating an anti-Stokes
field at (ωp−ωS+ωpr) [40]. The Raman active mode of interest is the only extremely strong
peak in the Raman spectrum providing a speed advantage over spontaneous Raman.
Like CARS, stimulated Raman scattering (SRS) is based on two incident photons
but produces a signal at the same frequency than the excitation wavelength. Thus, SRS
offers a linear dependence on concentration and shows identical spectra to
spontaneous Raman with no interference complications from the non-resonance
background like in CARS [41].
20
Tip enhanced Raman spectroscopy (TERS) combines the spatial resolution of
atomic force microscopy with the chemical information of Raman spectroscopy. An
excitation laser beam is pointed on the apex of a metallic coated tip creating a confined
and enhanced electromagnetic field. Sample, positioned at nanometer distance from
the tip, experiences this enhancement leading to an increased Raman scattering [41].
Surface enhanced hyper Raman scattering (SEHRS) is the two-photon excited
analogue of SERS (see next paragraph). SEHRS allows to acquire complementary
spectroscopic information for improved understanding of molecule–nanostructure
interactions and to probe molecules at lower concentrations due to higher sensitivity
[42].
SERS is a surface sensitive technique that results in the enhancement of Raman
scattering when molecule is absorbed on a metal surface allowing for its highly sensitive
structural detection at low concentrations [41]. Given the importance of this technique
in this work, the concepts judged important for a clear understanding are emphasized
below.
1.2.2 Surface enhanced Raman spectroscopy
1.2.2.1 Localized surface plasmon resonance
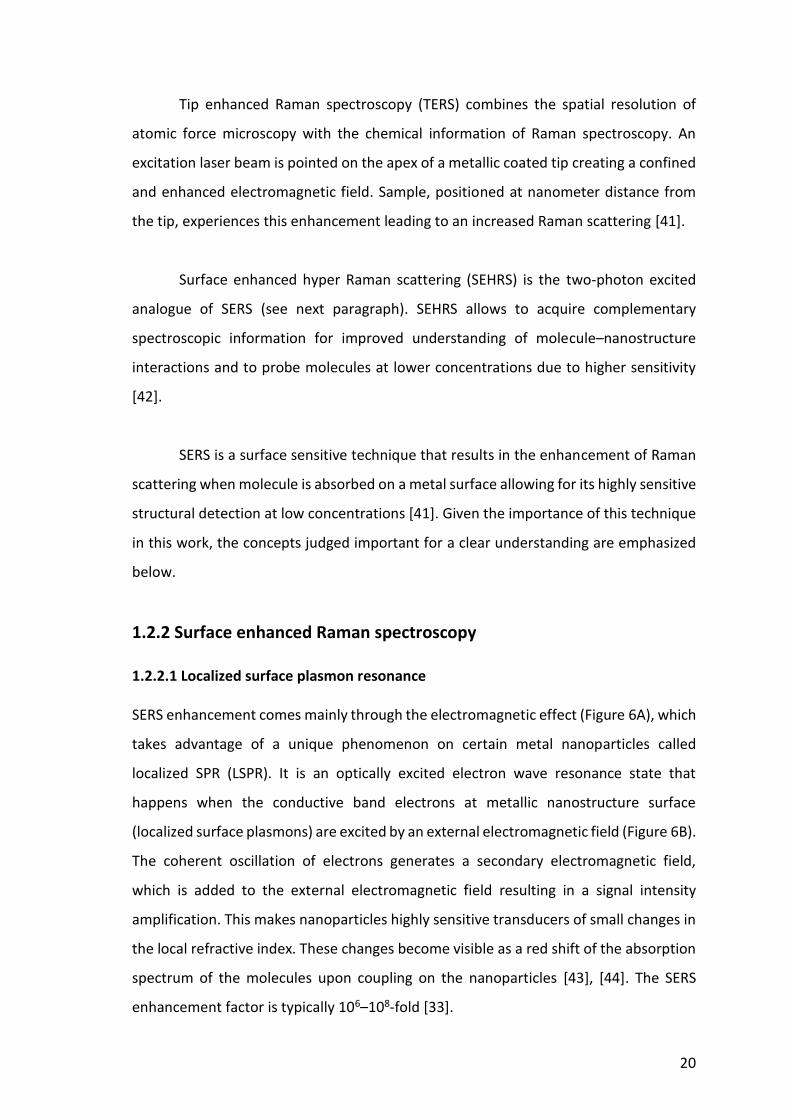
SERS enhancement comes mainly through the electromagnetic effect (Figure 6A), which
takes advantage of a unique phenomenon on certain metal nanoparticles called
localized SPR (LSPR). It is an optically excited electron wave resonance state that
happens when the conductive band electrons at metallic nanostructure surface
(localized surface plasmons) are excited by an external electromagnetic field (Figure 6B).
The coherent oscillation of electrons generates a secondary electromagnetic field,
which is added to the external electromagnetic field resulting in a signal intensity
amplification. This makes nanoparticles highly sensitive transducers of small changes in
the local refractive index. These changes become visible as a red shift of the absorption
spectrum of the molecules upon coupling on the nanoparticles [43], [44]. The SERS
enhancement factor is typically 106–108-fold [33].
21
Figure 6. Illustration of SERS and LSPR. A) SERS consists in the enhancement of the Raman scattering when the analyte is attached or close to the metal surface (position 2). The analyte undergoes the highest electromagnetic field in the ‘hot spot’ where the metal particles are close (position 3). The further the analyte, the weaker the electromagnetic field (position 1) [adapted from 45]. B) SERS enhancement is attributable to the LSPR effect generated from the collective oscillation of electrons in response to an external electric field [46].
A smaller contribution to the enhancement is instead given from a charge transfer effect
between the absorbed molecules with appropriate acceptor or donor orbitals and the
metal substrate. This process is also known as first layer effect because the molecules
directly in contact with the surface of the nanoparticles mainly contribute to chemical
effect and exhibit a stronger enhancement in comparison to the adjacent layers [43],
[44].
1.2.2.2 Substrates for SERS
Good SERS substrates are rough electrodes or colloidal suspensions made of gold, silver
or copper. They are strongly wavelength-dependent meaning that exhibit a good
enhancement in a limited excitation wavelength range. Most SERS substrates are
designed to operate with visible/NIR excitation (400-1’000 nm), which is the typical
range of interest for molecular Raman scattering experiments [36]. Silver produces the
highest enhancement factor because interband transitions fall in the UV range leading
to reduce absorption in the visible or NIR range. Conversely, in case of gold and copper,
interband transitions fall in the visible range reducing SERS amplification [47].
1.2.2.3 Intrinsic and extrinsic detection methods
Two detection methods can be distinguished: intrinsic and extrinsic. Intrinsic SERS
targets the molecule of interest directly supplying structural information useful to
cv
cv
Light SERS signal
A B
ccIncoming
light SERS
signal
A B
Au
Electron cloud
Electric field Analyte
22
identify even small difference between similar samples. However, the targeted
molecule needs to be Raman active and its concentration high enough to be detected.
Instead, extrinsic SERS detects the targeted molecule indirectly because it marks a
Raman reporter. This detection method requires further functionalization in order to
target the molecule of interest [33].
1.2.2.4 Influence of chemico-physical properties of nanoparticles on SERS
For optimized SERS enhancement, LSPR position can be tuned due to its dependence
mainly on the size, shape and aggregation state of nanoparticles. Increased size causes
a red shift of LSPR and higher SERS intensity because of the presence of more available
electrons. However, this is valid until nanoparticles size approaches the scale of the
excitation wavelength: for these particles the enhancement diminishes due to the
radiation damping effect. When particles are too small, the effective conductivity and
light scattering properties diminish [48], [49]. In addition to the position, the
morphology also changes the number of LSPR peaks accordingly to the way in which
nanoparticles can be polarized. While nanospheres present only one peak, nanorods
have two peaks, once longitudinal and the other one transversal. The highest SERS
enhancement up to 1014-fold is usually recorded in localized areas known as ‘hot spots’.
They can be either gaps smaller than 2 nm, formed when two or more nanoparticles
cluster, or sharp corners and tips in anisotropic nanoparticles. In the latter case, the
lightning rod effect causes the dipolar field to be focused at the tip allowing the
nanoparticles to behave as an optical antenna. The analyte does not need to be in direct
contact with the surface of nanoparticles. Indeed, it has been reported that SERS
enhancement extends to a distance of 10 nm but diminishes following the distance
dependence: I = (1 + r/a)-10, where I is the SERS intensity, a is the radius of the
nanoparticle and r is the distance of the analyte from the metallic surface [43], [50]. In
case of extrinsic SERS, it is worth mentioning that the selection of both the Raman
reporter and the protective coating layer plays a role in the final electromagnetic
enhancement. The Raman reporter must: i) be polarizable to be Raman active; ii) be
photostable for prolonged exposure to the laser with no significant decay of the signal;
iii) and have high binding affinity to elicit chemical enhancement mechanism. Molecules

23
with sulfur or amine, such as DTTC, R6G, crystal violet and some small molecules
containing thiol such as p-BDT, are preferred because they strongly bind to gold via the
gold thiolate bond [51]–[54]. A study comparing two organic chromophores, malachite
green (MG) and its isothiocyanate derivative (MGITC), showed that the enhancement
factor of MGITC was ∼200-fold higher than MG under the same experimental conditions
[55]. Fluorescent dyes and other chromophores are often used because they have large
Raman scattering cross sections. Raman reporters can also match the excitation
wavelength inducing SERRS and further enhance the Raman signal [31]. Beside existing
Raman reporters, molecules can be specially synthesized for improving their binding to
gold. For instance, lipoic acid was added to a triphenylmethine dye as a linker to
covalently attach the reporter on gold colloid [56]. As alternative, molecules positively
charged can be coupled to negatively charged nanoparticles although they can be prone
to desorption.
About the SERS protective coating, it should not interfere with the detection of the
Raman reporter and it should not cause its displacement [33]. The protective shells
consist of mono or multilayers of polyelectrolytes or silica even though the latter was
reported to cause adsorption competition with Raman reporter or reduction of SERS
signal up to 60% [5], [10], [57]–[60]. PEG is often preferred because it prevents reporter
leaching and nanoparticles aggregation [32], [53], [56]. Most important, PEG
significantly improves circulation time of nanoparticles, a necessary requisite for GBM
imaging as discussed in depth shortly [59], [61].
1.2.2.5 Chemico-physical properties of nanoparticles for SERS based imaging of
glioblastoma
Of all nanostructures, application of GNPs as SERS tags for SERS guided surgery is based
on three major advantages, i.e., remarkable biocompatibility, negligible toxicity and
amenability to functionalization [62]. Formulation of an ideal molecular imaging agent
requires satisfying some criteria. It must: i) avoid opsonization and clearance by the
reticuloendothelial system (RES); ii) be selectively delivered to the brain and be able to
cross the BBB; iii) be extensively retained in the tumor so that a single injection is enough
for preoperative planning and intraoperative resection; iv) emit a signal stable for the

24
whole duration of the surgery that lasts in average 4 h; v) and be active in the NIR region
known as a ‘clear window’ for optical imaging because the blood and water absorption
spectra are minimal and the depth of penetration is higher [31], [62], [53]. All these
features can be tailored by controlling the physico-chemical properties of GNPs. Both
size and shape contribute to clearance, in vivo biodistribution, strength of adhesion and
internalization rate in the cells and SERS enhancement. Particles of 60-80 nm are the
most efficient for SERS in the NIR region [53]. GNPs smaller than 5 nm are rapidly
eliminated through renal clearance [63], [64]. GNPs bigger than 200 nm are usually
prone to opsonization. Proteins of the immune system, known as opsonins, are
absorbed on the GNPs surface so that monocytes and macrophages can promptly
recognize, remove from the blood stream and bring the GNPs to the liver, spleen and
bone marrow [63]. Considering that blood and liver account for the accumulation of
approximately 70-80% of the injected GNPs, the gold bioavailability in the brain is
limited for imaging [65]. Different strategies can be applied to improve circulation time.
Neutral surface charge reduces recognition by the RES but, at the same time, makes
GNPs susceptible to aggregation. Positive or negative charge increases macrophages
uptake but improves particles stability and their interaction with the cells. Alternatively,
addition of PEG can create an extra hydration layer resulting in a ‘stealth’ behavior and
circumventing the RES [61], [63].
1.2.2.6 Passive and active targeting of glioblastoma
Passive permeation of PEGylated GNPs within transport-permissive brain
microvasculature is a size-dependent process with respect to both GNPs core size as
well as PEG chain length [66]. Approximatively 0.3% of 10 nm GNPs was shown to pass
through the BBB after 24 h from the injection and this percentage dropped as soon as
size increased [65]. However, accumulation of GNPs with a final size of 120 nm was
successfully reported in GBM bearing mouse [5], [10].
To improve the passage of GNPs through the BBB and to enrich the amount of gold in
the brain, an effective strategy is the active targeting. It relies on two kinds of transports:
absorption mediated transport (AMT) and receptor mediated transcytosis (RMT). AMT
uses cation proteins or cell-penetrating peptides to trigger the interaction between the

25
GNPs and the negatively charged membrane of brain capillary endothelial cells.
Nevertheless, it is a non-specific process leading to accumulation of GNPs in non-
targeted or non-diseased area. For increased targeting specificity, RMT appeals for
immobilization of target receptor specific biomolecules on the GNPs surface. Targeting
moieties commonly used for GBM are: i) proteins such as transferrin, fibroblast growth
factor and low-density lipoprotein-receptor-related protein-1; ii) peptides such as trans-
activating transcriptor and RGDyK; iii) and antibodies against transferrin receptors or
EGFR [61], [67]. Antibodies can be employed in their native form, as single-chain variable
fragments or affibodies [53], [68]. Conjugation of these ligands allows for a remarkably
more intense and lasting tumor enhancement with respect to the unconjugated
counterpart.
Among the different brain malignant tumor types, GBM was chosen because this tumor
is considered the most challenging to resect due to the diffuse pattern of tumor spread.
Detailed definition, classification, diagnosis and strategies of treatment are described in
the following section.

26
1.3 Glioblastoma
Gliomas account for the 80% of malignant brain tumors arising from glial cells such as
astrocytes, oligodendrogliomas or ependymal cells [69]. According to the 2016 World
Health Organization (WHO) classification, which takes into account the molecular
parameters in addition to the histopathologic appearance, two main categories can be
defined: i) diffuse gliomas whose main feature is a highly infiltrative pattern in the
central nervous system parenchyma; ii) and more circumscribed gliomas of which
astrocytoma and ependymomas are the most representative [70]. Constituting more
than 50% of all gliomas, grade IV GBM is the most frequent tumor belonging to former
category (Figure 7) [69], [71].
Figure 7. Statistical distribution of gliomas and classification of GBM according to the 2016 WHO.
GBM can be primary or secondary depending on whether it appears de novo or it
progresses from a lower WHO grade tumor, respectively. Primary GBM is more common
in men with a median age of 62 and only 8.8% is diagnosed in children. Conversely,
secondary GBM affects mainly women with a median age of 45 [71].
Even though GBM was thought to be characterized by a heterogeneous histological
appearance only, whence the name multiforme, newly acquired knowledge regarding
molecular abnormalities or genetic alterations has led to the definition of specific GBM
types. Based on the presence or absence of isocitrate dehydrogenase (IDH) gene
mutations, it is possible to distinguish: i) GBM: IDH-wildtype; ii) GBM: IDH-mutant; iii)
and GBM: NOS (not otherwise specified). Primary GBM is IDH-wildtype and it is further
discriminated in giant cells GBM, gliosarcoma and epithelioid GBM. IDH catalyzes the
conversion of isocitrate into α-ketoglutarate within the citric acid cycle. Present in
secondary GBM, IDH mutation causes a hypermethylation phenotype, changes in
cellular metabolism and responses to hypoxic and oxidative stress. The third category,
27
GBM: NOS, encompasses all kind of GBM lacking of specific information to be assigned
to one of the previous classes [11].
1.3.1 Etiology, incidence and prognosis
Its formation cannot be prevented since the exact causes remain elusive although
exposure to ionizing radiation might be associated with an increased risk of glioma [69],
[71]. It has a global incidence of two to three per 100.000 adults per year and a median
survival rate not longer than 15 months [11], [71]. This disheartening prognosis makes
GBM the most challenging and lethal brain tumor worldwide.
1.3.2 Unique challenging features
GBM consists of a mass with a central necrotic core surrounded by thick and irregular
margins. Abnormal accumulation of fluid (infiltrative edema) around the tumor causes
further brain swelling exacerbating the symptoms (Figure 8A). The following features
make the clinical management arduous and challenging:
- Localization: GBM is usually localized in the supratentorial compartment. Lesions
have origin in the deep white matter to infiltrate often into the cortex. In the
worst case, it can extend across the corpus callosum to the opposite hemisphere
assuming the characteristic butterfly shape (Figure 8B). GBM rarely forms
metastases outside of the central nervous system [71];
- Highly infiltrative pattern: cells invading individually or in small groups the
normal brain parenchyma are hallmarks of GBM. Invasion occurs preferentially
along the existing brain structures but even through the blood vessels and the
white matter. Infiltrating tumor cells usually form deeply seated structures
beyond the margins for maximal resection eluding the current visualization
technique and giving rise to tumor relapse [68];
- Resistance or limited response to conventional therapies: GBM cells are not only
resistant to chemotherapy and ionizing radiation, but those conditions prompt
them to invasive behaviors [72].

28
Figure 8. Illustration of GBM structure. A) T1 and T2-weighted images of GBM and a schematic representation of GBM structure: a necrotic core with asymmetric margins is surrounded by edema [73]. B) MRI image of a bifrontal lesion across the corpus callosum with the butterfly shape [74].
1.3.3 Aberrations of epidermal growth factor receptor
The most common alteration concerns the EGFR. EGFR belongs to the ErbB receptors
family with tyrosine-kinase activity. It is a single chain transmembrane protein of 170
kDa made up of three domains: i) an extracellular ligand-binding domain; ii) a
hydrophobic transmembrane domain; iii) and a cytoplasmic domain with tyrosine kinase
activity (Figure 9). The binding of the ligand to the ectodomain promotes the formation
of transient homo or heterodimers and autophosphorylation of tyrosine residues within
the carboxy terminal tail of the receptors. This recruits several cytoplasmic proteins,
which initiate an intracellular signaling via several pathways leading to cell proliferation,
survival, apoptosis, invasion and migration [75]. These pathways include the
phosphoinositide 3-kinase, mitogen-activated protein kinase, signal transducer and
activator of transcription 3 and Src family kinases [76].
Dysregulated EGFR signaling is a frequent hallmark that leads to a more aggressive GBM
phenotype. This can be due to mechanisms such as EGFR overexpression at the cell
membrane, enhanced autocrine activation or EGFR mutation and malfunction in
receptor degradation. Occurring in almost 60% of primary GBM, while only in 10% of
secondary GBM, EGFR overexpression is often a consequence of EGFR focal
amplification at 7p12 or mutation. Approximately 50% of GBM overexpressing EGFR
also shows concomitant expression of its truncated yet constitutively active form:
EGFRvIII [76], [77]. EGFRvIII is a tumor specific mutation arising from an in-frame
B A
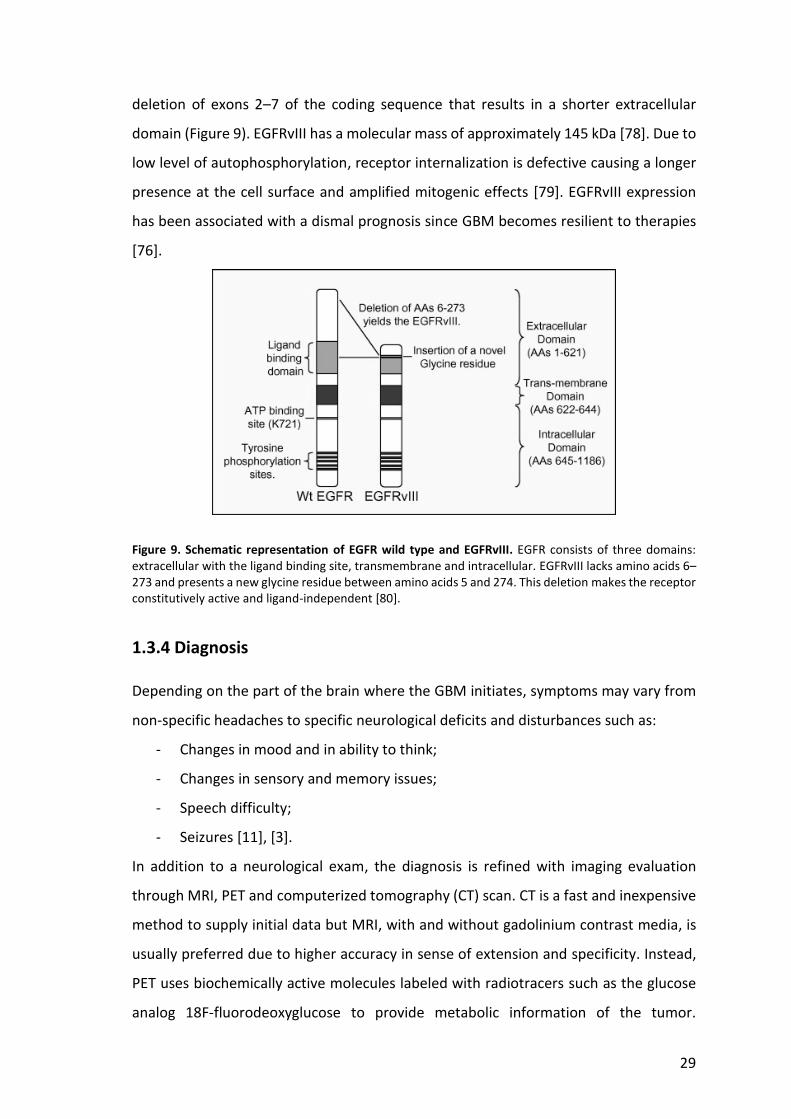
29
deletion of exons 2–7 of the coding sequence that results in a shorter extracellular
domain (Figure 9). EGFRvIII has a molecular mass of approximately 145 kDa [78]. Due to
low level of autophosphorylation, receptor internalization is defective causing a longer
presence at the cell surface and amplified mitogenic effects [79]. EGFRvIII expression
has been associated with a dismal prognosis since GBM becomes resilient to therapies
[76].
Figure 9. Schematic representation of EGFR wild type and EGFRvIII. EGFR consists of three domains: extracellular with the ligand binding site, transmembrane and intracellular. EGFRvIII lacks amino acids 6–273 and presents a new glycine residue between amino acids 5 and 274. This deletion makes the receptor constitutively active and ligand-independent [80].
1.3.4 Diagnosis
Depending on the part of the brain where the GBM initiates, symptoms may vary from
non-specific headaches to specific neurological deficits and disturbances such as:
- Changes in mood and in ability to think;
- Changes in sensory and memory issues;
- Speech difficulty;
- Seizures [11], [3].
In addition to a neurological exam, the diagnosis is refined with imaging evaluation
through MRI, PET and computerized tomography (CT) scan. CT is a fast and inexpensive
method to supply initial data but MRI, with and without gadolinium contrast media, is
usually preferred due to higher accuracy in sense of extension and specificity. Instead,
PET uses biochemically active molecules labeled with radiotracers such as the glucose
analog 18F-fluorodeoxyglucose to provide metabolic information of the tumor.

30
However, to achieve a correct diagnosis, histological assessments of sample obtained
either by biopsy or resection should be performed [11].
1.3.5 Treatment
First line of treatment of GBM is surgery followed by radiotherapy and chemotherapy.
However, when lesion is too extended or close to sensitive areas, biopsy could be
preferred since it carries fewer risks compared to the complete resection [81].
As stated above, surgery still remains the state-of-art treatment in GBM
management. Increasing the extent of resection to a minimum of 70% of the initial
tumor volume has been associated to a more favorable prognosis with a nearly 5-
months or greater than 40% increase in survival [82], [83]. Nonetheless, complete
resection is achieved in fewer than 20% of cases [18].
Radiotherapy uses external high-energy beams, such as X-rays or protons, to kill
or slow the growth of tumor cells. Specialized delivery systems direct radiations at the
site of the tumor while minimizing the radiation dose to the surrounding brain. Although
radiotherapy hits even the healthy cells, by the time the next treatment is given, most
of them can repair the damage. This process is repeated for a total of 10 to 30
treatments, usually given once a day, 5 days a week [84].
Chemotherapy is based on the use of Temozolomide (TMZ) or Lomustine (also
referred as CCNU). They are alkylating agents that act by introducing a DNA mismatch
in the replication cycle leading to cell death [1]. A daily dose of 150 to 200 mg/m2 of
body-surface area is administered for 5 days every 28 days. Concomitant treatment with
radiotherapy plus TMZ has shown to improve survival [85]. Common side effects arising
from both types of treatments are fatigue, nausea, swelling, infertility and stroke [86].
Recently introduced, tumor treating field (TTF) is a new technology that relies on
the application of a low intensity, intermediate frequency and alternating electric field
to inhibit cell mitosis. TTF restrains DNA damage repair, impairs cellular migration and
31
invasion and upregulates autophagy [87]. The use of TTF together with TMZ has shown
to improve progression-free survival and overall survival [88].
Novel approaches are under investigation such as vaccines, angiogenesis or small
molecule tyrosine kinase inhibitors, monoclonal antibodies and RNA-based agents.
Being a signature of GBM, it is not surprising that EGFR has been frequently chosen as
first target of therapy.
So-called small molecules tyrosine kinase inhibitors such as Gefitinib (Iressa®)
and Erlotinib (Tarceva®) interfere with tyrosine kinase activity of the receptor thus
altering the signal transduction cascade. None of these molecules has been approved
for GBM due to unacceptable side effects, limited efficacy or difficult brain penetrance
[79].
Monoclonal antibodies usually prevent the binding of the cognate ligand to the
relative receptor. Bevacizumab (Avastin®) targets the vascular endothelial growth factor
receptor and blocks the generation of new tumor-associated blood vessels [1], [2]. It is
clinically used only for recurrent disease and symptoms alleviation. Cetuximab
(Erbitux®) acts on the EGFR as an antibody-blocking with no receptor activation. It is also
believed to induce receptor internalization and destruction [79]. Monoclonal antibody,
mAb806, has been engineered for targeting the EGFRvIII. It recognizes a region usually
hidden in EGFR impairing receptor autophosphorylation. Recent studies have shown
that different mutations of EGFR cause conformational changes making the hidden
region accessible to the antibody [89].
Receptor inhibition can be even achieved at the transcription or translation level
by mean antisense RNA, RNA interference and ribozymes. Pre-clinical outcomes in this
field are very promising [1], [79].
Feasibility and safety of so-called chimeric antigen receptor-T cells have been
shown in the treatment of GBM. Patients own T cells are modified in the lab to recognize
the EGFRvIII. After recognition, primary T-cell activation occurs and leads to cytokines

32
release, degranulation and T-cell proliferation [90].
One of the reasons why GBM is so aggressive and difficult to treat is the presence of the
BBB, which precludes access of a wide variety of therapeutic or imaging agents to the
tumor [91].
33
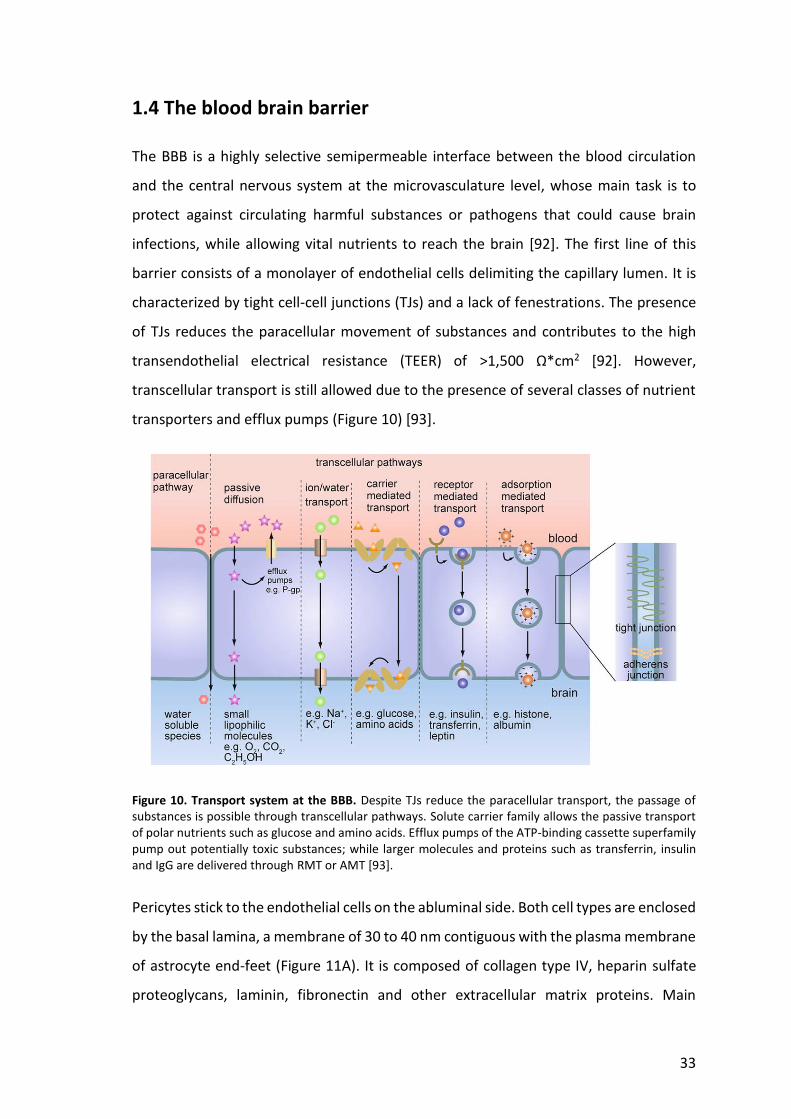
1.4 The blood brain barrier
The BBB is a highly selective semipermeable interface between the blood circulation
and the central nervous system at the microvasculature level, whose main task is to
protect against circulating harmful substances or pathogens that could cause brain
infections, while allowing vital nutrients to reach the brain [92]. The first line of this
barrier consists of a monolayer of endothelial cells delimiting the capillary lumen. It is
characterized by tight cell-cell junctions (TJs) and a lack of fenestrations. The presence
of TJs reduces the paracellular movement of substances and contributes to the high
transendothelial electrical resistance (TEER) of >1,500 Ω*cm2 [92]. However,
transcellular transport is still allowed due to the presence of several classes of nutrient
transporters and efflux pumps (Figure 10) [93].
Figure 10. Transport system at the BBB. Despite TJs reduce the paracellular transport, the passage of substances is possible through transcellular pathways. Solute carrier family allows the passive transport of polar nutrients such as glucose and amino acids. Efflux pumps of the ATP-binding cassette superfamily pump out potentially toxic substances; while larger molecules and proteins such as transferrin, insulin and IgG are delivered through RMT or AMT [93].
Pericytes stick to the endothelial cells on the abluminal side. Both cell types are enclosed
by the basal lamina, a membrane of 30 to 40 nm contiguous with the plasma membrane
of astrocyte end-feet (Figure 11A). It is composed of collagen type IV, heparin sulfate
proteoglycans, laminin, fibronectin and other extracellular matrix proteins. Main
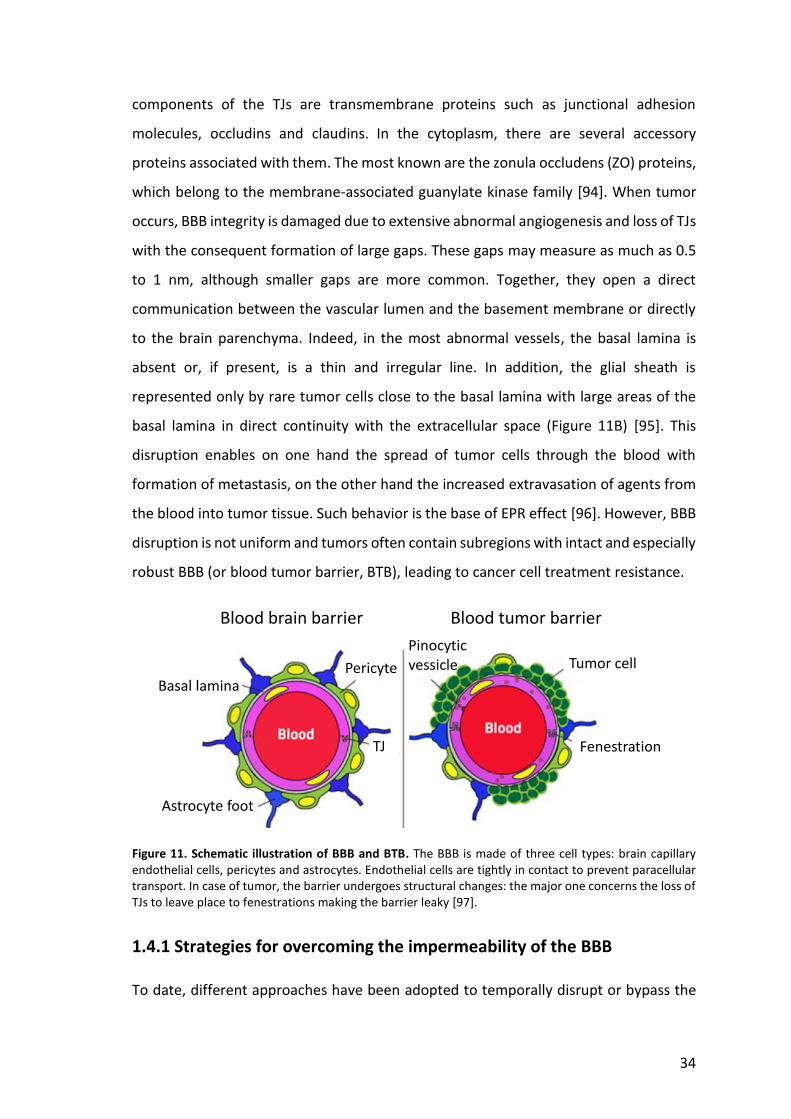
34
components of the TJs are transmembrane proteins such as junctional adhesion
molecules, occludins and claudins. In the cytoplasm, there are several accessory
proteins associated with them. The most known are the zonula occludens (ZO) proteins,
which belong to the membrane-associated guanylate kinase family [94]. When tumor
occurs, BBB integrity is damaged due to extensive abnormal angiogenesis and loss of TJs
with the consequent formation of large gaps. These gaps may measure as much as 0.5
to 1 nm, although smaller gaps are more common. Together, they open a direct
communication between the vascular lumen and the basement membrane or directly
to the brain parenchyma. Indeed, in the most abnormal vessels, the basal lamina is
absent or, if present, is a thin and irregular line. In addition, the glial sheath is
represented only by rare tumor cells close to the basal lamina with large areas of the
basal lamina in direct continuity with the extracellular space (Figure 11B) [95]. This
disruption enables on one hand the spread of tumor cells through the blood with
formation of metastasis, on the other hand the increased extravasation of agents from
the blood into tumor tissue. Such behavior is the base of EPR effect [96]. However, BBB
disruption is not uniform and tumors often contain subregions with intact and especially
robust BBB (or blood tumor barrier, BTB), leading to cancer cell treatment resistance.
Figure 11. Schematic illustration of BBB and BTB. The BBB is made of three cell types: brain capillary endothelial cells, pericytes and astrocytes. Endothelial cells are tightly in contact to prevent paracellular transport. In case of tumor, the barrier undergoes structural changes: the major one concerns the loss of TJs to leave place to fenestrations making the barrier leaky [97].
1.4.1 Strategies for overcoming the impermeability of the BBB
To date, different approaches have been adopted to temporally disrupt or bypass the
Blood brain barrier Blood tumor barrier
Basal lamina
Astrocyte foot
Pericyte
TJ
Pinocytic
vessicle
Fenestration
Tumor cell

35
BBB allowing oversized GNPs to enter the tumor.
Osmotic agents such as mannitol or bradykinin analogues are commonly used
but result in widespread BBB disruption with the potential for deleterious consequences
[98].
Convection-enhanced delivery can confine the lesion to a specific area placing
several catheters directly within or around the tumor mass. A positive pressure is
applied pushing the infusate into the extracellular fluid without inducing systemic
toxicity [99]. Major pitfalls are related to safety concerns of open surgery and leakage
of the infusate or reflux along the catheter tract [100].
Focused ultrasound (FUS) with lipid-encased gas-filled microbubbles increases
permeability in a focal and reversible manner. When low frequency US waves are
applied transcranially, the intravascular microbubbles oscillate in the acoustic field
eliciting mechanical forces against the TJs of the endothelial cells that line the vessel
wall [99]. FUS is safe and minimally invasive. The ensuing BBB disruption lasts at most
for approximately 4 hours [98].
The disruption of the BBB requires that GNPs cross the BBB only in pre-treated areas,
implying a priori knowledge of tumor invasion boundaries. This is counterintuitive since
using diagnostic GNPs aims at achieving an ultra-sensitive detection of tumor edges at
a macroscopic and microscopic level [62].
1.4.2 In vitro models of the BBB
Investigation of the ability of GNPs to cross the BBB and to reach the brain is essential
to predict the performance of GNPs in a clinical context. Besides in silico and in vivo
models, in vitro BBB models offer a valid tool to study different aspects of the BBB
functions and interactions with potential drug candidates (such as uptake, mechanisms
of transports and cytotoxicity). So far, transwell models or microfluidic devices are
available. Availability of human primary brain material is limited and restricted to biopsy
36
or autopsy material, thus endothelial cell lines isolated from human or animal sources
are used. Despite the endothelial cells are not the only component of the BBB, they are
believed to mainly contribute to the formation of the barrier. They can be cultured alone
or together with astrocytes or pericytes.
The human brain endothelial cell line, hCMEC/D3, has been used to establish a well
characterized in vitro BBB model [101]. This cell line displays a stable and physiologically
normal endothelial phenotype and keeps most of the structures and biochemical
properties of brain endothelium in vivo [102]. It is worth mentioning that hCMEC/D3
cell line is characterized by low TEER levels ranging from 5 to 50 *cm2 and reduced
expression of ZO-1 and claudin-5 when cells are grown to confluence on transwell
inserts [103]. Nevertheless, cell monolayer displays a highly restricted permeability to
standard drugs in good correlation with in vivo permeability values from brain perfusion
studies, confirming its suitability for transendothelial permeability analyses [102].

37
38
2. Motivation and aims of the thesis
Complete resection of contrast enhancing malignant brain tumors is achieved in
less than 20% of cases. This is due to the difficulty to sharply delineate tumor margins
and to identify infiltrative cancer cells specially in case of GBM [5], [18]. Therefore,
improving intraoperative visualization of cancer cells is the motivation that gives rise to
this project. SERS based imaging of GBM is promising to fulfil most of the requirements
that current intraoperative guidance techniques have not met yet. A handheld Raman
scanner, easy to use and able to interrogate the resection bed from any directions, is
currently under clinical trial [5]. GNPs, if properly engineered, are able to cross the BBB
and their detection in the NIR window counters the autofluorescence and increases the
penetration depth [5], [10], [53]. In addition, SERS signal, when no fluorescent Raman
reporters are used, is photo-stable ensuring a strong detection for the whole-time frame
of the surgical operation [23]. However, successful visualization of GBM cells strongly
depends on formulation of GNPs with increased sensitivity and binding affinity. To
accomplish this task, surface functionalization of GNPs must consider a balance
between inert and receptor specific active surface molecules. Indeed, we hypothesize
that final performance of SERS tags, in terms of maximal colloidal stability and SERS
signal, highest receptor binding affinity and lowest non-specific binding, depends on the
proper mixture of Raman reporter, inert protective layer of PEG and antibody (Figure
1).
In order to establish a sensitive and selective intraoperative guidance technology for
GBM detection, this thesis includes:
i) the preparation of SERS tags with several ratios of Raman reporter, inert protective
PEG coating and antibody;
ii) the investigation of how these ratios affect colloidal stability, cellular binding
specificity in vitro on cultured human GBM cell lines and Raman sensitivity;

39
iii) the determination of the optimum incubation time, concentration and surface
chemistry to achieve the maximum SERS intensity while minimizing GNPs aggregation
and non-specific binding;
iv) the modulation of SERS tags surface charge to reduce non-specific binding;
v) the establishment of an in vitro BBB model for evaluating the ability of SERS tags to
cross the BBB before further in vivo investigation.
Figure 1. Influence of surface chemistry on SERS tags performance. The mixture of Raman reporter and PEG acts on gold colloidal stability, Raman signal intensity, cellular receptor binding affinity, non-specific binding and scan speed. Full PEG surface coverage is supposed to elicit a higher binding specificity and GNPs stability and to allow the conjugation of higher antibody concentrations. Conversely, full Raman reporter surface coverage is supposed to boost the Raman sensitivity reducing the acquisition time.

40

41
3. Results
3.1 SERS tags preparation and characterization
Tags for SERS based imaging of GBM were developed by coating 60 nm GNPs (Figure 1A)
with 1,4-Benzendithiol (1,4-BDT) (Figure 1B) used as Raman reporter (Figure 1C).
Unconjugated GNPs were then produced by sequentially backfilling remaining free
spaces with first carboxy-PEG-thiol (cPEG) followed by methoxy-PEG-thiol (mPEG) to
improve binding specificity and biocompatibility (Figure 1D). To target specifically GNPs
towards tumor cells, antibodies against EGFR were covalently conjugated producing
anti-EGFR GNPs (Figure 1E).
Figure 1. Design of tags for SERS based imaging of GBM. A) Transmission electron microscopy picture of 60 nm GNPs in citrate buffer. Image taken with EM 900 transmission electron microscope (Zeiss), acceleration voltage 50 kV. Scale bar 50 nm. B) Chemical structure of 1,4-BDT used as Raman reporter. C) The Raman reporter, 1,4-BDT, is immobilized on gold surface for maximal SERS sensitivity (1,4-BDT GNP). D) PEG is used to create an inert shell for improved stability and to prevent non-specific binding (unconjugated GNP). E) Anti-EGFR antibodies are then conjugated for active targeting (anti-EGFR GNP).

42
Several surface coverage percentages of Raman reporter and PEG were tested.
Considering a perpendicular orientation of Raman reporter with a footprint of approx.
0.09 nm2, and a mushroom configuration of PEG with a footprint of 0.35 nm2, the
theoretical number of molecules required for a 100% surface coverage of the gold area
of 11’304 nm2 was calculated for each ratio (Table 1). From now on, each chemistry ratio
is reported in function of the Raman reporter surface coverage used.
Raman reporter
(µM)
Raman reporter surface
coverage (%)
Raman reporter
molecules
cPEG molecules
mPEG molecules
Total PEG surface
coverage (%)
4 100 128'000 0 0 0
2 50 64'000 5'000 11'000 50
1 25 32'000 5'000 19'000 75
0.4 10 12'800 5'000 24'000 90
0 0 0 5'000 27'000 100 Table 1. Theoretical calculation of molecules required to form a monolayer. Concentrations of Raman reporter and corresponding surface coverages or number of molecules are reported. Both cPEG and mPEG were used, thus the number of the respective molecules and the total PEG surface coverage are listed.
3.1.1 Raman reporter coupling for SERS
Figure 2. Optical and physical properties of 1,4-BDT GNPs. A) Absorption peak of GNPs coated with increasing 1,4-BDT surface coverages. UV-Vis extinction spectra acquired with Sinergy H1 microplate reader (BioTek Instrument, GmbH). B) Hydrodynamic size and negative zeta potential correlated to increasing 1,4-BDT surface coverages. Analysis done with Zetasizer ZS dynamic light scattering instrument (Malvern Panalytical Ltd, UK), T 25°C, pH 7, n=3, mean ± SD.
Red shift
400 500 600 7000.0
0.1
0.2
0.3
0.4
Wavelength
Absorbance
0%1,4-BDT
10%1,4-BDT
25%1,4-BDT
50%1,4-BDT
100%1,4-BDT
10x100%1,4-BDT
B A
400 500 600 7000.0
0.1
0.2
0.3
0.4
Wavelength
Absorbance
0%1,4-BDT
10%1,4-BDT
25%1,4-BDT
50%1,4-BDT
100%1,4-BDT
10x100%1,4-BDT
43
SERS tags were produced by coating GNPs with theoretically increasing surface
coverages of 1,4-BDT, from 0 to 100%. 10-fold excess (10x 100%) Raman reporter was
even tested to ensure the complete surface saturation. UV-Vis spectra were recorded
as first and fast control of surface modification. LSPR, centered at 540 nm for bare GNPs,
experienced a progressive red shift up to 5 nm with 10-fold excess Raman reporter, as
a result of the increased local refractive index at the GNPs surface (Figure 2A). However,
both the hydrodynamic size and the zeta potential stayed unchanged even at the
highest Raman reporter surface coverage (Figure 2B).
3.1.1.1 SERS signal enhancement
The amplification of the fingerprint spectrum as soon as the Raman reporter comes in
contact with the GNPs surface can be observed by comparing the spectra of 1,4-BDT
free or immobilized on gold colloidal suspension (Figure 3). Both spectra exhibited
several peaks including two strong bands at 1’068 cm-1 and 1’556 cm-1, corresponding
to ring breathing and ring stretching vibrations, respectively, while the Raman mode at
2’556 cm-1 was visible only in the spectrum of free 1,4-BDT.
Figure 3. SERS enhancement mechanism. Raman spectrum of 1 M free 1,4-BDT used as reference solution (gray curve) and SERS spectrum of 10-fold excess 1,4-BDT absorbed on gold surface (black curve). Arrows indicate the two most characteristic bands of 1,4-BDT at 1’058 cm-1 and 1’556 cm-1, corresponding to ring breathing and ring stretching vibrations, respectively. Measurements done with confocal Raman microscope (WITec GmbH, Germany), λex 785 nm, laser power 60 mW, integration time 0.5 s, accumulation 10, 100x objective.
Ring stretching
Vibration at 1’556 cm-1
Ring breathing
Vibration at 1’058 cm-1
44
3.1.1.2 Influence of Raman reporter surface coverage on SERS intensity
SERS spectra were collected to determine how intensity changes in relation to
increasing Raman reporter surface coverages and to identify the one giving the
strongest signal for a clear detection of GNPs during imaging. Equal concentrations of
GNPs were used to get rid of any variation due to different number of particles.
Experimental measurements showed that the enhancement of SERS signal followed the
actual amount of 1,4-BDT for surface coverages up to 100% and reached the saturation
at 10-fold excess despite amount 1,4-BDT was approx. 4-fold higher (8-fold higher
amount of sulfur per Au) as quantified by inductively coupled plasma mass spectrometry
(ICP-MS) analysis (Figure 4).
Figure 4. Influence of Raman reporter surface coverage on SERS intensity. Intensity of SERS signal at 1’058 cm-1 relative to increasing 1,4-BDT surface coverages. Raman measurements done with confocal Raman microscope (WITec GmbH, Germany), λex 785 nm, laser power 50 mW, integration time 0.5 s, 10 accumulations, 50x objective, ***p≤0.001, ****p≤0.0001 vs 10% 1,4-BDT surface coverage, n=3, mean ± SD. Amount of sulfur per Au was quantified with 8800 ICP-qqq-MS instrument (Agilent technologies), n=2, mean ± SD.
3.1.2 PEGylation for improved stability and biocompatibility
PEG is considered the gold-standard cloaking agent to increase stability and
biocompatibility of nanoparticles. Furthermore, it can act as linker for antibody
conjugation. Therefore, GNPs were functionalized with a mixture of bifunctional linkers,
cPEG and mPEG. SERS spectrum of PEGylated GNPs ensured that PEG coating did not
displace the Raman reporter and did not interfere with its detection (data not shown).
Particles without 1,4-BDT reached dimensions up to 90 nm, while hydrodynamic size
10 25 50 100 10x 100
0
200
400
600
800
000
006025
050
1,4-BDT surface coverage (%)
SER
S at
10
58 c
m-1 Su
lfur p
er Au***
****
45
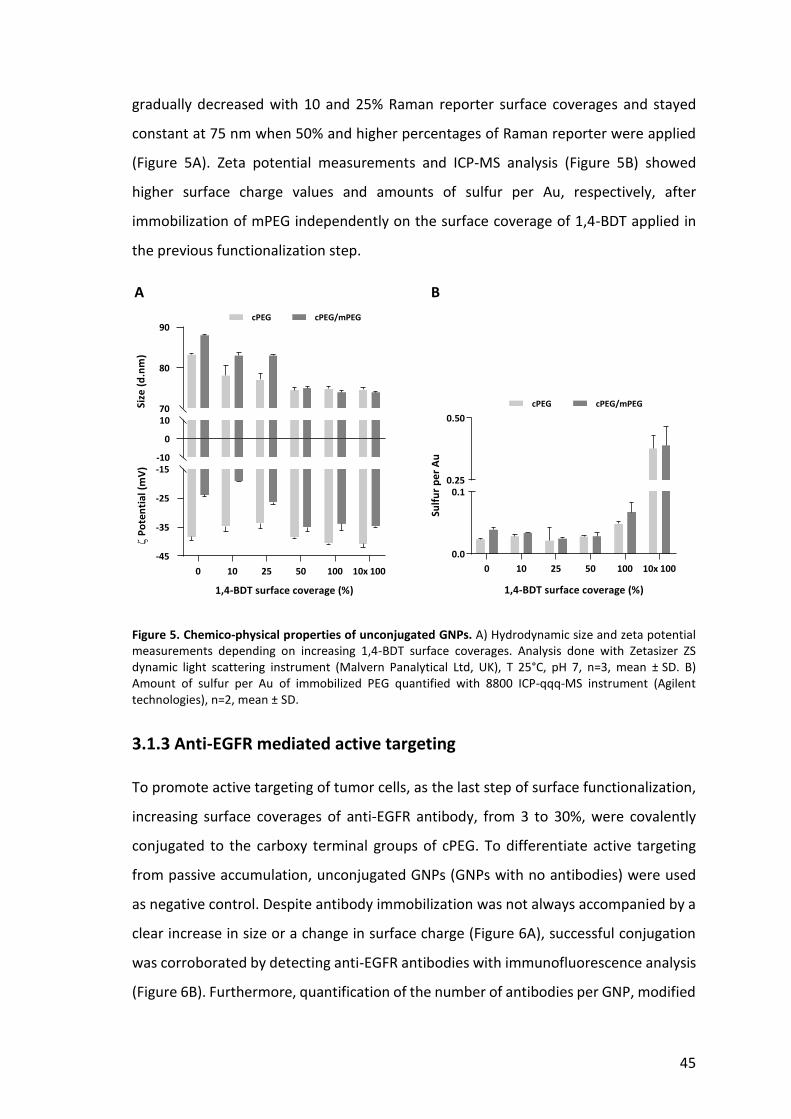
gradually decreased with 10 and 25% Raman reporter surface coverages and stayed
constant at 75 nm when 50% and higher percentages of Raman reporter were applied
(Figure 5A). Zeta potential measurements and ICP-MS analysis (Figure 5B) showed
higher surface charge values and amounts of sulfur per Au, respectively, after
immobilization of mPEG independently on the surface coverage of 1,4-BDT applied in
the previous functionalization step.
Figure 5. Chemico-physical properties of unconjugated GNPs. A) Hydrodynamic size and zeta potential measurements depending on increasing 1,4-BDT surface coverages. Analysis done with Zetasizer ZS dynamic light scattering instrument (Malvern Panalytical Ltd, UK), T 25°C, pH 7, n=3, mean ± SD. B) Amount of sulfur per Au of immobilized PEG quantified with 8800 ICP-qqq-MS instrument (Agilent technologies), n=2, mean ± SD.
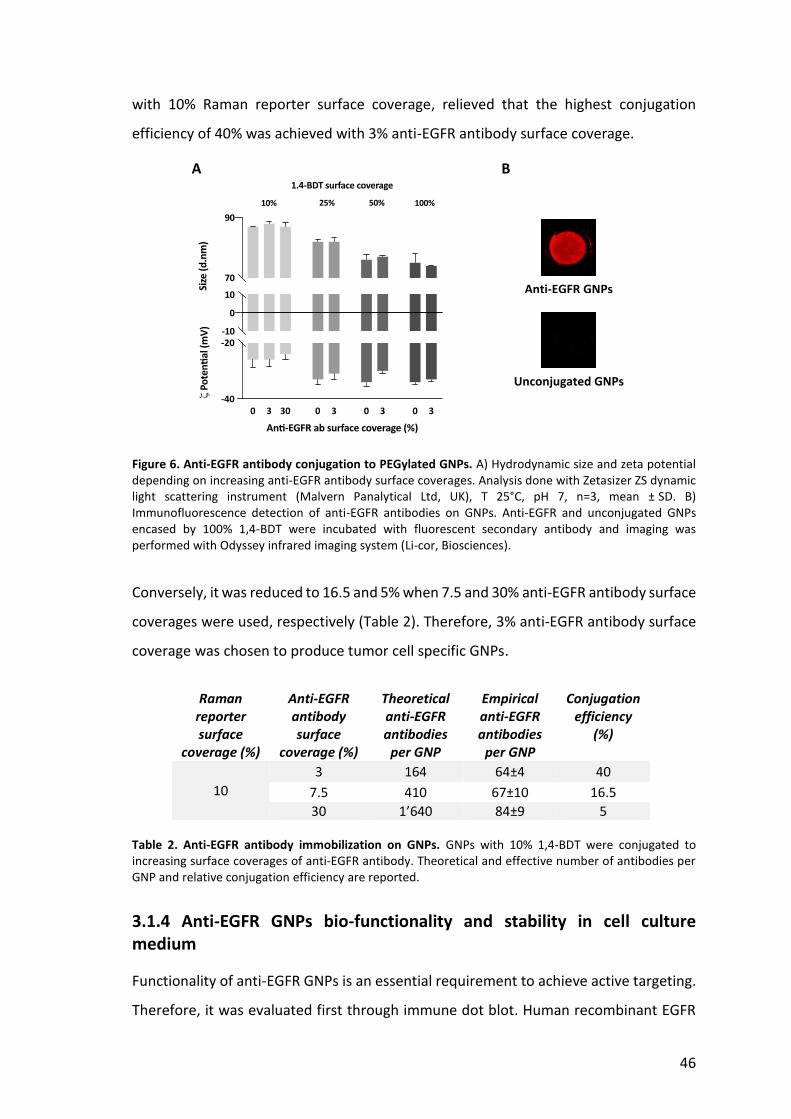
3.1.3 Anti-EGFR mediated active targeting
To promote active targeting of tumor cells, as the last step of surface functionalization,
increasing surface coverages of anti-EGFR antibody, from 3 to 30%, were covalently
conjugated to the carboxy terminal groups of cPEG. To differentiate active targeting
from passive accumulation, unconjugated GNPs (GNPs with no antibodies) were used
as negative control. Despite antibody immobilization was not always accompanied by a
clear increase in size or a change in surface charge (Figure 6A), successful conjugation
was corroborated by detecting anti-EGFR antibodies with immunofluorescence analysis
(Figure 6B). Furthermore, quantification of the number of antibodies per GNP, modified
B A
0 10 25 50 100 10x 100
-45
-35
-25
-15-10
0
1070
80
90
1,4-BDT surface coverage (%)
Size
(d
.nm
)
Po
ten
tia
l (m
V)
cPEG cPEG/mPEG
0 10 25 50 100 10x 100
0.0
0.10.25
0.50
1,4-BDT surface coverage (%)
Sulf
ur
pe
r A
u
cPEG cPEG/mPEG
46
with 10% Raman reporter surface coverage, relieved that the highest conjugation
efficiency of 40% was achieved with 3% anti-EGFR antibody surface coverage.
Figure 6. Anti-EGFR antibody conjugation to PEGylated GNPs. A) Hydrodynamic size and zeta potential depending on increasing anti-EGFR antibody surface coverages. Analysis done with Zetasizer ZS dynamic light scattering instrument (Malvern Panalytical Ltd, UK), T 25°C, pH 7, n=3, mean ± SD. B) Immunofluorescence detection of anti-EGFR antibodies on GNPs. Anti-EGFR and unconjugated GNPs encased by 100% 1,4-BDT were incubated with fluorescent secondary antibody and imaging was performed with Odyssey infrared imaging system (Li-cor, Biosciences).
Conversely, it was reduced to 16.5 and 5% when 7.5 and 30% anti-EGFR antibody surface
coverages were used, respectively (Table 2). Therefore, 3% anti-EGFR antibody surface
coverage was chosen to produce tumor cell specific GNPs.
Raman
reporter surface
coverage (%)
Anti-EGFR antibody surface
coverage (%)
Theoretical anti-EGFR antibodies
per GNP
Empirical anti-EGFR antibodies
per GNP
Conjugation efficiency
(%)
10
3 164 64±4 40
7.5 410 67±10 16.5
30 1’640 84±9 5 Table 2. Anti-EGFR antibody immobilization on GNPs. GNPs with 10% 1,4-BDT were conjugated to increasing surface coverages of anti-EGFR antibody. Theoretical and effective number of antibodies per GNP and relative conjugation efficiency are reported.
3.1.4 Anti-EGFR GNPs bio-functionality and stability in cell culture medium
Functionality of anti-EGFR GNPs is an essential requirement to achieve active targeting.
Therefore, it was evaluated first through immune dot blot. Human recombinant EGFR
B
Anti-EGFR GNPs
Unconjugated GNPs
A

47
was spotted on a nitrocellulose membrane and probed with anti-EGFR or unconjugated
GNPs. A pink spot was visualized only upon binding of anti-EGFR GNPs, confirming
antibody bio-activity and binding specificity (Figure 7A). Results were confirmed by
western blot (Figure 7B).
Figure 7. Bio-functionality of anti-EGFR GNPs. Human recombinant EGFR was spotted (A) on a nitrocellulose membrane or (B) run through a gel, transferred to a PDVF membrane and imaged with Odyssey infrared imaging system (Li-cor, Biosciences). Bound GNPs were evaluated through the presence of a bright pink spot or a fluorescence band at the expected EGFR molecular weight of 70 kDa.
Long term stability of GNPs introduced to biological environment is critical since it is
directly linked to the cellular response outcomes. To test their stability, anti-EGFR and
unconjugated GNPs were mixed with Dulbecco’s Modified Eagle’s Medium - high
glucose (DMEM) supplemented with 10% fetal calf serum (FCS) in a ratio of 1:2 and kept
at 37°C. Absorbance was measured at 450 nm at multiple time points over 24 h (Figure
8). Slightly increase was observed during the first 4 h, likely due to evaporation, but
stayed constant over the remaining 20 h vouching the stability of GNPs in biological
medium.
Figure 8. Stability of anti-EGFR and unconjugated GNPs in cell culture medium. GNPs were incubated in DMEM + 10% FCS (1:2) and mixed at 37°C at 450 rpm. Absorbance was measured at 450 nm at multiple time points over 24 h, n=3, mean ± SD. Data obtained with Sinergy H1 microplate reader (BioTek Instrument, GmbH).
Anti-EGFR GNPs Unconjugated GNPs
A B
62 kDa -
Anti-EGFR GNPs Unconjugated GNPs M
0.15
0.25
0 1 2 4 6 8 24
Time (h)
0.1
0.2
Ab
so
rban
ce a
t 4
50n
m
Anti-EGFR GNPs
Unconjugated GNPs

48
3.2 In vitro cancer cell targeting by anti-EGFR GNPs
3.2.1 Cellular EGFR expression
SERS tag specificity was evaluated on EGFR-positive GBM cell lines, LN229wtEGFR,
BS153 and U87MG. Decreasing levels of EGFR expression were confirmed by
immunofluorescent staining (Figure 9A) and western blot (Figure 9B).
Figure 9. Different expression levels of the EGFR protein in GBM cell lines. A) Immunofluorescent staining of EGFR-positive GBM cells (LN229wtEGFR, BS153 and U87MG) and immortalized glial cell line IMA2.1 used as negative control. Nuclei stained in blue and EGFR in green. Pictures taken with DMRE microscope (Leica Microsystem). Scale bar 50 µm. B) Western blot: EGFR detected at 170 kDa and actin at 42 kDa, EGFRvIII detected at 145 kDa in BS153. C) Number of receptors per cell quantified by qFACS, n=3, mean ± SD.
LN229wtEGFR
BS153
U87MG
IMA2.1
0
1×10⁵
2×10⁵
3×10⁵
4×10⁵
5×10⁵
N°ofEG
FRpercell
38 kDa -
160kDa -
Actin
EGFR
EGFRvIII
A
B C
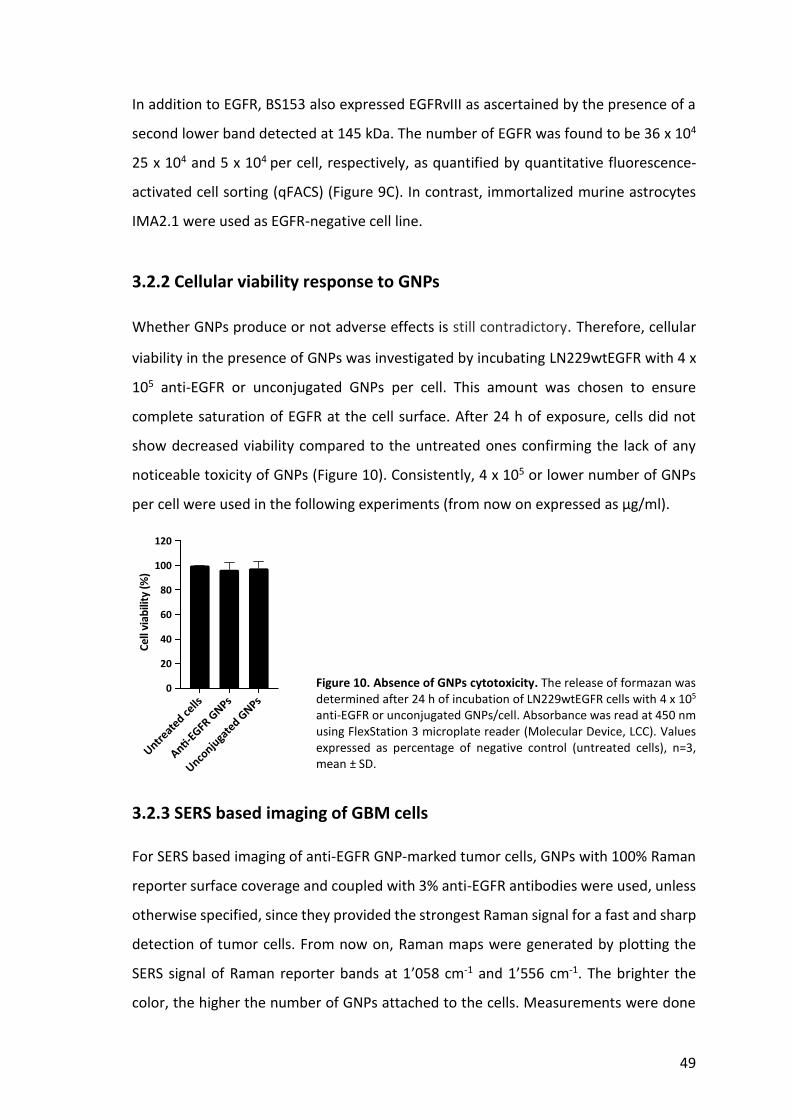
49
In addition to EGFR, BS153 also expressed EGFRvIII as ascertained by the presence of a
second lower band detected at 145 kDa. The number of EGFR was found to be 36 x 104
25 x 104 and 5 x 10⁴ per cell, respectively, as quantified by quantitative fluorescence-
activated cell sorting (qFACS) (Figure 9C). In contrast, immortalized murine astrocytes
IMA2.1 were used as EGFR-negative cell line.
3.2.2 Cellular viability response to GNPs
Whether GNPs produce or not adverse effects is still contradictory. Therefore, cellular
viability in the presence of GNPs was investigated by incubating LN229wtEGFR with 4 x
105 anti-EGFR or unconjugated GNPs per cell. This amount was chosen to ensure
complete saturation of EGFR at the cell surface. After 24 h of exposure, cells did not
show decreased viability compared to the untreated ones confirming the lack of any
noticeable toxicity of GNPs (Figure 10). Consistently, 4 x 10⁵ or lower number of GNPs
per cell were used in the following experiments (from now on expressed as µg/ml).
Figure 10. Absence of GNPs cytotoxicity. The release of formazan was determined after 24 h of incubation of LN229wtEGFR cells with 4 x 10⁵ anti-EGFR or unconjugated GNPs/cell. Absorbance was read at 450 nm using FlexStation 3 microplate reader (Molecular Device, LCC). Values expressed as percentage of negative control (untreated cells), n=3, mean ± SD.
3.2.3 SERS based imaging of GBM cells
For SERS based imaging of anti-EGFR GNP-marked tumor cells, GNPs with 100% Raman
reporter surface coverage and coupled with 3% anti-EGFR antibodies were used, unless
otherwise specified, since they provided the strongest Raman signal for a fast and sharp
detection of tumor cells. From now on, Raman maps were generated by plotting the
SERS signal of Raman reporter bands at 1’058 cm-1 and 1’556 cm-1. The brighter the
color, the higher the number of GNPs attached to the cells. Measurements were done

50
with confocal Raman microscope (Witec, GmbH, Germany) according to the following
setting: λex 785 nm, laser power 25 mW, integration time 0.05 sec, 50x objective. Raman
pictures are reported with the same scale in order to make Raman intensity comparable.
3.2.3.1 Time-dependent binding of anti-EGFR GNPs on EGFR-positive GBM cells
To determine how cellular accumulation of GNPs varies with time, LN229wtEGFR and
IMA2.1 cells were incubated with 15 µg/ml of anti-EGFR or unconjugated GNPs for 30
min, 1, 4, 8 and 24 h. The longer the incubation, the higher the amount of anti-EGFR
GNPs taken up by LN229wtEGFR as revealed by fluorescence and Raman analysis (Figure
11A).
Figure 11. Time-dependent binding of anti-EGFR GNPs on EGFR-positive GBM cells. A) Time-dependent uptake of anti-EGFR GNPs incubated with LN229wtEGFR cells for 30 min, 1, 4, 8 and 24 h and detected by fluorescent staining and Raman. B) Time-dependent specificity of the binding of anti-EGFR or unconjugated GNPs incubated with LN229wtEGFR or IMA2.1 cells for 4, 8 and 24 h. Scale bar 30 µm.
A
B
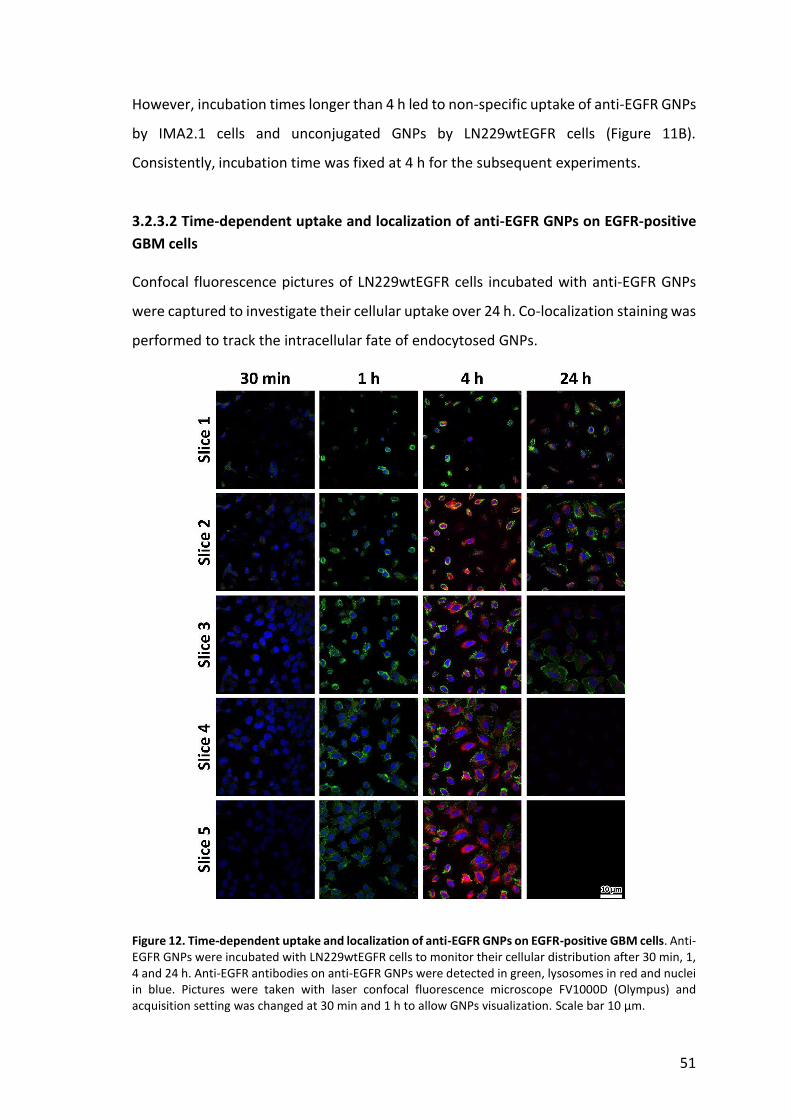
51
However, incubation times longer than 4 h led to non-specific uptake of anti-EGFR GNPs
by IMA2.1 cells and unconjugated GNPs by LN229wtEGFR cells (Figure 11B).
Consistently, incubation time was fixed at 4 h for the subsequent experiments.
3.2.3.2 Time-dependent uptake and localization of anti-EGFR GNPs on EGFR-positive
GBM cells
Confocal fluorescence pictures of LN229wtEGFR cells incubated with anti-EGFR GNPs
were captured to investigate their cellular uptake over 24 h. Co-localization staining was
performed to track the intracellular fate of endocytosed GNPs.
Figure 12. Time-dependent uptake and localization of anti-EGFR GNPs on EGFR-positive GBM cells. Anti-EGFR GNPs were incubated with LN229wtEGFR cells to monitor their cellular distribution after 30 min, 1, 4 and 24 h. Anti-EGFR antibodies on anti-EGFR GNPs were detected in green, lysosomes in red and nuclei in blue. Pictures were taken with laser confocal fluorescence microscope FV1000D (Olympus) and acquisition setting was changed at 30 min and 1 h to allow GNPs visualization. Scale bar 10 µm.

52
As shown in figure 12, weak uptake already started after 30 min of incubation and
became stronger at 1 h. At 4 h, upon endocytosis, anti-EGFR GNPs moved to the
lysosomes as proved by perinuclear co-localization (yellow spot) of anti-EGFR GNPs and
lysosomes. Despite fluorescence signal was detected even in the cytoplasm, anti-EGFR
GNPs were found to be mainly distributed at the cellular surface as expected since EGFR
protein is located at the cellular membrane. This was more evident after 24 h of
incubation.
3.2.3.3 Influence of cellular EGFR expression level on anti-EGFR GNPs binding
To assess the influence of different expression of EGFR at the cell membrane on anti-
EGFR GNPs binding, LN229wtEGFR, BS153, U87MG and IMA2.1 cells were incubated
with decreasing concentrations of anti-EGFR GNPs (70, 22, 5 g/ml). Raman detection
of anti-EGFR GNPs showed that signal increased in a concentration-dependent manner
(Figure 13). Gathered GNPs were not sufficient at 5 g/ml. Conversely, at 70 g/ml
amount of anti-EGFR GNPs was as much adequate as necessary for strong signal and
distribution was uniform allowing a clear delineation of the cell shape.
Figure 13. Effect of different EGFR expression level on anti-EGFR GNPs binding. LN229wtEGFR, BS153, U87MG and IMA2.1 cells were incubated with decreasing concentrations of anti-EGFR GNPs for 4 h and detected by Raman. Scale bar 30 µm.
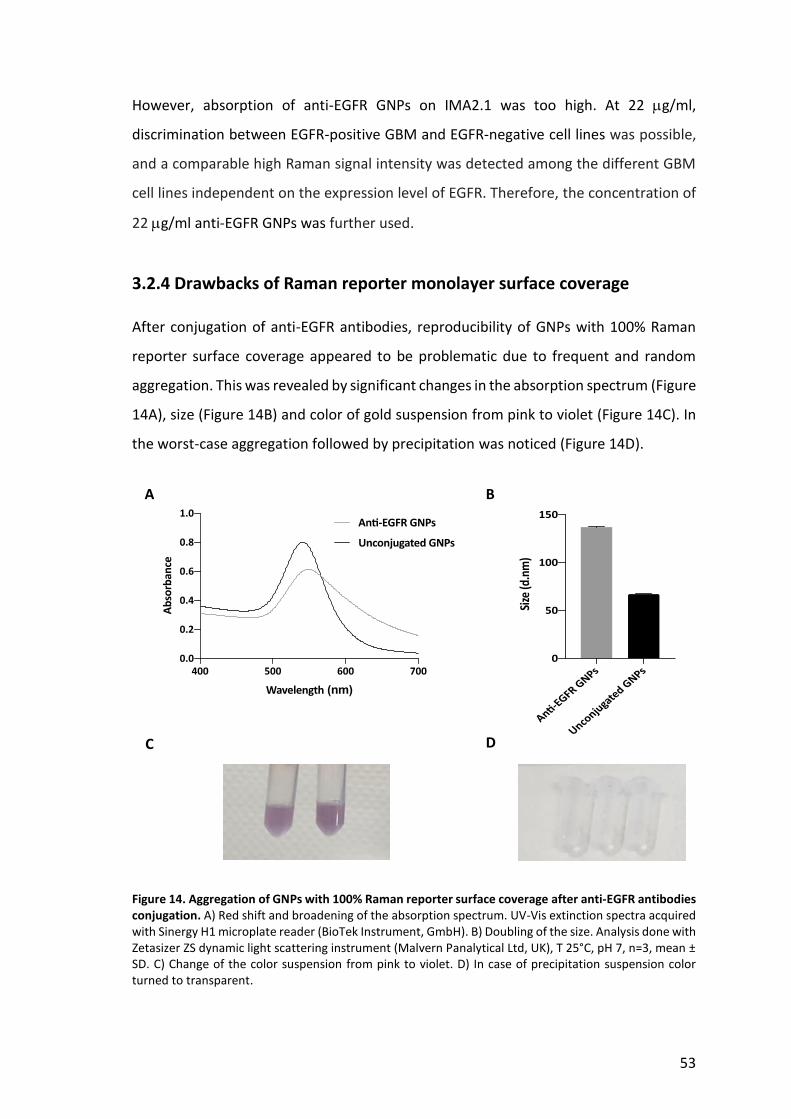
53
However, absorption of anti-EGFR GNPs on IMA2.1 was too high. At 22 g/ml,
discrimination between EGFR-positive GBM and EGFR-negative cell lines was possible,
and a comparable high Raman signal intensity was detected among the different GBM
cell lines independent on the expression level of EGFR. Therefore, the concentration of
22 g/ml anti-EGFR GNPs was further used.
3.2.4 Drawbacks of Raman reporter monolayer surface coverage
After conjugation of anti-EGFR antibodies, reproducibility of GNPs with 100% Raman
reporter surface coverage appeared to be problematic due to frequent and random
aggregation. This was revealed by significant changes in the absorption spectrum (Figure
14A), size (Figure 14B) and color of gold suspension from pink to violet (Figure 14C). In
the worst-case aggregation followed by precipitation was noticed (Figure 14D).
Figure 14. Aggregation of GNPs with 100% Raman reporter surface coverage after anti-EGFR antibodies conjugation. A) Red shift and broadening of the absorption spectrum. UV-Vis extinction spectra acquired with Sinergy H1 microplate reader (BioTek Instrument, GmbH). B) Doubling of the size. Analysis done with Zetasizer ZS dynamic light scattering instrument (Malvern Panalytical Ltd, UK), T 25°C, pH 7, n=3, mean ± SD. C) Change of the color suspension from pink to violet. D) In case of precipitation suspension color turned to transparent.
A B
C D

54
Figure 15. Impaired cell discrimination due to sedimentation and non-specific binding of GNPs. Anti-EGFR or unconjugated GNPs were incubated with LN229wtEGFR or IMA2.1 cells and detected by fluorescent staining and Raman. Scale bar 30 µm.
In addition, GNPs sedimentation and non-specific binding were two main concerns to
face (Figure 15). In attempting to overcome these inconveniences, two new
experimental setups were tested and concentration of GNPs was decreased. First,
LN229wtEGFR or IMA2.1 cells were incubated in suspension with 5 µg/ml of anti-EGFR
GNPs at 37°C (Figure 16A). Incubation time was only 1 h since this setup was performed
out of the incubator to allow the shaking at 400 rpm in the thermomixer.
Second, BS153 or IMA2.1 cells were incubated with 10 µg/ml of anti-EGFR GNPs for 4 h,
but the plate was kept under agitation throughout the duration of the incubation
(Figure 16B). Raman analysis showed that sedimentation was completely solved with
both settings, but non-specific binding persisted even at lower concentrations of anti-
EGFR or unconjugated GNPs (data not shown). Because of similar outcomes and to avoid
cellular stress due to the depletion of C02 when cells are kept outside of the incubator,
the first setup was abandoned, while agitation was kept for the following experiments.
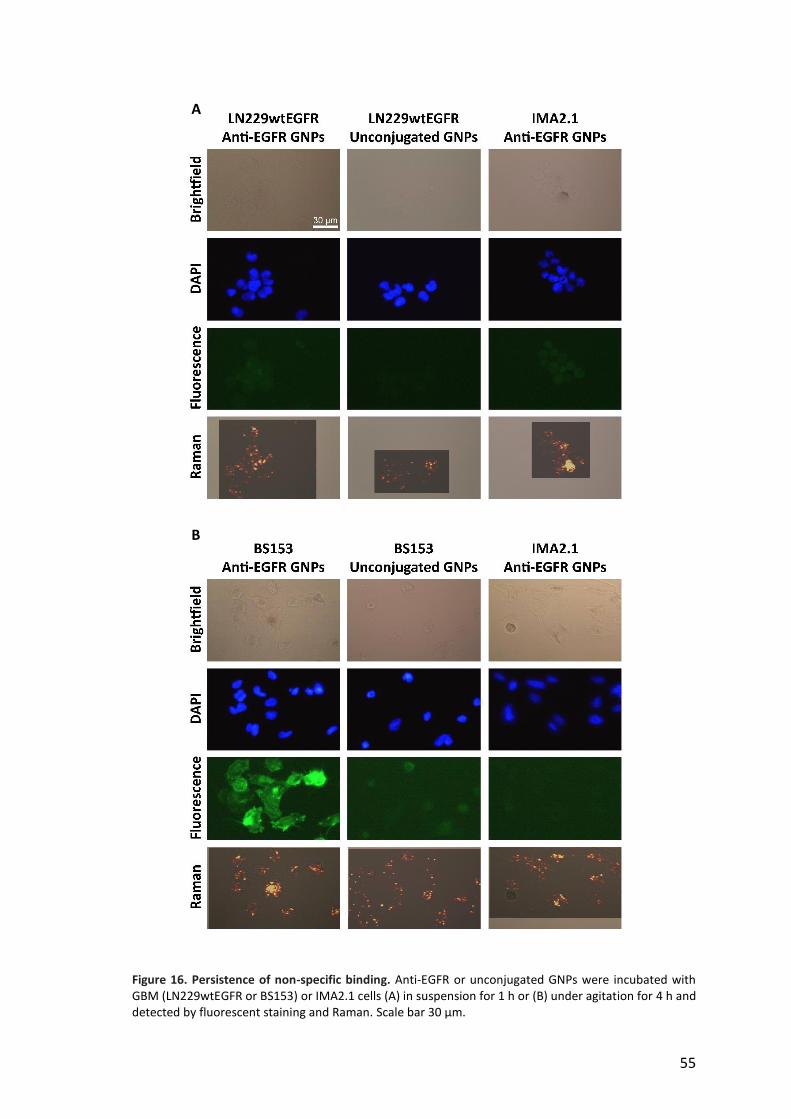
55
Figure 16. Persistence of non-specific binding. Anti-EGFR or unconjugated GNPs were incubated with GBM (LN229wtEGFR or BS153) or IMA2.1 cells (A) in suspension for 1 h or (B) under agitation for 4 h and detected by fluorescent staining and Raman. Scale bar 30 µm.
A
B
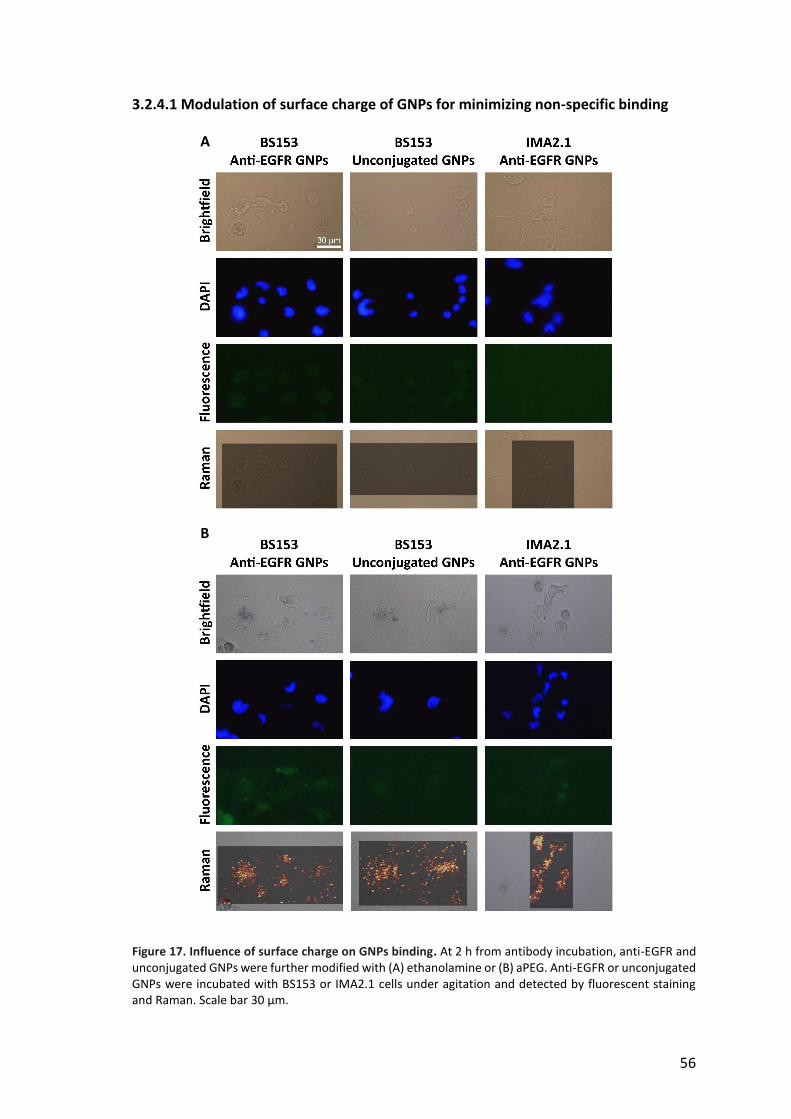
56
3.2.4.1 Modulation of surface charge of GNPs for minimizing non-specific binding
Figure 17. Influence of surface charge on GNPs binding. At 2 h from antibody incubation, anti-EGFR and unconjugated GNPs were further modified with (A) ethanolamine or (B) aPEG. Anti-EGFR or unconjugated GNPs were incubated with BS153 or IMA2.1 cells under agitation and detected by fluorescent staining and Raman. Scale bar 30 µm.
A
B
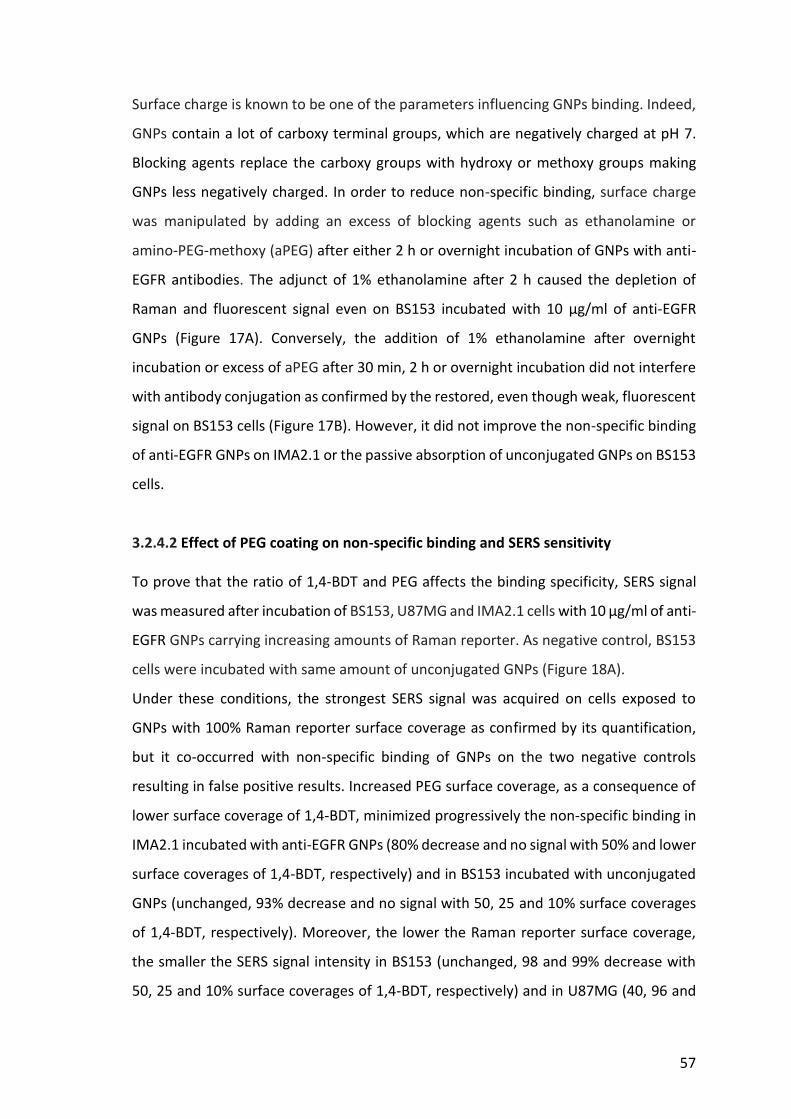
57
Surface charge is known to be one of the parameters influencing GNPs binding. Indeed,
GNPs contain a lot of carboxy terminal groups, which are negatively charged at pH 7.
Blocking agents replace the carboxy groups with hydroxy or methoxy groups making
GNPs less negatively charged. In order to reduce non-specific binding, surface charge
was manipulated by adding an excess of blocking agents such as ethanolamine or
amino-PEG-methoxy (aPEG) after either 2 h or overnight incubation of GNPs with anti-
EGFR antibodies. The adjunct of 1% ethanolamine after 2 h caused the depletion of
Raman and fluorescent signal even on BS153 incubated with 10 µg/ml of anti-EGFR
GNPs (Figure 17A). Conversely, the addition of 1% ethanolamine after overnight
incubation or excess of aPEG after 30 min, 2 h or overnight incubation did not interfere
with antibody conjugation as confirmed by the restored, even though weak, fluorescent
signal on BS153 cells (Figure 17B). However, it did not improve the non-specific binding
of anti-EGFR GNPs on IMA2.1 or the passive absorption of unconjugated GNPs on BS153
cells.
3.2.4.2 Effect of PEG coating on non-specific binding and SERS sensitivity
To prove that the ratio of 1,4-BDT and PEG affects the binding specificity, SERS signal
was measured after incubation of BS153, U87MG and IMA2.1 cells with 10 µg/ml of anti-
EGFR GNPs carrying increasing amounts of Raman reporter. As negative control, BS153
cells were incubated with same amount of unconjugated GNPs (Figure 18A).
Under these conditions, the strongest SERS signal was acquired on cells exposed to
GNPs with 100% Raman reporter surface coverage as confirmed by its quantification,
but it co-occurred with non-specific binding of GNPs on the two negative controls
resulting in false positive results. Increased PEG surface coverage, as a consequence of
lower surface coverage of 1,4-BDT, minimized progressively the non-specific binding in
IMA2.1 incubated with anti-EGFR GNPs (80% decrease and no signal with 50% and lower
surface coverages of 1,4-BDT, respectively) and in BS153 incubated with unconjugated
GNPs (unchanged, 93% decrease and no signal with 50, 25 and 10% surface coverages
of 1,4-BDT, respectively). Moreover, the lower the Raman reporter surface coverage,
the smaller the SERS signal intensity in BS153 (unchanged, 98 and 99% decrease with
50, 25 and 10% surface coverages of 1,4-BDT, respectively) and in U87MG (40, 96 and

58
98% decrease with 50, 25 and 10% surface coverages of 1,4-BDT, respectively)
incubated with anti-EGFR GNPs. To note that, in BS153 and in U87MG exposed to anti-
EGFR GNPs encased by 10 and 25% surface coverages of 1,4-BDT, the detected signal
was attributable to isolated particles and its intensity was not considered strong enough
for a clear discrimination between EGFR-positive GBM and EGFR-negative cells.
Figure 18. Increased PEG surface coverage minimized non-specific binding. EGFR-positive GBM (BS153 and U87MG) and EGFR-negative (IMA2.1) cells were incubated with anti-EGFR or unconjugated GNPs functionalized with increasing surface coverages of 1,4-BDT and detected by Raman. Quantification of relative SERS signal is reported below. Pictures of three random areas for each specimen were transformed in 16-bit images and signal was quantified with Image J software. *p≤0.05, **p≤0.01, ****p≤0.0001 vs 100% 1,4-BDT, n=3, mean ± SD. Scale bar 30 µm.
GNPs with 10% surface coverage of 1,4-BDT coupled to 84 anti-EGFR antibodies (as
quantified in section 3.1.3) were used to improve binding ability and to boost the SERS
signal accordingly. However, Raman detection did not raise (Figure 19) not even after

59
increasing the concentration of GNPs or the laser power (data not shown). Decreased
Raman signal was not ascribed to the absence of the GNPs on the cells whose presence
was confirmed by immunofluorescent staining and dark field analysis. Indeed, due to
the strong SPR light scattering, GNPs were visualized as bright points further confirming
the binding specificity due to higher PEG surface coverage. It was not even ascribed to
the displacement of the Raman marker from the GNPs surface as proven by the
detection of its fingerprint spectrum in the supernatant collected after incubation with
cells (data not shown).
Figure 19. Reduced SERS signal of GNPs with 10% Raman reporter surface coverage. BS153 and IMA2.1 cells were incubated with GNPs coupled to 84 anti-EGFR antibodies. Unconjugated GNPs were incubated with BS153 cells. Anti-EGFR GNPs were detected by fluorescent staining, Raman (scale bare 30 µM) and as bright points by dark field microscopy (pictures taken with hyperspectral imaging system, CytoViva, Inc, US, scale bar 50 µM).
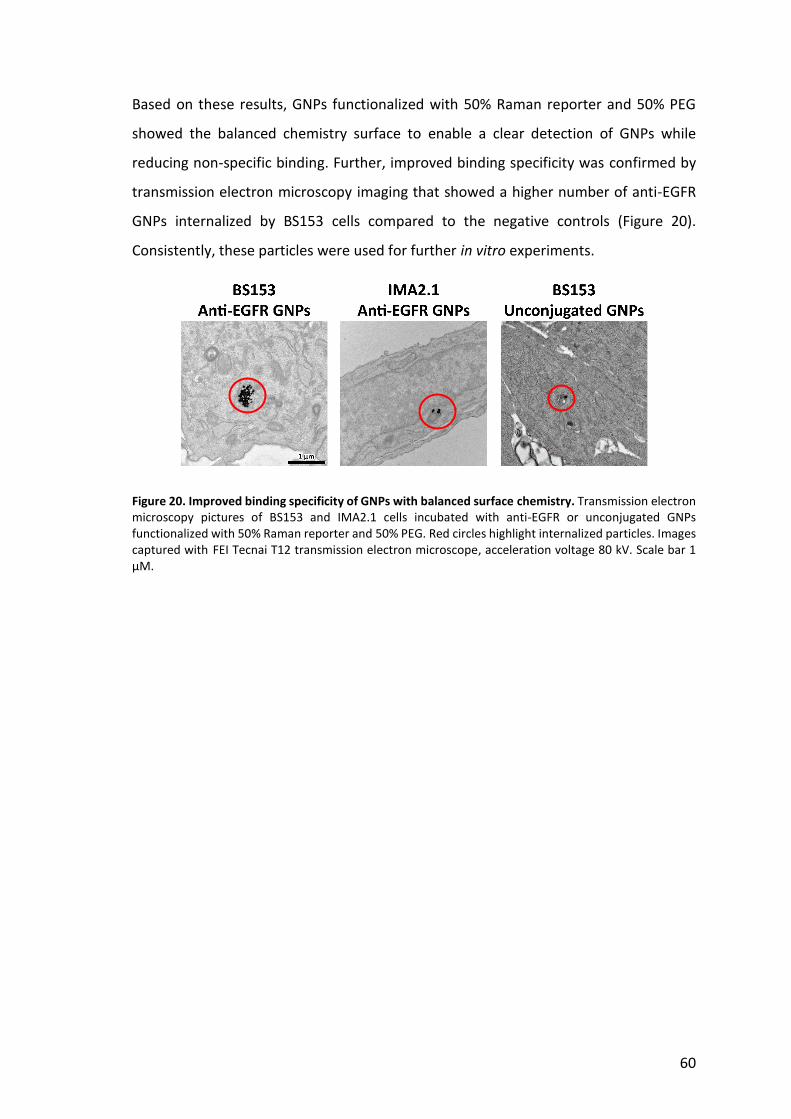
60
Based on these results, GNPs functionalized with 50% Raman reporter and 50% PEG
showed the balanced chemistry surface to enable a clear detection of GNPs while
reducing non-specific binding. Further, improved binding specificity was confirmed by
transmission electron microscopy imaging that showed a higher number of anti-EGFR
GNPs internalized by BS153 cells compared to the negative controls (Figure 20).
Consistently, these particles were used for further in vitro experiments.
Figure 20. Improved binding specificity of GNPs with balanced surface chemistry. Transmission electron microscopy pictures of BS153 and IMA2.1 cells incubated with anti-EGFR or unconjugated GNPs functionalized with 50% Raman reporter and 50% PEG. Red circles highlight internalized particles. Images captured with FEI Tecnai T12 transmission electron microscope, acceleration voltage 80 kV. Scale bar 1 µM.
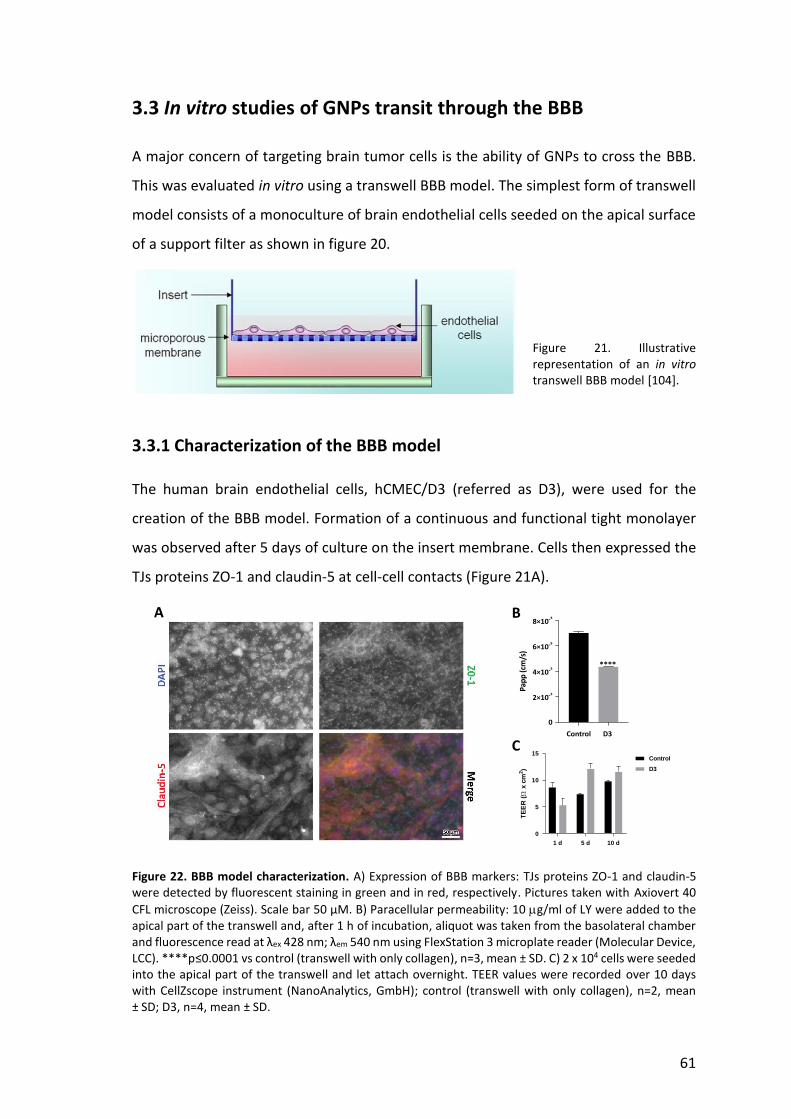
61
3.3 In vitro studies of GNPs transit through the BBB
A major concern of targeting brain tumor cells is the ability of GNPs to cross the BBB.
This was evaluated in vitro using a transwell BBB model. The simplest form of transwell
model consists of a monoculture of brain endothelial cells seeded on the apical surface
of a support filter as shown in figure 20.
Figure 21. Illustrative representation of an in vitro transwell BBB model [104].
3.3.1 Characterization of the BBB model
The human brain endothelial cells, hCMEC/D3 (referred as D3), were used for the
creation of the BBB model. Formation of a continuous and functional tight monolayer
was observed after 5 days of culture on the insert membrane. Cells then expressed the
TJs proteins ZO-1 and claudin-5 at cell-cell contacts (Figure 21A).
Figure 22. BBB model characterization. A) Expression of BBB markers: TJs proteins ZO-1 and claudin-5 were detected by fluorescent staining in green and in red, respectively. Pictures taken with Axiovert 40
CFL microscope (Zeiss). Scale bar 50 µM. B) Paracellular permeability: 10 g/ml of LY were added to the apical part of the transwell and, after 1 h of incubation, aliquot was taken from the basolateral chamber and fluorescence read at λex 428 nm; λem 540 nm using FlexStation 3 microplate reader (Molecular Device, LCC). ****p≤0.0001 vs control (transwell with only collagen), n=3, mean ± SD. C) 2 x 10⁴ cells were seeded into the apical part of the transwell and let attach overnight. TEER values were recorded over 10 days with CellZscope instrument (NanoAnalytics, GmbH); control (transwell with only collagen), n=2, mean ± SD; D3, n=4, mean ± SD.
A B
C Control D3
0
2×10-⁵
4×10-⁵
6×10-⁵
8×10-⁵
Papp(cm/s)
****
1 d 5 d 10 d
0
5
10
15
TE
ER
(x
cm
2)
Control
D3

62
Barrier integrity was also tested by measuring its paracellular permeability to lucifer
yellow (LY) in apical to basolateral direction. Higher restriction was exerted by the cells
compared to the control inserts without endothelial cells (Figure 21B). Despite barrier
formation appeared to be successful, TEER was found to remain at constant low levels
and was only slightly higher compared to transwell inserts without cells after 5 days
(figure 21C). Longer cell culture time up to 10 days did not help to achieve higher TEER
values and the formation of multiple cell layers was often observed after prolonged
period of culture.
3.3.2 Transport of GNPs across the BBB
To investigate the permeation of GNPs through the BBB, 10 and 35 µg/ml of anti-EGFR
GNPs were added to the apical side of the inserts after 6 days of culture. After 24 h of
incubation, the presence of gold in the basolateral medium was measured by ICP-MS.
Figure 23. Passage of GNPs through an in vitro BBB. After 24 h of incubation with 10 and 35 µg/ml anti-EGFR GNPs: A) Amount of gold was measured in the basolateral chamber with 8800 ICP-qqq-MS instrument (Agilent technologies), n=3, mean ± SD; B) Cell monolayer integrity was evaluated by measuring the paracellular permeability of LY. ****p≤0.0001 vs control (transwell with only collagen), n=3, mean ± SD; C) Cell viability was determined by the release of formazan. Absorbance was read at 450 nm using FlexStation 3 microplate reader (Molecular Device, LCC). Values expressed as percentage of negative control (untreated cells), n=3, mean ± SD.
About 0.08% and 0.1% of the applied concentrations of gold (10 e 35 µg/ml,
respectively) were found to go through the cell monolayer and the membrane of the
insert (Figure 22A). The effects of GNPs on BBB integrity were monitored by measuring
A B C
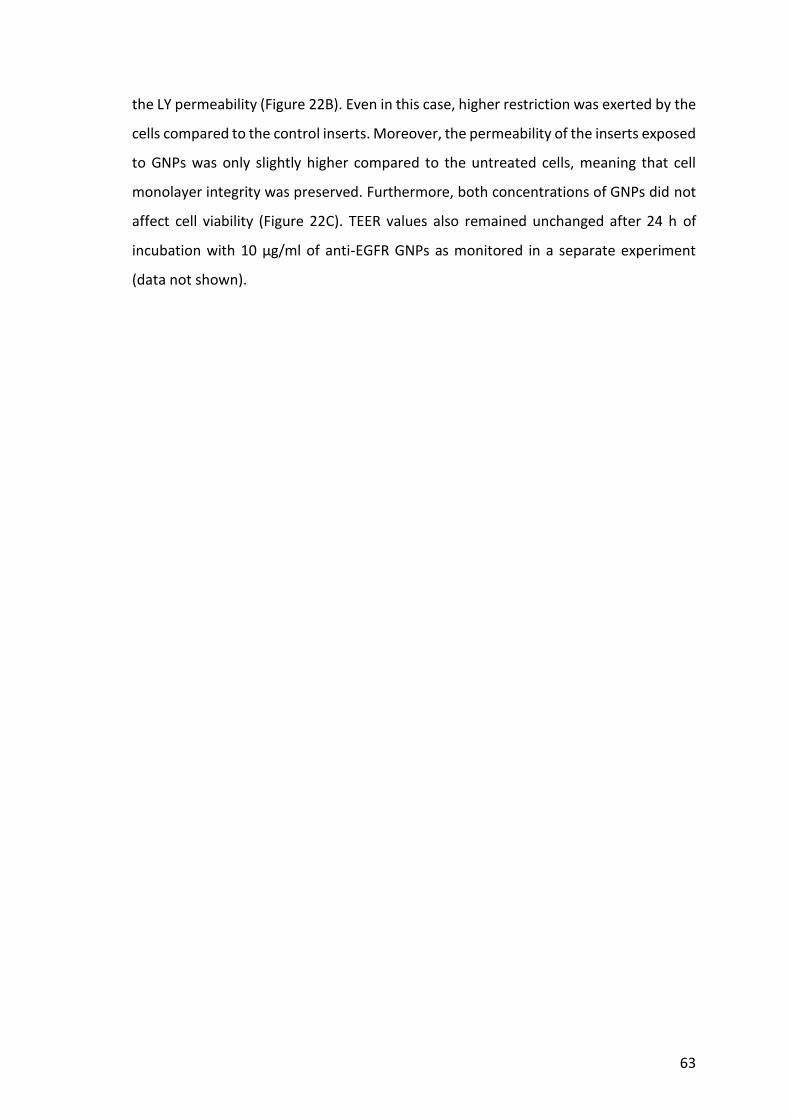
63
the LY permeability (Figure 22B). Even in this case, higher restriction was exerted by the
cells compared to the control inserts. Moreover, the permeability of the inserts exposed
to GNPs was only slightly higher compared to the untreated cells, meaning that cell
monolayer integrity was preserved. Furthermore, both concentrations of GNPs did not
affect cell viability (Figure 22C). TEER values also remained unchanged after 24 h of
incubation with 10 µg/ml of anti-EGFR GNPs as monitored in a separate experiment
(data not shown).
10x

64
65
4. Discussion
Improved visualization of brain tumor cells during Raman intraoperative surgery
can be achieved by using anti-EGFR GNPs as SERS tags. Surface functionalization is
shown to significantly influence anti-EGFR GNPs performance. Indeed, an appropriate
combination of the functionalities immobilized on the gold surface is required,
especially when the gold core is used as the only accessible surface for all the
functionalities as done in this thesis. This decision was made to keep the size of anti-
EGFR GNPs as small as possible due to the requirement to cross the BBB in the clinical
situation. Hence, the challenge was to combine the three essential components: i)
Raman reporter for a maximal SERS signal; ii) inert, protective PEG coating to prevent
non-specific binding; iii) and antibody with high receptor binding affinity towards tumor
cells, in order to obtain the highest and most specific SERS signal. Finding the optimal
balance among these three components depends on the accurate characterization of
GNPs. This was one of the main challenges met in this project due to the limited
sensitivity of the analytical methods available. Indeed, several techniques, such as X-ray
photoelectron spectroscopy, Fourier-transform infrared spectroscopy or energy
dispersive X-ray were used but none of them allowed a sensitive detection of surface
binding ligands. Possible solution would be to scale up the production process to
facilitate their analysis.
4.1 Raman reporter to enhance SERS signal
The SERS enhancement mechanism was confirmed by the assessment of the two
strong Raman bands, assigned to ring breathing and ring stretching vibrations [105],
which showed 35 and 55 times higher signals for 1,4-BDT immobilized on GNPs
compared to free 1,4-BDT, respectively. Furthermore, characteristic SERS peaks of the
immobilized 1,4-BDT were shifted and broadened while others disappeared. These
changes arise because of the formation of surface complexes upon immobilization [36].

66
Within the range of tested surface coverages, from 10 to 10-fold excess, the highest
SERS signal was recorded at 100% 1,4-BDT.
Despite the presence of multilayers at 10-fold excess surface coverage, SERS signal
improved of only 18% compared to the one achieved at full monolayer surface coverage.
This is counterintuitive since SERS enhancement is a long-range effect and extends to
approx. 10 nm away from the metallic surface. Based on the distance dependence
decay, a contribution of the subsequent layers from 77% to 46% for a distance of 0.8
nm (second layer) to 2.4 nm (fourth layer), respectively, from the gold surface would be
expected [50]. However, it is worth mentioning that metallic surface only influences
chemically molecules in first layer. In addition, at large surface coverage, the adsorption
geometry may vary and the LSPR and the electromagnetic properties of the Raman
reporter may be affected [36]. The absence of the band at 536 cm-1 that usually dictates
the formation of S-S bond [106], the relatively low coating thickness of 0.8 nm of the
Raman reporter monolayer [51] and the protonation of thiol group at pH 6.5 - 7 further
implied that the formation of multilayers rather involved π-π stacking than S-S bond.
This explained the unaffected size and charge of GNPs.
4.2 Inert coating to prevent non-specific adsorption
In order to prevent non-specific interactions and for increased biocompatibility, the
inert, protective coating of PEG was necessary. Under the assumption that the more
complete the PEG functionalization, the better the stability and the reduction of non-
specific binding, 100% PEG surface coverage was only possible on GNPs without 1,4-
BDT. Then, the higher the surface coverage percentage of 1,4-BDT, the lower the
amount of PEG up to inhibition of its binding for 100% Raman reporter surface coverage.
Experimental results confirmed a progressively decreasing PEGylation process that
however involved even GNPs with full Raman reporter surface coverage. Chen et al.
showed that PEG conformation is dependent on its density [67]. At higher surface
coverages it stretches out in a brush conformation explaining the increased
hydrodynamic size up to 14 nm of GNPs functionalized with 0 to 25% 1,4-BDT (Figure
5A, see results, page 45). Conversely, at lower surface coverages it assumes a mushroom
configuration with a radius of gyration as low as 2.8 nm justifying the negligible change
67
in size of GNPs with 50 and 100% 1,4-BDT. However, GNPs with full Raman reporter
surface coverage were found to be noticeably prone to random aggregation after
conjugation of anti-EGFR antibody at surface coverages equal and higher than 3%.
Aggregation was accompanied by an increased average size of 140 nm (consistent with
the formation of dimers), a red shift as well as broadening of the SPR adsorption peak
and an optical density (OD) decrease of approx. 30% (Figure 14A, see results, page 53).
This indicated that the amount of PEG was too low to maintain GNPs stability. In the
worst-case, GNPs with full Raman reporter surface coverage underwent aggregation
followed by precipitation that was visibly detected by the change in color of the
suspension from red to violet or to transparent and OD decrease to the baseline. In
addition, GNPs with full Raman reporter surface coverage showed a stronger negative
charge (-33 ± 0.8 mV) (Figure 6A, see results, page 46). If on one hand, value < -30 mV
are known to make GNPs more stable due to electrostatic repulsions [107], on the other
hand the same particles displayed a high level of non-specific binding with cells similarly
to what observed in literature with quantum dots (QDs) [108], [109]. Moreover, the
higher the surface coverage percentage of 1,4-BDT, the higher the degree of non-
specific binding. Indeed, GNPs with 10 and 25% Raman reporter surface coverages
exhibited a reduction of non-specific interaction with the cell surface up to 100%. This
had less to do with the surface charge, which was still negative (-26 ± 2.5 and -31 ± 2.2
mV, respectively) than to the passivation of GNPs surface because of the presence of
PEG [108]. Nonetheless, decreasing the amount of Raman reporter to 10 and 25%
surface coverages on behalf of PEG resulted in the complete depletion of Raman
sensitivity after incubation of GNPs with cells. This could be overcome by increasing the
integration time (from 0.05 to 0.5 sec) or reducing the working distance (from 16.5 to
0.3 mm). However, both methods meant longer acquisition times and are not desirable
in view of the final clinical application.
Consistently to what discussed so far, 50% Raman reporter surface coverage was
identified as the percentage to achieve the optimal balance. In fact, despite a theoretical
value of approx. 30’000 molecules of PEG per GNP has also been reported by Qian et al.
to be necessary to stabilize gold colloids against aggregation [53], approx. 16’000 PEG
molecules were already sufficient to prevent aggregation. 80% reduction of non-specific
binding was observed on IMA2.1 incubated with anti-EGFR GNPs compared to the

68
particles with full Raman reporter surface coverage. Persisting non-specific binding in
BS153 incubated with unconjugated GNPs was attributed to highly negative
carboxylated GNPs (-34 ± 2.2 mV). A possible alternative to reduce non-specific binding,
without affecting Raman sensitivity, was acting on GNPs surface charge by the
deactivation of the residual carboxy-end terminated PEG with ethanolamine or aPEG.
This strategy has been successful adopted for QDs [109] where weakening the
electrostatic interactions led consequently to the reduction of non-specific binding with
cell membranes. Indeed, it worked successfully for unconjugated GNPs treated with
ethanolamine (Figure 17A, see results, page 56), whose non-specific binding was
completely suppressed. Though, a complete suppression of antibody activity after
deactivation of anti-EGFR GNPs was observed probably due to side reaction with the
anti-EGFR binding sites.
This confirmed that it is not necessary to functionalize every site on the surface of
nanoparticles to reduce non-specific binding as also defined by Benzten et al. [108] as
long as it is accompanied by the deactivation of negatively charged groups on GNPs
surface (either through antibody conjugation or blocking agents). Therefore, we suggest
using nanoparticles conjugated to a non-specific IgG as proper negative control for non-
specific binding.
At the same time, Raman sensitivity was reduced of 40% compared to the particles with
full Raman reporter surface coverage. However, it was high enough for a sharp
detection of GNPs detected in the picomolar range in agreement to what reported by
Kircher et al.[10].
4.3 Antibody concentration for improved active targeting
PEG surface coverage influenced the GNPs stability also in terms of the possible number
of antibodies conjugated. If, on one hand, GNPs with maximum surface coverage of
Raman reporter were susceptible to aggregation when antibody surface coverage was
equal or higher than 3%, on the other hand, GNPs with 10 or 25% Raman reporter
surface coverage allowed conjugation of antibody surface coverages up to 30%.
Independently on the amount of antibody used, the hydrodynamic size of anti-EGFR
GNPs compared to the unconjugated ones was compatible with its horizontal
69
orientation on the GNPs surface since the length of the IgG is approximately 7−10 nm
[110]. Despite conjugation protocol with ethyl dimethylaminopropyl carbodiimide (EDC)
/N-hydroxysulfosuccinimide (sulfo-NHS) did not allow to control the orientation of the
antibodies, they kept their functionality after conjugation. Even though increasing the
number of antibodies up to 10 times in the conjugation reaction gave rise to a higher
antibody content at the surface of GNPs, the conjugation efficiency remained
significantly low from 40 to 5% resulting in 64 and 84 antibodies per GNP, respectively.
Moreover, higher number of antibodies per GNP did not help enhancing the Raman
sensitivity if compared to the lower amount and suggested that the excess of antibodies
is not necessary for improved active binding of the GNPs to the cellular target. The
phenomenon in which increasing the number of antibodies per GNP does not increase
the binding affinity was already observed by Elias et al., who showed that an
intermediate ligand density provided statistically significant improvements in cell
binding in comparison to higher and lower densities [111]. This trend can be explained
by examining the state in which the EGFR resides on the cellular membrane. Needham
et al. have reported that EGFR exists as “receptor clusters” whose diameter goes from
8 (dimers) to 57 nm (homo-polymers of 10 receptors). Considering the calculated
number of antibodies and assuming a homogeneous distribution beside a straight and
site control orientation of the antibodies on GNPs, there would be a maximum distance
of 10 nm between two molecules. This would mean that only in case of dimers two
antibodies would be able to bind two close dimers while, in case of cluster, up to 5
antibodies would be occupied to bind several receptors in the same cluster preventing
other GNPs from binding to the same cluster. In real conditions, inhomogeneous
distribution and random orientation of the antibodies would rather increase the steric
hindrance causing competition between two close molecules for a single receptor and
limiting the access that antibodies have to the receptors [110]. Despite here retention
of functionality was shown, investigation of the number of antibodies with unaltered
functionality was not carried out and lack of control for ligand orientation could result
in antibodies with reduced or eliminated functionality thus altering the perceived
“functional” density of ligands. The size of GNPs has further to be considered since it is
almost 90 or 30% bigger compared to one dimer or one cluster, respectively. In this case,
the shielding would be due to cellular EGFR interaction with the nearby GNPs. The

70
considerations set out so far are summarized in figure 1.
Anti-EGFR GNPs showed stability in cell culture medium and negligible cytotoxicity on
GBM cells over a period of 24 h confirming what reported in literature [10]. GNPs
selective uptake by GBM tumor cells in culture was concentration and time-dependent
with the optimum incubation time fixed to 4 h. This is in agreement with their final
clinical application considering that GBM surgery lasts in average 4 h. Furthermore, anti-
EGFR GNPs allowed SERS based imaging of all EGFR-positive GBM cells, including cells
expressing EGFRvIII such as BS153, which were known not to show any fluorescence
after 5-ALA administration [15]. This opens a new chance to visualize even those GBM
or low-grade glioma that are known not to respond to 5-ALA treatment.
Figure 1. Illustration of the principal findings. A) Correlation between increasing 1,4-BDT surface coverages and Raman sensitivity, cellular binding specificity, applied concentration of anti-EGFR antibodies, acquisition speed and gold colloidal stability. Results are presented as relative percentage to the highest value recorded (100%) for each parameter. B) Possible organization of EGFR on the GBM cell membrane and interaction with anti-EGFR GNPs.
A
B
71
4.4 Crossing the BBB
Higher performance of anti-EGFR GNPs with 50% surface coverage of Raman reporter
and PEG presented in this study, especially in terms of detection sensitivity and binding
specificity, give reasons for further investigations in vivo using animal models before
moving to the final clinical application. However, a major criticism regarding the
injection of GNPs in vivo is their strongly limited delivery to the brain due to the BBB.
Thus, anti-EGFR GNPs showed to be able to cross the in vitro BBB model without altering
the barrier integrity. Indeed, about 0.1% of the initial applied concentration of GNPs was
found in the basolateral compartment of a transwell system mimicking the BBB after 24
h of incubation. This percentage needs to be improved but it was deemed promising
considering the 0.3% of 10 nm GNPs or 0% of 50 or 100 nm particles present in the brain
after intravenous administration in rats [65]. Furthermore, when working with an in
vitro BBB model like the one described, it is worth keeping in mind technical limitations
such as GNPs adhesion to the transwell pores of the filter or agglomeration within the
pores, thus obstructing the transport [101]. The estimation of the delivery through the
membrane could therefore be underestimated. Application of GNPs in animal models
would further address some critical issues that could limit their use such as long-term
stability in the blood circulation by escaping the opsonization processes, toxicity at
higher dosage, possible immune responses, biodistribution and elimination from the
body. Further, human EGFR-positive GBM cells xenograft in mice brains mimicking
closely the BBB could pave the way for a deeper and more reliable understanding of the
ability of anti-EGFR GNPs to reach their final targets. Despite in vivo exploration is
mandatory, the ability of SERS based imaging to visualize in vitro GBM cells with high
sensitivity and specificity, when GNPs are properly engineered, is promising for its
definitive implementation in the operation room to identify and remove residual cancer
cells for better outcomes of patients suffering from brain tumors.

72
73
5. Conclusions and outlooks
To achieve a complete resection of GBM during surgical operation, improved
visualization of residual cancer cells is indispensable. Raman based imaging, coupled
with GNPs as SERS tags, offers several advantages over current visualization
technologies as long as GNPs with high stability, Raman sensitivity and binding
specificity to tumor cells are produced. In view of this, this work provided a noteworthy
understanding of the influence that surface functionalization exerts on GNPs
performance for SERS based imaging. Non-toxic SERS tags were developed with several
ratios of inert and receptor specific active molecules. Full Raman reporter or PEG surface
coverage maximized Raman sensitivity and binding specificity, respectively. However,
these statements were valid only when considered individually. Therefore, the optimal
balance among all the functionalities was identified to allow a fast, sensitive and specific
Raman detection of GBM cells. It was even shown that higher amounts of antibody on
the GNPs surface did not improve the cellular binding stressing that the optimal ligand
concentration does not always match the highest. In addition, the ability of anti-EGFR
GNPs to cross a BBB model in vitro was attested.
With regards to GBM, whose challenging treatment pushed the start of this study, the
results revealed the potential of SERS based imaging to visualize GBM or low-grade
gliomas, which show variable fluorescence or do not respond after 5-ALA
administration. Moreover, they would justify further in vivo experiments using animal
models. A possible strategy would also involve the conjugation of more than one moiety
on GNPs either to target two different cell types within the same tumor or to improve
specificity toward a single cancer cell type prone to extreme heterogeneity of
overexpressed cell surface receptors, as observed in GBM. Even using GNPs with rod
shape could be beneficial since it would reduce significantly the size (approx. 3 times
smaller) of conjugated particles facilitating their ability to cross the BBB and to reach
their targets.

74
The considerations raised in this work can be extended to the visualization of any other
kind of tumor and to any other application implying the use of GNPs. By clarifying the
effect of surface chemistry on SERS tags specificity, affinity and sensitivity, this work
adds new aspect to the current literature. It also highlights the need to perform a
detailed characterization of SERS tags to clearly distinguish between theoretical added
functionalities and the ones effectively present on the surface of the nanoparticles. Only
the conscious knowledge of SERS tags properties allows to achieve a system with high
reproducibility and reliability to give to the clinicians an adequate tool to reduce the
occurrence of relapses thus improving patients survival.

75
76
6. Materials and methods
6.1 Nanoparticles functionalization
Ultrapure water (18.2 mΩ/cm) was used throughout the work. GNPs suspension,
dimethyl sulfoxide (DMSO) and 0.1 mM phosphate buffered saline (PBS) were degassed
under nitrogen in the ultrasound for 1 h. Citrate stabilized GNPs (60 nm diameter) were
used. Raman reporter, 1,4-BDT, was dissolved in DMSO and 0, 1, 2, 4 or 40 µl of 1 mM
solution were added to 1 ml of GNPs suspension (1.9 x 10¹⁰ particles per ml) and
sonicated for 1 h at 25°C. 400 µl of 0.4 µM cPEG (3.5 kDa) solution were added to the
Raman active GNPs before sonication for 1 h at 25°C followed by mixing for 4 h at 25°C
at 750 rpm. 600 µl of 10 µM mPEG (5 kDa) were added and samples were incubated
overnight at 25°C at 750 rpm. To remove the excess of PEG, samples were centrifuged
for 30 min at 4’500 rpm and resuspended in 1 ml of 0.1 mM PBS. To activate the carboxy
groups, 200 µl of 5 µM EDC/sulfo-NHS mixture were added to the samples and mixed
for 20 min at 25°C at 750 rpm. To remove the excess of EDC/sulfo-NHS, samples were
centrifuged for 30 min at 4’500 rpm and resuspended in 0.5 ml of 20 mM 4-(2-
hydroxyethyl)-1-piperazineethanesulfonic acid (HEPES) buffer, pH 7.4. Activated
carboxy groups were covalently linked to 4, 10 or 40 µl of 200 µg/ml rabbit anti-EGFR
antibody (10001-R021) for 2 h at 25° C at 750 rpm and the mixture was kept overnight
at 4°C. Unbound antibodies were separated from anti-EGFR GNPs by two
centrifugations for 30 min at 4’500 rpm. The final pellet was resuspended in 0.1 mM PBS
and stored at 4°C. Unconjugated GNPs were synthetized by using the same procedure
but 0.1 mM PBS was added instead of anti-EGFR antibodies. To modulate surface charge
of GNPs, 1% (v/v) ethanolamine or 1 µl of 1.5 mM solution of aPEG (750 Da) was added
to anti-EGFR and unconjugated GNPs either after 2 h or overnight incubation of GNPs
with anti-EGFR antibodies. All chemicals were purchased from Sigma-Aldrich, except
77
mPEG and anti-human EGFR antibody that were obtained from Rapp polymere and Sino
biological, respectively.
6.1.1 Nanoparticles characterization
UV-Vis spectra were acquired in the range 400-700 nm, 1 nm step, with Sinergy H1
microplate reader (BioTek Instrument, GmbH). GNPs concentration was calculated by
using a calibration curve (R2=0.9988) from known concentrations of bare GNPs and
relative absorbance at 450 nm.
Hydrodynamic size distribution by Dynamic light scattering and zeta potential were
determined with Zetasizer ZS dynamic light scattering instrument (Malvern Panalytical
Ltd, UK). Each sample was measured at 25°C, pH 7.
For transmission electron microscopy analysis, 2 µl of bare GNPs were placed onto
standard 3.5 mm transmission electron microscopy grid (Formvar/Carbon 200 Mesh,
Copper grids). After drying, grid was rinsed with milliQ water and visualized with EM 900
transmission electron microscope (Zeiss), acceleration voltage 50 kV.
SERS spectra of dry GNPs were recorded with confocal Raman alpha300 R microscope
(Witec, GmbH, Germany) equipped with a 785 nm excitation wavelength. Laser power
was set at 50 mW with an integration time of 0.5 sec, 10 accumulations, 50x objective
unless otherwise specified. Spectra were processed with Witec Project 4.1 software.
ICP-MS was used to quantify the amount of gold and thiol ligand (by sulfur
measurement). To avoid overestimation of sulfur, GNPs were functionalized as
described above but acetone, instead of DMSO, was used to dissolve 1,4-BDT.
Quantification was carried out using an external calibration from single-element
standards (Sigma-Aldrich) prepared in milliQ water from 0-100 µg/L. Samples were
diluted accordingly and analyzed with 8800 ICP-qqq-MS system (Agilent technologies).
Au quantification was performed on 197Au+ using helium as a collision gas (5 ml/min),
78
32S+ was measured in triple quad mass-shift mode using O2 as a reaction gas. 103Rh+ was
used as an internal standard to account for possible matrix effects.
6.1.2 Quantification of the number of antibodies per nanoparticle
To quantify the number of antibodies per GNP, an excess of Alexa Fluor® 680 goat anti-
rabbit antibody (Invitrogen) was added to the anti-EGFR and unconjugated GNPs.
Known concentrations of the antibody were used to prepare a standard curve. Samples
and the standards were mixed for 1 h at 25°C at 450 rpm. Samples were then washed
twice with PBS 0.1 mM for 15 min at 4’500 rpm to remove any residual free antibody.
Fluorescence detection was performed with Odyssey® CLx infrared imaging system (Li-
cor, Biosciences). The fluorescence of unconjugated GNPs was used to estimate the
fluorescence signal due to absorbance by GNPs and the non-specific binding of
secondary antibody. The number of antibodies per GNP was determined by using the
calibration curve (R2=0.98581) and by normalizing the result to total amount of GNPs in
the sample as measured by absorbance values.
6.1.3 Nanoparticles optical stability in cell culture medium
To evaluate the impact of biological media on GNPs stability, anti-EGFR and
unconjugated GNPs were diluted 1:2 in DMEM (Sigma-Aldrich) supplemented with 10%
FCS (Sigma-Aldrich) and 1% penicillin–streptomycin (P/S) (Sigma-Aldrich). Samples were
run for 24 h at 37°C at 450 rpm. Absorbance at 450 nm was measured after 0, 1, 2, 4, 6,
8 and 24 h.
6.1.4 Immuno dot blot
Antibody functionality after conjugation onto GNPs was evaluated by immuno dot blot.
2 µl of 250 µg/ml human recombinant EGFR (Sino Biological) were spotted onto
nitrocellulose membrane (GE Healthcare). After blocking with 1% (w/v) dry milk for 30
min at room temperature (RT), membrane was incubated with 70 µl of 40 µg/ml anti-
EGFR or unconjugated GNPs for 3 h at RT. Membrane was washed three times for 5 min
79
with blocking solution and the presence of bound GNPs (bright pink spot) was visually
evaluated.
6.2 Cell culture
The following cell lines were used to carry out in vitro experiments: the human GBM cell
line U87MG was obtained from ATCC; the human GBM cell line BS153 was provided by
Prof. Monika Hegi (University Hospital Lausanne, Switzerland); the human GBM cell line
LN229, overexpressing the EGFR gene (LN229wtEGFR), was provided by Prof. Michael
Weller (University Hospital Zürich, Switzerland); the immortalized astrocyte cell line
IMA2.1 was provided by Dr. Stefan Schildknecht (University of Konstanz, Germany) and
was used as EGFR-negative cell line. Cells were cultured in DMEM, supplemented with
10% FCS and 1% P/S. To maintain high EGFR expression level in LN229wtEGFR, medium
was enriched with 60 µg/ml hygromycin B (Sigma-Aldrich). All the cells were kept at
37°C, in a 5% CO2 atmosphere.
6.2.1 Fluorescence staining
Cellular EGFR expression was investigated by fluorescent immunocytochemistry. At 80%
confluency, cells were fixed with 4% (v/v) paraformaldehyde (PFA) (Thermofisher
Scientific) for 10 min at RT and permeabilized with 0.2% (v/v) Triton X-100 in PBS + 5%
(v/v) normal donkey serum (NDS) for 20 min at RT. Cells were incubated with rabbit anti-
human EGFR antibody, diluted 1:250, overnight at 4°C, then with FITC donkey anti-
rabbit antibody (Jackson ImmunoResearch), diluted 1:300, for 1 h at RT. Cell nuclei were
stained with 300 nM DAPI (Sigma-Aldrich) added to the secondary antibody. Slides were
mounted in FluorSave™ Reagent (Calbiochem) and pictures taken with a F-View camera
coupled to DMRE microscope (Leica Microsystem). Washings with PBS were performed
between each step for 5 min each.
6.2.2 Western blot
Cellular EGFR expression was evaluated by western blot. Whole-cell extracts were
obtained by lysing cell pellets in radioimmunoprecipitation assay buffer enriched with
80
protease inhibitors (Sigma-Aldrich), diluted 1:100. Protein concentration was
determined using the bicinchoninic acid protein assay kit (Thermofisher Scientific). 30
µg of protein extracts were separated in a 8% precast polyacrylamide gel (Invitrogen)
and transferred onto polyvinylidene difluoride (PVDF) membrane (Merk Millipore) by
wet electroblotting. Membrane was blocked with Odyssey® blocking buffer (Li-cor,
Biosciences) for 1 h at RT and incubated with rabbit anti-human EGFR and goat anti-
human actin antibodies (Abcam), diluted 1:500 and 1:1’000 respectively, overnight at
4°C. IRDye® 680 donkey anti-goat (Li-cor, Biosciences) and Alexa Fluor® 680 goat anti-
rabbit antibodies, diluted 1:10’000, were then added for 1h at RT. Blot was scanned with
Odyssey® CLx infrared imaging system (Li-cor, Biosciences). Washings with PBS-T were
performed between each step for 5 min each.
For the evaluation of antibody functionality after conjugation onto GNPs, human
recombinant EGFR protein (1.9 µg) was separated in a 8% precast polyacrylamide.
Protein was transferred onto PVDF membrane by wet electroblotting and incubated
with anti-EGFR or unconjugated GNPs for 3 h at RT. Anti-EGFR antibodies on GNPs were
probed with Alexa Fluor® 680 goat anti-rabbit antibody, diluted 1:10’000. Blot was then
scanned with Odyssey® CLx infrared imaging system (Li-cor, Biosciences).
6.2.3 Quantitative expression of EGFR at the cell membrane
To quantify EGFR expressed at the cell membrane of each cell line, qFACS was
performed by using QIFIKIT®* (Dako) according to the manufacturer’s instructions.
Briefly, 106 cells/ml were incubated with a saturating concentration (1 µg/ml) of mouse
anti-human EGFR antibody (BioXCell) for 1 h at 4°C in the dark. Incubation without
primary antibody served as negative control. To prevent EGFR internalization, cells were
washed for 5 min at 4°C at 2’500 rpm and fixed with 1% PFA for 10 min at RT and
incubated with FITC goat anti-mouse antibody (supplied in the kit) diluted 1:50 for 45
min at 4°C in the dark. Cells were centrifuged three times for 5 min at 4°C at 2’500 rpm
and resuspended in 0.1 M Ethylenediaminetetraacetic acid + 1% (w/v) bovine serum
albumin (BSA). Cells were analyzed with CytoFlex S flow cytometer (Beckman Coulter).
Data were subsequently processed with FlowJo 10.4 software. EGFR density/cell was
81
obtained by comparing the mean fluorescence intensity (MFI) of the cells to the MFI of
five populations of calibration beads with known numbers of antibody binding sites used
to generate a standard curve. Values were corrected for the autofluorescence signal of
cells and for unspecific binding of the secondary antibody on negative controls.
6.2.4 GNPs cytotoxicity
To determine GNPs cytotoxicity, LN229wtEGFR were plated at a density of 1 x 10³
cell/well in a 384 well plate and allowed to attach for 2 h at 37C. Then, 4 x 10⁵ anti-
EGFR GNPs/cell were added to each well. Cells incubated only with medium were used
as control. After 24 h of incubation, 100 µl of fresh phenol free-DMEM (Thermofisher
Scientific) containing 10% of cell counting kit 8 reagent (Sigma-Aldrich) were added to
each well for 3 h at 37C. The amount of formazan dye generated, directly proportional
to the number of live cells, was measured with Sinergy H1 microplate reader at 450 nm.
Cell viability was calculated as the ratio of the absorbance of the samples incubated with
GNPs to that of the control and expressed as percentage of untreated control cells.
6.3 In vitro cancer cell targeting
To investigate the specificity of particle binding, EGFR-positive GBM and EGFR-negative
cells were grown into 8 wells chamber slide until confluence. Anti-EGFR or unconjugated
GNPs were added to each well at the concentration range of 5-70 µg/ml over 24 h. 30
min before the end of the incubation time, cells were incubated with 50 nM
LysoTracker™ Deep Red (Thermofisher Scientific). To remove unbound GNPs, cells were
washed three times with PBS for 10 min and fixed with 4% PFA for 10 min at RT. Staining
of anti-EGFR GNPs was performed by using Alexa Fluor® 488 donkey anti-rabbit
antibody (Abcam), diluted 1:250, for 1 h at RT. Cell nuclei were stained with 300 nM
DAPI (Sigma-Aldrich) added to the secondary antibody.
Raman measurements were carried out with confocal Raman alpha300 R microscope
(Witec, GmbH, Germany) equipped with a 785 nm excitation wavelength. Laser power
was set at 25 mW with an integration time of 0.05 sec, 50x objective. Raman maps were
82
generated by plotting the SERS signals of 1,4-BDT bands at 1’058 cm-1 and 1’556 cm-1.
Fluorescence images were acquired from the same sample spots for comparison with
their SERS images. For quantification of SERS signal, pictures of three random areas for
each specimen were converted in 16-bit images and quantify with Image j software.
Area (1’000 x 500 pixel), % area was used for comparison, gray value threshold 35-
65’535.
Cellular distribution of anti-EGFR GNPs was investigated with laser confocal scanning
microscope FV1000D (Olympus). Pictures were analyzed with Image J software.
Dark field analysis was done using hyperspectral imaging system (VNIR Version,
CytoViva, Inc, US).
Cellular uptake of GNPs was investigated by transmission electron microscopy imaging.
Briefly, 3.5 x 10⁶ BS153 and IMA2.1 cells were seeded into 100-cm plate overnight. 10
µg/ml of anti-EGFR or unconjugated GNPs were added for 4 h under agitation. Cells
were washed three times with PBS for 10 min and fixed with 1:1 (v/v) medium-double
strength fixative mixture for 20 min. Cells were harvested using a cell scraper and
centrifuged at 600 rpm for 5 min. Supernatant was replaced with single strength fixative
for at least 45 min. Cells were washed three times and resuspended in cold washing
buffer.
Double strength fixative in normal strength buffer (0.1 M): 4% PFA (Electron Microscope
Science) + 5% Glutaraldehyde (GA, Electron Microscope Science) in 0.1 M piperazine-
N,N′-bis(2-ethanesulfonic acid) (PIPES, Sigma-Aldrich) buffer pH 7.0-7.2. Single strength
fixative: 2% PFA + 2.5% GA in 0.1 M PIPES buffer pH 7.0-7.2. Washing buffer: 0.1M PIPES
buffer pH7.0-7.2.
The following steps were performed at the BioEM lab (C-Cina, University of Basel). Fixed
cells were embedded in agarose (Sigma-Aldrich), post-fixed in 1% buffered osmium
tetroxide (Electron Microscope Science) for 1 h at 4C and stained with aqueous uranyl
acetate (Electron Microscope Science) for 1 h at 4C in the dark. Samples were
dehydrated in an ethanol series (30, 50, 75, 95 and 100%), washed in acetone and finally
embedded in pure Epon 812 resin (Electron Microscope Science) for 48 h at 60C. Cut
83
sections were placed on copper grids and observed with FEI Tecnai T12 transmission
electron microscope operating at 80 kV. Images were recorded using a CCD Veleta
digital camera.
6.4 In vitro BBB model
The human endothelial cell line hCMEC/D3 was provided by Prof. Luc Stoppini (Hepia-
Haute ecole du paysage, d'ingenierie et d'architecture de Geneve, Geneva, Switzerland).
Cells were cultured in EndoGROTM-MV complete medium Kit (Millipore, SCME004)
supplemented with 1 ng/ml FGF-2 (Thermofisher Scientific) in flasks pre-coated with
collagen type I solution diluted 1:20 (Sigma-Aldrich), and kept at 37°C, in a 5% CO2
atmosphere. To establish the BBB model, 6.5 mm transwell with 0.4 μm pore polyester
membrane inserts were used (Sigma, CLS3470). 2 x 10⁴ cells were seeded on the apical
surface of the membrane, pre-coated with collagen at density of 10 µg/cm2 and grown
up to 12 days.
6.4.1 Fluorescence staining of TJs
Formation of a tight monolayer was evaluated by detecting the expression of TJs
proteins ZO-1 and claudin-5. After 5 days of culture, inserts were fixed with 2% PFA for
10 min at RT, permeabilized with 0.1% Triton X-100 in PBS for 5 min and blocked with
3% BSA in PBS for 1 h at RT. Cells were incubated with Alexa Fluor® 488 mouse anti-
human ZO-1 (Invitrogen, ZO1-1A12) and rabbit anti-human claudin-5 antibodies
(Abcam), diluted 1:50 and 1:100 respectively, overnight at 4°C, then with Alexa Fluor®
546 goat anti-rabbit antibody (Invitrogen), diluted 1:500, for 45 min at RT. Cell nuclei
were stained with 300 nM DAPI for 15 min at RT. Cells were mounted in FluorSave™
Reagent and pictures taken with an AxioCam MRm camera coupled to Axiovert 40 CFL
microscope (Zeiss). Washings with PBS were performed between each step for 5 min
each.
84
6.4.2 TEER measurement
Beside traditional permeability assay, the formation of a continuous and tight
monolayer was monitored by measuring the TEER. Inserts with hCMEC/D3 cells and with
collagen only as control were placed into “cellware” plate, a prototype developed by
the group of Prof. Luc Stoppini (Hepia, Geneva, Switzerland). It is provided with an
adaptor to be used with CellZscope system (nanoAnalytics, GmbH). Since TEER values
are highly temperature sensitive, the plate was placed in the incubator and let to
equilibrate at 37°C overnight. The day after, values were recorded in real-time every 4
h and analyzed with the CellZscope software.
6.4.3 BBB permeability assay
To assess the tightness of cell monolayer, paracellular permeability of LY CH dipotassium
salt (Sigma-Aldrich) was investigated. Inserts with hCMEC/D3 cells and with collagen
only as control were moved into new 24 wells plate containing 600 µl of pre-warmed
cell culture medium. 100 µl of 10 µg/ml LY solution were added to the apical chamber
of the insert and the plate was placed on an orbital shaker at 100 rpm, at 37°C for 1h.
Then 100 µl aliquots were collected from the basolateral chamber and LY fluorescence
was read at ʎex 428 nm and ʎem 540 nm with FlexStation 3 (Molecular Device, LCC).
Amount of LY was determined using a calibration curve generated with known
concentration of LY diluted in cell culture medium. Apparent permeability coefficient
(Papp) was calculated in cm/s according to the following equation: Papp (cm/s) =
VB/(ACAO) x (ΔCB/ΔT), where VB is the volume in the basolateral chamber, A is the surface
area of the filter, CAO is the initial concentration in the apical chamber, ΔCB/ΔT is the
change of concentration in the basolateral chamber over time.
6.4.4 Permeation of GNPs through the BBB
After 7 days of culture, the medium in the apical chamber was replaced with 150 l of
10 or 35 g/ml of anti-EGFR GNPs to investigate their transport through the BBB. Plate
was placed on an orbital shaker at 100 rpm at 37°C for 24 h. At the end of the incubation,
85
medium was collected from the basolateral compartment and the amount of gold
measured by ICP-MS.
6.5 Statistical analysis
Data evaluation was performed with GraphPad Prism 8 (GraphPad Software, inc.) and
results are presented as means ± standard deviation (SD) of three independent
experiments, unless otherwise specified. The Student t test was used for comparison
between two groups, P<0.05 was considered significant. Data from three or more
groups were analyzed by one or two-way ANOVA analysis with Dunnet’s multiple
comparisons test.

86
87
References
1. I. Jovčevska, N. Kočevar, and R. Komel, “Glioma and glioblastoma - how much
do we (not) know?,” Mol. Clin. Oncol., vol. 1, no. 6, pp. 935–941, Nov. 2013.
2. R. Henriksson, T. Asklund, and H. S. Poulsen, “Impact of therapy on quality of life,
neurocognitive function and their correlates in glioblastoma multiforme: a review,” J. Neurooncol., vol. 104, no. 3, pp. 639–646, Sep. 2011.
3. “About Brain Tumors - Learn More or Donate Today! | ABTA,” American Brain
Tumor Association. https://www.abta.org/about-brain-tumors. 4. “Surgery for Cancer,” National Cancer Institute, 29-Apr-2015.
https://www.cancer.gov/about-cancer/treatment/types/surgery. 5. H. Karabeber et al., “Guiding Brain Tumor Resection Using Surface-Enhanced
Raman Scattering Nanoparticles and a Hand-Held Raman Scanner,” ACS Nano, vol. 8, no. 10, pp. 9755–9766, Oct. 2014.
6. D. G. Barone, T. A. Lawrie, and M. G. Hart, “Image guided surgery for the
resection of brain tumours,” Cochrane Database Syst. Rev., Jan. 2014. 7. S. Hu, H. Kang, Y. Baek, G. El Fakhri, A. Kuang, and H. S. Choi, “Real-Time Imaging
of Brain Tumor for Image-Guided Surgery,” Adv. Healthc. Mater., vol. 7, no. 16, p. 1800066, Aug. 2018.
8. D. A. Orringer, A. Golby, and F. Jolesz, “Neuronavigation in the surgical
management of brain tumors: current and future trends,” Expert Rev. Med. Devices, vol. 9, no. 5, pp. 491–500, Sep. 2012.
9. C. Senft, A. Bink, K. Franz, H. Vatter, T. Gasser, and V. Seifert, “Intraoperative MRI
guidance and extent of resection in glioma surgery: a randomised, controlled trial,” Lancet Oncol., vol. 12, no. 11, pp. 997–1003, Oct. 2011.
10. M. F. Kircher et al., “A brain tumor molecular imaging strategy using a new triple-
modality MRI-photoacoustic-Raman nanoparticle,” Nat. Med., vol. 18, no. 5, pp. 829–834, May 2012.
11. L. G. Tataranu et al., “Current Trends in Glioblastoma Treatment,” in Brain
Tumors - An Update, A. Agrawal and L. R. Moscote-Salazar, Eds. InTech, 2018. 12. N. Erdoğan, B. Tucer, E. Mavili, A. Menkü, and A. Kurtsoy, “Ultrasound guidance
in intracranial tumor resection: correlation with postoperative magnetic resonance findings,” Acta Radiol., vol. 46, no. 7, pp. 743–749, Nov. 2005.

88
13. M. Ottenhausen, S. M. Krieg, B. Meyer, and F. Ringel, “Functional preoperative
and intraoperative mapping and monitoring: increasing safety and efficacy in glioma surgery,” Neurosurg. Focus, vol. 38, no. 1, p. E3, Jan. 2015.
14. W. Stummer and E. Suero Molina, “Fluorescence Imaging/Agents in Tumor
Resection,” Neurosurg. Clin. N. Am., vol. 28, no. 4, pp. 569–583, Oct. 2017. 15. A. O. Fontana et al., “Epithelial growth factor receptor expression influences 5-
ALA induced glioblastoma fluorescence,” J. Neurooncol., vol. 133, no. 3, pp. 497–507, Jul. 2017.
16. P. Schucht et al., “5-ALA complete resections go beyond MR contrast
enhancement: shift corrected volumetric analysis of the extent of resection in surgery for glioblastoma,” Acta Neurochir. (Wien), vol. 156, no. 2, pp. 305–312, Feb. 2014.
17. K. Roessler, A. Becherer, M. Donat, M. Cejna, and I. Zachenhofer, “Intraoperative
tissue fluorescence using 5-aminolevolinic acid (5-ALA) is more sensitive than contrast MRI or amino acid positron emission tomography (18 F-FET PET) in glioblastoma surgery,” Neurol. Res., vol. 34, no. 3, pp. 314–317, Apr. 2012.
18. W. Stummer, U. Pichlmeier, T. Meinel, O. D. Wiestler, F. Zanella, and H.-J. Reulen,
“Fluorescence-guided surgery with 5-aminolevulinic acid for resection of malignant glioma: a randomised controlled multicentre phase III trial,” Lancet Oncol., vol. 7, no. 5, pp. 392–401, May 2006.
19. A. Nabavi et al., “Five-aminolevulinic acid for fluorescence-guided resection of
recurrent malignant gliomas: a phase ii study,” Neurosurgery, vol. 65, no. 6, pp. 1070–1077, Dec. 2009.
20. C. G. Hadjipanayis, G. Widhalm, and W. Stummer, “What is the Surgical Benefit
of Utilizing 5-Aminolevulinic Acid for Fluorescence-Guided Surgery of Malignant Gliomas?:,” Neurosurgery, vol. 77, no. 5, pp. 663–673, Nov. 2015.
21. S. Utsuki et al., “Possibility of using laser spectroscopy for the intraoperative
detection of nonfluorescing brain tumors and the boundaries of brain tumor infiltrates,” J. Neurosurg., vol. 104, no. 4, pp. 618–620, Apr. 2006.
22. S. Utsuki et al., “Histological Examination of False Positive Tissue Resection Using
5-Aminolevulinic Acid-Induced Fluorescence Guidance,” Neurol. Med. Chir. (Tokyo), vol. 47, no. 5, pp. 210–214, 2007.
23. L.-C. Huang et al., “Glioblastoma cells labeled by robust Raman tags for
enhancing imaging contrast,” Biomed. Opt. Express, vol. 9, no. 5, p. 2142, May 2018.
89
24. M. Reinert et al., “Quantitative Modulation of PpIX Fluorescence and Improved Glioma Visualization,” Front. Surg., vol. 6, p. 41, Jul. 2019.
25. P. A. Valdés, D. W. Roberts, F.-K. Lu, PhD, and A. Golby, “Optical technologies for
intraoperative neurosurgical guidance,” Neurosurg. Focus, vol. 40, no. 3, p. E8, Mar. 2016.
26. B. Zhang, X. Wang, F. Liu, Y. Cheng, and D. Shi, “Effective Reduction of
Nonspecific Binding by Surface Engineering of Quantum Dots with Bovine Serum Albumin for Cell-Targeted Imaging,” Langmuir, vol. 28, no. 48, pp. 16605–16613, Dec. 2012.
27. I. P. Santos et al., “Raman spectroscopy for cancer detection and cancer surgery
guidance: translation to the clinics,” The Analyst, vol. 142, no. 17, pp. 3025–3047, 2017.
28. M. Ji et al., “Rapid, Label-Free Detection of Brain Tumors with Stimulated Raman
Scattering Microscopy,” Sci. Transl. Med., vol. 5, no. 201, pp. 201ra119-201ra119, Sep. 2013.
29. S. N. Kalkanis et al., “Raman spectroscopy to distinguish grey matter, necrosis,
and glioblastoma multiforme in frozen tissue sections,” J. Neurooncol., vol. 116, no. 3, pp. 477–485, Feb. 2014.
30. M. Jermyn et al., “Intraoperative brain cancer detection with Raman
spectroscopy in humans,” Sci. Transl. Med., vol. 7, no. 274, pp. 274ra19-274ra19, Feb. 2015.
31. R. Huang et al., “High Precision Imaging of Microscopic Spread of Glioblastoma
with a Targeted Ultrasensitive SERRS Molecular Imaging Probe,” Theranostics, vol. 6, no. 8, pp. 1075–1084, 2016.
32. X. Gao et al., “Guiding Brain-Tumor Surgery via Blood-Brain-Barrier-Permeable
Gold Nanoprobes with Acid-Triggered MRI/SERRS Signals,” Adv. Mater., vol. 29, no. 21, p. 1603917, Jun. 2017.
33. N. D. Israelsen, C. Hanson, and E. Vargis, “Nanoparticle Properties and Synthesis
Effects on Surface-Enhanced Raman Scattering Enhancement Factor: An Introduction,” Sci. World J., vol. 2015, pp. 1–12, 2015.
34. T. A. Zdobnova, E. N. Lebedenko and S. М. Deyev, “Quantum Dots for Molecular
Diagnostics of Tumors,” Acta Naturae, vol. 3, no. 1, pp. 29–47, Mar. 2011. 35. R. P. Bagwe, L. R. Hilliard, and W. Tan, “Surface Modification of Silica
Nanoparticles to Reduce Aggregation and Nonspecific Binding,” Langmuir, vol. 22, no. 9, pp. 4357–4362, Apr. 2006.

90
36. E. C. Le Ru and P. G. Etchegoin, Principles of surface-enhanced Raman spectroscopy: and related plasmonic effects, 1st ed. Amsterdam ; Boston: Elsevier, 2009.
37. “Theory of Raman Scattering - B&W Tek.” https://bwtek.com/raman-theory-of-
raman-scattering/. 38. L. Wei and W. Min, “Electronic Preresonance Stimulated Raman Scattering
Microscopy,” J. Phys. Chem. Lett., vol. 9, no. 15, pp. 4294–4301, Aug. 2018. 39. “What is resonance Raman spectroscopy? - HORIBA.”
https://www.horiba.com/us/en/scientific/products/ramanspectroscopy/raman academy/raman-faqs/what-is-resonance-raman-spectroscopy/.
40. C. S. Liao and J. X. Cheng, “Probing Cancer by Exploiting Spontaneous and
Stimulated Raman Scattering”. https://www.photonics.com/Articles/Probing_ Cancer_ by_ Exploiting_ Spontaneous_ and/a61678.
41. “International Journal of Engineering and Technical Research (IJETR),” Raman
Spectrosc., vol. 6, no. 1, p. 16, 2016. 42. F. Madzharova, Z. Heiner, and J. Kneipp, “Surface enhanced hyper Raman
scattering (SEHRS) and its applications,” Chem. Soc. Rev., vol. 46, no. 13, pp. 3980–3999, 2017.
43. H. Wei, S. M. Hossein Abtahi, and P. J. Vikesland, “Plasmonic colorimetric and
SERS sensors for environmental analysis,” Environ. Sci. Nano, vol. 2, no. 2, pp. 120–135, 2015.
44. T. Yin, L. Jiang, and Z. Shen, “Recent progress on photoluminescence from
plasmonic nanostructures: Phenomenon, mechanism, and application,” Chin. Phys. B, vol. 27, no. 9, p. 097803, Sep. 2018.
45. E. Petryayeva and U. J. Krull, “Localized surface plasmon resonance:
Nanostructures, bioassays and biosensing—A review,” Anal. Chim. Acta, vol. 706, no. 1, pp. 8–24, Nov. 2011.
46. A. J. McQuillan, “The discovery of surface-enhanced Raman scattering,” Notes
Rec. R. Soc., vol. 63, no. 1, pp. 105–109, Mar. 2009. 47. Pilot, Signorini, Durante, Orian, Bhamidipati, and Fabris, “A Review on Surface-
Enhanced Raman Scattering,” Biosensors, vol. 9, no. 2, p. 57, Apr. 2019. 48. S. Abalde-Cela, P. Aldeanueva-Potel, C. Mateo-Mateo, L. Rodríguez-Lorenzo, R.
A. Alvarez-Puebla, and L. M. Liz-Marzán, “Surface-enhanced Raman scattering biomedical applications of plasmonic colloidal particles,” J. R. Soc. Interface, vol. 7, no. suppl_4, Aug. 2010.
91
49. M. Moskovits, “Surface-enhanced Raman spectroscopy: a brief retrospective,” J.
Raman Spectrosc., vol. 36, no. 6–7, pp. 485–496, Jun. 2005. 50. J. A. Dieringer et al., “Introductory Lecture : Surface enhanced Raman
spectroscopy: new materials, concepts, characterization tools, and applications,” Faraday Discuss, vol. 132, pp. 9–26, 2006.
51. N. Gandra and S. Singamaneni, “Bilayered Raman-Intense Gold Nanostructures
with Hidden Tags (BRIGHTs) for High-Resolution Bioimaging,” Adv. Mater., vol. 25, no. 7, pp. 1022–1027, Feb. 2013.
52. G. von Maltzahn et al., “SERS-Coded Gold Nanorods as a Multifunctional
Platform for Densely Multiplexed Near-Infrared Imaging and Photothermal Heating,” Adv. Mater., vol. 21, no. 31, pp. 3175–3180, Aug. 2009.
53. X. Qian et al., “In vivo tumor targeting and spectroscopic detection with surface-
enhanced Raman nanoparticle tags,” Nat. Biotechnol., vol. 26, no. 1, pp. 83–90, Jan. 2008.
54. S. Lee et al., “Biological Imaging of HEK293 Cells Expressing PLCγ1 Using Surface-
Enhanced Raman Microscopy,” Anal. Chem., vol. 79, no. 3, pp. 916–922, Feb. 2007.
55. X. Qian, S. R. Emory, and S. Nie, “Anchoring Molecular Chromophores to Colloidal
Gold Nanocrystals: Surface-Enhanced Raman Evidence for Strong Electronic Coupling and Irreversible Structural Locking,” J. Am. Chem. Soc., vol. 134, no. 4, pp. 2000–2003, Feb. 2012.
56. K. K. Maiti et al., “Development of biocompatible SERS nanotag with increased
stability by chemisorption of reporter molecule for in vivo cancer detection,” Biosens. Bioelectron., vol. 26, no. 2, pp. 398–403, Oct. 2010.
57. L. Jiang, J. Qian, F. Cai, and S. He, “Raman reporter-coated gold nanorods and
their applications in multimodal optical imaging of cancer cells,” Anal. Bioanal. Chem., vol. 400, no. 9, pp. 2793–2800, Jul. 2011.
58. S. Keren, C. Zavaleta, Z. Cheng, A. de la Zerda, O. Gheysens, and S. S. Gambhir,
“Noninvasive molecular imaging of small living subjects using Raman spectroscopy,” Proc. Natl. Acad. Sci., vol. 105, no. 15, pp. 5844–5849, Apr. 2008.
59. J. V. Jokerst, T. Lobovkina, R. N. Zare, and S. S. Gambhir, “Nanoparticle PEGylation
for imaging and therapy,” Nanomed., vol. 6, no. 4, pp. 715–728, Jun. 2011. 60. C.-C. Huang, C.-H. Huang, I.-T. Kuo, L.-K. Chau, and T.-S. Yang, “Synthesis of silica-
coated gold nanorod as Raman tags by modulating cetyltrimethylammonium bromide concentration,” Colloids Surf. Physicochem. Eng. Asp., vol. 409, pp. 61–

92
68, Sep. 2012. 61. R. Karim, C. Palazzo, B. Evrard, and G. Piel, “Nanocarriers for the treatment of
glioblastoma multiforme: Current state-of-the-art,” J. Controlled Release, vol. 227, pp. 23–37, Apr. 2016.
62. A. Meola, J. Rao, N. Chaudhary, M. Sharma, and S. D. Chang, “Gold Nanoparticles
for Brain Tumor Imaging: A Systematic Review,” Front. Neurol., vol. 9, p. 328, May 2018.
63. B. Aslan, B. Ozpolat, A. K. Sood, and G. Lopez-Berestein, “Nanotechnology in
cancer therapy,” J. Drug Target., vol. 21, no. 10, pp. 904–913, Dec. 2013. 64. R. A. Petros and J. M. DeSimone, “Strategies in the design of nanoparticles for
therapeutic applications,” Nat. Rev. Drug Discov., vol. 9, no. 8, pp. 615–627, Aug. 2010.
65. W. H. De Jong, W. I. Hagens, P. Krystek, M. C. Burger, A. J. A. M. Sips, and R. E.
Geertsma, “Particle size-dependent organ distribution of gold nanoparticles after intravenous administration,” Biomaterials, vol. 29, no. 12, pp. 1912–1919, Apr. 2008.
66. A. B. Etame, C. A. Smith, W. C. W. Chan, and J. T. Rutka, “Design and potential
application of PEGylated gold nanoparticles with size-dependent permeation through brain microvasculature,” Nanomedicine Nanotechnol. Biol. Med., vol. 7, no. 6, pp. 992–1000, Dec. 2011.
67. H. Chen et al., “‘Living’ PEGylation on gold nanoparticles to optimize cancer cell
uptake by controlling targeting ligand and charge densities,” Nanotechnology, vol. 24, no. 35, p. 355101, Sep. 2013.
68. J. V. Jokerst, Z. Miao, C. Zavaleta, Z. Cheng, and S. S. Gambhir, “Affibody-
Functionalized Gold-Silica Nanoparticles for Raman Molecular Imaging of the Epidermal Growth Factor Receptor,” Small, vol. 7, no. 5, pp. 625–633, Mar. 2011.
69. M. L. Goodenberger and R. B. Jenkins, “Genetics of adult glioma,” Cancer Genet.,
vol. 205, no. 12, pp. 613–621, Dec. 2012. 70. P. Wesseling and D. Capper, “WHO 2016 Classification of gliomas,” Neuropathol.
Appl. Neurobiol., vol. 44, no. 2, pp. 139–150, Feb. 2018. 71. C. Adamson et al., “Glioblastoma multiforme: a review of where we have been
and where we are going,” Expert Opin. Investig. Drugs, vol. 18, no. 8, pp. 1061–1083, Aug. 2009.
72. G. Perazzoli et al., “Temozolomide Resistance in Glioblastoma Cell Lines:
Implication of MGMT, MMR, P-Glycoprotein and CD133 Expression,” PLOS ONE,

93
vol. 10, no. 10, p. e0140131, Oct. 2015. 73. J. J. Corso, E. Sharon, S. Dube, S. El-Saden, U. Sinha, and A. Yuille, “Efficient
Multilevel Brain Tumor Segmentation With Integrated Bayesian Model Classification,” IEEE Trans. Med. Imaging, vol. 27, no. 5, pp. 629–640, May 2008.
74. J. Siddiqui and A. S. Krishnan, “Butterfly Glioma,” N. Engl. J. Med., vol. 378, no. 3,
pp. 281–281, Jan. 2018. 75. M. Scaltriti, “The Epidermal Growth Factor Receptor Pathway: A Model for
Targeted Therapy,” Clin Cancer Res, p. 6, 2006. 76. H. Xu et al., “Epidermal growth factor receptor in glioblastoma,” Oncol. Lett., vol.
14, no. 1, pp. 512–516, Jul. 2017. 77. M. McNamara, S. Sahebjam, and W. Mason, “Emerging Biomarkers in
Glioblastoma,” Cancers, vol. 5, no. 4, pp. 1103–1119, Aug. 2013. 78. H. K. Gan, A. N. Cvrljevic, and T. G. Johns, “The epidermal growth factor receptor
variant III (EGFRvIII): where wild things are altered,” FEBS J., vol. 280, no. 21, pp. 5350–5370, Nov. 2013.
79. T. E. Taylor, F. B. Furnari, and W. K. Cavenee, “Targeting EGFR for Treatment of
Glioblastoma: Molecular Basis to Overcome Resistance,” Curr. Cancer Drug Targets, vol. 12, no. 3, pp. 197–209, Mar. 2012.
80. H. K. Gan, A. H. Kaye, and R. B. Luwor, “The EGFRvIII variant in glioblastoma
multiforme,” J. Clin. Neurosci., vol. 16, no. 6, pp. 748–754, Jun. 2009. 81. “Biopsy versus resection for high-grade glioma.” /CD002034/GYNAECA_biopsy-
versus-resection-high-grade-glioma. 82. K. L. Chaichana et al., “When Gross Total Resection of a Glioblastoma Is Possible,
How Much Resection Should Be Achieved?,” World Neurosurg., vol. 82, no. 1–2, pp. e257–e265, Jul. 2014.
83. K. L. Chaichana et al., “Establishing percent resection and residual volume
thresholds affecting survival and recurrence for patients with newly diagnosed intracranial glioblastoma,” Neuro-Oncol., vol. 16, no. 1, pp. 113–122, Jan. 2014.
84. “Glioblastoma Multiforme – Symptoms, Diagnosis and Treatment Options.”
https://www.aans.org/. 85. R. Stupp et al., “Radiotherapy plus Concomitant and Adjuvant Temozolomide for
Glioblastoma,” N. Engl. J. Med., p. 10, 2005. 86. “Chemotherapy/American Brain Tumor Association” http://ww.abta.org/brain-

94
tumor-treatment/treatments/chemoterapy.html 87. U. Weinberg, “Novocure’s Tumor Treating Fields: Innovative brain cancer
therapy with survival and safety benefits,” p. 4. 88. R. Stupp et al., “Effect of Tumor-Treating Fields Plus Maintenance Temozolomide
vs Maintenance Temozolomide Alone on Survival in Patients With Glioblastoma: A Randomized Clinical Trial,” JAMA, vol. 318, no. 23, p. 2306, Dec. 2017.
89. L. Orellana, A. Hospital, and M. Orozco, “Oncogenic mutations of the EGF-
Receptor ectodomain reveal an unexpected mechanism for ligand-independent activation,” Biophysics, preprint, Sep. 2014.
90. S. J. Bagley, A. S. Desai, G. P. Linette, C. H. June, and D. M. O’Rourke, “CAR T-cell
therapy for glioblastoma: recent clinical advances and future challenges,” Neuro-Oncol., vol. 20, no. 11, pp. 1429–1438, Oct. 2018.
91. Y. Cheng et al., “Blood-Brain Barrier Permeable Gold Nanoparticles: An Efficient
Delivery Platform for Enhanced Malignant Glioma Therapy and Imaging,” Small, p. n/a-n/a, Aug. 2014.
92. A. Appelt-Menzel et al., “Establishment of a Human Blood-Brain Barrier Co-
culture Model Mimicking the Neurovascular Unit Using Induced Pluri- and Multipotent Stem Cells,” Stem Cell Rep., vol. 8, no. 4, pp. 894–906, Apr. 2017.
93. J. J. Jamieson, P. C. Searson, and S. Gerecht, “Engineering the human blood-brain
barrier in vitro,” J. Biol. Eng., vol. 11, no. 1, p. 37, Dec. 2017. 94. B. T. Hawkins and T. P. Davis, “The Blood-Brain Barrier/Neurovascular Unit in
Health and Disease,” Pharmacol. Rev., vol. 57, no. 2, pp. 173–185, Jun. 2005. 95. D. M. Long, “Capillary Ultrastructure and the Blood-Brain Barrier in Human
Malignant Brain Tumors,” J. Neurosurg., vol. 32, no. 2, pp. 127–144, Feb. 1970. 96. D. Y. Joh et al., “Selective Targeting of Brain Tumors with Gold Nanoparticle-
Induced Radiosensitization,” PLoS ONE, vol. 8, no. 4, p. e62425, Apr. 2013. 97. F. ELAmrawy, A. A. Othman, C. Adkins, A. Helmy, and M. I. Nounou, “Tailored
nanocarriers and bioconjugates for combating glioblastoma and other brain tumors,” J. Cancer Metastasis Treat., vol. 2, no. 3, p. 112, Mar. 2016.
98. A. B. Etame, R. J. Diaz, C. A. Smith, T. G. Mainprize, K. Hynynen, and J. T. Rutka,
“Focused ultrasound disruption of the blood-brain barrier: a new frontier for therapeutic delivery in molecular neurooncology,” Neurosurg. Focus, vol. 32, no. 1, p. E3, Jan. 2012.
99. B. G. Harder et al., “Developments in Blood-Brain Barrier Penetrance and Drug

95
Repurposing for Improved Treatment of Glioblastoma,” Front. Oncol., vol. 8, p. 462, Oct. 2018.
100. W. Debinski and S. B. Tatter, “Convection-enhanced delivery for the treatment
of brain tumors,” Expert Rev. Neurother., vol. 9, no. 10, pp. 1519–1527, Oct. 2009.
101. D. Ye et al., “Nanoparticle accumulation and transcytosis in brain endothelial cell
layers,” Nanoscale, vol. 5, no. 22, p. 11153, 2013. 102. B. B. Weksler et al., “Blood-brain barrier-specific properties of a human adult
brain endothelial cell line,” FASEB J., vol. 19, no. 13, pp. 1872–1874, Nov. 2005. 103. E. A. L. M. Biemans, L. Jäkel, R. M. W. de Waal, H. B. Kuiperij, and M. M. Verbeek,
“Limitations of the hCMEC/D3 cell line as a model for Aβ clearance by the human blood-brain barrier: Limitations hCMEC/D3 Model to Study Aβ Clearance,” J. Neurosci. Res., vol. 95, no. 7, pp. 1513–1522, Jul. 2017.
104. G. Xu, S. Mahajan, I. Roy, and K.-T. Yong, “Theranostic quantum dots for crossing
blood–brain barrier in vitro and providing therapy of HIV-associated encephalopathy,” Front. Pharmacol., vol. 4, 2013.
105. Y. Shao, C. Li, Y. Feng, and W. Lin, “Surface-enhanced Raman scattering and
density functional theory study of 1,4-benzenedithiol and its silver complexes,” Spectrochim. Acta. A. Mol. Biomol. Spectrosc., vol. 116, pp. 214–219, Dec. 2013.
106. S. W. Joo, S. W. Han, and K. Kim, “Adsorption of 1,4-Benzenedithiol on Gold and
Silver Surfaces: Surface-Enhanced Raman Scattering Study,” J. Colloid Interface Sci., vol. 240, no. 2, pp. 391–399, Aug. 2001.
107. M. Mioc et al., “The Cytotoxic Effects of Betulin-Conjugated Gold Nanoparticles
as Stable Formulations in Normal and Melanoma Cells,” Front. Pharmacol., vol. 9, p. 429, May 2018.
108. E. L. Bentzen et al., “Surface Modification To Reduce Nonspecific Binding of
Quantum Dots in Live Cell Assays,” Bioconjug. Chem., vol. 16, no. 6, pp. 1488–1494, Nov. 2005.
109. B. A. Kairdolf, M. C. Mancini, A. M. Smith, and S. Nie, “Minimizing Nonspecific
Cellular Binding of Quantum Dots with Hydroxyl-Derivatized Surface Coatings,” Anal. Chem., vol. 80, no. 8, pp. 3029–3034, Apr. 2008.
110. N. A. Byzova, I. V. Safenkova, E. S. Slutskaya, A. V. Zherdev, and B. B. Dzantiev,
“Less is More: A Comparison of Antibody–Gold Nanoparticle Conjugates of Different Ratios,” Bioconjug. Chem., vol. 28, no. 11, pp. 2737–2746, Nov. 2017.
111. D. R. Elias, A. Poloukhtine, V. Popik, and A. Tsourkas, “Effect of ligand density,

96
receptor density, and nanoparticle size on cell targeting,” Nanomedicine Nanotechnol. Biol. Med., vol. 9, no. 2, pp. 194–201, Feb. 2013.

97

98
List of abbreviations
Abbreviation Full name
1,4-BDT 1,4-Benzenedithiol
3D Three dimensions
5-ALA 5-aminolevulinic acid
AMT Absorption mediated transport
aPEG Amino polyethylene glycol methoxy
BBB Blood brain barrier
BSA Bovine serum albumin
BTB Brain tumor barrier
CARS Coherent anti-Stokes Raman scattering
cPEG Carboxy polyethylene glycol thiol
CT Computerized tomography
DMEM Dulbecco’s modified Eagle’s medium
DMSO Dimethyl sulfoxide
EDC Ethyl dimethylaminopropyl carbodiimide
EDTA Ethylenediaminetetraacetic acid
EGFR Epidermal growth factor receptor
EPR Enhanced retention and permeability
FCS Fetal calf serum
FECH Ferrochelatase
FUS Focused ultrasound
GA Glutaraldehyde
GBM Glioblastoma
GNP Gold nanoparticle
HEPES 4-(2-hydroxyethyl)-1-piperazineethanesulfonic acid
HO-1 Heme oxygenase-1
ICG Indocyanine green
ICP-MS Inductively coupled plasma mass spectrometry
99
IDH Isocitrate dehydrogenase
iMRI Intraoperative magnetic resonance imaging
iUS Intraoperative ultrasonography
LSPR Localized surface plasmon resonance
LY Lucifer yellow
MFI Mean fluorescence intensity
MG Malachite green
MGITC Malachite green isothiocyanate
mPEG Methoxy polyethylene glycol thiol
MRI Magnetic resonance imaging
NDS Normal donkey serum
NIR Near-infrared
NOS Not otherwise specified
OD Optical density
P/S Penicillin/streptomycin
Papp Apparent permeability
PBS Phosphate buffered saline
PBS-T Phosphate buffered saline Tween
PEG Polyethylene glycol
PET Positron emission tomography
PFA Paraformaldehyde
PIPES Piperazine-N,N′-bis(2-ethanesulfonic acid)
PPIX Protoporphyrin IX
PVDF Polyvinylidene difluoride
QD Quantum dot
qFACS Quantitative fluorescence-activated cell sorting
RES Reticuloendothelial system
RMT Receptor mediated transcytosis
RRS Resonance Raman scattering
RT Room temperature
SD Standard deviation

100
SERRS Surface enhanced resonance Raman spectroscopy
SEHRS Surface enhanced hyper Raman scattering
SERS Surface enhanced Raman spectroscopy
SPR Surface plasmon resonance
SRS Stimulated Raman scattering
Sulfo-NHS N-hydroxysulfosuccinimide
TEER Transendothelial electrical resistance
TERS Tip enhanced Raman spectroscopy
TJ Tight junction
TMZ Temozolomide
TTF Tumor treating field
UV-Vis Ultraviolet-visible
WHO World health organization
ZO Zonula occludens

101

102
Acknowledgments
My professor always says: “Ph.D. is a roller coaster with many up and even more
down”. He is right since this experience drove me through moments with several mixed
emotions. I doubted I was good enough and I wondered whether it was worth carrying
out the same experiment again and again to achieve the desired outcomes. However, If
I could go back, I would do it again because it raised the awareness of myself. More
importantly, I had the chance to meet special people, some of which are currently part
of my life.
I want to start by expressing my deepest gratitude to my supervisors, Uwe Pieles and
Michael Reinert, who always trusted me and my work, and to Jörg Huwyler, who kindly
accepeted to be my co-referee.
I want to thank many other people who differently contributed to this experience. Luigi
Mariani and Laura Suter-Dick kindly welcomed me in their laboratories. Felix, with the
machine “Paula”, carried out the ICP analysis of my sticky samples and took time to
understand the incomprehensible results. Luc Stoppini and Adrien Roux kindly allowed
me to use their TEER system and provided the cells. Monica Schönenberger and Nils
Warfving kindly let me use the Raman and the dark field microscopes, respectively. Theo
taught me to use the Raman microscope. Carine Gaiser, all members of the Nanoteam
(specially Sina, Theo, Marcus, Lucy, Jochen, Franzi, Lena and Ana Bela) and the BTB team
(Marie-Françoise, Cris, Jean-Louis, Tala, Thomas, Philips, Anna and Simona) made the
laboratory a pleasant place to work in.
Alessandra, Anna, Marta, Christel, Yasmin and Salima always cheered me up during
difficult times in and outside the lab. Deborah warmly welcomed me whenever I was in
Lugano.

103
My heartfelt thanks go to two ladies mentioned above, who specially supported me
during the whole experience. Marie-Françoise, with your empathy and friendly attitude,
you put me at ease right away. There never was a time you refused to help me. Thank
you for the funny moments spent in the lab and for letting me know the song “Can’t you
feel it”. Sina, with your constructive criticism and advises, you pushed me to be a better
scientist. You believed in me more than I did. I want you both to know that your human
and scientific support was crucial throughout the completion of this research project
and personal development.
It is time to thank those people who have been with me for a very long time. Noemi,
with your sensitivity and the right words at the right time, you always made me feel
better over the last 25 years. Giuliana, Vincenzo and Rosi, you listened to me every
single time I was disappointed, sad or happy.
I must express my deepest admiration and gratitude to my mother, Rosita, my father,
Claudio and my brother, Daniele. You always encouraged me to find my way although it
took me far from you and you opened your arms whenever I came back home. I thank
you for showing me that is possible to move on even in the darkest moments when
there are unconditional love and mutual support.
Finally, Raffaele, you patiently endured all my mood swings and stood by me even when
changing direction would have been much easier. With your different attitude, you
helped me to give due weight to each situation and to be less uncompromising.

104
105
Curriculum vitae
Personal information
Floriana Burgio
01.06.1989
Italian
Work experience
Sept. 2015 - Nov. 2019 Ph.D. in Neurobiology, University of Basel. Joined Ph.D.
between University of Applied Sciences Northwestern
Switzerland (Muttenz, CH), Department of Biomedicine
(Basel, CH) and Ente Ospedaliero Cantonale (Lugano, CH).
Education
Oct. 2012 - Mar. 2015 Master degree in Biotecnologie per l’industria e la ricerca
scientica, University of study of Palermo (Palermo, IT).
Thesis: Osteoinduction and survival of human
osteosarcoma cells on hydroxyapatite scaffolds under
static and dynamic culture conditions.
Oct.2013 - Oct. 2014
Visiting Erasmus student at the University of Applied
Sciences Northwestern Switzerland (Muttenz, CH).
Oct.2008 - Oct. 2012
Beachelor degree in Biotecnologie, University of study of
Palermo (Palermo, IT).
Thesis: Evaluation of the activity of two recombinant
collagenases derived from Clostridium histolyticum.
Publications
• Burgio F, Piffaretti D, Schmidt F, Pieles U, Reinert M, Ritz M-F, Saxer S. Tuning
the Surface Chemistry of Gold Nanoparticles to Specifically Image Glioblastoma
Cells Using Surface-Enhanced Raman Spectroscopy. ACS Appl. Nano Mater. Feb.
2020.

106
• Piffaretti D, Burgio F, Thelen M, Lang AK, Paganetti P, Reinert M, D’Angelo ML.
Protoporphyrin IX tracer fluorescence modulation for improved brain tumor cell
lines visualization. J Photochem Photobiol B. Oct. 2019.
• Brodard P, Dabros M, Marti R, Vanoli E, Zinn M, Frey U, Adlhart C, Kind L, Koch
F, Burgio F, Stenqvist J, Saxer S, Pieles U, Shahgaldian P, Wenderborn S. Material
Science at Swiss Universities of Applied Sciences. Chimia International Journal
for Chemistry. Aug. 2019.
• Burgio F, Rimmer N, Pieles U, Buschmann J, Beaufils-Hugot M. Characterization
and in ovo vascularization of a 3D-printed hydroxyapatite scaffold with different
extracellular matrix coatings under perfusion culture. Biol Open. Oct. 2018.
• Burgio F, Piffaretti D, Mariani L, Pieles U, Reinert M. P04.06 Gold nanoparticles
development for Raman guided Glioblastoma visualization during surgical
resection. Neuro Oncol. May 2017.
• Fontana AO, Piffaretti D, Marchi F, Burgio F, Faia-Torres AB, Paganetti P, Pintos
S, Pieles U, Reinert M. Epithelial growth factor receptor expression influences 5-
ALA induced glioblastoma fluorescence. J Neurooncol. May 2017.
Conferences
• Oral presentation at the 8th Swiss Raman user meeting, Nov. 2019, Muttenz (CH).
• Oral presentation at the International Conference On Nanomedicine and
Nanobiotechnology, Sept. 2018, Roma (IT).
• Poster presentation at the 14th Confocal Raman Imaging Symposium, Sept. 2017, Ulm
(DE).
• Poster presentation at the World Federation of Neuro-Oncology Societies Conference,
May 2017, Zürich (CH).
• 7th Research Day of Southern Switzerland, Apr. 2017, Lugano (CH).
• Poster presentation at the Biointerface International Conference, Aug. 2016, Zürich
(CH).
• Poster presentation at the 6th Research Day of Southern Switzerland, Apr. 2016,
Lugano (CH).
• Rapid fire presentation at the Raman Microscopy Workshop, ETH Zürich, Feb. 2016,
Zürich (CH).

107
• Poster presentation and rapid-fire presentation at the 26th Annual Conference of the
European Society for Biomaterials, Aug. 2014, Liverpool (UK).
• Poster presentation at the 20th Annual Meeting of the Swiss Society for Biomaterials
and Regenerative Medicine, May 2014, Basel (CH).
• 8th International Summer School on Advanced Biotechnology, Sept. 2013, Innsbrück
(A).