Embed Size (px)
Citation preview
Module 1, Page 1
NAME: _________________________________________________________________
East Carolina University PSYC 3206 -- Developmental Psychology
Dr. Ironsmith & Dr. Eppler
Study Questions for Chapter 1:
Understanding Life-Span Human Development
Sigelman & Rider (2009). Life-span human development (6th edition). Belmont, CA: Wadsworth
Copyright 2008 by Marsha Ironsmith and Marion Eppler.
All rights reserved. This file was last modified on 07/16/08. There are 194 questions in this module. Be sure you have downloaded the entire module. Note to students: This study guide is Module 1 for web-based sections of Psychology 3206. It contains the course objectives and study materials for Chapter 1 in Sigelman and Rider's text. You must complete the entire module before you can check your answers against our key, and you must pass the practice quiz in our testing lab with a score of at least 90% before taking the quiz for Module 1. (NOTE: The practice quiz posted at the course website is a pre-pre-quiz to test how well you know the basic definitions for the terms and concepts in this chapter. Be sure that you have mastered this information before you attempt a practice quiz. These questions don't represent what will be on a real quiz.) In the Module 1 quizzes, you will be expected to recognize new examples of these terms and concepts. The questions will emphasize application of the material rather than simple memorization of definitions (but you do need to know the definitions in order to answer the questions). We welcome any comments you have about how we can improve these study materials. As you work on this study module, read each question carefully and think about what the question is asking for. Sometimes the questions will follow the text material very closely and other times we will be asking you to review important concepts or to make an inference based on what you have learned. Also pay careful attention to all of the NOTES.
Learning Objectives for Chapter 1 (Research Methods)
• Be able to define newborn, infancy, and adolescence.
• Be able to identify three primary methods of data collection: self-report, behavioral observation, and physiological measures.
• Know the advantages and limitations of each method of data collection.
Module 1, Page 2
General Research Methods
• Be able to define and recognize new examples of correlational and experimental research methods.
• Know when it is appropriate to use each method.
• Be able to define and recognize new examples of independent and dependent variables.
• Be able to define and recognize new examples of true and quasi-experimental methods, and be able to interpret the results from each.
• Be able to define and recognize examples of confounding variables.
• Be able to interpret correlation coefficients.
• Be able to define and recognize new examples of positive, negative, and zero correlations.
Developmental Research Methods
• Be able to define and recognize new examples of cross-sectional, longitudinal, and sequential research methods.
• Know when it is appropriate to use each method.
• Be able to define and recognize new examples of cohort and age effects. Know how these two concepts differ and how they are related.
• List four ethical considerations for doing developmental research with human participants.
How Should We Think About Development? NOTE: Much of the material in the beginning of this chapter is historical introduction and will not be covered on the quiz. The last part of the chapter is much more heavily emphasized. However, you do need to be familiar with Table 1.1 which outlines the periods of the life span. Many of these categories are obvious. However, "Infancy" and "Adolescence" are important terms that you will see over and over again in this course. Students have missed questions on a quiz simply because they did not know the definition of these terms. Infancy refers to the period of the lifespan between _______________ and _______________. Adolescence refers to the period from __________ to __________. Another term not listed in the Table but which often confuses students is "Newborn." Developmental psychologists often study newborn infants particularly to see if a behavior is innate or learned. Newborn infants are less than one month old. Another term for newborn is "Neonate." "Neo-" is the Greek prefix for "new" and "nate" means born. The term prenatal means before __________. Postnatal refers to after __________. An innate behavior is a behavior that is in__________. Christmas celebrates an event called a __________, in other words, a birth.
Module 1, Page 3
How Is Development Studied? The Scientific Method 1. The _______________ method involves a process of generating ideas and testing them by making observations. 2. A(n) _______________ is a set of concepts and propositions intended to describe and explain some phenomenon. 3. The idea that sex differences are due to differences in the ways parents treat boys and girls is a(n) _______________. 4. A specific prediction is a(n) _______________. 5. A researcher who predicts that if parents grant boys and girl similar freedom, their sons and daughters will be equally independent is making a(n) _______________. 6. If I predict that children who watch a lot of TV violence will behave more aggressively, I'm making a(n) _______________. 7. The purpose of a research study is to _______________ an hypothesis. NOTE: Do you feel like you're writing the same answers over and over again? That's OK. It's called practice. It doesn't mean you have the wrong answer or you're missing something in the text. We're just warming you up to learn how to use these modules. Data Collection 8. Three major methods of data collection are _______________, _______________, and _______________. 9. What are three limitations of verbal report data? 1) 2) 3) 10. Watching people in their common, everyday surroundings is called ____________________. 11. List two advantages of naturalistic observation. 1) 2)
Module 1, Page 4
12. List three disadvantages of naturalistic observation. 1) 2) 3) NOTE: When you do an observational study, you are trying to describe behavior, rather than to predict or to explain the behavior. Those are the goals of other research methods described below. The purpose of naturalistic observation is to _______________ behavior. 13.One way to achieve greater control over variables that might be influencing behavior is to use _______________ observation rather than naturalistic observation. 14. Describe an example of structured observation from Hubbard’s study of aggression. 15. When behaviors of interest to psychologists are rare in everyday settings, then it would be better to use _______________ observation rather than _______________ observation. 16. What two physiological measures of anger were used in the Hubbard study of aggression? 1) 2) 17. Describe two advantages of physiological measures. 1) 2) 18. What is a limitation of physiological measures? 19. How might researchers overcome the limitations of these different methods of data collection?
Module 1, Page 5
The Experimental and Correlational Methods Methods (General Research Methods) 20. The most powerful research method for explaining behavior and identifying the causes of developmental changes in behavior is the _______________. 21. REVIEW: Naturalistic observation is a research method used to _______________ behavior, and the experimental research method is used to _______________ behavior The Experimental Method 22. When an investigator manipulates or changes some aspect of people's environment to see what effect that has on their behavior, (s)he is using the _______________ research method. 23. Friedrich and Stein (1973) studied how different types of TV programs affect preschooler's behavior. What were the three kinds of programs that the groups of preschoolers watched? 1) 2) 3) 24. The Friedrich and Stein study is an example of the _______________ research method. 25. In an experiment, the variable which is manipulated (or controlled by the experimenter) is called the _______________ variable. 26. The behavior which changes as a result of this manipulation (the behavior being studied) is called the _______________ variable. 27. The independent variable (IV) can be thought of as the cause and the dependent variable (DV) can be thought of as the effect. In Friedrich and Stein's experiment the independent variable was ______________________________. Hint: This is called the independent variable because the experimenters independently "manipulated" it. In other words, they assigned children to three different groups and exposed them to three different types of television programs. NOTE: One thing that confuses students is that each independent variable must have 2 or more levels. In other words, a researcher can compare children who watch aggressive TV programs with children who watch no aggressive TV. In this case, TV is the independent variable and aggressive TV is one level and no aggressive TV is the second level. (Think of one group (or level) as the experimental group and the other group as the control group.) In Friedrich and Stein's study, they have simply added one more level of the independent variable. Children were exposed to either ____________________ or ____________________ or ____________________. In this case, there is only one independent variable which has 3 levels.
Module 1, Page 6
28. In Friedrich and Stein's experiment, the dependent variable was ____________________. HINT: The dependent variable is named that because it changes "dependent" upon the manipulation of the IV. In other words, children's aggressive behavior depended on which type of TV program they watched. 29. IV or DV? a) In an experiment, the cause is the __________ and the effect is the __________. b) The __________ causes changes in the __________. c) Changes in the _________ are caused by the experimenter’s manipulation of the _________. d) The effects of the __________ can be seen when there are changes in the __________. 30. If researchers compare a new drug versus a placebo to see what effect they have on the memory performance of Alzheimer’s patients, then levels of the drug (e.g., new drug, placebo) would represent the __________ and number of items remembered would represent the __________. 31. Summarize the results of Friedrich and Stein's experiment. 32. Based on Friedrich and Stein's results, we can conclude that watching violent TV programs _______________ aggressive behavior in (at least some) preschoolers. 33. Based on Friedrich and Stein's experiment we can conclude that the relationship between watching violent TV and aggressive behavior was a _______________ relationship. 34. List and briefly explain the three critical aspects of a true experiment. 1) 2) 3) NOTE: Random assignment of participants to groups is an important factor in deciding if a study is a true experiment or not. This is not the same as random selection of participants. You might randomly select people from Greenville to call in order to survey their opinion about some public issue. That would be random selection. But if we randomly assign participants to groups,
Module 1, Page 7
each person has an equal chance of being in the experimental group or the control group. A researcher wants to study the effect of imagery on memory. She puts participants names in a hat and pulls out a name and assigns that person to a group that is trained to use imagery to remember nouns. The next person whose name she pulls out is assigned to a group trained to use verbal rehearsal to remember nouns. She repeats this process until each group has 20 participants. This researcher is using _______________________. If a researcher wants to find out how residents of Wake county plan to vote in the 2008 presidential election. She selects people to call so that each person over 18 has an equal chance of being polled. This researcher is using ____________________. Critical Thinking Question: Why would random assignment to groups be helpful in an experiment? (Give this a shot now and we'll elaborate on this point later.) 35. In Friedrich and Stein's experiment, they chose whether children watched violent, altruistic or neutral TV programs. In doing so, they were _______________the independent variable. 36. Friedrich and Stein randomly assigned children to watch violent, altruistic or neutral programs. This means that each child had an equal chance of being assigned to the three groups. This was done to ensure that all three groups were _______________before the experiment began. If the treatment groups are similar before the experiment began, then we can probably be sure that any differences between the groups afterward are due to the effect of the experimental treatment or, in other words, the effect of the _______________. 37. If the children in Friedrich and Stein's study had simply chosen which type of program they wanted to watch, this would not have been a true experiment. Why not? 38. To determine whether a study is a true experiment, the first thing to do is to ask if the participants have been randomly assigned to groups. If we simply compared the behavior of children who like to watch violent TV or altruistic shows or neutral shows, then differences in their aggressive behavior may have been due to other differences between these children that existed prior to the experiment. In this case, if children who preferred violent TV were more aggressive than children who preferred altruistic or neutral shows, then this could result from something other than the independent variable (type of TV show watched). What other variables might explain the difference in aggression between the groups. Why?
Module 1, Page 8
39. When an experimenter is using experimental control that means that (s)he is: 40. Friedrich and Stein made sure that the children in the three treatment conditions (or levels) were treated the same except for: 41. If Friedrich and Stein had shown the violent TV program in a small, crowded room while the other groups were tested in large comfortable rooms, then the aggression of the TV violence groups could be attributed to _______________ rather than to the type of program they watched. 42. In this case the type of TV watched would be ______________ with the degree of crowding. 43. In this case we would not know whether the type of show or the crowding _______________ the aggressive behavior. 44. A difference between groups (other than the independent variable) that could also explain the results is called a confounding variable. In the example above, the crowded condition of the room would be an example of a _______________ variable. It is something that was different about the two groups and it could explain the difference in their aggressive behavior. NOTE: Here we are asking you to integrate supplementary material that has been inserted into the module which expands on the text. This allows us to cover material that we would normally cover in lecture. Sometimes students overlook long sections of print in the module in order to "cut to the chase," i.e. get on with filling in answers from the book. They get confused when the answers are coming from the module material as well as from the text. IGNORE THESE AT YOUR OWN PERIL. THEY WILL BE ON THE QUIZZES! 45. If the violent TV groups had consisted of mostly boys and the altruistic and neutral groups were primarily girls, then sex would be a _______________ variable. How could this have explained the results of the study? 46. Define a confounding variable.
Module 1, Page 9
47. By randomly assigning participants to treatment groups, we are trying to get rid of (or minimize) _______________ variables by ensuring that the groups are as similar as possible except for the independent variable. 48. An experiment allows us to determine that the independent variable ___________ a change in the dependent variable. When we identify cause and effect relationships, we can explain behavior, not just describe it. Therefore, experiments allow us to ___________ behavior. 49. List the two limitations of the experimental method. 1) 2) 50. If an experimenter examines the effects of different treatments but does not randomly assign individual to treatment groups, (s)he is conducting a(n) ____________________ study. 51. The study in which we compare children who normally watch violent TV to those who normally watch nonviolent TV would be an example of a(n) ____________________ study. 52. Identify an example of a quasi-experimental study from your book. How does a quasi-experiment differ from a true experiment? 53. What is the limitation of the quasi-experimental study? 54. In spite of that limitation, why do you think quasi-experimental designs are used so widely? Quick Review: 55. A VARIABLE THAT IS CONTROLLED BY THE EXPERIMENTER AND WHICH IS HYPOTHESIZED TO CAUSE SOME CHANGE IN BEHAVIOR IS CALLED THE _______________ VARIABLE. 56. THE BEHAVIOR THAT CHANGES AS A RESULT OF SOME EXPERIMENTAL MANIPULATION IS CALLED THE _______________ VARIABLE.
Module 1, Page 10
57. A VARIABLE THAT WAS NOT CONTROLLED BY THE EXPERIMENTER, WHICH IS DIFFERENT FOR THE EXPERIMENTAL GROUP AND THE CONTROL GROUP AND THAT COULD ALSO EXPLAIN THE CHANGE IN THE DEPENDENT VARIABLE WOULD BE THE _______________ VARIABLE. 58. ONE CRITICAL THING THAT MAKES AN EXPERIMENT A TRUE EXPERIMENT IS: 59. A TRUE EXPERIMENT TELLS YOU ABOUT _____________________________. 60. A TRUE EXPERIMENT ALLOWS YOU TO _______________ BEHAVIOR. The Correlational Method 61. The correlational method involves determining: NOTE: A variable is anything that can have more than one value. If we look at the relationship between parents reading to 3-year-old children and the children's reading comprehension scores in 2nd grade, then reading to children is one variable (some parents read to their children a lot, some very little) and reading comprehension is the other variable (some kids read well, some not so well.) 62. A _______________ is something that can take on different values along some dimension. 63. Children have different heights and weights. Therefore, height and weight are ___________. 64. Some children watch a lot of violence on television, some watch very little. The amount of TV violence a child watches is a _______________. 65. Some children are very aggressive. Some show very little aggressive behavior. Aggression is a _______________. 66. Describe Huesmann’s (2003) correlational study on viewing TV violence during elementary school and aggressive behavior as adults. 67. How does Huesmann’s study differ from Friedrich and Stein’s study?
Module 1, Page 11
68. A correlation coefficient is: 69. A correlation coefficient is represented by the statistical symbol __________. 70. How to calculate a correlation coefficient is beyond the scope of this course. However, you should know what correlation coefficients are and how to interpret them. A correlation coefficient is a number that can range from__________ to __________. As the value of the correlation coefficient increases, the relationship between the two variables becomes _______________. Conversely, as the value of the correlation coefficient decreases, the strength of the relationship _______________. 71. In a _______________ correlation both variables change in the same direction (e.g., as number of hours watching violent TV increases, the amount of aggression also increases). 72. A graph is one way to describe a correlation. A graph of a correlational relationship is called a scatterplot. On a scatterplot, one variable is plotted on the x-axis and one is plotted on the y-axis. Figure 1.3 in the text shows three scatterplots. On the y (vertical) axis is _________________________ and on the x (horizontal) axis is _________________________. 73. Notice that the first scatterplot (A) shows a positive correlation (+.60). In this example, the children who watched a lot of TV showed __________ aggressive behavior. The children who watched very little violent TV showed __________ aggressive behavior. 74. Which correlation shows a stronger relationship between two variables, r = .30 or r = .90? 75. Write a sentence to describe the relationship between viewing TV and aggressive behavior seen Figure 1.3 panel A. (Be careful how you word the statement.) 76. In a _______________ correlation one variable increases as the other variable decreases so that they move in opposite directions (e.g., as number of hours watching violent TV increases, the amount of aggression decreases). 77. Notice that the middle scatterplot (B) in Figure 1.3 shows a negative correlation (-.60). In this example, the children who watched a lot of TV showed __________ aggressive behavior. The children who watched very little violent TV showed __________ aggressive behavior. 78. A correlation coefficient of _______ indicates that there is no relation between two variables. 79. Notice that the bottom scatterplot (C) in Figure 1.3 shows a zero correlation (.00). Describe the relationship between the two variables in this example.
Module 1, Page 12
80. Based on Huesmann’s results, the relationship between TV viewing in elementary school and aggressive behavior in adulthood was a _______________ correlation. (positive, negative, zero) 81. We can conclude from Huesmann’s study that the more TV that children watch, the __________ aggressive they will be as adults. The less children watch TV, the __________ aggressive they will be as adults. NOTE: In evaluating the strength of the correlation, the sign does not matter—only the number. The sign indicates the direction of the correlation (both variables moving in the same direction or in opposite directions), and the number denotes the strength of the relationship. Thus, a correlation of -.79 indicates a stronger relationship between two variables then a correlation of +.52. In Figure 1.3 which plot represents the stronger correlation, A or B? 82. The closer a correlation coefficient is to |1.00| (absolute one--ignore the sign) the _______________ the relationship. 83. The closer the correlation coefficient is to |0.00| the _______________ the relationship. 84. Correlation coefficients close to the number_____ reflect a strong relationship between two variables, and correlation coefficients close to the number _____ reflect a weak relationship between two variables. 85. The numerical value of the correlation coefficient indicates its _______________ and the plus or minus sign indicates its _______________. 86. A strong correlation means that if we know the value of variable x we can make an accurate prediction about the value of variable y. The stronger the correlation the more ______________ our prediction will be. Thus, the correlational method allows us to _______________ behavior. 87. The weaker the correlation, the __________ accurate our prediction will be. 88. If the correlation between two variables is 0.00, then what would knowing the value of variable x tell us about the value of variable y? 89. Based on the Huesmann data, if we know that a child watches a lot of TV, then we could predict that his/her level of aggression in adulthood will be _______________. 90. Similarly, if we know that a child does not watch TV, then we could predict that his/her level of aggression in adulthood would be _______________.
Module 1, Page 13
91. As adolescents (teenagers) get older, the amount of time they spend with their friends increases. This is an example of a _______________ correlation. As adolescents get older, the amount of time spent with their parents decreases. This is an example of a _______________ correlation. As age _______________, time spent with parents _______________. 92. True OR False? According to the Huesmann study, watching TV causes aggressive behavior. 93. A correlation allows us to make predictions about behavior. It does not allow us to _______________ behavior. 94. A correlation cannot be used to show _______________ and _______________. If you don't remember anything else about correlations when this course is over, remember that! 95. Even if Huesmann and colleagues had found a perfect positive correlation (+1.00) between watching TV and aggressive behavior, they still could not have concluded that TV causes aggression. Why not? Briefly explain the other two possible explanations. 1) 2) 96. Why is it unlikely that aggression caused TV viewing in the Huesmann study? 97. The major limitation of the correlational method is: 98. Despite this limitation, correlational and quasi-experimental studies are very common. Explain why this is true.
Module 1, Page 14
99. Try graphing a scatterplot like the ones in Figure 1.3 from the data below. Put reading comprehension scores on the y (vertical) axis and time spent reading on the x (horizontal) axis. You see in the example that Mary's parents read to her 3 hours a week and her reading comprehension score in second grade is 90. Place the point where those two numbers intersect on the graph. Do the same for the rest of the numbers. Hours Spent
Reading Reading
Comprehension Mary 3 90 Tommy 4 100 Justin 5 110 Seth 6 120 Allison 7 130 100. Look at the scatterplot you drew to illustrate the correlation between hours spent reading to a child and reading comprehension. When the points on the scatterplot seem to be moving in an upward sloping direction, this would be a _______________ correlation. 101. In a _______________ correlation, an increase in variable A is associated with an increase in variable B. As the number of hours spent reading to a child increases, reading comprehension scores _______________. 102. On the scatterplot you drew, the points all fell on a straight line indicating a perfect positive correlation. This strong a correlation never happens in real life, but if it did, the correlation coefficient (r) would be equal to _______________, the strongest possible positive correlation. 103. Assume there was a perfect positive correlation between time spent reading to children and reading comprehension scores. Which of the following could you conclude? (Be careful. Only one of these statements is true.) a) that reading to your children results in good reading comprehension? b) that parents who read less to their children have children who read better? c) that parents who read more to their children have children who read better? d) that there is a causal* relationship between reading to children and reading comprehension? *NOTE: Be sure that you know what this word means. Look it up in the dictionary. Notice carefully how it is spelled. Do not confuse it with the word casual. You will see the word causal on the quiz and you will be in deep doo-doo if you confuse these two words. 104. A correlation coefficient does not allow us to make conclusions about _________________________. 105. Even if the correlation between x and y were +1.00, we could not conclude that x _______________ y.
Module 1, Page 15
NOTE: As discussed on page 19 of your book, there are three possible causal relationships in a correlational study. These can be represented as follows: x causes y y causes x z causes both x and y. (z represents some third variable that was not measured in the study). 106. In other words, reading to 3-year-old children may cause their reading scores to be higher in second grade (x causes y), but we don't know that this is true. Having high reading scores in second grade may have caused the parents to read to their three year olds (y causes x). In this study, y causes x is not very plausible. Explain why not. NOTE: However, in some correlational studies, the possibility that y causes x is just as likely as the possibility that x causes y. 107. Finally, some third variable (z) may have caused both x and y. What might a plausible third variable be in this example? NOTE: The important thing to remember is that in any correlational study, none of these three cause and effect relationships can be ruled out. Correlational studies can only hint at possible causal relationships, but cannot determine cause and effect conclusively. 108. One valuable aspect of correlations is that they allow us to make predictions. If there were a perfect correlation between reading to children and reading comprehension scores, then we could predict the value of one variable if we know the value of the other variable. In the example above, if we knew that a parent read to their child 2 hours a week then we could predict that that child's reading comprehension score would be _____. If we knew that a child's score was 150, we could predict that the parent read to his/her child _____ hours per week. 109. If a perfect correlation existed, then we could predict the value of one variable given the value of the other variable with 100% accuracy. The higher the correlation, the more accurately we could predict x from y or y from x. In other words, the higher the correlation the more _______________ our predictions will be. The lower the correlation, the _______________ our predictions will be. 110. When two variables move in opposite directions (one increases as the other decreases), this is called a _______________ correlation. 111. Children who exhibit a lot of aggressive behavior tend to have few friends. The relationship between aggression and the number of friends a child has is an example of a _______________ correlation.
Module 1, Page 16
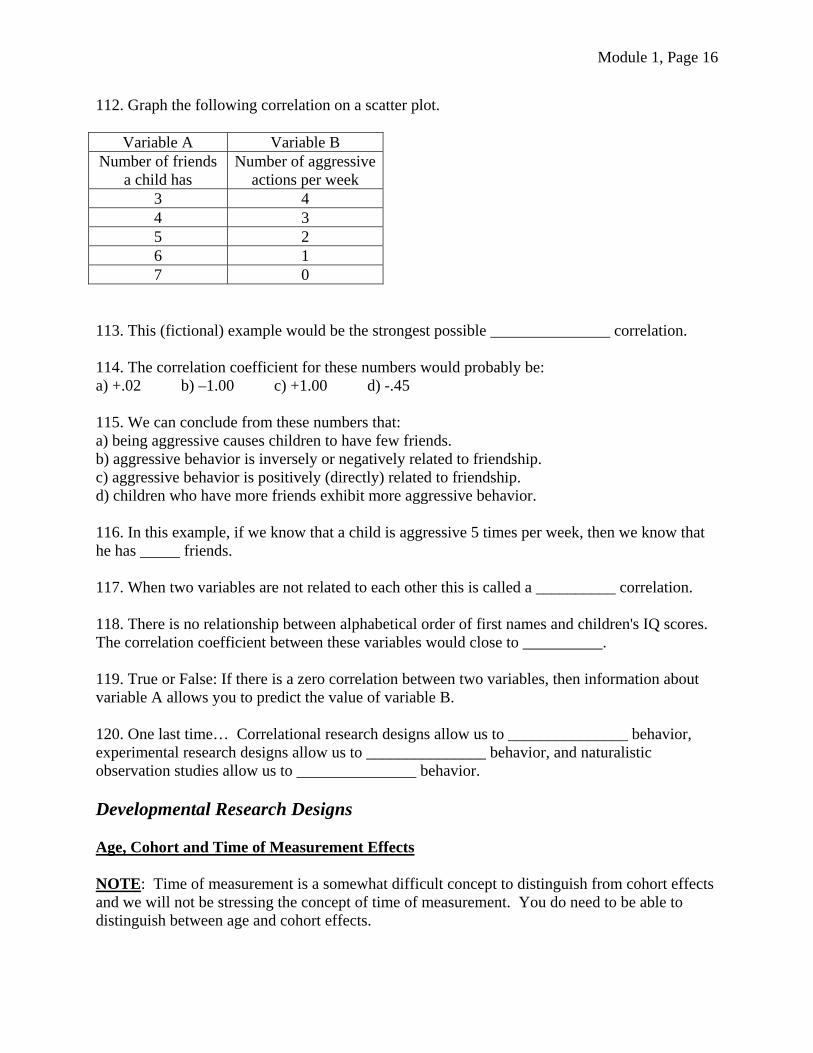
112. Graph the following correlation on a scatter plot.
Variable A Variable B Number of friends
a child has Number of aggressive
actions per week 3 4 4 3 5 2 6 1 7 0
113. This (fictional) example would be the strongest possible _______________ correlation. 114. The correlation coefficient for these numbers would probably be: a) +.02 b) –1.00 c) +1.00 d) -.45 115. We can conclude from these numbers that: a) being aggressive causes children to have few friends. b) aggressive behavior is inversely or negatively related to friendship. c) aggressive behavior is positively (directly) related to friendship. d) children who have more friends exhibit more aggressive behavior. 116. In this example, if we know that a child is aggressive 5 times per week, then we know that he has _____ friends. 117. When two variables are not related to each other this is called a __________ correlation. 118. There is no relationship between alphabetical order of first names and children's IQ scores. The correlation coefficient between these variables would close to __________. 119. True or False: If there is a zero correlation between two variables, then information about variable A allows you to predict the value of variable B. 120. One last time… Correlational research designs allow us to _______________ behavior, experimental research designs allow us to _______________ behavior, and naturalistic observation studies allow us to _______________ behavior. Developmental Research Designs Age, Cohort and Time of Measurement Effects NOTE: Time of measurement is a somewhat difficult concept to distinguish from cohort effects and we will not be stressing the concept of time of measurement. You do need to be able to distinguish between age and cohort effects.
Module 1, Page 17
121. The effects of getting older are known as _______________ effects. The developmental changes that developmental psychologists are interested in studying are called _______________ effects. 122. A group of people born at the same time is called a _______________. If you were born in 1988, then everyone born in 1988 is part of your _______________. Everyone in your high school graduating class is part of your _______________. Your parents are part of a _______________, and your grandparents are part of a different _______________. 123. Effects of being born in a particular historical context are known as _______________ effects. If adolescents who came of age during the Great Depression were more focused on financial security and family life as adults compared to later generations of adolescents who grew up in more prosperous times, then this is an example of a _________________________. 124. If researchers are studying the effects of maturation (getting older), then they are studying _______________ effects. 125. _______________ effects refer to how each generation is affected by the historical context in which they grow up. Cross-Sectional and Longitudinal Designs NOTE: These are called developmental research method because they are specifically designed to look at changes that take place as people mature. We use this terminology on the quizzes to give you extra cues on fill-in-the-blank questions. 126. The cross sectional developmental research method is defined as: 127. The longitudinal developmental research method is defined as: NOTE: In a longitudinal study, it is not necessary for researchers to follow participants over the entire lifespan or even for many years. For example, you could study inexperienced 8-month-old crawlers and then test those same infants again as experienced crawlers at age 10 months. The key to a research design being longitudinal is that researchers are looking for developmental change by studying the same group more than once over some time period. 128. Researchers studying the same cohort more than once are using the ____________________ method, and researchers studying two or more cohorts at one time are using the ____________________ method. 129. The ____________________ research design provides information about age differences, whereas the ____________________ research design provides information about age changes.
Module 1, Page 18
130. Tom wants to compare the math attitudes of children in grades K through 5. He administers a math attitude survey to the children at Greenwood Elementary school who are in Kindergarten, 2nd, 3rd, 4th and 5th grades in the fall of 1999. This would be an example of the ____________________ research method. 131. Lewis Terman was interested in the development of "geniuses." He identified 1500 children in California with IQs above 150 and followed them up through adulthood. Terman used the ____________________ research method. 132. Find an example in your textbook of a cross-sectional study. 133. Find an example in your textbook of a longitudinal study. 134. Read the example of changes in gender-role attitudes on page 21 and examine the corresponding graph (Figure 1.6). a) Describe the different findings for cross-sectional and longitudinal studies. b) Discuss how age and cohort effects could explain these differences in the results for the two research methods. 135. In the gender-role attitudes example, the ____________________ research design confounds age with cohort effects, whereas the ____________________ research design shows the actual developmental changes (or age effects). 136. Say that you did a cross-sectional study of IQ scores for 20, 40, 60 and 80-year-olds and found significant decreases in IQ over the four age groups. Suppose that you did a similar longitudinal study and found very little decrease in IQ scores. a) How would you explain these results if you interpreted them as age effects?

Module 1, Page 19
b) How would you explain them as cohort effects? Strengths and Weaknesses of the Cross-Sectional Design 137. In both of the examples above, longitudinal designs show the true developmental changes whereas cross-sectional designs show age differences that look like developmental changes but are actually cohort effects. Thus, one major limitation of cross-sectional research designs is: 138. What are other disadvantages or limitations of the cross-sectional research method? 139. Given these serious limitations, why would researchers ever choose to use cross-sectional methods? What are the advantages of this research design? 140. Cohort effects are less of a problem for cross-sectional designs when: Strengths and Weaknesses of the Longitudinal Design 141. What are the advantages of a longitudinal research design? 142. When are cohort effects a problem for longitudinal research designs? The answer may not be immediately apparent, so just take some time to think about it.
Module 1, Page 20
143. What are other disadvantages of the longitudinal research design? Sequential Designs: The Best of Both Worlds 144. A sequential development research method is defined as: 145. Describe an example from the textbook of a sequential design. 146. What are the advantages of the sequential research design? 147. What are the disadvantages of the sequential research design? Additional Information To Explain Importance of Sequential Designs 148. Werner Schaie and his colleagues developed a technique known as the sequential method for separating out the effects of cohort differences from age differences. The sequential method involves a combination of the ____________________ and ____________________ research methods. In the Seattle Longitudinal Study, Schaie measured cognitive abilities of individuals from multiple cohort groups across time. Here is an example of one of these studies by Schaie & Labouvie-Vief (1974). Note that the Seattle Longitudinal Study is still underway with some of the oldest participants in their 100s now! Here is a link to learn more about it: http://geron.psu.edu/sls/
Module 1, Page 21
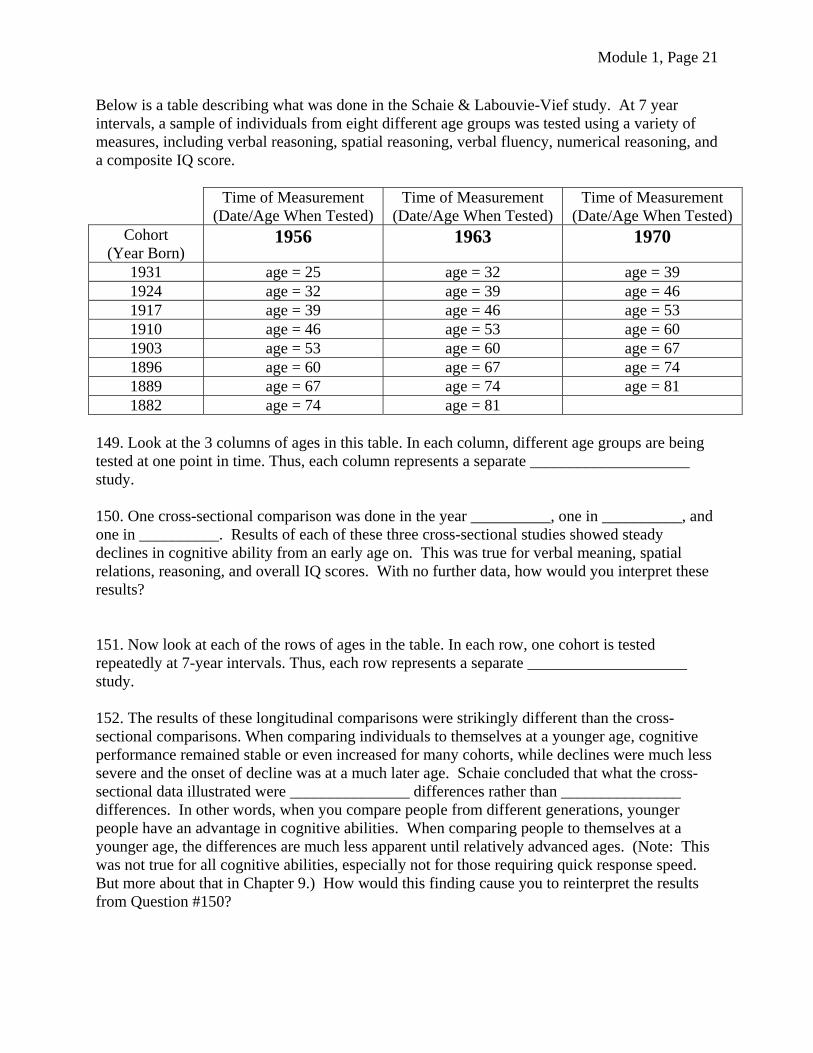
Below is a table describing what was done in the Schaie & Labouvie-Vief study. At 7 year intervals, a sample of individuals from eight different age groups was tested using a variety of measures, including verbal reasoning, spatial reasoning, verbal fluency, numerical reasoning, and a composite IQ score.
Time of Measurement (Date/Age When Tested)
Time of Measurement (Date/Age When Tested)
Time of Measurement (Date/Age When Tested)
Cohort (Year Born)
1956 1963 1970
1931 age = 25 age = 32 age = 39 1924 age = 32 age = 39 age = 46 1917 age = 39 age = 46 age = 53 1910 age = 46 age = 53 age = 60 1903 age = 53 age = 60 age = 67 1896 age = 60 age = 67 age = 74 1889 age = 67 age = 74 age = 81 1882 age = 74 age = 81
149. Look at the 3 columns of ages in this table. In each column, different age groups are being tested at one point in time. Thus, each column represents a separate ____________________ study. 150. One cross-sectional comparison was done in the year __________, one in __________, and one in __________. Results of each of these three cross-sectional studies showed steady declines in cognitive ability from an early age on. This was true for verbal meaning, spatial relations, reasoning, and overall IQ scores. With no further data, how would you interpret these results? 151. Now look at each of the rows of ages in the table. In each row, one cohort is tested repeatedly at 7-year intervals. Thus, each row represents a separate ____________________ study. 152. The results of these longitudinal comparisons were strikingly different than the cross-sectional comparisons. When comparing individuals to themselves at a younger age, cognitive performance remained stable or even increased for many cohorts, while declines were much less severe and the onset of decline was at a much later age. Schaie concluded that what the cross-sectional data illustrated were _______________ differences rather than _______________ differences. In other words, when you compare people from different generations, younger people have an advantage in cognitive abilities. When comparing people to themselves at a younger age, the differences are much less apparent until relatively advanced ages. (Note: This was not true for all cognitive abilities, especially not for those requiring quick response speed. But more about that in Chapter 9.) How would this finding cause you to reinterpret the results from Question #150?
Module 1, Page 22
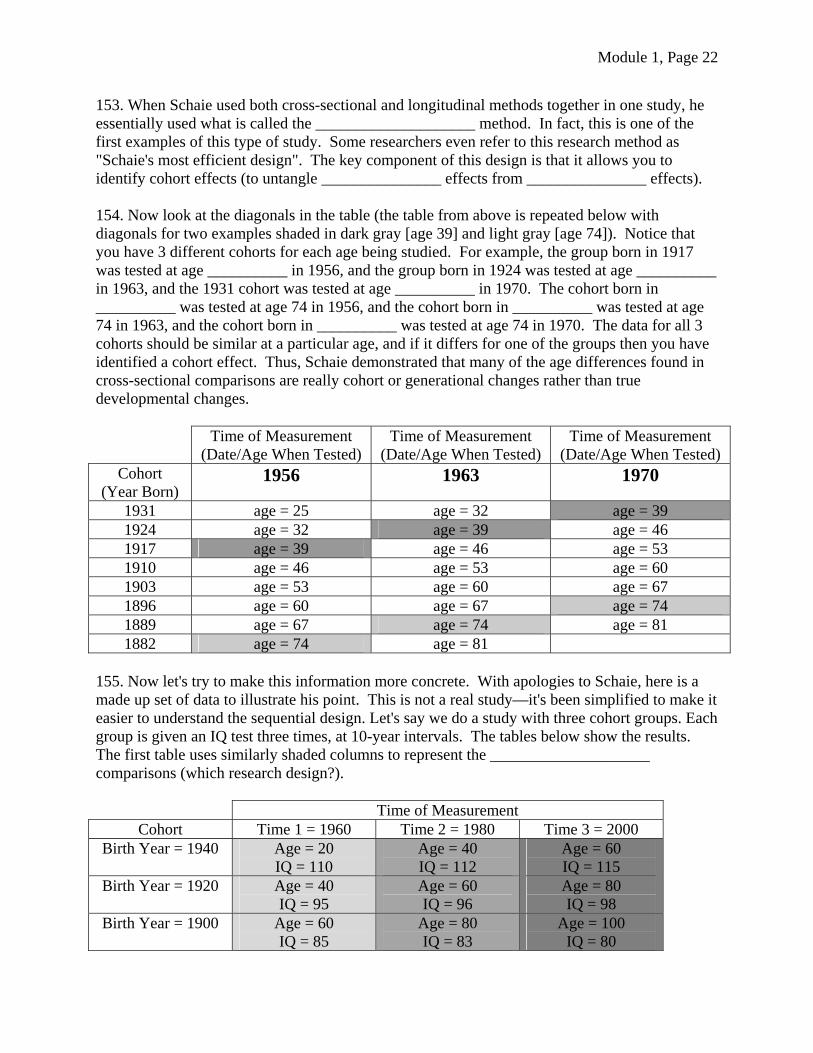
153. When Schaie used both cross-sectional and longitudinal methods together in one study, he essentially used what is called the ____________________ method. In fact, this is one of the first examples of this type of study. Some researchers even refer to this research method as "Schaie's most efficient design". The key component of this design is that it allows you to identify cohort effects (to untangle _______________ effects from _______________ effects). 154. Now look at the diagonals in the table (the table from above is repeated below with diagonals for two examples shaded in dark gray [age 39] and light gray [age 74]). Notice that you have 3 different cohorts for each age being studied. For example, the group born in 1917 was tested at age __________ in 1956, and the group born in 1924 was tested at age __________ in 1963, and the 1931 cohort was tested at age __________ in 1970. The cohort born in __________ was tested at age 74 in 1956, and the cohort born in __________ was tested at age 74 in 1963, and the cohort born in __________ was tested at age 74 in 1970. The data for all 3 cohorts should be similar at a particular age, and if it differs for one of the groups then you have identified a cohort effect. Thus, Schaie demonstrated that many of the age differences found in cross-sectional comparisons are really cohort or generational changes rather than true developmental changes.
Time of Measurement (Date/Age When Tested)
Time of Measurement (Date/Age When Tested)
Time of Measurement (Date/Age When Tested)
Cohort (Year Born)
1956 1963 1970
1931 age = 25 age = 32 age = 39 1924 age = 32 age = 39 age = 46 1917 age = 39 age = 46 age = 53 1910 age = 46 age = 53 age = 60 1903 age = 53 age = 60 age = 67 1896 age = 60 age = 67 age = 74 1889 age = 67 age = 74 age = 81 1882 age = 74 age = 81
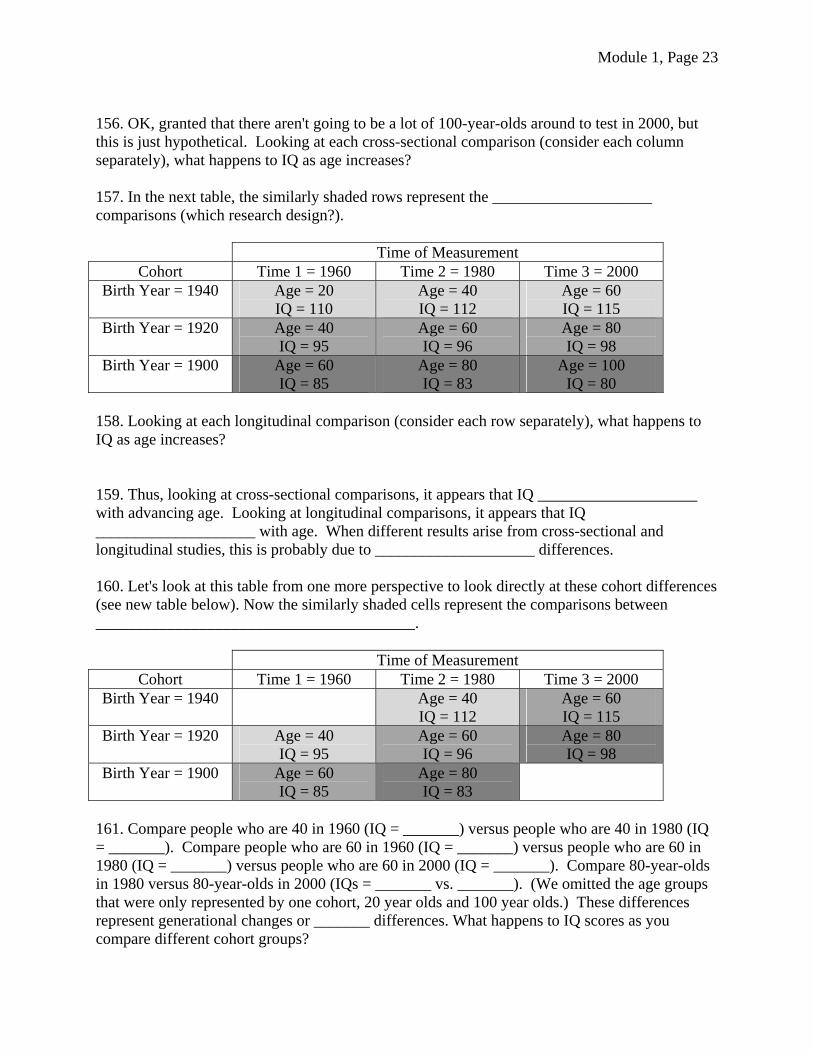
155. Now let's try to make this information more concrete. With apologies to Schaie, here is a made up set of data to illustrate his point. This is not a real study—it's been simplified to make it easier to understand the sequential design. Let's say we do a study with three cohort groups. Each group is given an IQ test three times, at 10-year intervals. The tables below show the results. The first table uses similarly shaded columns to represent the ____________________ comparisons (which research design?).
Time of Measurement Cohort Time 1 = 1960 Time 2 = 1980 Time 3 = 2000
Birth Year = 1940 Age = 20 IQ = 110
Age = 40 IQ = 112
Age = 60 IQ = 115
Birth Year = 1920 Age = 40 IQ = 95
Age = 60 IQ = 96
Age = 80 IQ = 98
Birth Year = 1900 Age = 60 IQ = 85
Age = 80 IQ = 83
Age = 100 IQ = 80
Module 1, Page 23
156. OK, granted that there aren't going to be a lot of 100-year-olds around to test in 2000, but this is just hypothetical. Looking at each cross-sectional comparison (consider each column separately), what happens to IQ as age increases? 157. In the next table, the similarly shaded rows represent the ____________________ comparisons (which research design?).
Time of Measurement Cohort Time 1 = 1960 Time 2 = 1980 Time 3 = 2000
Birth Year = 1940 Age = 20 IQ = 110
Age = 40 IQ = 112
Age = 60 IQ = 115
Birth Year = 1920 Age = 40 IQ = 95
Age = 60 IQ = 96
Age = 80 IQ = 98
Birth Year = 1900 Age = 60 IQ = 85
Age = 80 IQ = 83
Age = 100 IQ = 80
158. Looking at each longitudinal comparison (consider each row separately), what happens to IQ as age increases? 159. Thus, looking at cross-sectional comparisons, it appears that IQ ____________________ with advancing age. Looking at longitudinal comparisons, it appears that IQ ____________________ with age. When different results arise from cross-sectional and longitudinal studies, this is probably due to ____________________ differences. 160. Let's look at this table from one more perspective to look directly at these cohort differences (see new table below). Now the similarly shaded cells represent the comparisons between ________________________________________.
Time of Measurement Cohort Time 1 = 1960 Time 2 = 1980 Time 3 = 2000
Birth Year = 1940 Age = 40 IQ = 112
Age = 60 IQ = 115
Birth Year = 1920 Age = 40 IQ = 95
Age = 60 IQ = 96
Age = 80 IQ = 98
Birth Year = 1900 Age = 60 IQ = 85
Age = 80 IQ = 83
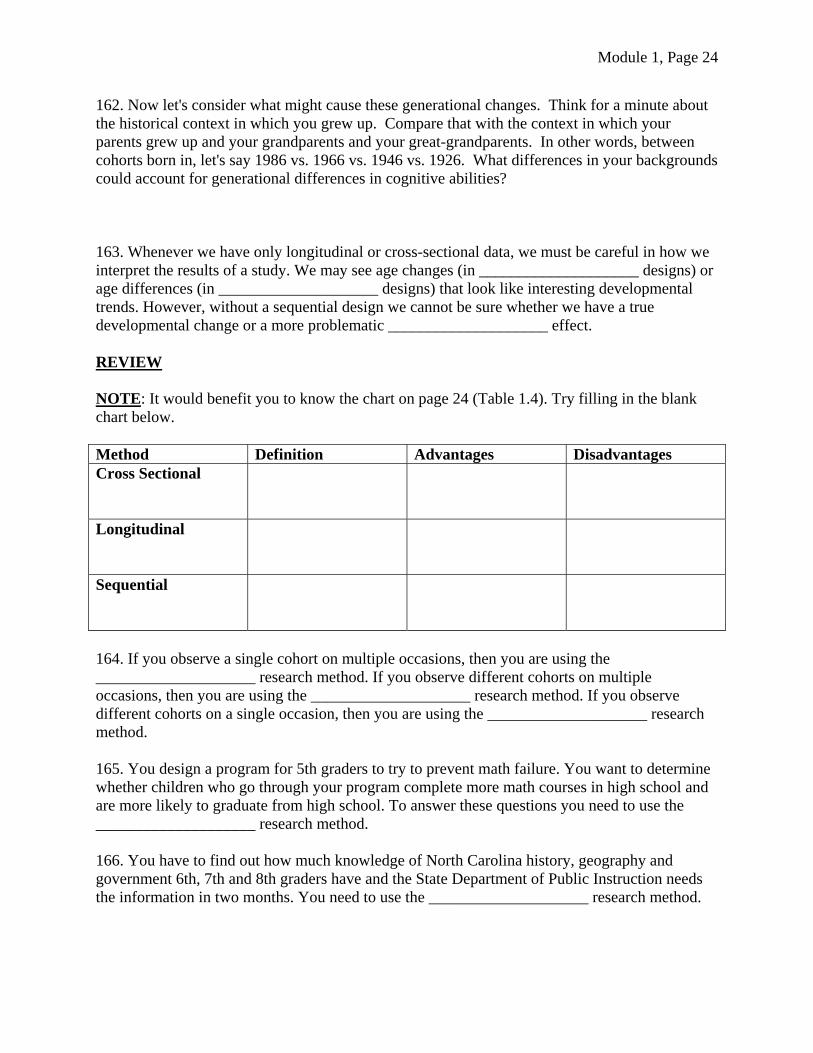
161. Compare people who are 40 in 1960 (IQ = _______) versus people who are 40 in 1980 (IQ = _______). Compare people who are 60 in 1960 (IQ = _______) versus people who are 60 in 1980 (IQ = _______) versus people who are 60 in 2000 (IQ = _______). Compare 80-year-olds in 1980 versus 80-year-olds in 2000 (IQs = _______ vs. _______). (We omitted the age groups that were only represented by one cohort, 20 year olds and 100 year olds.) These differences represent generational changes or _______ differences. What happens to IQ scores as you compare different cohort groups?
Module 1, Page 24
162. Now let's consider what might cause these generational changes. Think for a minute about the historical context in which you grew up. Compare that with the context in which your parents grew up and your grandparents and your great-grandparents. In other words, between cohorts born in, let's say 1986 vs. 1966 vs. 1946 vs. 1926. What differences in your backgrounds could account for generational differences in cognitive abilities? 163. Whenever we have only longitudinal or cross-sectional data, we must be careful in how we interpret the results of a study. We may see age changes (in ____________________ designs) or age differences (in ____________________ designs) that look like interesting developmental trends. However, without a sequential design we cannot be sure whether we have a true developmental change or a more problematic ____________________ effect. REVIEW NOTE: It would benefit you to know the chart on page 24 (Table 1.4). Try filling in the blank chart below. Method Definition Advantages Disadvantages Cross Sectional
Longitudinal
Sequential
164. If you observe a single cohort on multiple occasions, then you are using the ____________________ research method. If you observe different cohorts on multiple occasions, then you are using the ____________________ research method. If you observe different cohorts on a single occasion, then you are using the ____________________ research method. 165. You design a program for 5th graders to try to prevent math failure. You want to determine whether children who go through your program complete more math courses in high school and are more likely to graduate from high school. To answer these questions you need to use the ____________________ research method. 166. You have to find out how much knowledge of North Carolina history, geography and government 6th, 7th and 8th graders have and the State Department of Public Instruction needs the information in two months. You need to use the ____________________ research method.
Module 1, Page 25
167. In 1993, we began studying a group of preschool children, observing their social behavior and relating it to peer ratings of popularity. These children were observed at age 3 and then again the following year (1994) at age 4. A second group of three year olds was also observed in 1994 and again at age 4 (1995). A third group of children was observed at age three in 1995 and at age 4 in 1996. This research design is called the ____________________ research method. Protecting the Rights of Participants 168. What is the purpose of an institutional review board (IRB)? 169. The American Psychological Association and the Society for Research in Child Development have established guidelines to protect the rights of adults and children who participate in psychological research. List and define the four major principles that have been established for protecting the rights of human research participants. 1) 2) 3) 4) Review Questions Let's apply what you've learned about experimental and correlational methods and see how we use these methods to test hypotheses. Say that you want to test the hypothesis that smoking by the mother during pregnancy causes lower birth weight for the infant. You locate a group of 30 women who smoke during pregnancy (assume they all smoke the same type and number of cigarettes). You locate a second group of nonsmoking mothers. You check the birth records to find out the babies' birth weights. 170. The independent variable in this study is ____________________, and the dependent variable is ____________________. 171. The experimental group is ________________________________________, and the control group is ________________________________________. 172. What results would you have to find to be able to support your hypothesis?
Module 1, Page 26
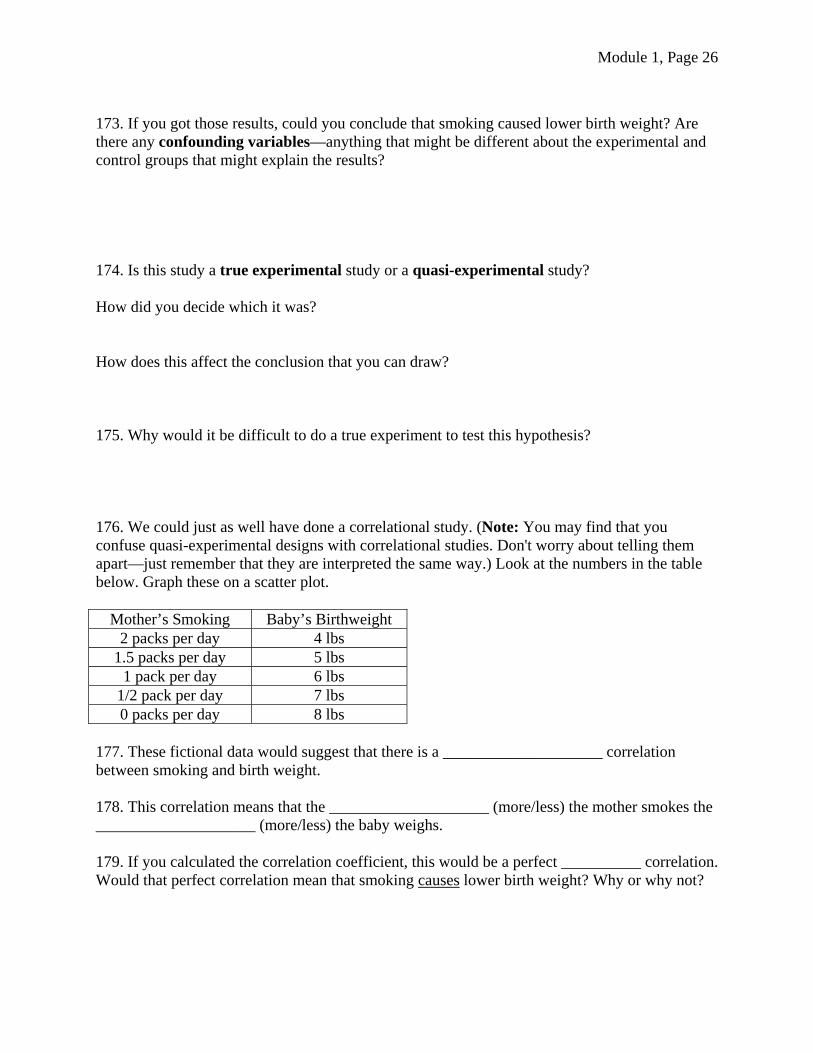
173. If you got those results, could you conclude that smoking caused lower birth weight? Are there any confounding variables—anything that might be different about the experimental and control groups that might explain the results? 174. Is this study a true experimental study or a quasi-experimental study? How did you decide which it was? How does this affect the conclusion that you can draw? 175. Why would it be difficult to do a true experiment to test this hypothesis? 176. We could just as well have done a correlational study. (Note: You may find that you confuse quasi-experimental designs with correlational studies. Don't worry about telling them apart—just remember that they are interpreted the same way.) Look at the numbers in the table below. Graph these on a scatter plot.
Mother’s Smoking Baby’s Birthweight 2 packs per day 4 lbs
1.5 packs per day 5 lbs 1 pack per day 6 lbs
1/2 pack per day 7 lbs 0 packs per day 8 lbs
177. These fictional data would suggest that there is a ____________________ correlation between smoking and birth weight. 178. This correlation means that the ____________________ (more/less) the mother smokes the ____________________ (more/less) the baby weighs. 179. If you calculated the correlation coefficient, this would be a perfect __________ correlation. Would that perfect correlation mean that smoking causes lower birth weight? Why or why not?
Module 1, Page 27
180. What are other ways to interpret this correlation? (Remember the three possible causal relationships in a correlational study.) 181. Think about other variables that might influence birth weight and that are also related to smoking. Relate this back to the idea of a confounding variable in experimental research. What variables did the researcher not measure that could explain the correlation? 182. Even if there were a perfect negative correlation between smoking and birth weight (of course, it's not perfect even though it is negative), we STILL cannot conclude that smoking ____________________ birth weight. 183. However, if we know how much the mother smokes then we can ____________________ the baby's birth weight. If these fictional data were true, and we had a mother who smoked 2.5 packs per day, we could guess that her infant would weigh __________ pounds. 184. The most important thing to remember about correlational research is that it does not allow you to ____________________ behavior but it does allow you to ____________________ behavior. 185. Match the research method with its correct purpose a. explain _____ naturalistic observation b. predict _____ experiment c. describe _____ correlation More Matching. Which of the following research designs best fits the studies described below? a) sequential b) cross-sectional c) correlational d) longitudinal e) true experimental f) quasi-experimental _____ 186. A researcher wants to know whether children's grades can be predicted from parent's ratings of how important they believe academic success is. _____ 187. Fifty hyperactive children are randomly assigned to one of two groups. One group gets Ritalin everyday and the other group is given an inert sugar pill (placebo). Observers record the activity level of the children in the classroom. 188. In the example above, what is the independent variable? 189. What is the dependent variable?

Module 1, Page 28
______ 190. In a study of referential communication, a researcher wants to know how many effective messages are given by separate groups of kindergartners, second graders, fourth graders and sixth graders. ______ 191. Preschool teachers were asked to rate the social skills of separate groups of 2-year-olds, 3-year-olds and 4-year-olds. These three groups of children were then followed up into grade school to see if their social competence in preschool predicted their academic success in first grade. ______ 192. A researcher wants to determine whether children's attitude toward Kindergarten is related to the number of children they know in their class at the beginning of the year. ______ 193. A researcher wants to know if children's attitude toward Kindergarten changes between the first day of school in September and the last day of school in May. ______ 194. A researcher compares two groups of students, one who attend a private high school and one group who attends a public high school. The researcher wants to know whether SAT scores are higher for the public school or the private school students.