Embed Size (px)
Citation preview
Module 10: Preparing to Monitor Server Performance
Overview
Introduction to Monitoring Server Performance
Performing Real-Time and Logged Monitoring
Configuring and Managing Counter Logs
Configuring Alerts
Lesson: Introduction to Monitoring Server Performance
Why Monitor Performance?
Multimedia: Creating a Performance Baseline
Guidelines for Establishing a Baseline
Why Monitor Performance?
By monitoring performance, you obtain data that you can use to:
Understand workload and its effect on system resources
Identify resource-use trends Test proposed configuration changes Diagnose and optimize the system
Uncover bottlenecks
Multimedia: Creating a Performance Baseline
This presentation explains the general steps for creating a performance baseline
A baseline is the level of system performance that you decide is acceptable
Guidelines for Establishing a Baseline
Measure realistic conditions and connectionsMeasure realistic conditions and connections
Measure over enough time to capture typical work rhythmsMeasure over enough time to capture typical work rhythms
Establish baselines early in deploymentEstablish baselines early in deployment
Lesson: Performing Real-Time and Logged Monitoring
What Is Real-Time and Logged Monitoring?
What Is Task Manager?
What Is the Performance Console?
Why Monitor Servers Remotely?
Practice: Performing Real-Time Monitoring
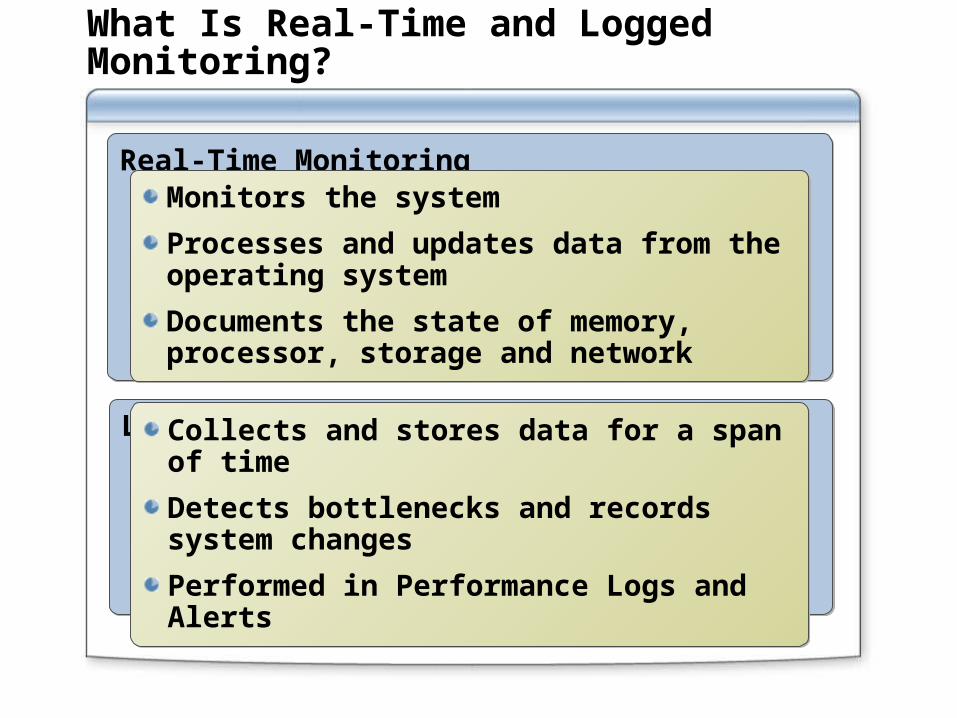
What Is Real-Time and Logged Monitoring?
Real-Time MonitoringReal-Time Monitoring
Logged MonitoringLogged Monitoring
Monitors the system
Processes and updates data from the operating system
Documents the state of memory, processor, storage and network
Monitors the system
Processes and updates data from the operating system
Documents the state of memory, processor, storage and network
Collects and stores data for a span of time
Detects bottlenecks and records system changes
Performed in Performance Logs and Alerts
Collects and stores data for a span of time
Detects bottlenecks and records system changes
Performed in Performance Logs and Alerts
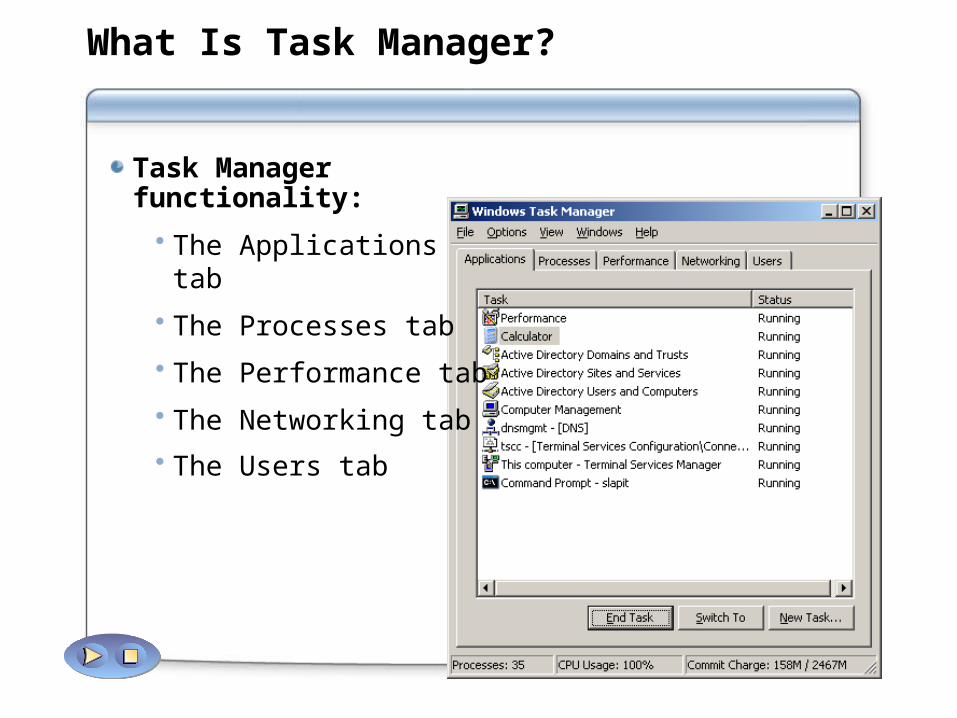
What Is Task Manager?
Task Manager functionality:
The Applications tab
The Processes tab
The Performance tab
The Networking tab The Users tab
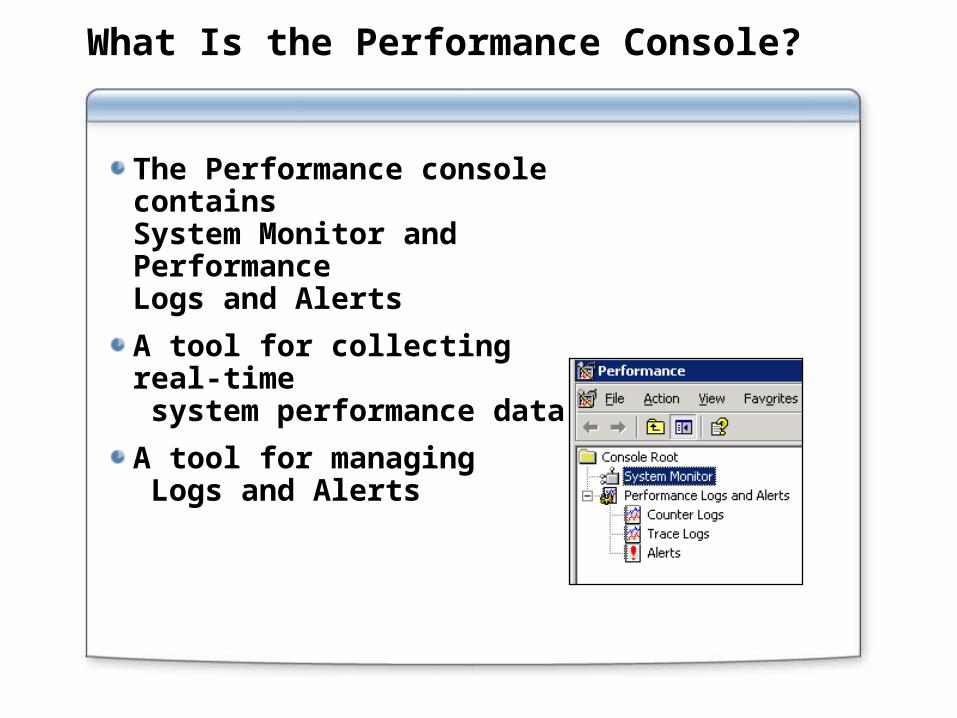
What Is the Performance Console?
The Performance console contains System Monitor and Performance Logs and Alerts
A tool for collecting real-time system performance data
A tool for managing Logs and Alerts
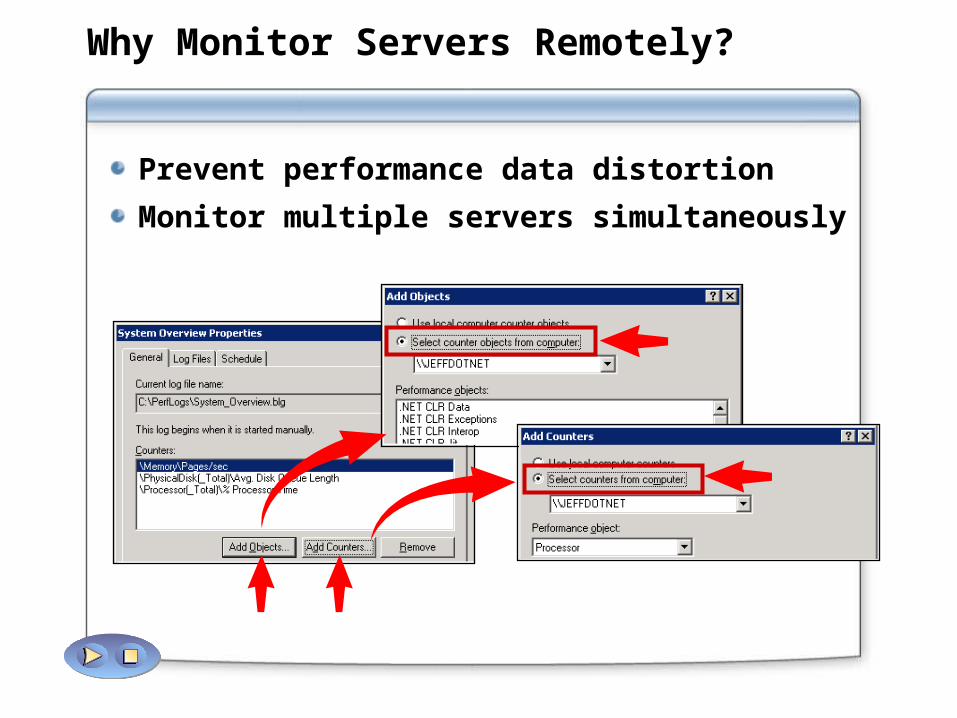
Why Monitor Servers Remotely?
Prevent performance data distortion
Monitor multiple servers simultaneously
Practice: Performing Real-Time Monitoring
In this practice, you will:
Perform real-time monitoring on a local computer
Perform real-time monitoring on a remote computer
Lesson: Configuring and Managing Counter Logs
What Is a Counter Log?
Counter Log File Formats
Why Schedule Counter Logs?
Practice: Configuring and Managing Counter Logs
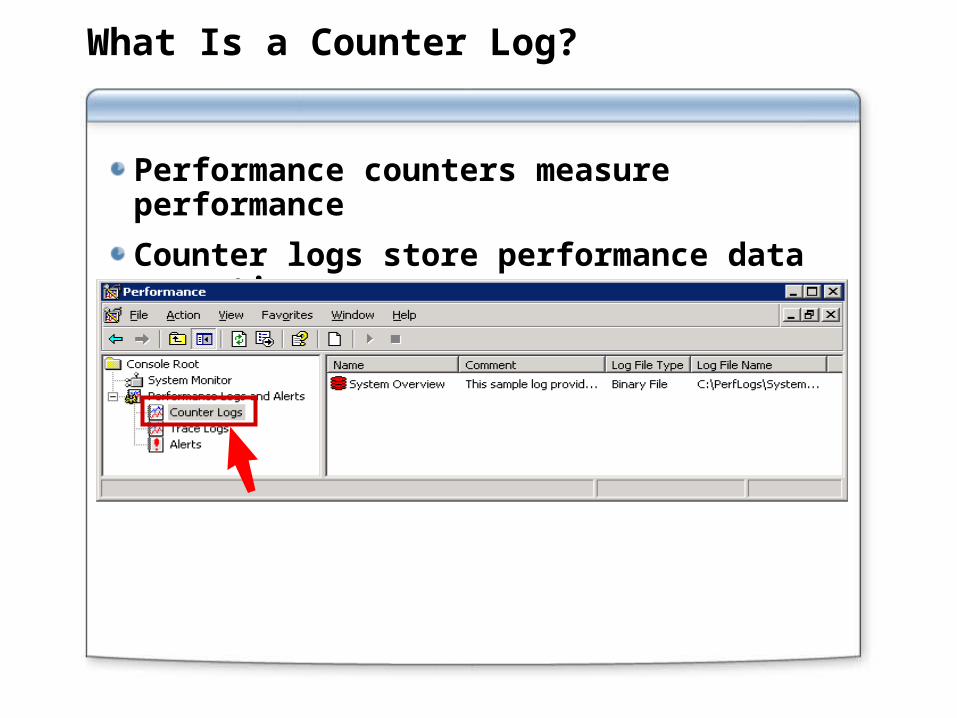
What Is a Counter Log?
Performance counters measure performance
Counter logs store performance data over time
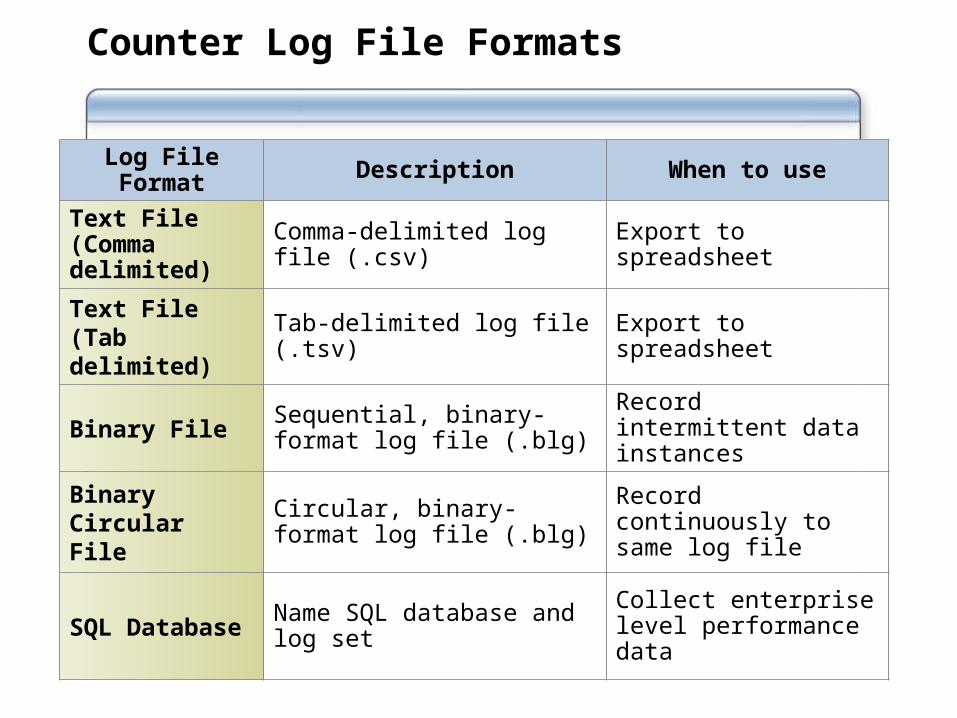
Counter Log File Formats
Log File Format Description When to use
Text File (Comma delimited) Comma-delimited log file (.csv) Export to spreadsheet
Text File (Tab delimited)
Tab-delimited log file (.tsv) Export to spreadsheet
Binary FileSequential, binary-format log file (.blg)
Record intermittent data instances
Binary Circular File Circular, binary-format log file (.blg) Record continuously to same log file
SQL Database Name SQL database and log set Collect enterprise level performance data
Why Schedule Counter Logs?
Schedule counter logs to:Schedule counter logs to:
Create a performance baseline
Determine the effect of replication between domain controllers
Identify bottlenecks resulting from morning login or evening remote access
Monitor evening backups for bottleneck
Scan for bottleneck related system slowdowns
Create a performance baseline
Determine the effect of replication between domain controllers
Identify bottlenecks resulting from morning login or evening remote access
Monitor evening backups for bottleneck
Scan for bottleneck related system slowdowns
Practice: Configuring and Managing Counter Logs
In this practice, you will:
Create a counter log
Schedule a counter log
Lesson: Configuring Alerts
What Is an Alert?
Limitations of Alerts
What Is Event Viewer?
What Is EventCombMT?
Practice: Configuring and Viewing Alerts
What Is an Alert?
A feature that detects out of range values
A counter setting called a threshold
A mechanism that:
Logs events May send a message May start a counter log May initiate a program
A measure based on baselines
Limitations of Alerts
Permissions constrain alert creation
Dependent services constrain alert actions
Example: Messenger service
Faulty remote connections impair the reliability of alerts
What Is Event Viewer?
A tool for viewing and configuring event logs
A way to view the application log
A collection of log files with a 16 MB default size
Filter events based on type, source, computer, and time
What Is EventCombMT?
A utility for parsing event logs on multiple servers
Searching can be based on:
Event ID Event type Source Log
Finds alerts on many servers quickly
Practice: Configuring and Viewing Alerts
In this practice, you will:
Configure an alert
View the alerts using Event Viewer
View the alerts using EventCombMT
Lab: Preparing to Monitor Server Performance
In this lab, you will examine various scenarios and select the appropriate monitoring technique