Embed Size (px)
Citation preview

1
Geography Standards
The World in Spatial Terms• Standard 1: How to use maps and
other geographic representations,
tools, and technologies to acquire,
process, and report information
from a spatial perspective
Physical Systems• Standard 7: The physical pro-
cesses that shape the patterns of
Earth’s surface
Human Systems• Standard 10: The characteristics,
distribution, and complexity of
Earth’s cultural mosaics
Environment and Society• Standard 14: How human actions
modify the physical environment
• Standard 15: How physical
systems affect human systems
The Uses of Geography• Standard 18: How to use geogra-
phy to interpret the present and
plan for the future
Science Standards
Unifying Concepts and Processes• Systems, order, and organization
• Evidence, models, and explanation
• Constancy, change, and measure-
ment
Life Science• Structure and function in living
systems
• Populations and ecosystems
Earth and Space Science• Structure of the earth system
Science and Technology• Understandings about science and
technology
Science in Personal and SocialPerspectives
• Risks and benefits
• Science and technology in society
Module 3 Educator’s Guide Overview
What are the
causes and
consequences of
climate change?
Module OverviewThis module investigates climatic variability. It focuses on the evidence
for global climate change. It includes investigations of the El Niño South-
ern Oscillation (ENSO), the geography and politics of stratospheric ozone,
and the theory of global warming.
Investigation 1: What are the causes and effects of ENSO?The changing temperatures of the tropical Pacific Ocean greatly affect
climate variability. These variations often cause heat waves, droughts,
floods, and other disruptive phenomena. One result of changing ocean
temperatures is called the El Niño Southern Oscillation (or ENSO).
Students role-play policy makers deciding how to allocate Peru’s re-
sources to manage for possible ENSO-related problems. They learn how
ENSO works, how it affects the environment, and how it creates problems
for humans.
Investigation 2: The loss of stratospheric ozone: Where are peopleat risk?Students learn about the recent declines of ozone concentrations above
Antarctica and the Arctic. These declines increase the risk that unusually
high amounts of harmful ultraviolet radiation will reach Earth’s surface and
threaten life, especially in the high latitudes. Students learn how human
actions have affected the natural geography of stratospheric ozone, they
estimate populations at risk from ozone destruction, and they learn how
international complications obstruct solutions to the problem.
Investigation 3: Are we warming Earth?Students assess the theory of global warming—that human activities are
enhancing the greenhouse effect and thus causing Earth’s temperature to
rise. Role-playing science writers for a major newspaper, students write a
story about global warming focusing on (1) what facts point to global
warming? (2) what are the possible causes of global warming? and (3)
how might global warming affect physical and human systems?
Connection to the Curriculum“What are the causes and consequences of climate change?” is an
instructional unit—about three to four weeks in length—that can be
integrated, either in whole or in part, into high school courses in world
geography, physical geography, environmental geography, regional
geography, earth science, and global studies. The material supports
instruction about many physical processes, such as those affecting large-

2
Mathematics Standards
Number and Operation• Understand numbers, ways of
representing numbers, relationships
among numbers, and number
systems
• Compute fluently and make
reasonable estimates
Algebra• Understand patterns, relations, and
functions
• Analyze change in various contexts
Data Analysis and Probability• Develop and evaluate inferences
and predictions that are based on
data
Communication• Communicate mathematical
thinking coherently and clearly to
peers, teachers, and others
Connections• Recognize and apply mathematics
in contexts outside of mathematics
Representation• Use representations to model and
interpret physical, social, and
mathematical phenomena
Technological Literacy
Standards
Technology and Society• Standard 4: The cultural, social,
economic, and political effects of
technology
Module 3 Educator’s Guide Overview
scale oceanic and atmospheric systems as well as the dynamic environ-
mental interactions between physical and human systems at both regional
and global scales of analysis. Connections to mathematics skills are
easily made because the material requires students to work with quantita-
tive data in both graphic and tabular form. The stratospheric ozone
activity has links to chemistry.
TimeInvestigation 1: Five to six 45-minute sessions
Investigation 2: Five to nine 45-minute sessions
Investigation 3: Four to seven 45-minute sessions

3
What are the
causes and
effects of ENSO?
Investigation OverviewInvestigation 1 shows that the changing
temperatures of the tropical Pacific Ocean greatly
affect climate variability. These variations often cause heat waves,
droughts, floods, and other disruptive phenomena. Students learn how
ENSO works, how it affects the environment, and how it creates prob-
lems for humans. The investigation concludes with students role-playing
policy makers and deciding how to allocate Peru’s resources to manage
for possible ENSO-related problems.
Time required: Five to six 45-minute sessions (as follows):
Introduction and Part 1: One session
Parts 2 and 3: One or two sessions
Part 4: One session
Part 5: Two sessions
MaterialsBriefings and Logs (one copy of each per student)
Briefing 1: What are the effects of ENSO?
Briefing 2: The ENSO game: Predicting and managing for El Niño
and La Niña
Log 1: What are the effects of ENSO?
Log 2: The ENSO game: Predicting and managing for El Niño and La
Niña
Computer with CD-ROM. The Mission Geography CD-ROM contains
color graphics needed for this activity.
Optional: Access to the Internet, which offers opportunities for extending
this investigation
Content PreviewClimate change is a major topic of scientific and popular interest and
debate. Issues about global warming caused by a human-enhanced
greenhouse effect dominate this debate, but it is important to know that
natural variability is a fundamental feature of weather and climate. The
El Niño Southern Oscillation (ENSO) is a major example of natural
climatic variability, which also has significant effects on humans.
Classroom ProceduresBeginning the Investigation1. Have students bring to class newspaper and magazine clippings and
photos of severe weather-related events, such as storms, floods,
mud slides, cold spells, heat waves, fires, and droughts. Alterna-
tively, have students conduct Internet searches for this information.
• Have students organize clippings on a bulletin board or Internet
data in a database according to types and locations of events.
Geography Standards
Standard 1: The World inSpatial Terms
How to use maps and othergeographic representations, tools,and technologies to acquire,process, and report information
• Produce and interpret maps
and other graphic representations
to solve geographic problems.
Standard 7: PhysicalSystems
The physical processes thatshape the patterns of Earth’ssurface
• Explain Earth’s physical processes,
patterns, and cycles using concepts
of physical geography.
Standard 15: Environmentand Society
How physical systems affecthuman systems
• Analyze examples of changes in
the physical environment that have
reduced the capacity of the
environment to support human
activity.
Standard 18: The Uses ofGeography
How to apply geography tointerpret the present and plan forthe future
• Develop plans to solve local and
regional problems that have spatial
dimensions.
Geography SkillsSkill Set 4: Analyzing GeographicInformation
• Make inferences and draw conclu-
sions from maps and other
geographic representations.
• Use the processes of analysis,
synthesis, evaluation, and explana-
tion to interpret geographic
information from a variety of
sources.
Module 3 Educator’s Guide Investigation 1

4
• Focus class discussion on (a) the locations and
spatial patterns of these events, (b) the accom-
panying human costs in lost lives, injury, and
property destruction (emphasizing that these
costs are especially difficult to bear when they
occur in poor, developing countries), and (c)
suggestions for reducing these costs.
• Tell students that this investigation focuses on
many of these issues.
Developing the Investigation2. Hand out copies of Briefing 1 and Log 1: What
are the effects of ENSO? to each student or to
small groups of students. Students can work on
this activity individually, but it is recommended that
they work in small groups—pairs or triads are
especially recommended.
3. Leaf through the Briefing and Log with the stu-
dents and point out the underlined questions, which
are to be answered on the Log at the end of the
materials. Give students a schedule for completing
the questions in the Log.
4. Have students read the Background and Objec-tives and then assist them with any questions they
may have.
5. Set students working through the materials,
beginning with Part 1. What is ENSO? Emphasize
the importance of carefully studying and discussing
the images and working together on group answers
to the Log questions. Figures 1 and 2 are espe-
cially important.
6. To monitor progress and to keep students moving
through the materials at about the same pace, ask
students to read aloud passages, give their inter-
pretations of the images, and/or use the Log
questions (or other questions) to generate class
discussion.
7. Part 4. How are human activities affected byENSO? contains some URLs that students may
use to find specific examples of ENSO effects. You
may wish to have students skip over these Internet
resources or use them to extend their knowledge.
8. You may wish to have students complete the Log
before moving on to the ENSO Game. Move on to
the ENSO Game after debriefing the Log.
9. Part 5. The ENSO game may be played as
individuals or in small groups. Direct students to
proceed with the game as it is presented in
Briefing 2: The ENSO game. After deciding
whether the data point to an El Niño or La Niña,
students can use the table in the ENSO Game Log
to record their investment decisions. Tell them to
leave blank the two columns marked “Multiplier”
and “Outcome” because you will supply them with
the multiplier information at the end of the game.
10. ENSO game scoring, examples, and explanations
are in Background below. In debriefing the game,
you may wish to hand out this information to the
class or put it on a transparency. Also, you may
wish to have students share their game decisions
by showing their investment tables.
11. The evidence strongly points to an El Niño event:
sea surface temperatures—current of warm water
pushed against South American coast (Figure 11),
increased precipitation forecasts for Peru—in many
cases above 300 percent (Figure 12), and a
severely curtailed upwelling (Figure 13). Students
who miss this suffer greatly in the game scoring.
The Peruvian background is critical for understand-
ing how ENSO affects each of the categories.
12. The two keys to this game are to have students
(1) recognize that the upcoming episode is an El
Niño and (2) understand the effects of an El Niño
on agriculture, fishing, and disaster preparedness.
Students who invest all of the money on one item
will lose money, as will students who think that it is
a La Niña year. The highest scoring students will
invest money in rice production, move the fishing
fleets north and south for the season, and invest a
substantial percentage of the funds in infrastructure
and disaster preparedness. For illustration, three
possible outcome scenarios follow:
Student (or group) A, thinking that the upcoming
event is a La Niña, invests in the following:
$100 million—cotton
$100 million—more fishing boats and fishing
production
Outcome: loses $50 million of the cotton invest-
ment (-50%) and $75 million on the fishing
investment (-75%). The total before the disaster
preparedness score would be $75 million.
However, because the student (or group) did not
account for the floods and other natural disas-
ters, she/they suffer an additional $600 million
loss, thus ending with a final loss of $525 million.
Student (or group) B, thinking that the upcoming
event is an El Niño, invests in the following:
Module 3 Educator’s Guide Investigation 1

5
$100 million—rice
$100 million—move the fleet north and south for
the season
Outcome: earns $200 million for the rice invest-
ment ($100 million x 2) and $300 million on the
fishing industry ($100 million x 3). The total
score before disaster preparedness scoring is
$500 million. But she/they lose $600 million
because of no investment in disaster prepared-
ness, so the final loss is $100 million.
Note: Students who do not invest in the fishingindustry lose money because the fishing industryin Peru is based on large annual yields. If thefishing industry simply does nothing in the face ofan El Niño, it is likely that it will still suffer eco-nomic losses.
Student (or group) C, thinking that the upcoming
event is an El Niño, allocates investments as
follows:
$100 million—rice
$50 million—move the fleet north and south for
the season
$50 million—disaster preparedness
Outcome: students who invest across all three
categories will always do best in this game.
Student (or group) C earns $200 million for the
rice investment ($100 million x 2) and $150
million ($50 million x 3) for moving the fleet north
and south. Then, the $50 million invested in
disaster preparedness earns $100 million ($50
million x 2), for final earnings of $450 million.
Concluding the Investigation13. Use the ENSO Game Log key to debrief the game.
Have students discuss the evidence they used to
decide whether this was an El Niño or a La Niña
event.
14. Generate further discussion around various stu-
dents’ investment strategies. If you wish to use
more math, have students find out the range and
average of total scores in the class.
15. Refer students to the Objectives to have them
summarize what they learned with the activity:
• interpretation of satellite images;
• how, when, and where ENSO events occur;
• how ENSO events affect humans in different
places; and
• how to use geographic information to plan and
make decisions.
BackgroundThe ENSO Game ScoringAgricultural Investments:Rice production
Multiplier: 2 x original investmentFor example, for a $50 million investment in rice,
the payoff is $100 million.
The upcoming El Niño episode brings torrential rains to
the highlands and coasts of Peru. Rice, because it
thrives in wet conditions, prospers this year. The rice
industry in Peru experiences a bumper crop. Your
investment helps to feed thousands of people and
generates foreign exchange for Peru’s economy when
rice is exported to neighboring countries that do not
invest in rice production.
Cotton production
Multiplier: 50% loss of original investmentFor example, for a $50 million investment in cotton,
the payoff is $25 million.
The torrential rains of the El Niño do not let up at the
end of the growing season. Although your cotton crops
grow fairly well this year, heavy rains at the end of the
season seriously damage the cotton. Poor climate
prediction leads to a serious economic hardship for
cotton growers and a setback to economic develop-
ment in the country.
Fishing Industry Investments:More fishing boats and fishing production
Multiplier: 75% loss of original investmentFor example, for a $100 million investment in boats
and fishing, the payoff is $25 million.
The El Niño event reduces cold upwelling along the
coast. Fewer nutrients are brought to the surface.
Consequently, fewer phytoplankton grow, fewer fish
arrive to feed on the phytoplankton, and fewer fish are
caught by fishermen. The fishing industry along the
coast suffers economic hardship. Investment in more
fishing boats and production triggers overfishing along
the coast of the few species in the waters. This, in
turn, leads to unemployment in the fishmeal and
manufacturing industries and a substantial loss of your
investment.
Move the fleet north and south for the season
Multiplier: 3 x original investmentFor example, for a $50 million investment to move
the fleet, the payoff is $150 million.
During the El Niño, the fishing fleet moves to the north
and south to take advantage of the shift in upwelling.
Module 3 Educator’s Guide Investigation 1

6
Because of good climate predictions, the fleet captures
a great quantity of fish, which are processed in Peru,
leading to substantial economic growth for the country.
No investments in fishing this year
Multiplier: $50 million penaltySubtract $50 million from your total.
During the El Niño period, the fishing industry has no
funds with which to fish. Fishermen and others working
in the industry are unemployed and suffer economic
hardship. Economic experts estimate that the fishing
industry loses $50 million during the El Niño episode.
Disaster Preparedness Investments:Invest in disaster preparedness
Multiplier: 2 x original investmentFor example, for a $75 million investment in
infrastructure for disaster preparedness, the
payoff is $150 million.
During the El Niño episode, torrential rains fall on the
coasts and mountains of Peru. This creates a potential
for serious flooding problems. But your planning and
investment in infrastructure saves much of the agricul-
tural production from flooding, soil erosion, and destruc-
tion. In addition, roads, highways, bridges, and hospitals
are saved from flooding, which provides for future
economic growth in the upcoming years. Your wise
planning and predictions save many lives and homes.
No investment in disaster preparedness
Multiplier: $600 million penaltySubtract $600 million from your total.
During the El Niño episode, torrential rains lead to
serious problems. Soil erosion and flooding destroy
most of the cotton production in the country. In addi-
tion, flooding destroys highways, roads, bridges, and
hospitals throughout the country. Furthermore, many
homes are destroyed, and many people lose their lives.
Poor climate predictions and failure to fully understand
the potential threats of El Niño to Peru’s infrastructure
have led to consequences that have set the country
back many years in economic development.
EvaluationLog 11. Why are the easterly trade winds important in ENSO?
Easterly trade winds push water toward the west-ern Pacific, which gives that area the warmestocean temperatures on Earth. This leads to aheating of the atmosphere above the pool of waterand convection and precipitation. In fact, oceanic
heat surrounding Indonesia and other westernPacific islands leads to frequent thunderstorms andsome of the heaviest rainfall on Earth.
2. What is the thermocline?
The thermocline is the layer dividing the warmsurface water and deep cold water in the ocean.The thermocline is also a key ingredient in up-welling, nutrient cycling in the ocean, and fish andother animal well-being.
3. What are the indicators of a La Niña?
First, unusually cold ocean temperatures occur inthe equatorial Pacific. This also leads to an in-crease in the intensity of easterly trade winds andmore oceanic upwelling.
4. Why do you think ocean-based measurements are
important?
A number of reasons might be mentioned for theimportance of ocean-based measurements. First,ocean measurements can help us more accuratelypredict when an ENSO event is taking place. Inaddition, ocean-based measurements also allowscientists to predict ENSO events more rapidly. Forexample, as ocean temperatures change along theequator, buoys and ships can quickly detect thesechanges. Another possible reason for the impor-tance of ocean-based measurements is that they willincrease our understanding of how ENSO eventsoccur and how they may be changing. Yet anotherresponse may be that ocean-based measurementswill increase our understanding of how the oceansfunction and how tides, climate, and currents changeand interact with the atmosphere.
5. Describe the different effects of El Niño and La
Niña on each of the following regions:
North America
El Niño—Warmer temperatures in Alaska andwestern and eastern Canada. Wet and coolconditions in the southern United States.La Niña—Cool temperatures in Alaska and westernCanada. Dry and warm conditions in the southernUnited States.
Module 3 Educator’s Guide Investigation 1

7
South America
El Niño—Wet and warm conditions in the north-western region (Ecuador and Peru). Dry conditionsalong the northeastern portion of the region(French Guyana, northern Brazil). Warm condi-tions in eastern Brazil. Wet conditions in southernBrazil and Uruguay.La Niña—Dry and cool conditions in the northeast-ern region. Wet conditions along the northwesternportion of the region. Cool conditions in easternBrazil.
Africa
El Niño—Wet in central Africa and dry and warm insouthern Africa and Madagascar.La Niña—Cool conditions in western Africa. Dryconditions in central Africa. Wet and cool condi-tions in southern Africa.
Asia
El Niño—Dry and warm conditions throughoutmost of Asia.
La Niña—Wet conditions in the southern portion ofAsia. Cool temperatures in Japan and theKorean peninsula.
Southeast Asia
El Niño—Dry and warm conditions throughoutsoutheast Asia.
La Niña—Wet conditions throughout most ofsoutheast Asia.
6. What are the El Niño temperature and precipitation
predictions for your hometown?
Answers to this question based on Figures 8 and 9will vary depending on where students live.
Log 21. Is an El Niño or a La Niña forming? Support your
answer by referring to Figures 11, 12, and 13.
The evidence supplied to students strongly pointsto an El Niño event: sea surface temperatures—warm water pushed against South American coast(Figure 11), increased precipitation forecasts forPeru—in many cases above 300 percent (Figure12), and a severely curtailed upwelling (Figure 13).
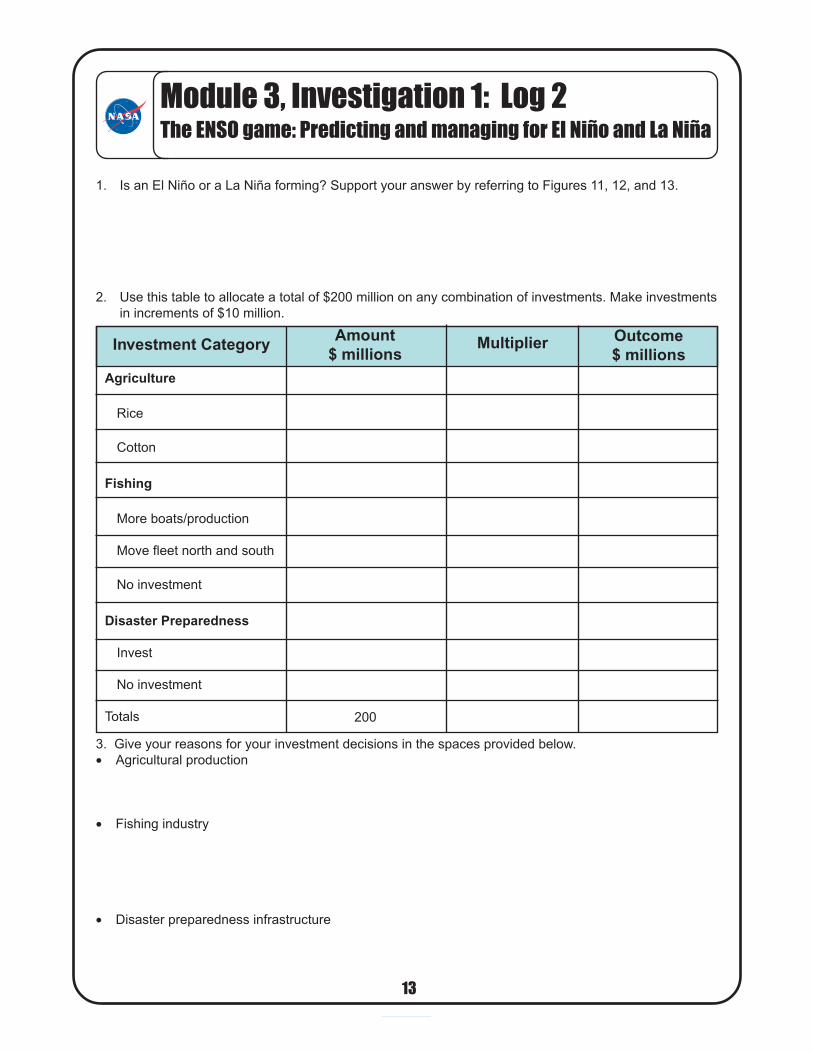
2. Use this table to allocate a total of $200 million on
any combination of investments. Make invest-
ments in increments of $10 million.
3. Give your reasons for your investment decisions in
the spaces provided below.
Student reasons will vary but should be logical andbased primarily on their knowledge of the effects ofEl Niño as well as of the Peruvian economy.
Module 3 Educator’s Guide Investigation 1
InvestmentCategory
Outcome$ millions
Amount$ millions
Multiplier
AgricultureRice
Cotton
FishingMore boats/
production
Move fleet
north and
south
No invest-
ment
DisasterPreparedness
Invest
No invest-
ment
Totals
2 x invest-
ment
50% loss of
investment
75% loss of
investment
3 x invest-
ment
$50 million
penalty
2 x invest-
ment
$600 million
penalty
n/a200

8
BackgroundThe changing temperatures of the tropical Pacific
Ocean affect climate variability all over Earth.
Ocean warming and cooling dramatically affect
human activities by changing weather patterns and
ocean currents. Often, these climate variations
cause heat waves, droughts, floods, mud slides,
tornadoes, wildfires, and many other disasters that
affect human activity. One result of dramatically
changing ocean temperatures (both warm and cold)
is called the El Niño Southern Oscillation (or ENSO).
The warming period, often called “El Niño” or “the
Christ Child,” is so named because of its frequent
late-December appearance. The cooling period is
referred to as “La Niña.” These ENSO events cause
severe problems, but prediction and management of
these periods can reduce human suffering and
damage. In this investigation, you play the role of a
Peruvian government policy maker deciding how to
allocate Peru’s resources to manage for possible
ENSO-related problems. In order to play your role
successfully, you will first need to learn how ENSO
works, how it affects the environment, and how it
creates problems for humans.
ObjectivesIn this investigation, you will
• interpret satellite images
and maps to draw conclu-
sions about the physical
processes producing
ENSO;
• explain how, when, and
where ENSO events
occur;
• give examples of how
ENSO events affect
humans in different places;
and
• use geographic informa-
tion to develop national
plans and investments to
prepare for ENSO events
in Peru and other places.
Module 3, Investigation 1: Briefing 1
What are the effects of ENSO?
1
Part 1. What is ENSO?Atmospheric and oceanic variability affect the
weather. Weather and climate change through
complex links between the oceans and the atmo-
sphere. Sources of variability in weather and
climate around the world are changes in water
currents, atmospheric pressure, and temperature in
the oceans, especially the Pacific Ocean. These
changes in the Pacific are often referred to as the
El Niño Southern Oscillation, or ENSO. Two types
of changes are referred to as El Niño and La Niña.
El Niño is the name given to the occasional warm-
ing of surface waters in the central and eastern
equatorial Pacific Ocean. Under normal conditions,
easterly trade winds blow from east to west along
the equator and push warm surface water to the
western tropical Pacific, where it piles up near
Indonesia and the Australian continent (Figure 1).
The persistent easterly trade winds are key ingredi-
ents of ENSO because they push warm water
toward the western Pacific. This gives that area the
warmest ocean temperatures on Earth. Usually
above 28 degrees C (82 degrees F), parts of this
pool are sometimes as warm as 31.5 degrees C
(89 degrees F). Because this large pool of warm
water is pushed towards the western Pacific, the
Figure 1: Normal atmospheric-oceanic circulation
Source: http://airsea-www.jpl.nasa.gov/ENSO/ElNino.html
9
2
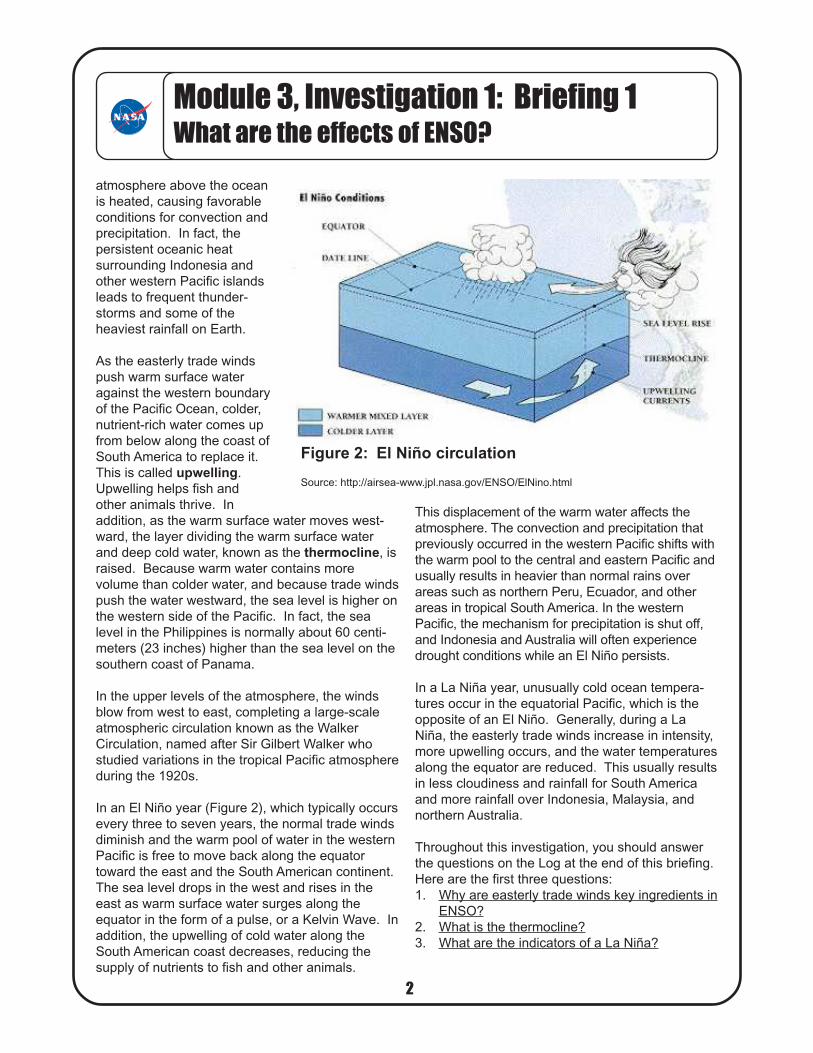
atmosphere above the ocean
is heated, causing favorable
conditions for convection and
precipitation. In fact, the
persistent oceanic heat
surrounding Indonesia and
other western Pacific islands
leads to frequent thunder-
storms and some of the
heaviest rainfall on Earth.
As the easterly trade winds
push warm surface water
against the western boundary
of the Pacific Ocean, colder,
nutrient-rich water comes up
from below along the coast of
South America to replace it.
This is called upwelling.
Upwelling helps fish and
other animals thrive. In
addition, as the warm surface water moves west-
ward, the layer dividing the warm surface water
and deep cold water, known as the thermocline, is
raised. Because warm water contains more
volume than colder water, and because trade winds
push the water westward, the sea level is higher on
the western side of the Pacific. In fact, the sea
level in the Philippines is normally about 60 centi-
meters (23 inches) higher than the sea level on the
southern coast of Panama.
In the upper levels of the atmosphere, the winds
blow from west to east, completing a large-scale
atmospheric circulation known as the Walker
Circulation, named after Sir Gilbert Walker who
studied variations in the tropical Pacific atmosphere
during the 1920s.
In an El Niño year (Figure 2), which typically occurs
every three to seven years, the normal trade winds
diminish and the warm pool of water in the western
Pacific is free to move back along the equator
toward the east and the South American continent.
The sea level drops in the west and rises in the
east as warm surface water surges along the
equator in the form of a pulse, or a Kelvin Wave. In
addition, the upwelling of cold water along the
South American coast decreases, reducing the
supply of nutrients to fish and other animals.
This displacement of the warm water affects the
atmosphere. The convection and precipitation that
previously occurred in the western Pacific shifts with
the warm pool to the central and eastern Pacific and
usually results in heavier than normal rains over
areas such as northern Peru, Ecuador, and other
areas in tropical South America. In the western
Pacific, the mechanism for precipitation is shut off,
and Indonesia and Australia will often experience
drought conditions while an El Niño persists.
In a La Niña year, unusually cold ocean tempera-
tures occur in the equatorial Pacific, which is the
opposite of an El Niño. Generally, during a La
Niña, the easterly trade winds increase in intensity,
more upwelling occurs, and the water temperatures
along the equator are reduced. This usually results
in less cloudiness and rainfall for South America
and more rainfall over Indonesia, Malaysia, and
northern Australia.
Throughout this investigation, you should answer
the questions on the Log at the end of this briefing.
Here are the first three questions:
1. Why are easterly trade winds key ingredients in
ENSO?
2. What is the thermocline?
3. What are the indicators of a La Niña?
Module 3, Investigation 1: Briefing 1
What are the effects of ENSO?
Figure 2: El Niño circulation
Source: http://airsea-www.jpl.nasa.gov/ENSO/ElNino.html
10
3
Part 2. How is ENSO measured?In order to both understand how ENSO works more
fully and predict its effects, better measurements of
ocean conditions and climate change are needed.
Scientists have begun a number of different mea-
surement projects to identify El Niño and La Niña.
For example, space-borne sensors are helping to
monitor variations of surface wind, sea level, and
sea surface temperature along the equator and the
west coasts of the American continents.
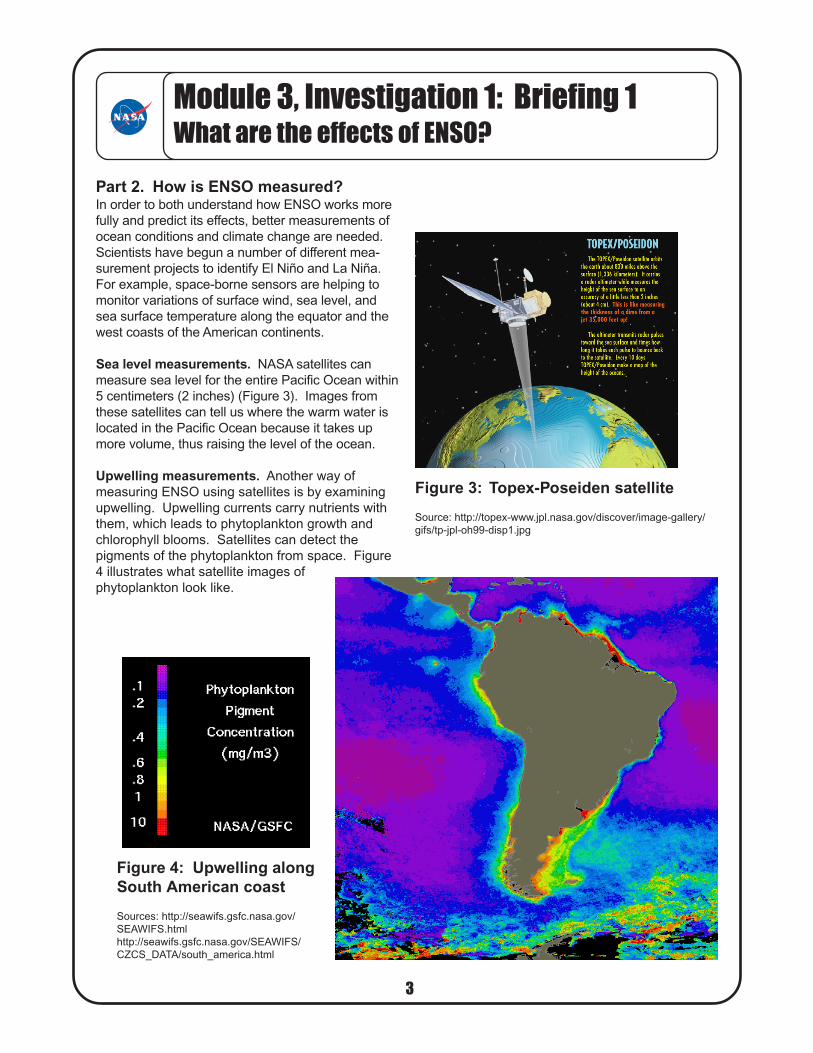
Sea level measurements. NASA satellites can
measure sea level for the entire Pacific Ocean within
5 centimeters (2 inches) (Figure 3). Images from
these satellites can tell us where the warm water is
located in the Pacific Ocean because it takes up
more volume, thus raising the level of the ocean.
Upwelling measurements. Another way of
measuring ENSO using satellites is by examining
upwelling. Upwelling currents carry nutrients with
them, which leads to phytoplankton growth and
chlorophyll blooms. Satellites can detect the
pigments of the phytoplankton from space. Figure
4 illustrates what satellite images of
phytoplankton look like.
Figure 4: Upwelling alongSouth American coast
Sources: http://seawifs.gsfc.nasa.gov/
SEAWIFS.html
http://seawifs.gsfc.nasa.gov/SEAWIFS/
CZCS_DATA/south_america.html
Module 3, Investigation 1: Briefing 1
What are the effects of ENSO?
Figure 3: Topex-Poseiden satellite
Source: http://topex-www.jpl.nasa.gov/discover/image-gallery/
gifs/tp-jpl-oh99-disp1.jpg

11
4
Ocean-based mea-surements. Another
method of identifying
when an ENSO event
is starting is through
measurements taken
in the water of the
Pacific Ocean.
Scientists have
created an extensive
system of floating and
moored buoys, tide
gage stations, and
ship-based observa-
tion systems through-
out the Pacific Ocean
(Figure 5).
Answer Question 4 on
the Log.
Part 3. How do El Niño and La Niñaaffect the weather?
The large oceanic and atmospheric changes
caused by El Niño and La Niña have a profound
effect on Earth’s weather. This is because ENSO
occurrences have strong teleconnections to other
weather patterns. Teleconnections are atmo-
spheric interactions between widely separated
regions. One way of thinking of teleconnections is
that changes in the ocean and atmosphere in the
Pacific can have a ripple effect on climatic condi-
tions in other parts of Earth. This worldwide mes-
sage is conveyed by shifts in tropical rainfall and
wind patterns over much of the globe. Imagine a
rushing stream flowing over and around a series of
large boulders. The boulders create a train of
waves that extend downstream, with crests and
troughs that show up in fixed positions. If one of the
boulders were to shift, the shape of the wave train
would also change and the crests and troughs
would occur in different places.
Scientists are studying the relationships between
ENSO events and weather around the globe to
determine whether links exist. Understanding these
teleconnections can help in forecasting droughts,
floods, tropical storms, and hurricanes. Based on
ENSO patterns and on measurements of the
general circulation of the atmosphere and oceans,
scientists are predicting abnormally wet, dry, warm,
or cold conditions for different regions at different
times. Figures 6 and 7 illustrate the global weather
patterns during an El Niño and a La Niña.
Answer Question 5 on the Log.
Module 3, Investigation 1: Briefing 1
What are the effects of ENSO?
Figure 5: Ocean monitoring system
Source: http://www.pmel.noaa.gov/toga-tao/pmel-graphics/gif/enso-obs-sys.gif

12
5
Module 3, Investigation 1: Briefing 1
What are the effects of ENSO?
Figure 7: La Niña global weather effects
Source: http://www.cpc.ncep.noaa.gov/products/analysis_monitoring/impacts/cold.gif
LA NIÑA RELATIONSHIPS DECEMBER - FEBRUARY
Figure 6: El Niño global weather effects
Source: http://www.cpc.ncep.noaa.gov/products/analysis_monitoring/impacts/warm.gif
EL NIÑO RELATIONSHIPS DECEMBER - FEBRUARY

13
6
How does ENSO affect weather patterns in North
America? During an El Niño, there is a tendency
for higher than normal temperatures in western
Canada and the upper plains of the United States.
This is because the low-pressure system in the
Pacific draws up warm air into Canada, some of
which filters into the northern United States (Figure
8). Another low-pressure system draws cold moist
air into the southern United States, bringing lower
than normal temperatures.
The same low-pressure system in the southern
United States is also responsible for increases in
precipitation during an El Niño, especially in those
areas close to the Gulf of Mexico (Figure 9).
Answer Question 6 on the Log.
Figure 8: Temperature changeduring El Niño in the UnitedStates
Source: http://nsipp.gsfc.nasa.gov/enso/primer/
englishprimer5.html
Figure 9: El Niño precipita-tion in the United States
Source: http://nsipp.gsfc.nasa.gov/enso/primer/
englishprimer6.html
Module 3, Investigation 1: Briefing 1
What are the effects of ENSO?

14
7
Part 4. How are human activities af-fected by ENSO?
ENSO has many effects on human activities. The
economic impacts of the 1982-1983 El Niño,
perhaps the strongest event in recorded history,
are conservatively estimated to have exceeded
$8 billion worldwide from droughts, fires, flooding,
and hurricanes (Table 1). Virtually every continent
was affected by this strong event. An estimated
1,000 to 2,000 deaths were blamed on El Niño and
the disasters that accompanied it. In addition, the
extreme drought in the Midwest Corn Belt of the
United States during 1988 has been tentatively
linked to the “cold event,” or La Niña, of 1988 that
followed the ENSO event of 1986-1987.
The effects of El Niño and La Niña vary according to
the strength of the episodes and the geographic
distribution of weather changes. Some areas
experience heat waves and droughts, while others
have torrential rains and flooding. These specific
weather events occur within wet, dry, warm, and
cool zones associated with the episodes (Figure 10).
Module 3, Investigation 1: Briefing 1
What are the effects of ENSO?
Table 1: The costs of the 1982-83 ElNiño
Figure 10: Generalized effects of El Niño
Source: http://globe.gsfc.nasa.gov/cgi-bin/show.cgi?l=en&b=g&rg=n&page=gallery-elnino-background.ht
Generalized Effects of El Niño
Event/Region Cost
FloodingBolivia
Equador,
Northern Peru
Cuba
U.S. Gulf States
HurricanesTahiti
Hawaii
Drought/FiresSouthern Africa
Southern India,
Sri Lanka
Philippines
Indonesia
Australia
Southern Peru,
Western Bolivia
Mexico, Central
America
Total
$ 300,000,000
650,000,000
170,000,000
1,270,000,000
$ 50,000.000
230,000,000
$1,000,000,000
150,000,000
450,000.000
500,000,000
2,500,000,000
240,000,000
600,000,000
$8,110,000,000
Source: http://nsipp.gsfc.nasa.gov/enso/primer

15
8
1. Why are the easterly trade winds key ingredients in ENSO?
2. What is the thermocline?
3. What are the indicators of a La Niña?
4. Why do you think ocean-based measurements are important?
5. Describe the different effects of El Niño and La Niña on each of the following regions:
North America
South America
Africa
Asia
Southeast Asia
6. What are the El Niño temperature and precipitation predictions for your hometown?
Module 3, Investigation 1: Log 1
What are the effects of ENSO?

16
9
Part 5. The ENSO gameHow can prediction help avoid ENSO’s tragic
human consequences? Scientists from around the
world are involved in forecasting, with computer
models and sophisticated measurements, how
ENSO affects various countries. These scientists
are increasingly being asked by policy makers and
political leaders to help them plan and manage for
the effects of ENSO. In the ENSO game, you play
the role of a policy maker in Peru. You must
determine, based on information given to you by
climate specialists, what sort of ENSO variation is
occurring. Then you must decide how to allocate
Peru’s resources to manage for possible weather-
related problems.
Background for the ENSO gameLong ago, Peruvians observed that the usually cool
water along the Pacific coast of their country be-
came warmer in some years. Because this hap-
pened around Christmas time, they called it El Niño,
which means “Christ Child.” Frequently, these
warming spells were associated with increased
rainfall and flooding within the country. Many times
the flooding was disastrous. In fact, El Niño-related
weather disasters in 1997-1998 led to massive
flooding in the region, causing large negative
economic effects and the loss of human life.
Peru provides a prime example of how even short-
term El Niño forecasts can be valuable. There, as
in most developing countries in the tropics, the
economy (and food production in particular) is
highly sensitive to climate fluctuations. Warm (El
Niño) years tend to be unfavorable for fishing, and
some of them have been marked by damaging
floods along the coastal plain and in the western
Andean foothills in the northern part of the country.
Cold years are welcomed by fishermen, but not by
farmers, because these years have frequently been
marked by drought and crop failures. Peruvians
have reason to be concerned, not only about El
Niño events, but about both extremes of the El
Niño cycle.
Peruvian planners have three primary concerns:
agriculture, fishing, and disaster preparedness.
Agriculture—Since 1983, forecasts of the upcom-
ing rainy season have been issued each November
based on observations of water temperatures and
upwelling in the tropical Pacific region. Once the
forecast is issued, policy makers meet to decide on
the best combination of crops to plant in order to
get the best overall yield. Rice and cotton, two of
the primary crops grown in northern Peru, are
highly sensitive to the quantities and timing of
rainfall. Rice thrives on wet conditions during the
growing season. Cotton, with its deeper root
system, can tolerate drier weather but cannot
tolerate wet weather during the harvest season.
Hence, a forecast of El Niño weather might induce
farmers to plant more rice and less cotton than in a
year without El Niño.
Fishing—Policy makers and fishermen also meet
to decide how to manage for El Niño’s effects on
the fishing industry. El Niño is usually detrimental
to Peru’s coastal fisheries. Declines in coastal
upwelling reduce the fish population. In addition,
coastal flooding increases the amount of sediment
in the water so that the fish either leave or die from
unendurable water conditions. During El Niño
years, the Peruvian fishing industry either reduces
fishing or moves its fleets to the north or south to
catch migrating fish as upwelling patterns shift
away from the Peruvian coast.
Disaster preparedness—Policy makers meet with
disaster preparedness teams to determine what
weather-related problems associated with El Niño
may occur. Usually, El Niño periods lead to intense
rainfall and disastrous flooding and destruction of
critical property such as roads, bridges, dams, and
power lines—things referred to as infrastructure.
Disaster teams need to prepare the country for this
eventuality or the effects of flooding will create
serious economic and social problems.
Data for the ENSO gameClimate specialists have submitted three key
pieces of data to you in your role as a Peruvian
planner and policy maker (Figures 11, 12, and 13).
By interpreting these data correctly, you can
determine whether an El Niño or a La Niña event is
developing off the coast of Peru.
Is an El Niño or a La Niña forming? Support your
answer by referring to Figures 11, 12, and 13.
Write your answer to this question on the ENSO
Game Log.
Module 3, Investigation 1: Briefing 2
The ENSO game: Predicting and managing for El Niño and La Niña

17
10
Module 3, Investigation 1: Briefing 2
The ENSO game: Predicting and managing for El Niño and La Niña
Figure 11: Average sea surface temperature anomalies (degrees above or belownormal), measured in Celsius
Source: European Centre for Medium-Range Weather Forecasts (ECMWF) http://www.ecmwf.int/services/seasonal/forecast/
index.jsp
Degrees above average

18
11
Module 3, Investigation 1: Briefing 2
The ENSO game: Predicting and managing for El Niño and La Niña
Figure 12: Precipitation forecast (percent above normal)
Source: International Research Institute for Climate Prediction (NOAA), http://iri.ldeo.columbia.edu/climate/forecasts/net_asmt/
Percent
Above
Normal
Previous Year This Year
Figure 13: Upwelling
http://seawifs.gsfc.nasa.gov/SEAWIFS.html

19
12
Investments for the ENSO GameNow that you have determined whether an El Niño
or a La Niña is occurring, you need to decide how to
allocate the resources you have, based on what is
likely to happen. You will consider the effects of this
event on agricultural productivity, the fishing indus-
try, and weather-related damage to infrastructure.
The World Bank is lending Peru $200 million to
invest in development efforts this year. The loan
will fund efforts to improve agricultural productivity,
the fishing industry, and infrastructure (flood
management, highways, bridge supports, first aid,
etc.). Based on the likelihood of an El Niño or a La
Niña event, your investments will either contribute
to the future prosperity of the country or result in
disaster and economic decline. You have three
categories to invest in, which are:
Agricultural InvestmentsA. Rice production
B. Cotton production
Fishing Industry InvestmentsA. More fishing boats and fishing production
B. Move the fleet north and south for the season
C. No investments in fishing this year
Disaster Preparedness InvestmentsA. Invest in disaster preparedness
B. No investments
You should allocate a total of $200 million on any
combination of investments, based on your deter-
mination of whether the upcoming year will have an
El Niño or a La Niña. Investments should be
rounded up or down to the nearest $10 million.
Use the table on The ENSO Game Log to make your
investments and then give your reasons for them.
To check on specific effects of El Niño, you can
use the following Internet resources:
IndonesiaResources at this site include forest fires,
drought, and warm temperatures
http://www.ogp.noaa.gov/enso/
asia.html#Fires
Southern AfricaResources at these sites include famine and
drought links
http://www.ogp.noaa.gov/enso/africa.html
http://enso.unl.edu/ndmc/enigma/
elnino.htm
http://www.info.usaid.gov/fews/imagery/
sat_nino.html#El Nino
Southeastern United StatesResources at these sites include flooding,
cooler temperatures, and possible links to
tornadoes
http://www.ogp.noaa.gov/enso/
regional.html#Southeast
http://www.srh.noaa.gov/ftproot/sjt/HTML/
science/elninosjt.html
Californiahttp://twister.sfsu.edu/elnino/elnino.html
Module 3, Investigation 1: Briefing 2
The ENSO game: Predicting and managing for El Niño and La Niña
20
13
1. Is an El Niño or a La Niña forming? Support your answer by referring to Figures 11, 12, and 13.
2. Use this table to allocate a total of $200 million on any combination of investments. Make investments
in increments of $10 million.
3. Give your reasons for your investment decisions in the spaces provided below.
• Agricultural production
• Fishing industry
• Disaster preparedness infrastructure
Module 3, Investigation 1: Log 2
The ENSO game: Predicting and managing for El Niño and La Niña
Investment Category Outcome$ millions
Amount$ millions
Multiplier
Agriculture
Rice
Cotton
Fishing
More boats/production
Move fleet north and south
No investment
Disaster Preparedness
Invest
No investment
Totals
200