Embed Size (px)
Citation preview

Module 3 Stormwater Engineering Concepts
These PowerPoint documents have been made available by DEQ Office of Training Services for study purposes only. Exam questions will not be derived from the PowerPoints. PowerPoint documents will not be allowed into the exam. This presentation is current as of 06.14.2016

Module 3
Module 3 Content
3.a Why stormwater engineering concepts?
3.b Hydrologic Cycle
3.c Quantity
3c1. Rainfall–Runoff Relationships
- Hydrographs
- Stream flow-gauged watersheds
- Hydrograph Development (Synthetic – ungauged)
- Rv, C value, CN

Module 3
3.c Quantity (cont.)
3c2. Rational Method
3c3. Modified Rational Method
3c4. TR-55
3c5. TR-55 – Storage Volume
3c6. Control Structures
3.d Quality
3d1. Simple Method
3d2. Treatment volume
3.e Conversion of volume to flow

Module 3
• Runoff
Reduction
Method
(9VAC25-870-63)
• Concentration
• Volume
• Load ( mg/L * ft3)
Why stormwater engineering concepts?
Roadmap to Water Quantity & Quality
•Channel/Flood Protection (9VAC25-870-66)
•Discharge
•Volume
•Duration
Water Quality
Water Quantity
• Land Cover
• Soils
• Optimize Site
Design
• Mimic (ESD)
Natural Resources

Module 3
Pre-Developed Hydrology Post-Developed Hydrology
Interflow
0-30% Interflow
20%
Evap. ~25%
GW ~15%
GW 30-40%
Runoff
<1% Runoff ~ 30%
Evap. 40-50%
Module 3
0 12 24 36 48 30 72
Time
3
2
1
D
isch
arge
Base flow
Through flow
Overland flow
Basin lag time
4
3
2
Peak flow

Module 3

Module 3

Module 3
Hydrograph: Flow or stage over time.
3/19/2013 Storm Event
Watershed response to rainfall events: i.e Rainfall-Runoff relationship
Hyetograph: Rainfall over time.
Module 3
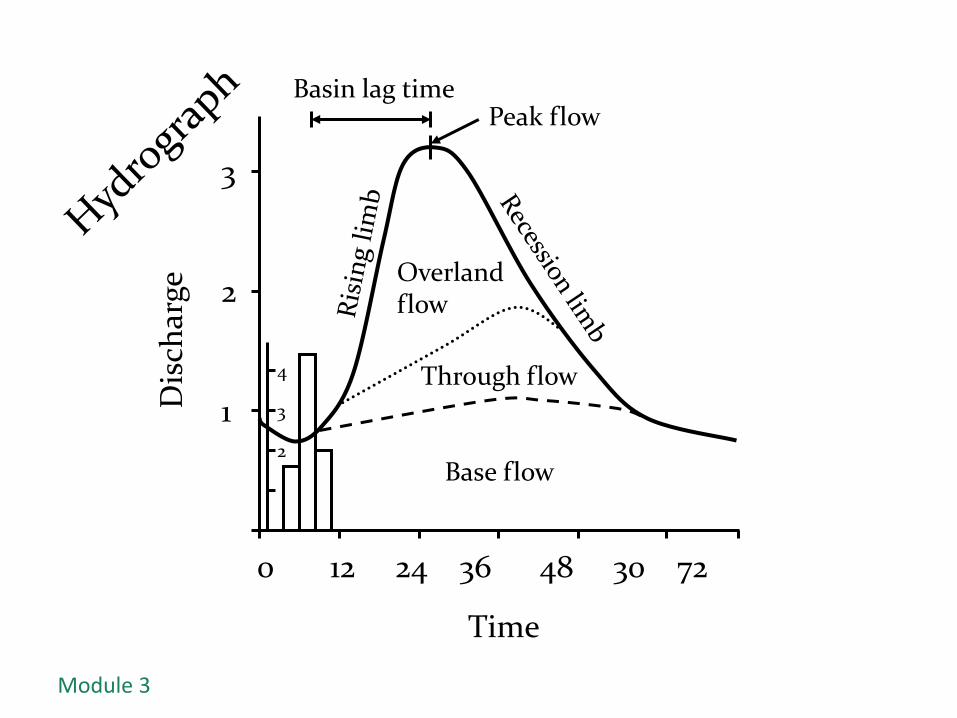
Gauged Watershed Data - Stream control structures
with recording devices - records stage over time

Module 3
Quantity
Residential
Urbanized
Rural
Module 3
0
50
100
150
200
250
300
350
400
0 2 4 6 8 10 12 14
Flo
w R
ate
Time (h)
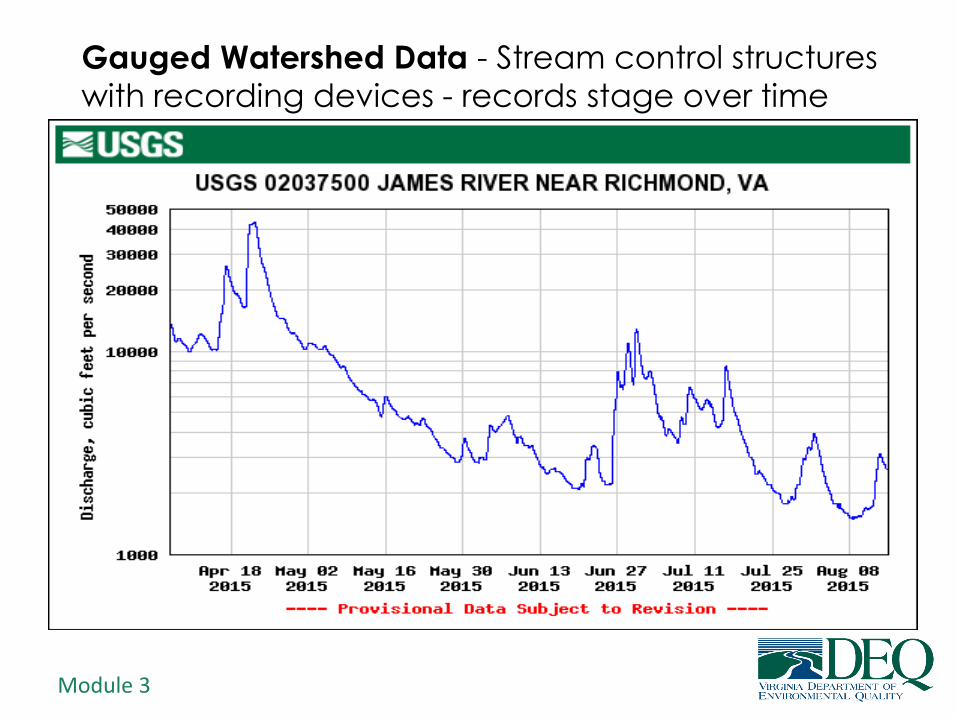
Urban vs. Forested Storm Hydrographs
Urban
Forest

Module 3
• Ungauged watersheds - Impossible to
collect data at every discharge point of
interest.
• Create hydrographs by using synthetic
methods
• Each method provides specific hydrograph
parameters , i.e. discharge, volume
Rainfall-Runoff Relationships

Module 3
• Methods used for various design
applications
o Rational Method
o Modified Rational Method
o NRCS TR-55
• Different methods use different rainfall to
runoff estimators
o CN, C-value, and runoff coefficient Rv
•
Rainfall-Runoff Relationships

Module 3
• C value (Rational), Rv (Simple Method),
CN (TR-55)
• All take into account land cover types
• Only CN and Rv account for soil types
Rainfall-Runoff Coefficients

Module 3
Rational Method
Rational Formula: Estimates peak rate of runoff
AICQ
PG 43

Module 3
Rational Method
• Runoff Coefficient, C
– Fraction of rainfall converted to runoff for
specific land cover type
– Coefficients found in many publications
• Rainfall Intensity, I
– Rainfall Intensity (in/hr) for storm duration equal to time of concentration
– Intensity-Duration-Frequency (I-D-F) curve, (calculate Tc, select return period)
PG 43

Module 3
Rational Method
Rational Equation Runoff Coefficients
PG 48

Module 3
I-D-F Curve for Richmond

Module 3
• Rainfall
– duration equal to Tc
– Coefficient “C” constant
throughout storm
– peak discharge of given frequency storm produced
by average rainfall intensity over entire watershed
Rational Method: Assumptions and Limitations
Tc
Average Intensity (in/hr)
Tc = storm duration Tc = time to peak
Ru
no
ff (
Q)
Time
Duration of average rainfall intensity equal to time of concentration
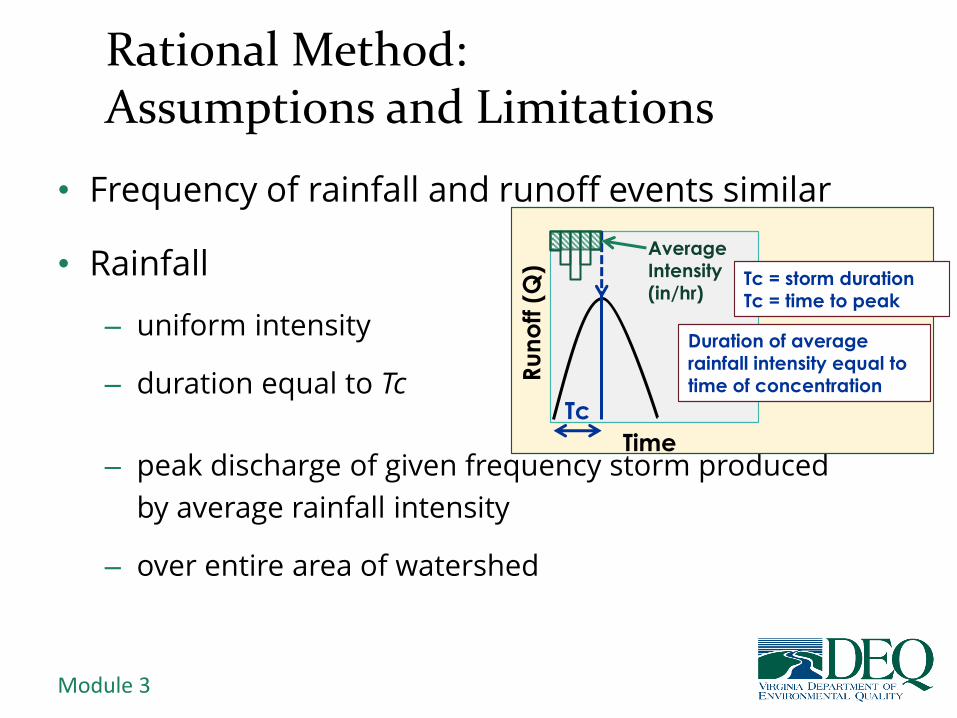
Module 3
• Frequency of rainfall and runoff events similar
• Rainfall
– uniform intensity
– duration equal to Tc
– peak discharge of given frequency storm produced
by average rainfall intensity
– over entire area of watershed
Rational Method: Assumptions and Limitations
Tc
Average Intensity (in/hr)
Tc = storm duration Tc = time to peak
Ru
no
ff (
Q)
Time
Duration of average rainfall intensity equal to time of concentration
Module 3
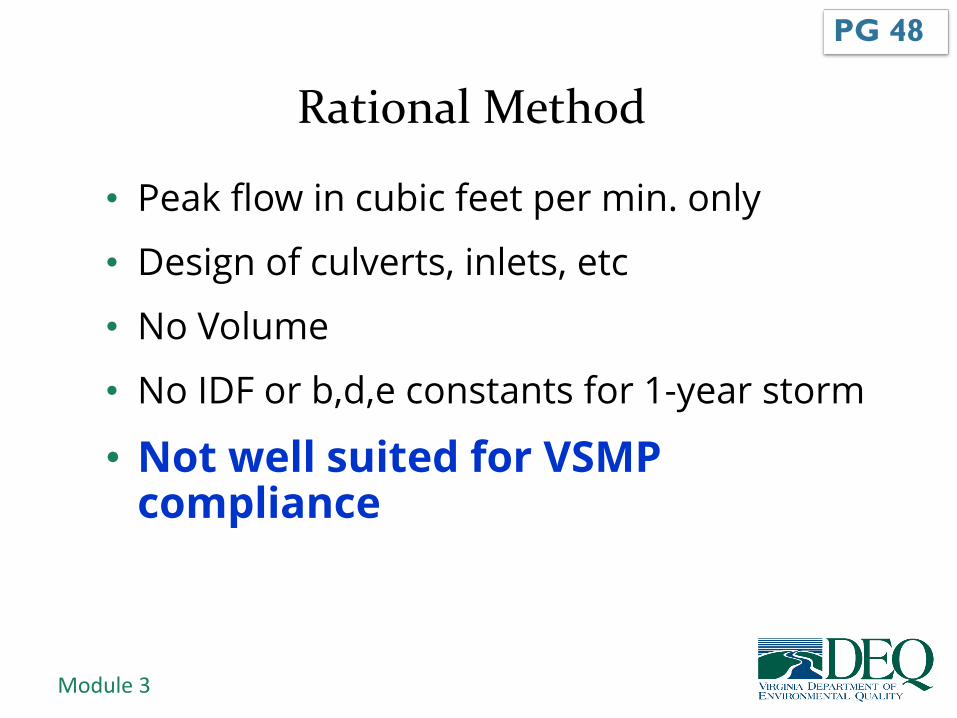
Rational Method
PG 48
• Peak flow in cubic feet per min. only
• Design of culverts, inlets, etc
• No Volume
• No IDF or b,d,e constants for 1-year storm
• Not well suited for VSMP compliance

Module 3
3c3: Modified Rational Method
Variation for sizing detention
facilities
Iterative - Determine
rainfall duration that produces
maximum storage volume
Analyze different durations to find greatest storage
volume
(critical storm duration)
PG 49

Module 3
3c: Modified Rational Method
Modified Rational Method Runoff Hydrographs
1999 SWM Handbook
PG 51

Module 3
MRM Maximum Storage Volume Calculations

Module 3
3c: Modified Rational Method
• Design of retention/detention facilities
• Provides volume based on sizing
• Storm duration corresponds to critical
volume
• Not 24 hours duration
PG 51

Module 3
Urban Hydrology for Small Watersheds (TR-55)
NRCS publication Technical Release Number 55 (TR-55): Urban Hydrology for Small Watersheds, 2nd edition
(June 1986)
See Resources Section for link to TR-55 manual
Review!
PG 49

Module 3
Peak Discharge PG 4,25
qp = quAmQFp
TR-55 presents two methods for
estimating peak discharge
Graphical Method
Provides:
peak discharge and runoff volume
Tabular Method
Provides:
peak discharge, runoff volume, and a runoff
hydrograph
Module 3
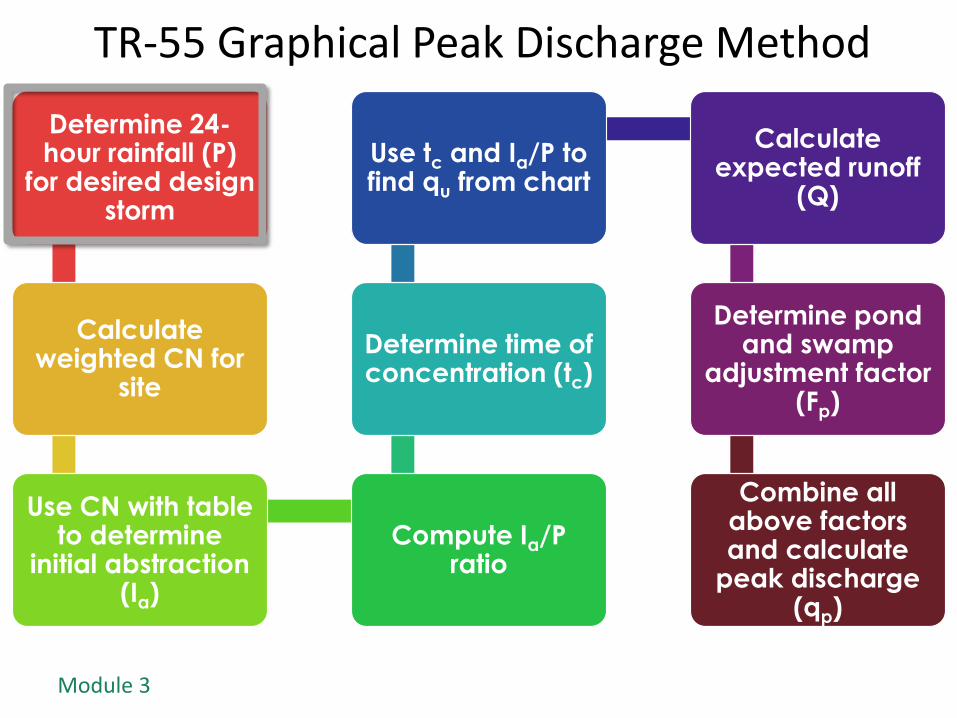
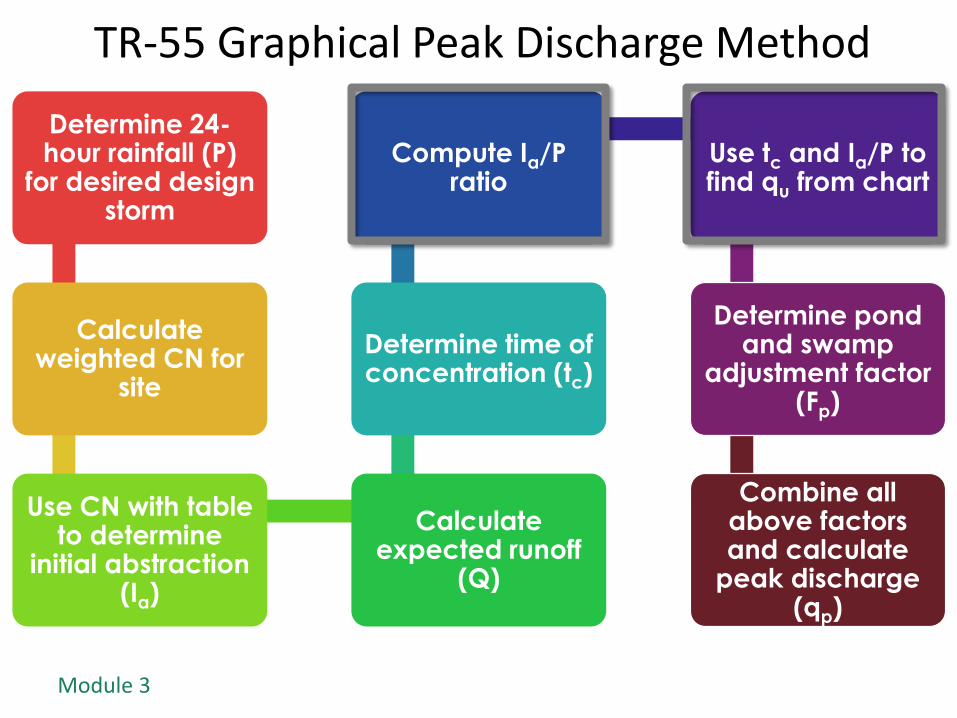
TR-55 Graphical Peak Discharge Method
Determine 24-hour rainfall (P)
for desired design storm
Calculate weighted CN for
site
Use CN with table to determine
initial abstraction (Ia)
Compute Ia/P ratio
Determine time of concentration (tc)
Use tc and Ia/P to find qu from chart
Calculate expected runoff
(Q)
Determine pond and swamp
adjustment factor (Fp)
Combine all above factors and calculate
peak discharge (qp)
Module 3
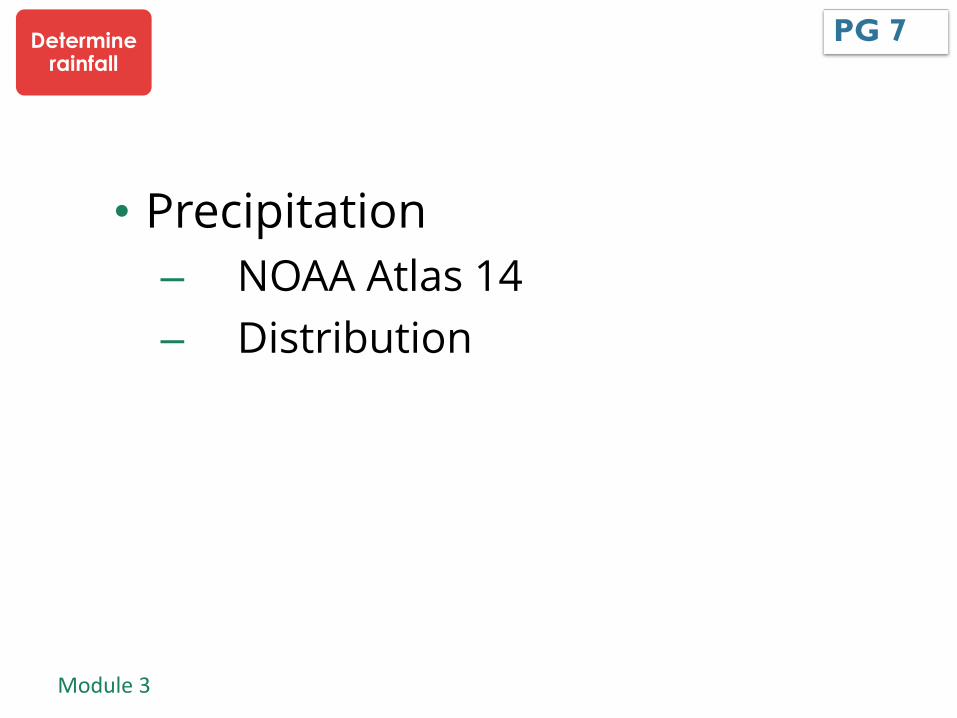
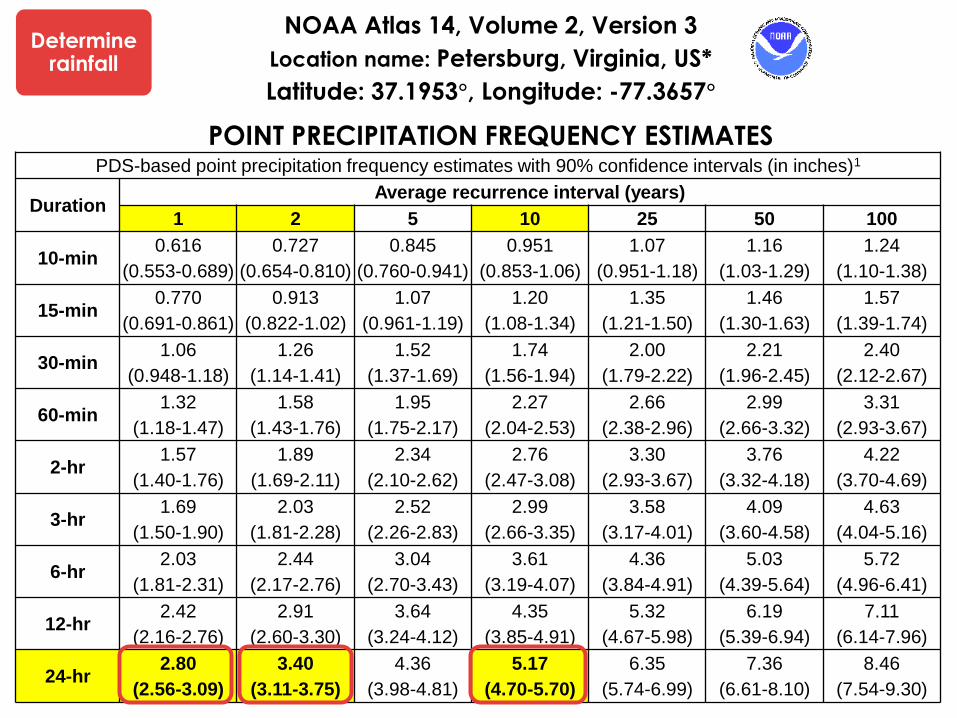
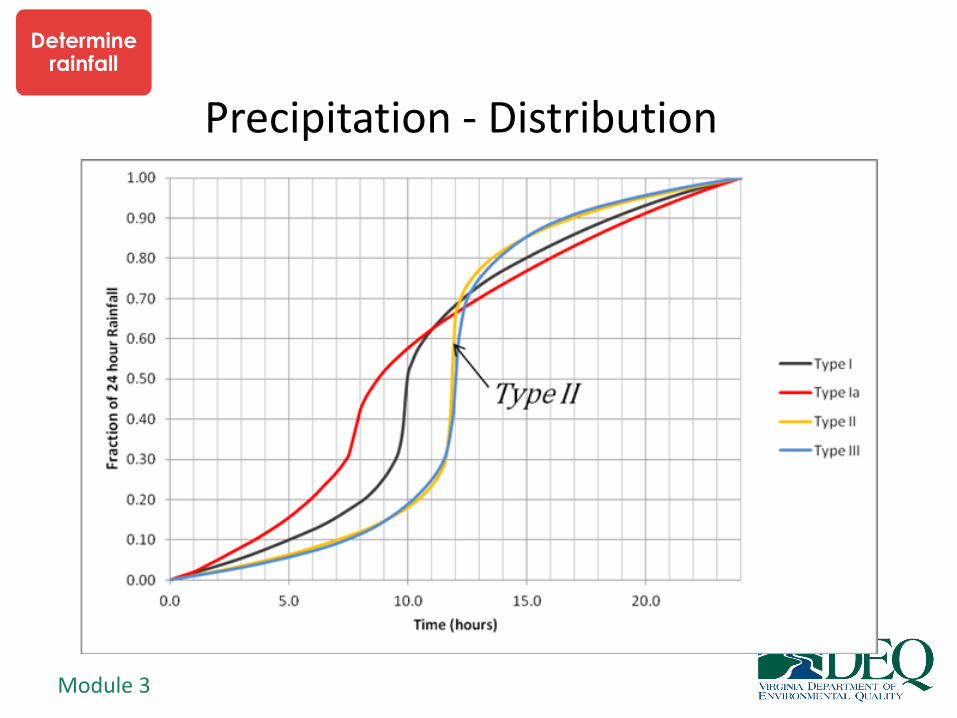
• Precipitation
– NOAA Atlas 14
– Distribution
PG 7 Determine rainfall
Module 3
PDS-based point precipitation frequency estimates with 90% confidence intervals (in inches)1
Duration Average recurrence interval (years)
1 2 5 10 25 50 100
10-min 0.616
(0.553-0.689)
0.727
(0.654-0.810)
0.845
(0.760-0.941)
0.951
(0.853-1.06)
1.07
(0.951-1.18)
1.16
(1.03-1.29)
1.24
(1.10-1.38)
15-min 0.770
(0.691-0.861)
0.913
(0.822-1.02)
1.07
(0.961-1.19)
1.20
(1.08-1.34)
1.35
(1.21-1.50)
1.46
(1.30-1.63)
1.57
(1.39-1.74)
30-min 1.06
(0.948-1.18)
1.26
(1.14-1.41)
1.52
(1.37-1.69)
1.74
(1.56-1.94)
2.00
(1.79-2.22)
2.21
(1.96-2.45)
2.40
(2.12-2.67)
60-min 1.32
(1.18-1.47)
1.58
(1.43-1.76)
1.95
(1.75-2.17)
2.27
(2.04-2.53)
2.66
(2.38-2.96)
2.99
(2.66-3.32)
3.31
(2.93-3.67)
2-hr 1.57
(1.40-1.76)
1.89
(1.69-2.11)
2.34
(2.10-2.62)
2.76
(2.47-3.08)
3.30
(2.93-3.67)
3.76
(3.32-4.18)
4.22
(3.70-4.69)
3-hr 1.69
(1.50-1.90)
2.03
(1.81-2.28)
2.52
(2.26-2.83)
2.99
(2.66-3.35)
3.58
(3.17-4.01)
4.09
(3.60-4.58)
4.63
(4.04-5.16)
6-hr 2.03
(1.81-2.31)
2.44
(2.17-2.76)
3.04
(2.70-3.43)
3.61
(3.19-4.07)
4.36
(3.84-4.91)
5.03
(4.39-5.64)
5.72
(4.96-6.41)
12-hr 2.42
(2.16-2.76)
2.91
(2.60-3.30)
3.64
(3.24-4.12)
4.35
(3.85-4.91)
5.32
(4.67-5.98)
6.19
(5.39-6.94)
7.11
(6.14-7.96)
24-hr 2.80
(2.56-3.09)
3.40
(3.11-3.75)
4.36
(3.98-4.81)
5.17
(4.70-5.70)
6.35
(5.74-6.99)
7.36
(6.61-8.10)
8.46
(7.54-9.30)
NOAA Atlas 14, Volume 2, Version 3
Location name: Petersburg, Virginia, US*
Latitude: 37.1953°, Longitude: -77.3657°
POINT PRECIPITATION FREQUENCY ESTIMATES Processing...
Determine rainfall

Module 3
Precipitation - Distribution
Determine rainfall
Module 3
Precipitation - Distribution
Determine rainfall

Module 3
TR-55 Graphical Peak Discharge Method
Determine 24-hour rainfall (P)
for desired design storm
Calculate weighted CN for
site
Use CN with table to determine
initial abstraction (Ia)
Compute Ia/P ratio
Determine time of concentration (tc)
Use tc and Ia/P to find qu from chart
Calculate expected runoff
(Q)
Determine pond and swamp
adjustment factor (Fp)
Combine all above factors and calculate
peak discharge (qp)

Module 3
CN indicates
runoff potential of an area
PG 7 weighted CN

Module 3
Watershed Delineation:
• Choose watershed outlet point
• Delineate watershed boundary (perpendicular lines across contour lines draining to point of interest
Note - A watershed boundary always runs perpendicular to contour lines
Module 3
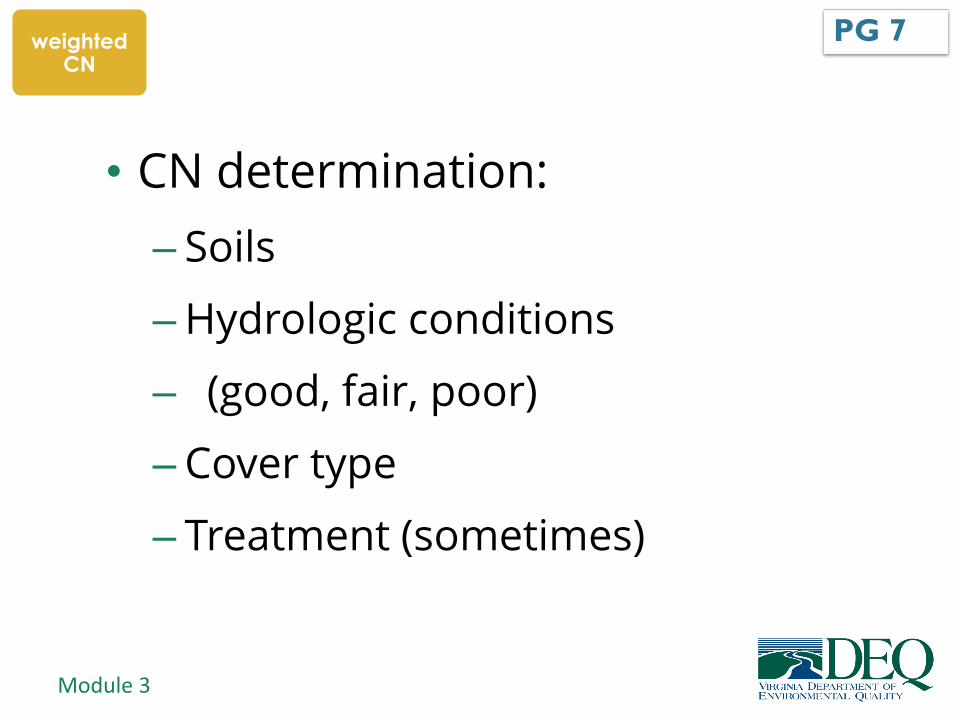
• CN determination:
– Soils
–Hydrologic conditions
– (good, fair, poor)
– Cover type
– Treatment (sometimes)
PG 7 weighted CN
Module 3
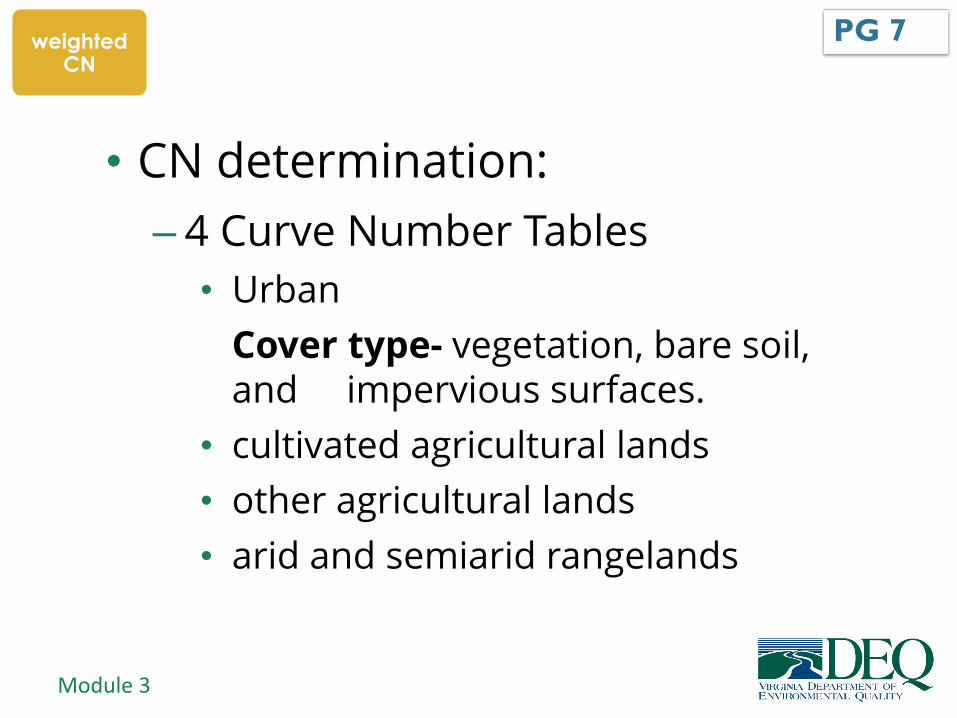
• CN determination:
– 4 Curve Number Tables
• Urban
Cover type- vegetation, bare soil, and impervious surfaces.
• cultivated agricultural lands
• other agricultural lands
• arid and semiarid rangelands
PG 7 weighted CN

Module 3
• Treatment - cover type modifier for agricultural (contouring, terracing)
– For ag and arid/semiarid
weighted CN

Module 3
Group A:
Low runoff potential
Group B: Moderately low runoff potential
Group C: Moderately high runoff potential
Group D: High runoff potential
Hydrologic Soil Groups
PG 7-8 weighted CN

Module 3
Table 3-2 Runoff CNs for Urban Areas PG 12 weighted CN

Module 3
Table 3-3 Runoff Curve Numbers for
Other Agricultural Lands
PG 13 weighted CN

Module 3
Determine a composite curve number given
the following data:
24 acres - open space, soil c
16 acres - 1/2 acre lots, 25% impervious, good
condition, soil b
18 acres - woods Soil D
Solution : (24*74) +(16*70)+(18*77) =
1776+1120+1386=4282/58= 73.8 Round to 74
weighted CN

Module 3
Additional factors that can further adjust
curve numbers
• Antecedent runoff condition
‒ Index of runoff potential before a storm
event
• Urban impervious area modifications
• Connected impervious areas
• Unconnected impervious
PG 10 weighted CN
Module 3
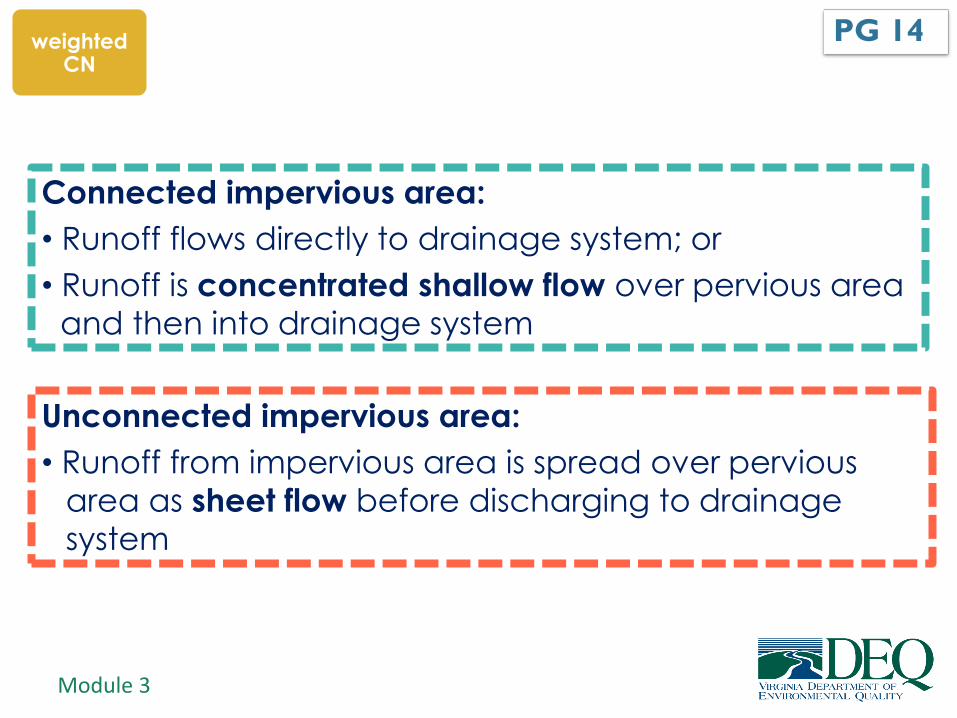
Connected impervious area:
• Runoff flows directly to drainage system; or
• Runoff is concentrated shallow flow over pervious area
and then into drainage system
Unconnected impervious area:
• Runoff from impervious area is spread over pervious
area as sheet flow before discharging to drainage
system
PG 14 weighted CN

Module 3
• Connected vs. unconnected
– Total impervious area < 30% and
Impervious area not directly connected
designer can use Figure 2-4 of TR-55 to
determine CN (Fig. 3-4 in PG)
– Total impervious area ≥ 30%
Impervious area considered connected
designer can use Figure 2-3 from TR-55 to
adjust CN (Fig. 3-3 in PG)
PG 14 weighted CN
Module 3
TR-55 Graphical Peak Discharge Method
Determine 24-hour rainfall (P)
for desired design storm
Calculate weighted CN for
site
Use CN with table to determine
initial abstraction (Ia)
Calculate expected runoff
(Q)
Determine time of concentration (tc)
Compute Ia/P ratio
Use tc and Ia/P to find qu from chart
Determine pond and swamp
adjustment factor (Fp)
Combine all above factors and calculate
peak discharge (qp)
Module 3
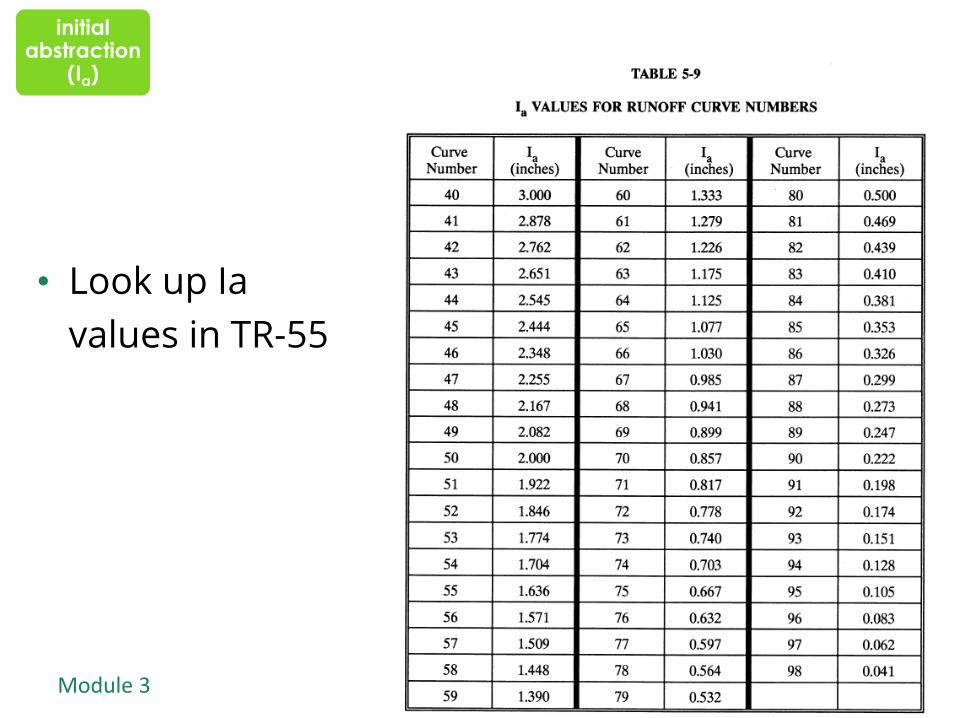
• Look up Ia
values in TR-55
initial abstraction
(Ia)
Module 3
SIP
IPQ
a
a
2
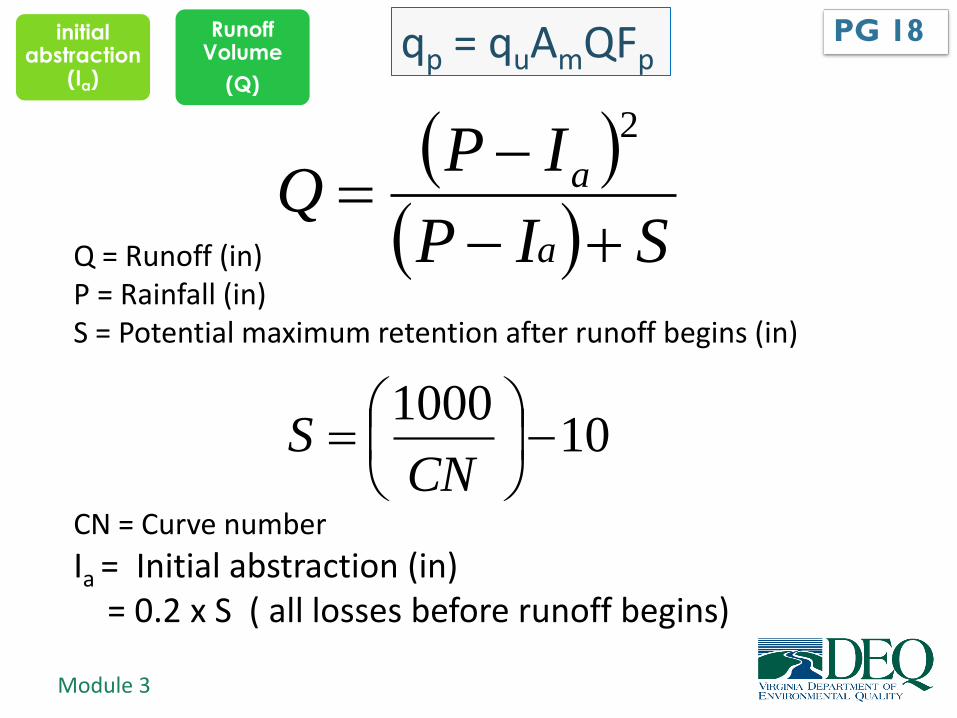
Q = Runoff (in) P = Rainfall (in) S = Potential maximum retention after runoff begins (in) CN = Curve number
Ia = Initial abstraction (in) = 0.2 x S ( all losses before runoff begins)
101000
CNS
PG 18 Runoff Volume
(Q)
qp = quAmQFp initial
abstraction (Ia)

Module 3
Runoff Equation Example 3-1
Step 3:
Find Q
Step 1: Find P
Step 2:
Select CN
curve
PG 19 Runoff Volume
(Q)
initial abstraction
(Ia)

Module 3
Step 1:
Find P
Step 2:
Select CN column
Step 3: Determine Q
Runoff Equation Example 3-2 PG 20 Runoff Volume
(Q)
initial abstraction
(Ia)

Module 3
• Runoff equation
– Used to express how much runoff volume generated by certain volume of rainfall
– Attempts to quantify losses before runoff begins
– Runoff computed is fraction of rainfall
– Used to connect water quality to water quantity in VRRM
PG 18
SIP
IPQ
a
a
2
Runoff Volume
(Q)
initial abstraction
(Ia)

Module 3
Runoff Exercise: Use the 3 methods: Table, Graph, and Equations
Given a watershed with a CN of 90, what
would be the direct runoff (Q) from a
rainfall (P) of 4.0 inches?
P = rainfall (in)
CN = runoff curve number
PG 18-19

Module 3
Step 1:
P = 4.0
Step 2:
CN = 90
Step 3: Q = 2.92
Runoff Equation Example 3-2 PG 20

Module 3
Runoff Equation Example 3-1
Step 3:
Q = 2.9
Step 1: P = 4.0
Step 2:
CN = 90
PG 19

Module 3
Runoff Equation Example 3-1
P = rainfall (in) CN = runoff curve number
S = potential maximum retention after runoff begins (in)
Ia= initial abstraction (in) = 0.2 x S = 0.2 x 1.1 = 0.22
1.11090
100010
1000
CNS
93.21.122.00.4
22.00.4
1
1 22
SP
PQ
a
a
PG 18-19

Module 3
TR-55 Graphical Peak Discharge Method
Determine 24-hour rainfall (P)
for desired design storm
Calculate weighted CN for
site
Use CN with table to determine
initial abstraction (Ia)
Calculate expected runoff
(Q)
Determine time of concentration (tc)
Compute Ia/P ratio
Use tc and Ia/P to find qu from chart
Determine pond and swamp
adjustment factor (Fp)
Combine all above factors and calculate
peak discharge (qp)

Module 3
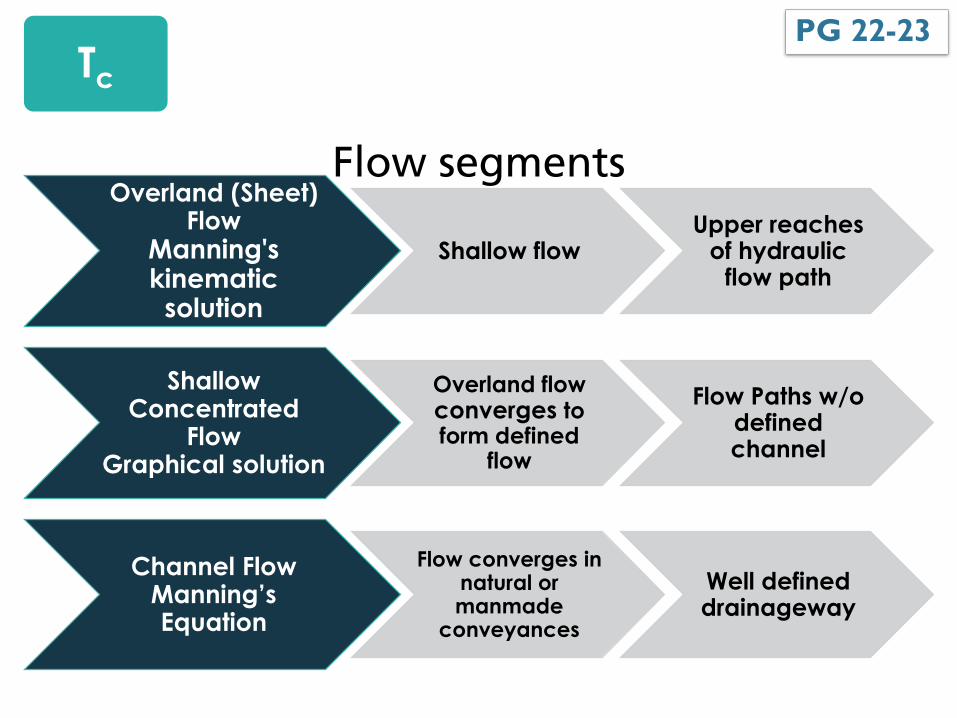
Time of Concentration, Travel Time
Travel time (Tt):
Time it takes water to travel from one location to another in a watershed
Time of concentration (Tc):
Time required for water to travel from most hydraulically distant point in watershed to
point of analysis (runoff from entire watershed contributing)
Tc = (overland flow + shallow concentrated flow + channel flow)
Sum of time increments for each flow segment
PG 21 Tc
Module 3
Flow segments Overland (Sheet)
Flow Manning's kinematic
solution
Shallow flow Upper reaches
of hydraulic flow path
Shallow Concentrated
Flow Graphical solution
Overland flow converges to form defined
flow
Flow Paths w/o defined channel
Channel Flow Manning’s Equation
Flow converges in natural or manmade
conveyances
Well defined drainageway
PG 22-23 Tc
Module 3
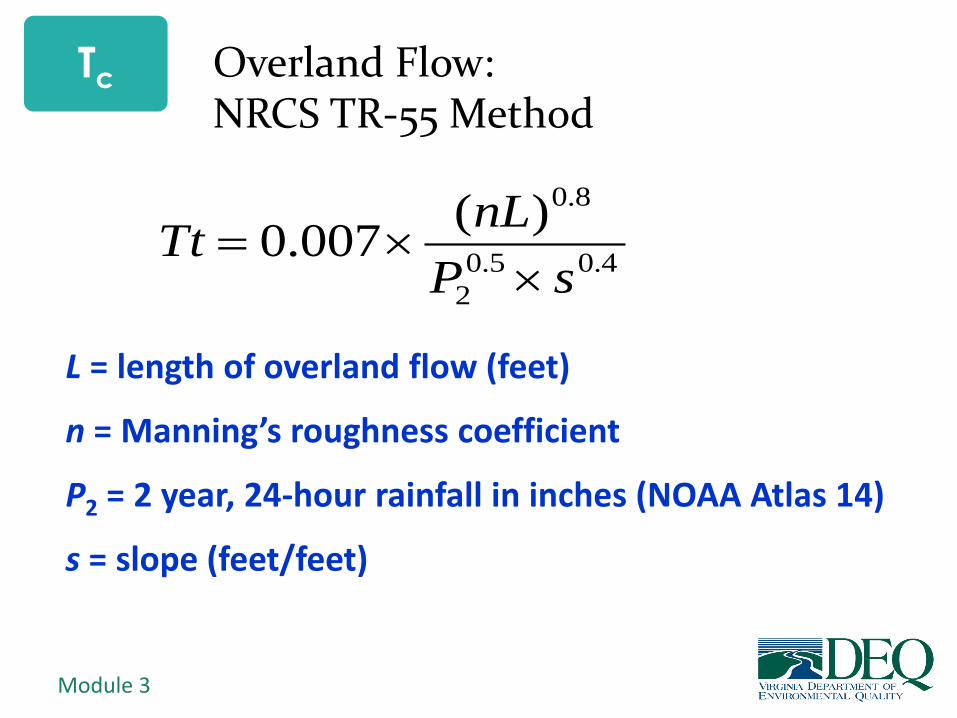
Overland Flow: NRCS TR-55 Method
L = length of overland flow (feet)
n = Manning’s roughness coefficient
P2 = 2 year, 24-hour rainfall in inches (NOAA Atlas 14)
s = slope (feet/feet)
4.05.0
2
8.0)(007.0
sP
nLTt
Tc

Module 3
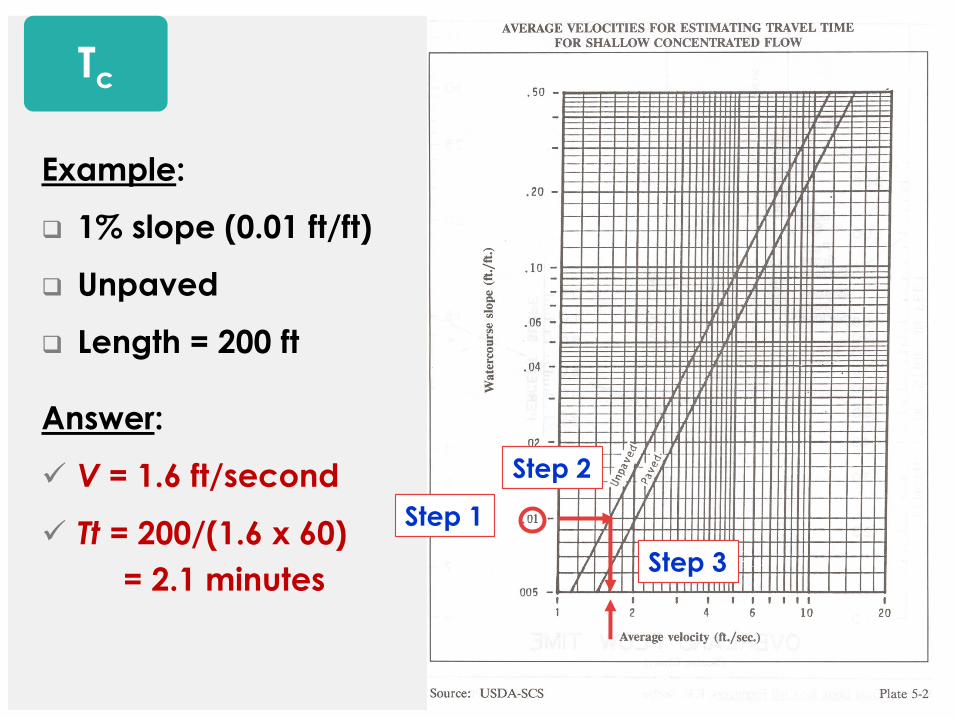
Shallow Concentrated Flow: NRCS TR-55 Method
• Occurs where overland flow converges
to form small rills, gullies, and swales
• Flow length 0 to 1000 feet maximum
Tc

Module 3
Shallow Concentrated Flow: NRCS TR-55 Method
L = flow length (feet)
V = average velocity (feet/second)
t = conversion factor
tV
LTt
Tc
Module 3
Example:
1% slope (0.01 ft/ft)
Unpaved
Length = 200 ft
Answer:
V = 1.6 ft/second
Tt = 200/(1.6 x 60)
= 2.1 minutes
Step 1
Step 2
Step 3
Tc

Module 3
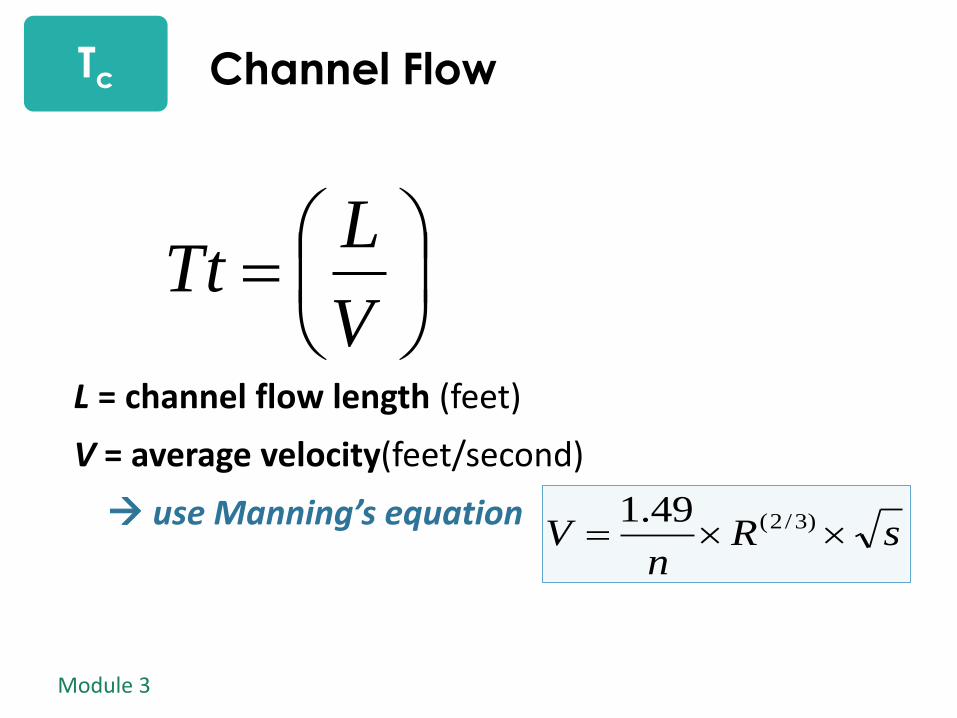
• Occurs where concentrated flow occurs in
channels with well-defined cross-section
(streams, ditches, gutters, pipes, etc.)
• Use velocity from Manning’s equation for
open channel flow: V = velocity (fps)
n = Manning’s roughness coef.
R = hydraulic radius (A/P) A= wetted cross sectional area
P=wetted perimeter(ft)
s = slope (ft/ft)
sRn
V )3/2(49.1
Channel Flow
Tc
Module 3
Channel Flow
L = channel flow length (feet)
V = average velocity(feet/second)
use Manning’s equation
V
LTt
sRn
V )3/2(49.1
Tc

Module 3
SHEET FLOW (Tc only)
SHALLOW CONCENTRATION FLOW
CHANNEL FLOW
PG 24 Tc
Module 3
TR-55 Graphical Peak Discharge Method
Determine 24-hour rainfall (P)
for desired design storm
Calculate weighted CN for
site
Use CN with table to determine
initial abstraction (Ia)
Calculate expected runoff
(Q)
Determine time of concentration (tc)
Compute Ia/P ratio
Use tc and Ia/P to find qu from chart
Determine pond and swamp
adjustment factor (Fp)
Combine all above factors and calculate
peak discharge (qp)

Module 3
1. Use Ia and P to calculate Ia/P ratio
2. Use ratio and Tc value to find qu from chart
Find qu on chart -

Module 3
TR-55 Graphical Peak Discharge Method
Determine 24-hour rainfall (P)
for desired design storm
Calculate weighted CN for
site
Use CN with table to determine
initial abstraction (Ia)
Calculate expected runoff
(Q)
Determine time of concentration (tc)
Compute Ia/P ratio
Use tc and Ia/P to find qu from chart
Determine pond and swamp
adjustment factor (Fp)
Combine all above factors and calculate
peak discharge (qp)

Module 3
Pond & Swamp Adjustment
• Factor needed if ponds
and/or swamps scattered
throughout watershed, but
not on path used to
determine Tc
• Determine percentage of
drainage area represented by
swamps and/or ponds
qp = quAmQFp
Module 3
TR-55 Graphical Peak Discharge Method
Determine 24-hour rainfall (P)
for desired design storm
Calculate weighted CN for
site
Use CN with table to determine
initial abstraction (Ia)
Calculate expected runoff
(Q)
Determine time of concentration (tc)
Compute Ia/P ratio
Use tc and Ia/P to find qu from chart
Determine pond and swamp
adjustment factor (Fp)
Combine all above factors and calculate
peak discharge (qp)
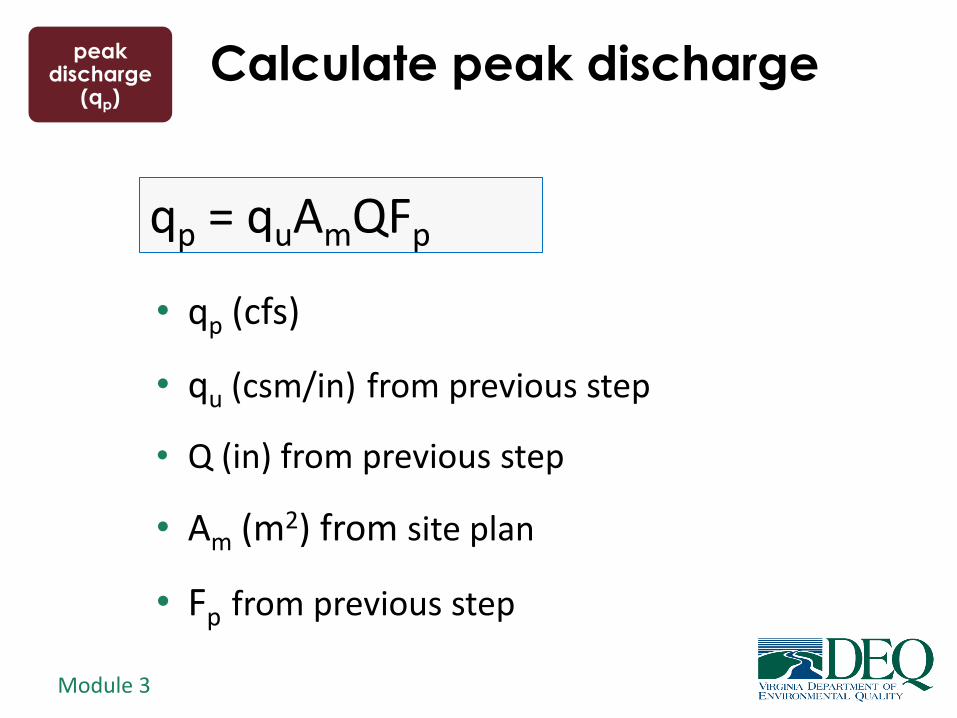
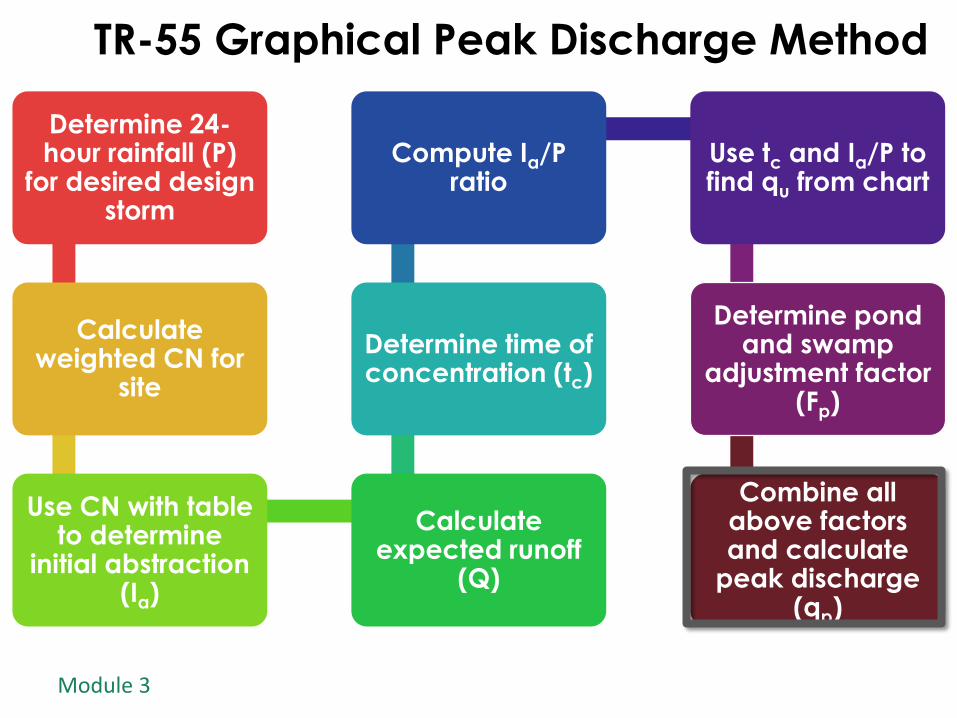
Module 3
• qp (cfs)
• qu (csm/in) from previous step
• Q (in) from previous step
• Am (m2) from site plan
• Fp from previous step
qp = quAmQFp
Calculate peak discharge peak discharge
(qp)
Module 3
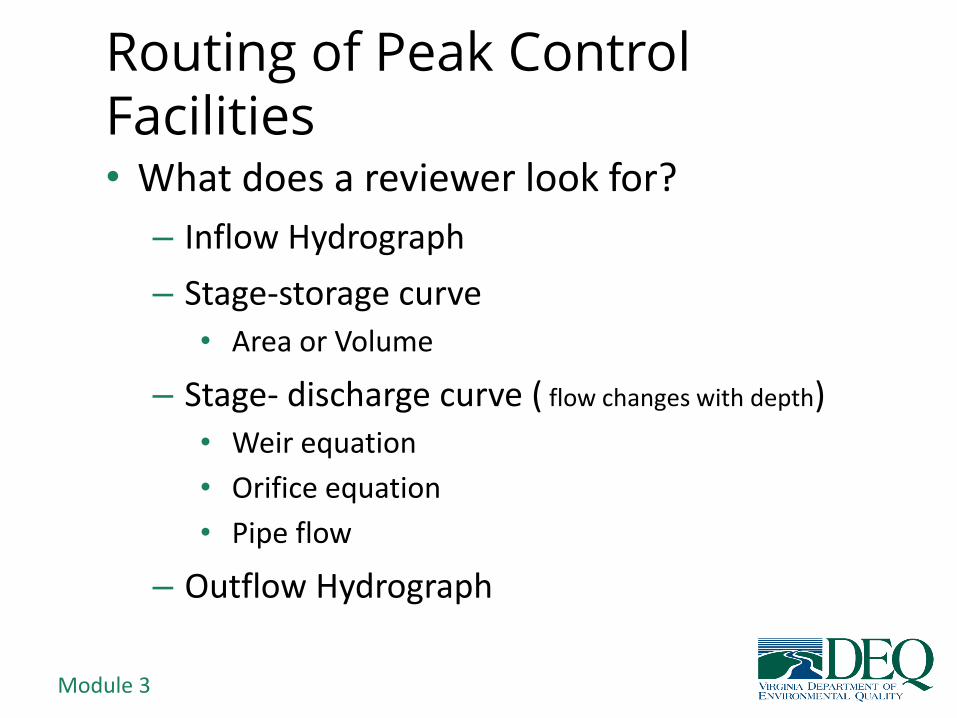
Routing of Peak Control Facilities • What does a reviewer look for?
– Inflow Hydrograph
– Stage-storage curve
• Area or Volume
– Stage- discharge curve ( flow changes with depth)
• Weir equation
• Orifice equation
• Pipe flow
– Outflow Hydrograph

Module 3
Stage- Storage

Module 3
Storage Volume for Detention Basins TR-55 (Demonstration Purposes)
• Simplified procedure for estimating
required storage volume (Vs)
• Suitable for estimating required
storage for preliminary design
• Not suitable for final design
PG 34

Module 3
Storage Volume for Detention Basins
Information needed to estimate storage volume (Vs) :
PG 35
Storage Volume
(Vs)
Peak outflow discharge
(qo)
Peak inflow discharge (qi)
Runoff volume (Vr)

Module 3
Storage Volume for Detention Basins
• Design procedure to estimate Vs
storage volume required
1. Determine qo
2. Estimate qi (chapters 4 or 5 of
TR-55)
PG 35
Module 3
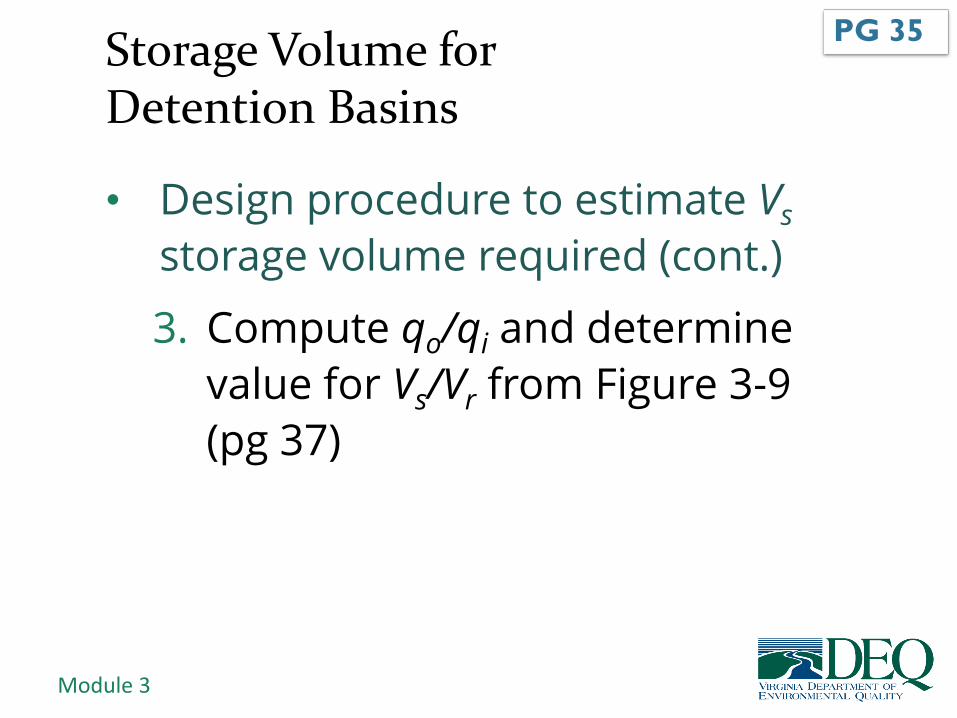
Storage Volume for Detention Basins
• Design procedure to estimate Vs
storage volume required (cont.)
3. Compute qo/qi and determine
value for Vs/Vr from Figure 3-9
(pg 37)
PG 35

Module 3
Figure 3-9 Approximate Detention Basin Routing
PG 38

Module 3
Storage Volume for Detention Basins
• Design procedure to estimate Vs
storage volume required (cont.)
4. Q (in inches) was determined
when computing qi in step 2
– Now convert to units in which Vs is
to be expressed
PG 36

Module 3
Storage Volume for Detention Basins
• Design procedure to estimate Vs
storage volume required (cont.)
5. Use results of steps 3 and 4 to
compute Vs
r
srs
V
VVV
PG 36
Vr = runoff volume (acre-ft)
Vs = storage volume required
(acre-ft)
(Vs/Vr) from Figure 3-9

Module 3
Worksheet 6a from TR-55 is
useful for
documenting
inputs and
results

Module 3
Example: Estimate Storage Volume
Given:
• 3-acre site in Richmond, Virginia (Type II)
• Developed discharge rate into the basin
= 10 cfs = qi
• Allowable discharge rate = 2 cfs = qo
• Developed runoff volume = 1.33 inches
PG 39
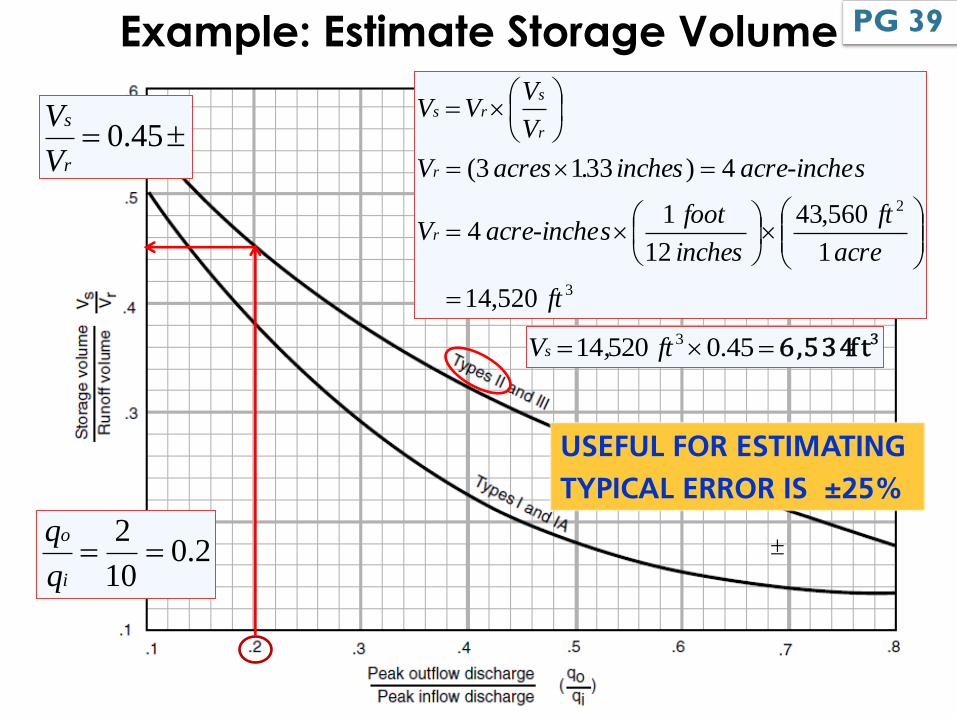
Module 3
Example: Estimate Storage Volume
45.0r
s
V
V
2.010
2
i
o
q
q
3
2
520,14
1
560,43
12
1 4
4) 331 3(
ft
acre
ft
inches
footsacre-incheV
sacre-incheinches.acresV
V
VVV
r
r
r
srs
3ft 6,534 45.0 52014 3ft,Vs
USEFUL FOR ESTIMATING
TYPICAL ERROR IS ±25%
PG 39

Module 3
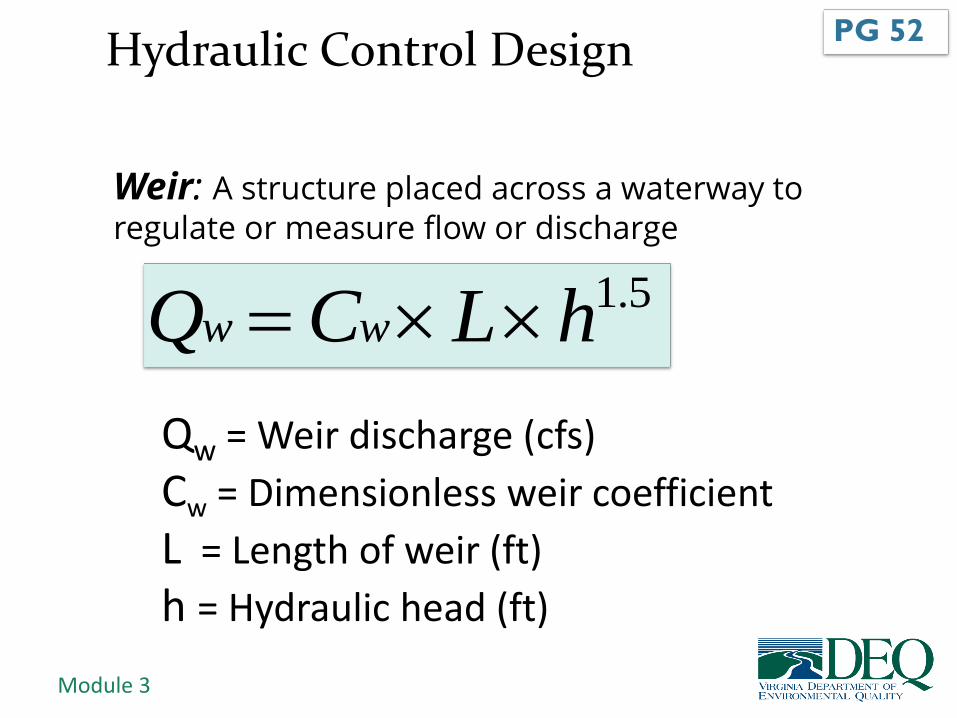
Design of hydraulic control structures
•Stormwater management facilities
•BMPs
Discharge rating cures
•Describe outflow discharge associated with elevation of upstream water
PG 52

Module 3
Three flow equations need to be evaluated Weir Orifice Pipe The equation that yields the smallest value controls
Module 3
0.0
500.0
1000.0
1500.0
2000.0
2500.0
3000.0
3500.0
4000.0
0.00 1.00 2.00 3.00 4.00 5.00
0.00
20.00
40.00
60.00
80.00
100.00
120.00
140.00
160.00
180.00
0.00 1.00 2.00 3.00 4.00 5.00
Module 3
5.1hLCQ ww
Weir: A structure placed across a waterway to regulate or measure flow or discharge
Qw = Weir discharge (cfs)
Cw = Dimensionless weir coefficient
L = Length of weir (ft)
h = Hydraulic head (ft)
Hydraulic Control Design PG 52

Module 3
Hydraulic Control Design
×g ×hQ=C ×a × 2
An orifice is another type of structure used to control or measure discharge
Q = orifice discharge (cfs)
C = dimensionless orifice coefficient*
A = orifice area (ft2)
G = gravitational acceleration (32.2 ft/sec2)
h = hydraulic head (ft)
PG 54
Module 3
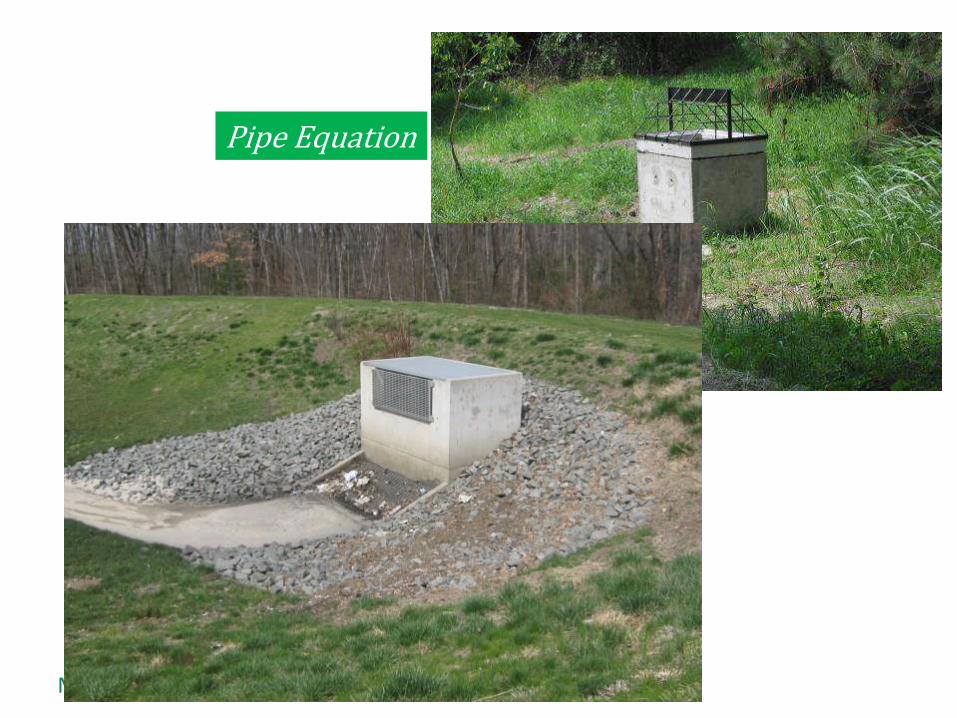
Pipe Equation

Module 3
0
200
400
600
800
1000
1200
1400
0:00 4:48 9:36 14:24
Dis
ch
arg
e (
cfs
)
Time
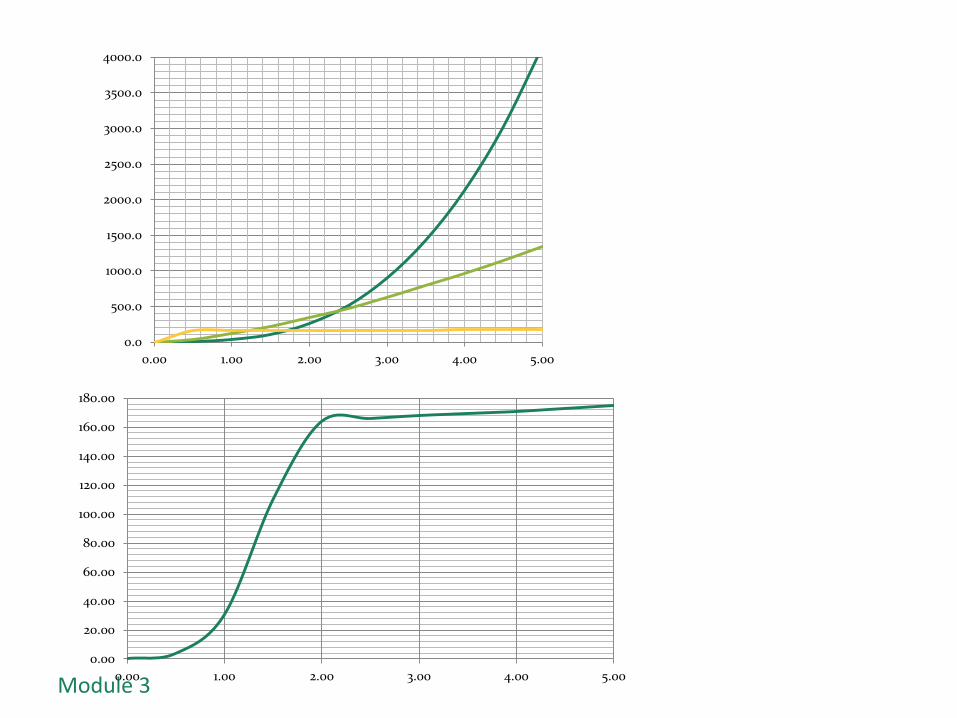
Results of Routing

Module 3
Runoff Reduction Method
Estimates annual pollutant load exported in
stormwater runoff from small urban catchments
122.72ACRvPPL j
Module 3
122.72ACRvPPL j
Runoff Reduction Method
L (lbs/yr) = total post-dev. pollutant load
P (in) = average annual rainfall depth
= 43 in. (VA)
Pj = fraction of rainfall producing runoff
= 0.9

Module 3
122.72ACRvPPL j
Runoff Reduction Method
Rv = volumetric runoff coefficient
C (mg/L) = flow-weighted event mean
concentration (EMC) of TP = 0.26
A (acres) = area of development site
Module 3
Runoff Reduction Method
1272.2 ACRvPPL compositej
)%()%()%( FRvTRvIRvRv FTIcomposite
compositeRv Weighted runoff coefficient
RvI = Runoff coefficient for Impervious cover (0.95)
RvT = Managed Turf/Disturbed soils
RvF = Forest/Open Space
Module 3
12
)( ARvPTv
composite
BMP
Treatment Volume & BMP Sizing
TvBMP = Treatment Volume from contributing drainage area to BMP + remaining runoff from upstream practices
P = 90th Percentile rainfall depth = 1”
Rvcomposite = Weighted runoff coefficient
A = Contributing drainage area to BMP
Module 3
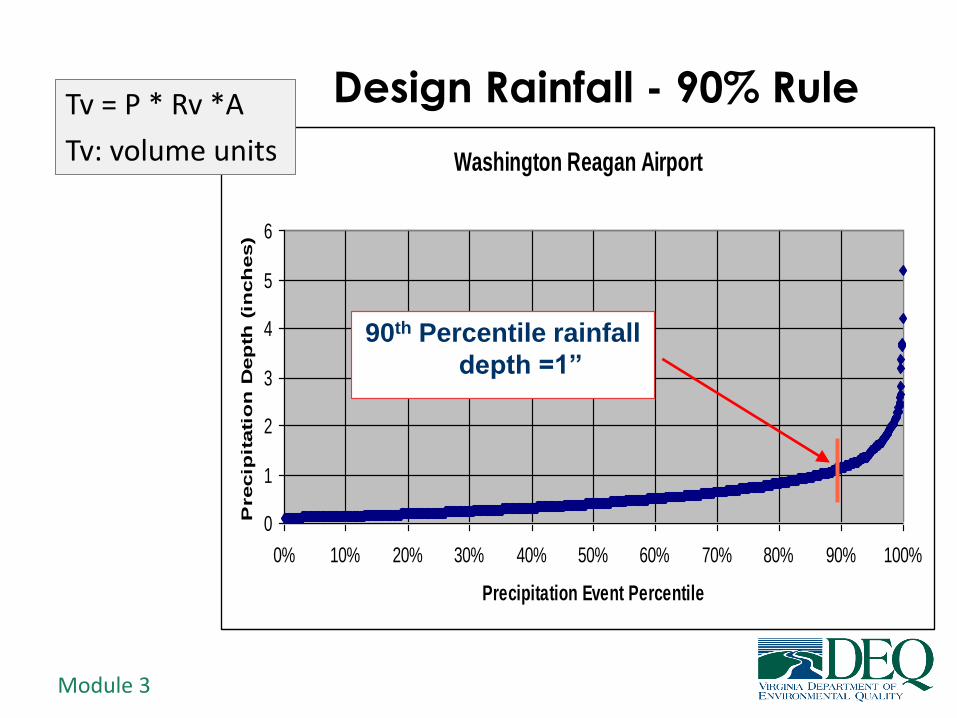
Design Rainfall - 90% Rule
Washington Reagan Airport
0
1
2
3
4
5
6
0% 10% 20% 30% 40% 50% 60% 70% 80% 90% 100%
Precipitation Event Percentile
Precip
itati
on
Dep
th (
inch
es)
90th Percentile rainfall
depth =1”
Tv = P * Rv *A
Tv: volume units

Module 3
Water Quality Treatment Volume Peak Flow Rate
qpTv = Treatment Volume peak discharge (cfs) qu = unit peak discharge (cfs/mi2/in
A = drainage area (mi2)
Qa = runoff volume (watershed inches), equal to Tv/A
*Volumetric conversion to an intensity - 1” in 24 hr.
assumes NRCS type II rainfall distribution
aupTv QAqq

Module 3
Initial Abstraction qp = quAmQFp

Module 3
Water Quality Treatment Volume Peak Flow Rate
CN = Curve Number
P = Rainfall (inches), 1.0” in Virginia
Qa = Runoff volume (watershed inches),
equal to Tv/drainage area
5.0)25.1(1010510
10002 PQQQP
CNaaa

Module 3
Find qu on chart (type II)
• Use Ia/P ratio
and tc value
to find qu
• For CN of 98
Ia/P=.041
qp = quAQ

Module 3
Questions?