Embed Size (px)
Citation preview
Module 7.4 Page 702 of 1124.
Module 7.4: Advanced Venn Diagram Problems
Now we’ll consider some harder Venn Diagram problems. First, we’re going to learn aboutan alternative format for displaying this kind of information: a table rather than a VennDiagram. These are impractical for 3-variable problems, but for 2-variable problems, they dogive you some good information. Second, we will look at 3-variable Venn Diagram problemsthat require a variable. Third, we will explore “the inclusion-exclusion formula,” which willhave much value in our work later in this chapter. Fourth, we will learn a great deal aboutblood types—information that hopefully you won’t have to act on in an emergency, butcertainly one of the most important applications of set theory.
Suppose that a car manufacturer is trying to predict demand for the next sales cycle, basedon the previous year’s data. The company database is searched, and it turns out that theluxury sound system was ordered in 2541 models, and the normal sound system was orderedin 7983. The sunroof was ordered in 3048 models, and of those, 2115 ordered the luxurysound system also. Find out how many orders there were for all possible combinations ofluxury/normal stereo and with/without sunroof.
We start by filling in the given data
SunroofSound System With Without TotalLuxury Sound 2115 ?? 2541Normal Sound ?? ?? 7983Total 3048 ?? ??
and then we can see the following:
1. The total cars ordered is 2541 + 7983 = 10, 524.
2. Those with the luxury sound system but no sunroof number 2541� 2115 = 426.
3. Those with normal sound and a sunroof come to 3048� 2115 = 933.
4. Those without a sunroof and with a normal sound system come to 7983�933 = 7050.
5. In general, those without a sunroof are 10, 524� 3048 = 7476.
The final table is given in the next box.
Here is the final table for the previous example.
SunroofSound System With Without TotalLuxury Sound 2115 426 2541Normal Sound 933 7050 7983Total 3048 7476 10,524
COPYRIGHT NOTICE: This is a work in-progress by Prof. Gregory V. Bard, which is intended to be eventually released under the Creative
Commons License (specifically agreement # 3 “attribution and non-commercial.”) Until such time as the document is completed, however, the
author reserves all rights, to ensure that imperfect copies are not widely circulated.
Module 7.4 Page 703 of 1124.
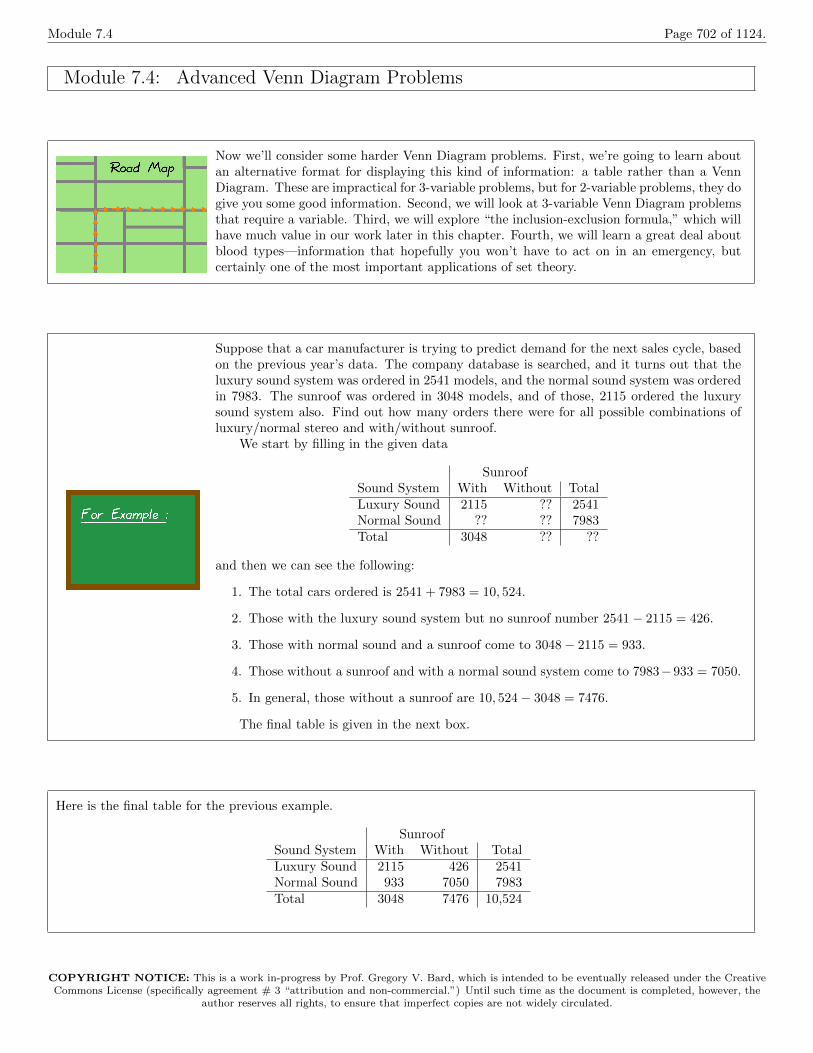
Take a moment to convince yourself that the previous example would have the followingVenn Diagram. The left circle represents cars with luxury sound systems, and the rightcircle represents cars with sunroofs.
426 9332115
7050
=10,524
We’ve been having fun with Venn Diagrams up to now, and so you might wonder why onewould want to use tables for this sort of problem. It turns out that if it is possible to do aVenn Diagram problem, then it is possible to do the equivalent problem with a table, andvice versa.
For two-variable problems, it is simply a matter of taste. Some students have a strongpreference for the Venn Diagram, some students have a strong preference for a table, andmost students do not have a strong preference. However, with a three-variable problem, thetable becomes somewhat large and di�cult to work with.
Last but not least, it is only fair to mention that the tables convey more information ata glance, as you will discover shortly. Therefore, it is good to explore this other approach,at least briefly.
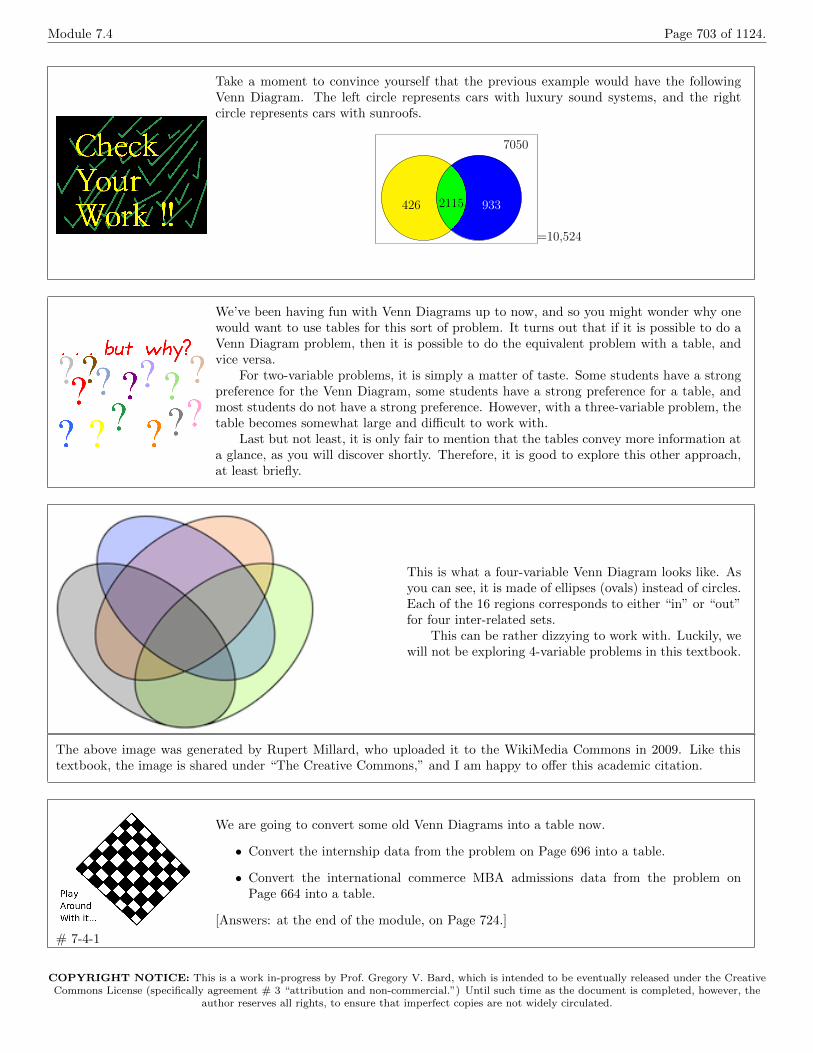
This is what a four-variable Venn Diagram looks like. Asyou can see, it is made of ellipses (ovals) instead of circles.Each of the 16 regions corresponds to either “in” or “out”for four inter-related sets.
This can be rather dizzying to work with. Luckily, wewill not be exploring 4-variable problems in this textbook.
The above image was generated by Rupert Millard, who uploaded it to the WikiMedia Commons in 2009. Like thistextbook, the image is shared under “The Creative Commons,” and I am happy to o↵er this academic citation.
# 7-4-1
We are going to convert some old Venn Diagrams into a table now.
• Convert the internship data from the problem on Page 696 into a table.
• Convert the international commerce MBA admissions data from the problem onPage 664 into a table.
[Answers: at the end of the module, on Page 724.]
COPYRIGHT NOTICE: This is a work in-progress by Prof. Gregory V. Bard, which is intended to be eventually released under the Creative
Commons License (specifically agreement # 3 “attribution and non-commercial.”) Until such time as the document is completed, however, the
author reserves all rights, to ensure that imperfect copies are not widely circulated.
Module 7.4 Page 704 of 1124.
Suppose for another car, perhaps in Europe where automatic transmissions are a luxuryitem (people there prefer to “drive stick,” i.e. use a manual transmission), another surveyis being done. The engine of this model comes in 4-cylinders and 6-cylinders, and thetransmission is either manual or automatic. The basic model, which sold 45,681 times has4-cylinders and a manual transmission. The four-cylinder models of all kinds sold 58,291models, and the manual transmission was found in 71,488 cars. The car sold 89,563 modelsfor the year among all options.
Let’s put the given data in a table.
EngineTransmission 4-Cylinder 6-Cylinder TotalAutomatic ?? ?? ??Manual 45,681 ?? 71,488Total 58,291 ?? 89,563
At first, it might not look like we have enough data to find everything, but let’s try andsee what happens. We will continue in the next box.
Continuing with the previous box,
1. The number of 6-cylinder sales in total would be 89, 563� 58, 291 = 31, 272.
2. The number of 6-cylinder manuals would be 71, 488� 45, 681 = 25, 807.
3. The number of automatic 4-cylinders is therefore 58, 291� 45, 681 = 12, 610.
4. The number of automatic 6-cylinders is therefore 31, 272� 25, 807 = 5465.
5. Finally, the total number of automatics is 12, 610 + 5465 = 18, 075.
6. The final table is:Engine
Transmission 4-Cylinder 6-Cylinder TotalAutomatic 12,610 5465 18,075Manual 45,681 25,807 71,488Total 58,291 31,272 89,563
# 7-4-2
Suppose that you’re commissioned to do research for an ice-cream company. There is asurvey of 100 customers. Of these, 50 like vanilla, 60 like chocolate, and 40 like both. Makea table as was done in the previous box.
The solution is given at the end of the module on Page 724.
COPYRIGHT NOTICE: This is a work in-progress by Prof. Gregory V. Bard, which is intended to be eventually released under the Creative
Commons License (specifically agreement # 3 “attribution and non-commercial.”) Until such time as the document is completed, however, the
author reserves all rights, to ensure that imperfect copies are not widely circulated.
Module 7.4 Page 705 of 1124.
# 7-4-3
Continuing with the previous box, it seems there was an error in the collected data. Actually,only 10 people like both flavors of ice-cream. Make another table.
The solution is given at the end of the module on Page 724.
Suppose we are classifying mushrooms from Nine-hundred and Ninety Five Popular My-cophile’s Mushrooms while entering them into a database. We will use a three-variableVenn Diagram. Let the top circle indicate those mushrooms that are lethal. Let the left cir-cle indicate those mushrooms that are tasty. Let the right circle indicate those mushroomsthat are spotted. There are six species in the book which are spotted, lethal, and tasty.The total number of tasty mushrooms is 345. The total number of spotted mushrooms is263, and the total number of lethal mushrooms is 611. There are 29 mushrooms which areneither spotted, nor lethal, nor tasty. If 114 are spotted and lethal, and 91 are lethal andtasty but not spotted, how many are tasty and spotted but not lethal?
This one is tricky, so we’ll go with a step-by-step analysis, given in the next box.
These are the steps for solving the problem in the previous box.
1. We know 6 mushrooms belong in the triangular bit in the center, so we write them in immediately.
2. Likewise, the 29 that are in the “no category” go into the background.
3. Then also the 91 that are lethal and tasty but not spotted should go in the upper-left-hand mitre-shapped bit.
4. There are 114 that are both spotted and lethal. Since 6 are in all three categories, that means that 114� 6 = 108are spotted and lethal but not tasty. Of course, they belong in the upper-right-hand mitre-shaped bit.
5. Now the total number of lethal mushrooms is given as 611. If we subtract the three filled-in parts of the topcircle, we learn that
611� 108� 6� 91 = 406
are lethal but neither tasty nor spotted.
6. Of course, the universe is the set of 995 mushrooms; we know that from the title of the book.
7. Now, we appear to be stuck. Take a moment to verify that we cannot go further.
COPYRIGHT NOTICE: This is a work in-progress by Prof. Gregory V. Bard, which is intended to be eventually released under the Creative
Commons License (specifically agreement # 3 “attribution and non-commercial.”) Until such time as the document is completed, however, the
author reserves all rights, to ensure that imperfect copies are not widely circulated.
Module 7.4 Page 706 of 1124.
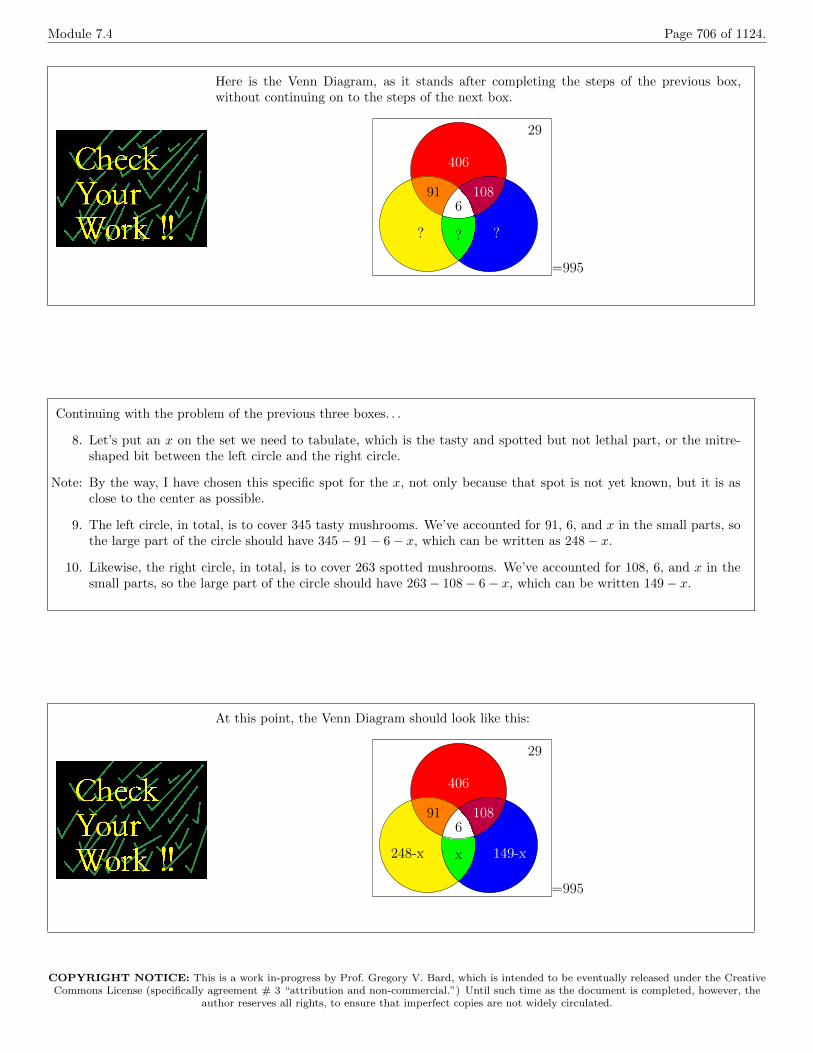
Here is the Venn Diagram, as it stands after completing the steps of the previous box,without continuing on to the steps of the next box.
406
? ?
610891
?
29
=995
Continuing with the problem of the previous three boxes. . .
8. Let’s put an x on the set we need to tabulate, which is the tasty and spotted but not lethal part, or the mitre-shaped bit between the left circle and the right circle.
Note: By the way, I have chosen this specific spot for the x, not only because that spot is not yet known, but it is asclose to the center as possible.
9. The left circle, in total, is to cover 345 tasty mushrooms. We’ve accounted for 91, 6, and x in the small parts, sothe large part of the circle should have 345� 91� 6� x, which can be written as 248� x.
10. Likewise, the right circle, in total, is to cover 263 spotted mushrooms. We’ve accounted for 108, 6, and x in thesmall parts, so the large part of the circle should have 263� 108� 6� x, which can be written 149� x.
At this point, the Venn Diagram should look like this:
406
248-x 149-x
610891
x
29
=995
COPYRIGHT NOTICE: This is a work in-progress by Prof. Gregory V. Bard, which is intended to be eventually released under the Creative
Commons License (specifically agreement # 3 “attribution and non-commercial.”) Until such time as the document is completed, however, the
author reserves all rights, to ensure that imperfect copies are not widely circulated.
Module 7.4 Page 707 of 1124.
Continuing with the problem of the previous five boxes. . .
11. Now, let’s add everything up, and set it equal to 995.
(248� x) + x+ 6 + 91 + 108 + (149� x) + 406 + 29 = 995
(248 + 6 + 91 + 108 + 149 + 406 + 29)� x� x+ x = 995
1037� x = 995
x = 42
12. Therefore, the answer is 42. There are 42 mushrooms that are spotted and tasty, but not lethal.
13. Since we’ve gotten this far, we should complete the diagram. The 149� x becomes 107 because 149� 42 = 107.
14. Likewise the 248� x becomes 206 because 248� 42 = 206.
The final Venn Diagram is given in the next box.
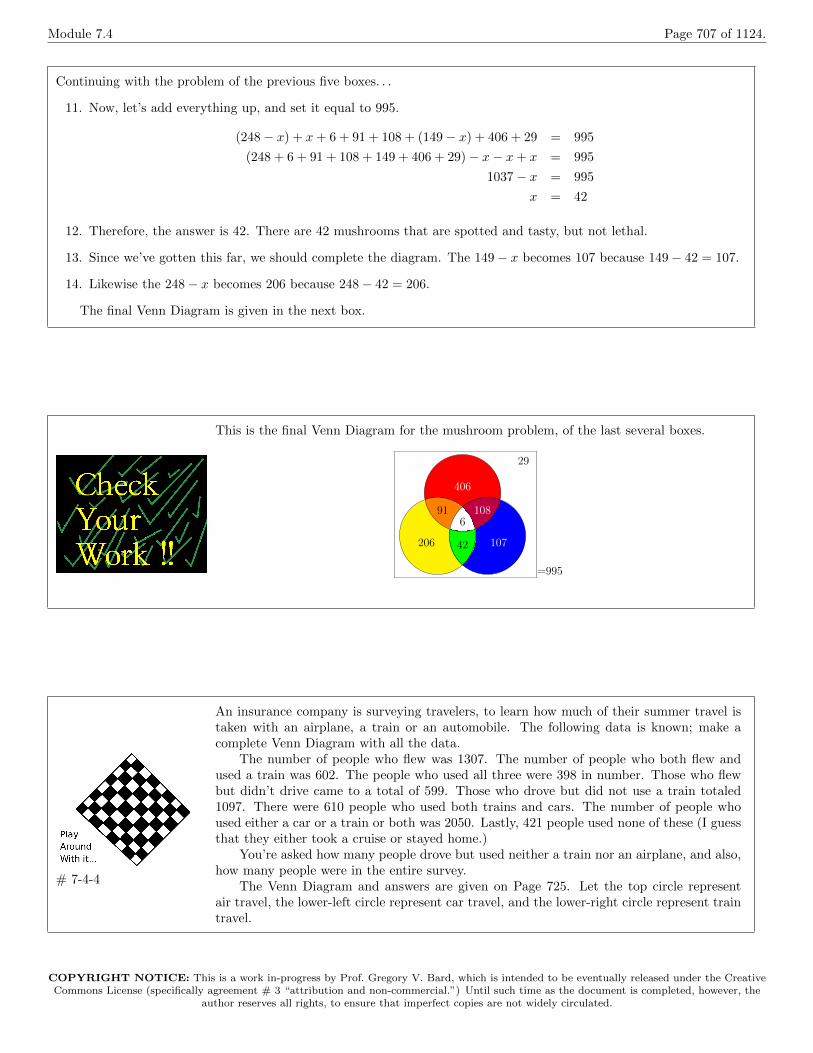
This is the final Venn Diagram for the mushroom problem, of the last several boxes.
406
206 107
610891
42
29
=995
# 7-4-4
An insurance company is surveying travelers, to learn how much of their summer travel istaken with an airplane, a train or an automobile. The following data is known; make acomplete Venn Diagram with all the data.
The number of people who flew was 1307. The number of people who both flew andused a train was 602. The people who used all three were 398 in number. Those who flewbut didn’t drive came to a total of 599. Those who drove but did not use a train totaled1097. There were 610 people who used both trains and cars. The number of people whoused either a car or a train or both was 2050. Lastly, 421 people used none of these (I guessthat they either took a cruise or stayed home.)
You’re asked how many people drove but used neither a train nor an airplane, and also,how many people were in the entire survey.
The Venn Diagram and answers are given on Page 725. Let the top circle representair travel, the lower-left circle represent car travel, and the lower-right circle represent traintravel.
COPYRIGHT NOTICE: This is a work in-progress by Prof. Gregory V. Bard, which is intended to be eventually released under the Creative
Commons License (specifically agreement # 3 “attribution and non-commercial.”) Until such time as the document is completed, however, the
author reserves all rights, to ensure that imperfect copies are not widely circulated.
Module 7.4 Page 708 of 1124.
Using the techniques we just learned, namely putting an x in one of the regions of the VennDiagram, you can solve the next problem. However, there is a short cut formula which is ahuge time saver. It is very easy to understand as well.
# (A [ B) = #A+#B �#(A \ B)
In a way, this formula allows you to change between \ and [ very freely. This formulais called “the inclusion-exclusion formula for sets” in this textbook. A less common name isto call it “the union-intersection formula.” In words, we would say “The size of the unionof the two sets is equal to the size of one, plus the size of the other, minus the size of theintersection.”
This formula has a twin, called “the inclusion-exclusion formula for probability,” givenon Page 765. Together, these formulas are extremely useful.
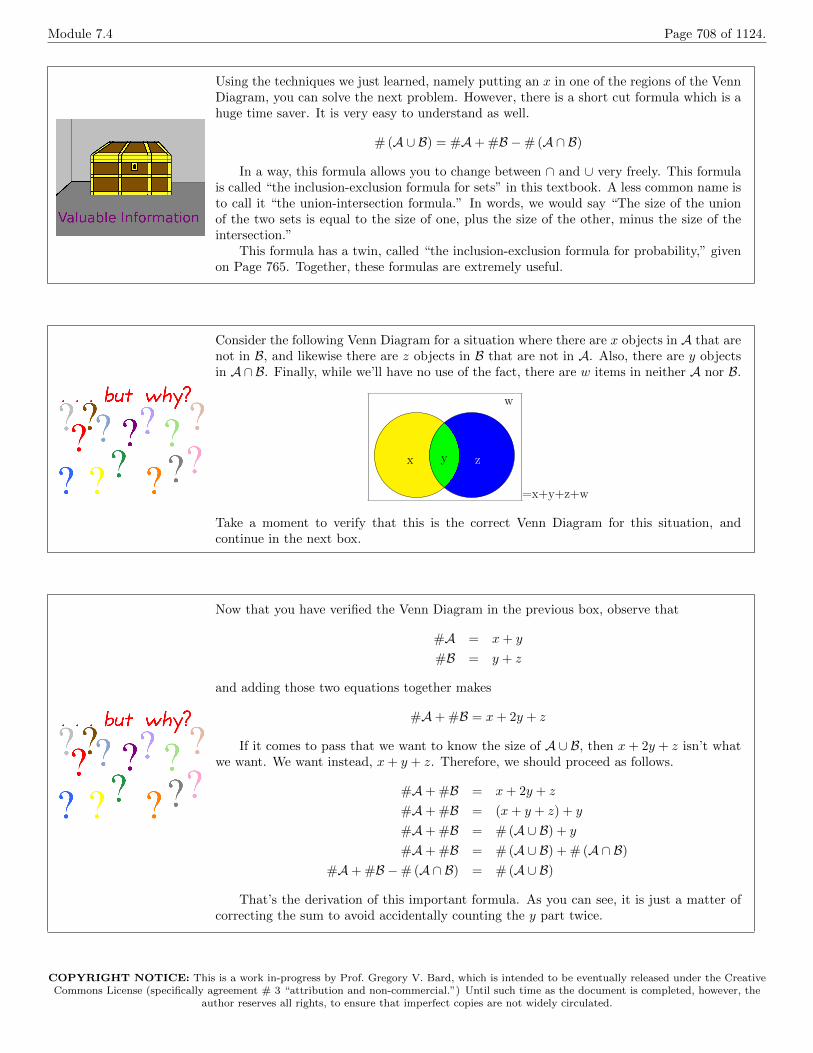
Consider the following Venn Diagram for a situation where there are x objects in A that arenot in B, and likewise there are z objects in B that are not in A. Also, there are y objectsin A\ B. Finally, while we’ll have no use of the fact, there are w items in neither A nor B.
x zy
w
=x+y+z+w
Take a moment to verify that this is the correct Venn Diagram for this situation, andcontinue in the next box.
Now that you have verified the Venn Diagram in the previous box, observe that
#A = x+ y
#B = y + z
and adding those two equations together makes
#A+#B = x+ 2y + z
If it comes to pass that we want to know the size of A [ B, then x+ 2y + z isn’t whatwe want. We want instead, x+ y + z. Therefore, we should proceed as follows.
#A+#B = x+ 2y + z
#A+#B = (x+ y + z) + y
#A+#B = #(A [ B) + y
#A+#B = #(A [ B) + # (A \ B)#A+#B �#(A \ B) = # (A [ B)
That’s the derivation of this important formula. As you can see, it is just a matter ofcorrecting the sum to avoid accidentally counting the y part twice.
COPYRIGHT NOTICE: This is a work in-progress by Prof. Gregory V. Bard, which is intended to be eventually released under the Creative
Commons License (specifically agreement # 3 “attribution and non-commercial.”) Until such time as the document is completed, however, the
author reserves all rights, to ensure that imperfect copies are not widely circulated.
Module 7.4 Page 709 of 1124.
We saw this question in the previous module, on Page 698. We will be able to solve it muchmore quickly now that we have the inclusion-exclusion formula.
Perhaps you are interning with a sta�ng firm that specializes in hiring programmers.A software company is looking to expand, and your firm is hired to help them find thenecessary talent. The programmers must know the computer languages C++ and Python.Your firm receives 87 applications. Luckily, 75 applications include knowledge of at leastone of the languages. As it comes to pass, 48 applicants know Python, which is a goodstart, but 31 applicants do not know C++. How many people know both languages?
# (A [ B) = #A+#B �#(A \ B)# (P [ C) = #P +#C �#(P \ C)(87� 12) = 48 + #C �#(P \ C)
75 = 48 + (87� 31)�#(P \ C)75� 48� 87 + 31 = �#(P \ C)
�29 = �#(P \ C)29 = #(P \ C)
Therefore, we can conclude that 29 people know both languages. By the way, in caseyou are curious about the “(87 � 31)” that appears as C, note that there are 87 people inthe survey, and 31 do not know C++. Therefore, 87� 31 = 56 must know C++.
# 7-4-5
In a survey of freshmen students, it is found that 857 need remedial math courses, and 196need remedial English courses. There are 77 students who need both. If there are 2858students in the freshman class,. . .
• How many students need either remedial English or math?[Answer: 857 + 196� 77 = 976.]
• How many students need neither remedial English nor math? [Answer: 2858� 976 =1882.]
# 7-4-6
Likewise, we saw this question in the previous module, on Page 695. As before, we will beable to solve it much more quickly now that we have the inclusion-exclusion formula.
A restaurant is contemplating a liquor license and the owner’s cousin is asked to surveypeople as they are waiting to be seated. He asks if they like beer or wine. The cousin doeswrite down that 104 customers like beer and 67 customers like wine. However, he did notwrite down how many people like both. He surveyed 135 people. All is not lost, however, ashe remembers that only two couples (4 people) said that they neither liked wine nor beer.
• How many people like either wine or beer? [Answer: 131.]
• Tell me how many people like both wine and beer? [Answer: 40.]
COPYRIGHT NOTICE: This is a work in-progress by Prof. Gregory V. Bard, which is intended to be eventually released under the Creative
Commons License (specifically agreement # 3 “attribution and non-commercial.”) Until such time as the document is completed, however, the
author reserves all rights, to ensure that imperfect copies are not widely circulated.
Module 7.4 Page 710 of 1124.
# 7-4-7
We saw this question earlier also, on Page 695. Once again, we will be able to solve it muchmore quickly now that we have the inclusion-exclusion formula.
Let us consider that a sports arena is surveying frequent visitors to see what type ofconcession stand to o↵er. They survey 408 people and it turns out that 198 would like friedchicken, and 205 would like health food. However, 106 want both options.
• How many people would be happy with either option? [Answer: 297.]
• How many people would be happy with neither option? [Answer: 111.]
The next problem appeared in Finite Mathematics & Its Applications by Larry J. Goldstein, David I. Schneider andMartha J. Siegel. It was in Chapter 5, Section 3, Example 2, of the Seventh Edition.
The presidents of the top 500 corporations in the USA were surveyed by the magazineExecutive in the year 2000. There were 500 of them (of course) and 310 had businessdegrees—238 had undergraduate degrees, and 184 had graduate degrees. How many hadexactly one degree in business? How many had both degrees in business? How many hadneither? Did more presidents have or not have a Bachelor’s Degree in business?
Let’s denote the presidents with Bachelor’s degrees by B and those with Master’s de-gree’s by M. First, we can use the inclusion-exclusion formula:
#(B [M) = #B +#M�#(B \M)
which becomes310 = 238 + 184�#(B \M)
and therefore#(B \M) = 238 + 184� 310 = 112
We will continue in the next box.
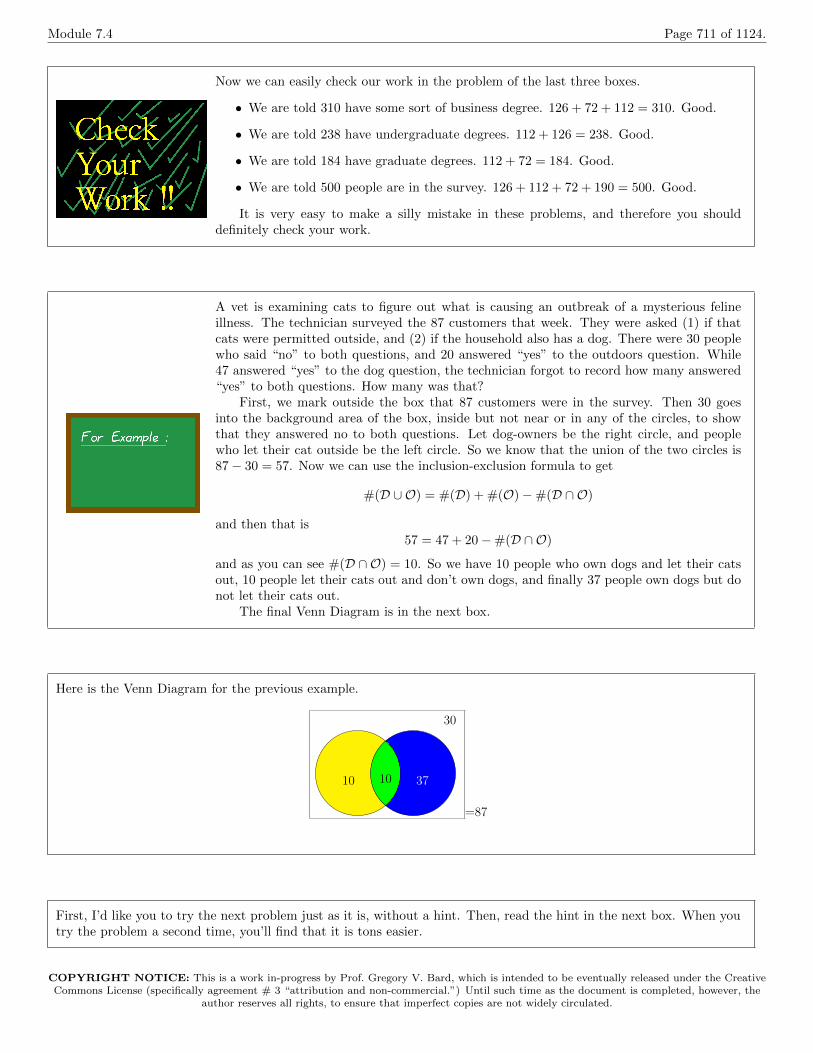
Continuing with the previous box, it is even easier is to find those corporate presidents with zero degrees in business.Since 310 have some sort of business degree out of 500, then surely 500-310=190 have no business degree at all. Next,we can fill in a Venn diagram. With 238 having undergraduate degrees, the left cookie-shaped part should have238� 112 = 126, while the right cookie-shaped part should have 184� 112 = 72.
Then we have
126 72112
190
=500
We can therefore say that 190 of them had zero degrees in business, and 112 had two degrees in business. Thusthe number with one degree in business is 500 � 112 � 190 = 198. Finally, while 238 have the Bachelor’s in business,that means that 500 � 238 = 262 do not have one. Thus the majority of Fortune-500 corporate presidents have theirBachelor’s degree in something other than business.
COPYRIGHT NOTICE: This is a work in-progress by Prof. Gregory V. Bard, which is intended to be eventually released under the Creative
Commons License (specifically agreement # 3 “attribution and non-commercial.”) Until such time as the document is completed, however, the
author reserves all rights, to ensure that imperfect copies are not widely circulated.
Module 7.4 Page 711 of 1124.
Now we can easily check our work in the problem of the last three boxes.
• We are told 310 have some sort of business degree. 126 + 72 + 112 = 310. Good.
• We are told 238 have undergraduate degrees. 112 + 126 = 238. Good.
• We are told 184 have graduate degrees. 112 + 72 = 184. Good.
• We are told 500 people are in the survey. 126 + 112 + 72 + 190 = 500. Good.
It is very easy to make a silly mistake in these problems, and therefore you shoulddefinitely check your work.
A vet is examining cats to figure out what is causing an outbreak of a mysterious felineillness. The technician surveyed the 87 customers that week. They were asked (1) if thatcats were permitted outside, and (2) if the household also has a dog. There were 30 peoplewho said “no” to both questions, and 20 answered “yes” to the outdoors question. While47 answered “yes” to the dog question, the technician forgot to record how many answered“yes” to both questions. How many was that?
First, we mark outside the box that 87 customers were in the survey. Then 30 goesinto the background area of the box, inside but not near or in any of the circles, to showthat they answered no to both questions. Let dog-owners be the right circle, and peoplewho let their cat outside be the left circle. So we know that the union of the two circles is87� 30 = 57. Now we can use the inclusion-exclusion formula to get
#(D [O) = #(D) + #(O)�#(D \O)
and then that is57 = 47 + 20�#(D \O)
and as you can see #(D \O) = 10. So we have 10 people who own dogs and let their catsout, 10 people let their cats out and don’t own dogs, and finally 37 people own dogs but donot let their cats out.
The final Venn Diagram is in the next box.
Here is the Venn Diagram for the previous example.
10 3710
30
=87
First, I’d like you to try the next problem just as it is, without a hint. Then, read the hint in the next box. When youtry the problem a second time, you’ll find that it is tons easier.
COPYRIGHT NOTICE: This is a work in-progress by Prof. Gregory V. Bard, which is intended to be eventually released under the Creative
Commons License (specifically agreement # 3 “attribution and non-commercial.”) Until such time as the document is completed, however, the
author reserves all rights, to ensure that imperfect copies are not widely circulated.
Module 7.4 Page 712 of 1124.
# 7-4-8
An election is being held to determine the chairperson of the board of directors of a newlyfounded charity. The candidates are Alice, Bob, and Charlene. Of the 70 members of theboard, 8 would be satisfied with any of the three candidates, and 1 would not be satisfiedwith any of the candidates. There are 26 who would be satisfied with Alice, 39 who wouldbe satisfied with Bob, and 47 who would be satisfied with Charlene. Moreover, when asked“Would you be satisfied with either Alice or Charlene?” the response was 56 votes; only 14said neither would be satisfactory. Similarly, when asked “Would you be satisfied with eitherBob or Charlene?” the response was 66 votes; only 4 said neither would be satisfactory.Finally, when asked “Would you be satisfied with either Alice or Bob?” the response was51 votes; only 19 said neither would be satisfactory.
Draw a Venn Diagram to describe this situation. Let those who would be satisfiedwith Charlene be in the top circle. Let those who would be satisfied with Bob be in thelower-left circle, and those who would be satisfied with Alice be in the lower-right circle.Furthermore, tell me how many members of the board can be satisfied with more than oneof the candidates.
The solution can be found on Page 725.
Here’s the hint for the previous problem. We are told “Would you be satisfied with Aliceor Bob?” had 51 votes, and we know how many people would be satisfied with Alice, andhow many would be satisfied with Bob. Use the 2-variable inclusion-exclusion formula toconvert this into knowing how many people would simultaneously be satisfied by Alice ANDbe satisfied by Bob. Similarly, use inclusion-exclusion formula to find the “ANDs” for Boband Charlene. Finally, use that formula to find how many people would simultaneously besatisfied by Alice AND be satisfied by Charlene.
Armed with these intersections, the problem completely becomes trivial after that.
Let us imagine that you and Jed are interning in the o�ces of an elite hedge fund. Ratherthan hire 2–3 in-house economists to decide where to invest, this fund has decided to do amassive survey of 150 academic economists, and ask them which of three industries (biomed-ical, software, or telecommunications) is going to be a profitable focus for the fund in thecoming year. Jed and yourself were tasked with surveying the economists, who have beenflown to a big event in Manhattan hosted by the fund. After you both carefully collect theresults, Jed accidentally spills co↵ee on the data. Luckily, only one datum is obfuscated,marked “(stain)” below. Your task is to summarize the data with a Venn Diagram. Willyou be able to do this, despite the loss of one data point?
The data is in the next box.
COPYRIGHT NOTICE: This is a work in-progress by Prof. Gregory V. Bard, which is intended to be eventually released under the Creative
Commons License (specifically agreement # 3 “attribution and non-commercial.”) Until such time as the document is completed, however, the
author reserves all rights, to ensure that imperfect copies are not widely circulated.
Module 7.4 Page 713 of 1124.
Here is the data for our present example, which we started in the previous box.
• 7 economists gave a positive outlook to none of those three industries.
• 113 economists gave a positive outlook to the software industry.
• 99 economists gave a positive outlook to the biomedical industry.
• 98 economists gave a positive outlook to the telecommunications industry.
• 79 economists gave a positive outlook to both software & biomedical.
• 84 economists gave a positive outlook to both software & telecommunications.
• 82 economists gave a positive outlook to both telecommunications & biomedical.
• (stain) gave a positive outlook to all three industries.
We will proceed to solve the problem in the next few boxes.
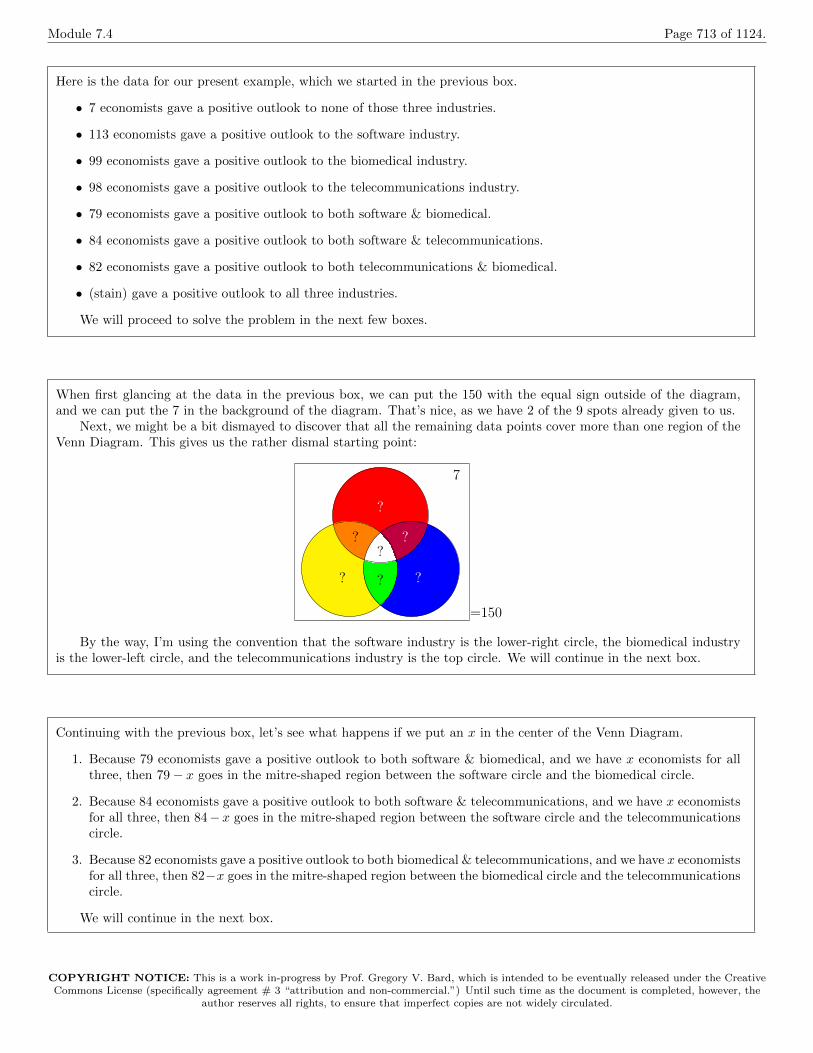
When first glancing at the data in the previous box, we can put the 150 with the equal sign outside of the diagram,and we can put the 7 in the background of the diagram. That’s nice, as we have 2 of the 9 spots already given to us.
Next, we might be a bit dismayed to discover that all the remaining data points cover more than one region of theVenn Diagram. This gives us the rather dismal starting point:
?
? ?
???
?
7
=150
By the way, I’m using the convention that the software industry is the lower-right circle, the biomedical industryis the lower-left circle, and the telecommunications industry is the top circle. We will continue in the next box.
Continuing with the previous box, let’s see what happens if we put an x in the center of the Venn Diagram.
1. Because 79 economists gave a positive outlook to both software & biomedical, and we have x economists for allthree, then 79� x goes in the mitre-shaped region between the software circle and the biomedical circle.
2. Because 84 economists gave a positive outlook to both software & telecommunications, and we have x economistsfor all three, then 84� x goes in the mitre-shaped region between the software circle and the telecommunicationscircle.
3. Because 82 economists gave a positive outlook to both biomedical & telecommunications, and we have x economistsfor all three, then 82�x goes in the mitre-shaped region between the biomedical circle and the telecommunicationscircle.
We will continue in the next box.
COPYRIGHT NOTICE: This is a work in-progress by Prof. Gregory V. Bard, which is intended to be eventually released under the Creative
Commons License (specifically agreement # 3 “attribution and non-commercial.”) Until such time as the document is completed, however, the
author reserves all rights, to ensure that imperfect copies are not widely circulated.
Module 7.4 Page 714 of 1124.
Continuing with the previous box,
4. Now we have to decide what to put in the cookie-shaped region in the software circle, in order to make the wholecircle 113. We’ve already accounted for x, 79� x, and 84� x. We should write
113� x� (79� x)� (84� x)
which simplifies to113� x� 79 + x� 84 + x
or more simply x� 50, since 113� 79� 84 = �50.
5. Next, we have to decide what to put in the cookie-shaped region in the biomedical circle, in order to make thewhole circle 99. We’ve already noted 79� x, x, and 82� x. We should write
99� (79� x)� x� (82� x)
which simplifies to99� 79 + x� x� 82 + x
or more simply x� 62. Again, note that 99� 79� 82 = �62.
6. Similarly, we have to decide what to put in the cookie-shaped region of the telecommunications circle, in orderto make the entire circle add to 98. We have so far 82� x, 84� x, and x. We need to put
98� (82� x)� (84� x)� x
which simplifies to98� 82 + x� 84 + x� x
or more compactly x� 68.
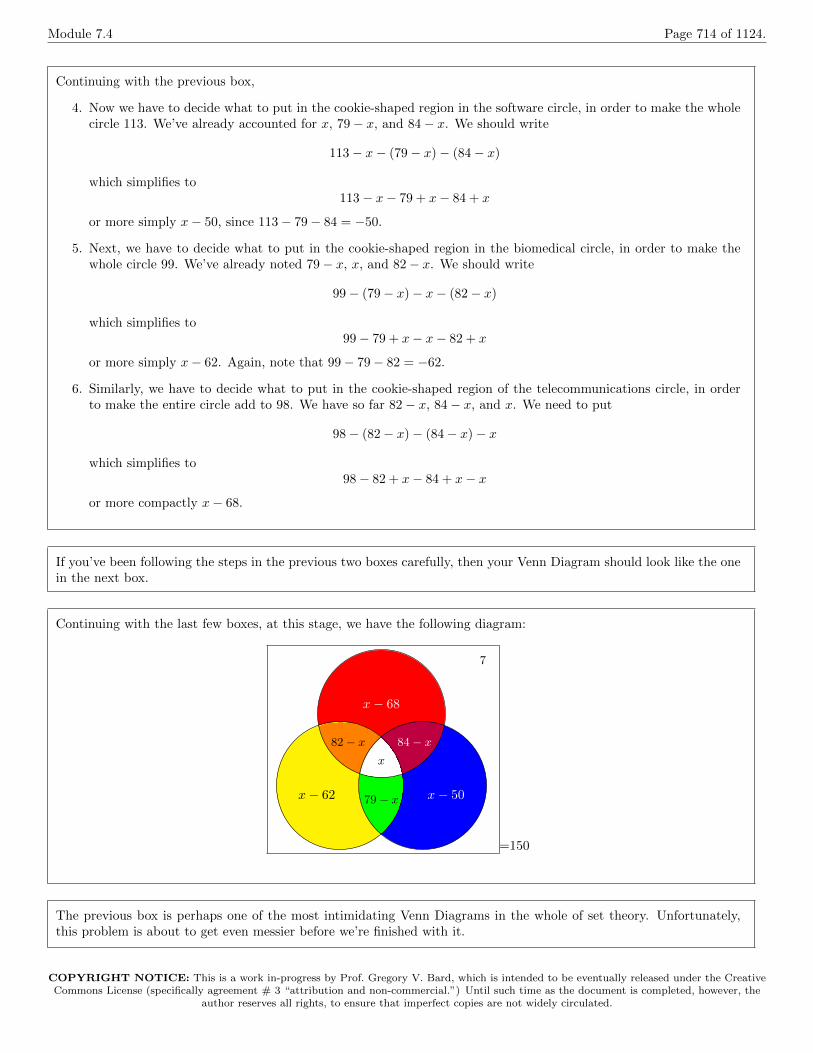
If you’ve been following the steps in the previous two boxes carefully, then your Venn Diagram should look like the onein the next box.
Continuing with the last few boxes, at this stage, we have the following diagram:
x� 68
x� 62 x� 50
x
84� x82� x
79� x
7
=150
The previous box is perhaps one of the most intimidating Venn Diagrams in the whole of set theory. Unfortunately,this problem is about to get even messier before we’re finished with it.
COPYRIGHT NOTICE: This is a work in-progress by Prof. Gregory V. Bard, which is intended to be eventually released under the Creative
Commons License (specifically agreement # 3 “attribution and non-commercial.”) Until such time as the document is completed, however, the
author reserves all rights, to ensure that imperfect copies are not widely circulated.
Module 7.4 Page 715 of 1124.
At this point, we should realize that all eight internal regions of the Venn Diagram must add up to 150. That meanswe have
(x� 68) + (84� x) + (x� 50) + (79� x) + (x� 62) + (82� x) + x+ 7 = 150
(�68) + 84 + (�50) + 79 + (�62) + 82 + 7 + x� x+ x� x+ x� x+ x = 150
72 + x = 150
x = 150� 72
x = 78
We can now finish the problem in the next box.
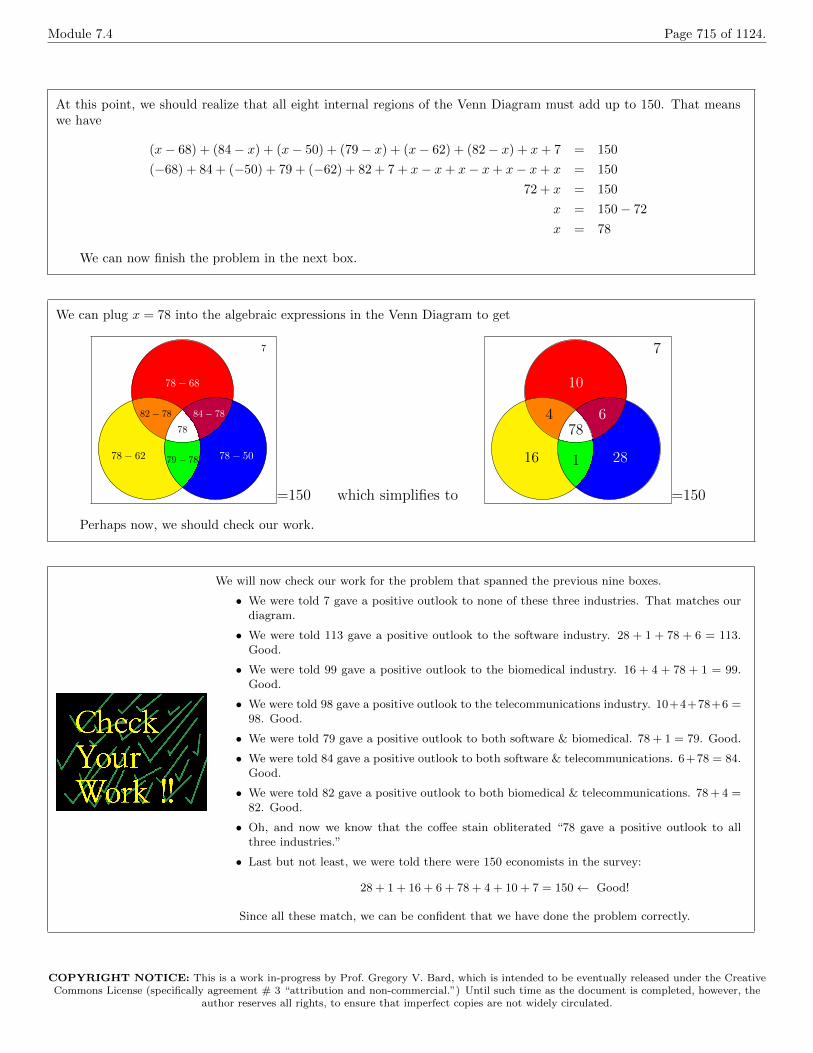
We can plug x = 78 into the algebraic expressions in the Venn Diagram to get
78� 68
78� 62 78� 50
78
84� 7882� 78
79� 78
7
=150 which simplifies to
10
16 28
7864
1
7
=150
Perhaps now, we should check our work.
We will now check our work for the problem that spanned the previous nine boxes.
• We were told 7 gave a positive outlook to none of these three industries. That matches ourdiagram.
• We were told 113 gave a positive outlook to the software industry. 28 + 1 + 78 + 6 = 113.Good.
• We were told 99 gave a positive outlook to the biomedical industry. 16 + 4 + 78 + 1 = 99.Good.
• We were told 98 gave a positive outlook to the telecommunications industry. 10+4+78+6 =98. Good.
• We were told 79 gave a positive outlook to both software & biomedical. 78 + 1 = 79. Good.
• We were told 84 gave a positive outlook to both software & telecommunications. 6+78 = 84.Good.
• We were told 82 gave a positive outlook to both biomedical & telecommunications. 78+ 4 =82. Good.
• Oh, and now we know that the co↵ee stain obliterated “78 gave a positive outlook to allthree industries.”
• Last but not least, we were told there were 150 economists in the survey:
28 + 1 + 16 + 6 + 78 + 4 + 10 + 7 = 150 Good!
Since all these match, we can be confident that we have done the problem correctly.
COPYRIGHT NOTICE: This is a work in-progress by Prof. Gregory V. Bard, which is intended to be eventually released under the Creative
Commons License (specifically agreement # 3 “attribution and non-commercial.”) Until such time as the document is completed, however, the
author reserves all rights, to ensure that imperfect copies are not widely circulated.
Module 7.4 Page 716 of 1124.
Earlier, we saw the inclusion-exclusion formula for (two) sets:
# (A [ B) = #A+#B �#(A \ B)
However, there is another version, for three sets:
# (A [ B [ C) = #A+#B +#C �#(A \ B)�#(B \ C)�#(A \ C) + # (A \ B \ C)
While that formula is a little bit large and complicated, we’ll see shortly how it can beused to make quick work of our previous example.
Let’s re-examine the previous example, using our new tool.Let A be the set of economists who give a positive outlook to the software industry.
Likewise, let B and C represent the biomedical and telecommunications industries. Usingthe three-set version of the inclusion-exclusion formula, we obtain
# (A [ B [ C) = #A+#B +#C �#(A \ B)�#(B \ C)�#(A \ C) + # (A \ B \ C)150� 7 = 113 + 99 + 98� 79� 82� 84 + x
143 = 65 + x
143� 65 = x
78 = x
Once we have x, the rest of the problem is easy. We have now mathematically undonethe co↵ee stain. Not only that, it required a lot less work than finding x via “the long way,”as we did in the preceding pages.
# 7-4-9
Having “undone” Jed’s co↵ee stain in the previous example, we now have the followingfacts:
• 7 economists gave a positive outlook to none of those three industries.
• 113 economists gave a positive outlook to the software industry.
• 99 economists gave a positive outlook to the biomedical industry.
• 98 economists gave a positive outlook to the telecommunications industry.
• 79 economists gave a positive outlook to both software & biomedical.
• 84 economists gave a positive outlook to both software & telecommunications.
• 82 economists gave a positive outlook to both telecommunications & biomedical.
• 78 economists gave a positive outlook to all three industries.
From this starting point, draw a complete Venn Diagram that describes the entiresituation. Compare your answer with the solution given on Page 715.
COPYRIGHT NOTICE: This is a work in-progress by Prof. Gregory V. Bard, which is intended to be eventually released under the Creative
Commons License (specifically agreement # 3 “attribution and non-commercial.”) Until such time as the document is completed, however, the
author reserves all rights, to ensure that imperfect copies are not widely circulated.
Module 7.4 Page 717 of 1124.
It might be worthwhile to verify the three-set inclusion-exclusion formula on the three-circleVenn Diagram problem about the mushrooms. The final diagram was given on Page 707.We had tasty mushrooms, which we can denote T ; we had spotted mushrooms, which wecan denote S; lastly, we had lethal mushrooms, which we can denote L.
#(L [ T [ S) = #L+#T +#S �#(L \ T )�#(L \ S)�#(T \ S) + # (L \ T \ S)(995� 29) = 611 + 345 + 263� 97� 114� 48 + 6
966 = 966
Great! It works.
We’re going to talk about blood types now. This is a super-classic use of Venn Diagrams.However, we’re going to go into much more detail than most texts. Not only is beingknowledgeable on the basics of medicine an important part of being an educated person,this particular information is very useful in preparing you to either care for your parents asthey age, or to care for your children if you happen to ever have any.
The idea of blood transfusion is actually quite old. There is one late medieval/early re-naissance case, namely Pope Innocent VIII (1432–1492) on his deathbed. Most of the earlyexperiments with blood were performed in the 1600s, but usually the patient did not sur-vive. A pioneer of the subject was Jean-Baptiste Denys (1643–1704), physician to Louis XIV(1638–1715).
Several medical procedures in that era had roughly 80% death rates, but they were usedoften if the death rate after doing nothing would have been 100%.
At some point, it was noticed that if the blood donor were a close relative of thepatient, then the patient was much more likely to survive. This tantalizing clue might haveeventually lead to the genetic theory of blood types. Unfortunately, toward the end of the1600s, the procedure was banned in Europe for religious reasons.
The modern procedure was pioneered by an English physician Dr. James Blundell (1791–1878). One of his techniques was to mix a bit of blood from the donor and the patient andsee (visually) if it formed clumps—which we now know as blood clots. If it did, then hewould not transfuse, and this made the procedure far safer. Nonetheless, sometimes theblood did not clot in the test, and the patient died anyway. In either case, the causes of thecompatibility, or incompatibility, were not known.
Finally, in 1901 Karl Landsteiner (1868–1943), an Austrian physician who spent muchof his career in the USA, discovered blood types. At last, there was an explanation!
COPYRIGHT NOTICE: This is a work in-progress by Prof. Gregory V. Bard, which is intended to be eventually released under the Creative
Commons License (specifically agreement # 3 “attribution and non-commercial.”) Until such time as the document is completed, however, the
author reserves all rights, to ensure that imperfect copies are not widely circulated.
Module 7.4 Page 718 of 1124.
The pioneer of blood typing was Karl Landsteiner (1868–1943), and he won the Nobel Prizein Physiology & Medicine in 1930. He took his medical degrees from the University ofVienna, becoming a doctor of medicine in 1891. He studied chemistry next for two years,in Wurzburg, then returned to Vienna. His research prospered until The First World War1914–1919, where he served in a military hospital. After the war, Austria was financiallydevastated, and he was unable to continue with his research. He moved to The Hague inthe The Netherlands, and then to The Rockefeller Institute in New York City, where helived for the rest of his life.
He discovered the A-B-AB-O system first, in the year 1901, and then in 1909 discoveredhow polio was spread and later made the first vaccine for it. Polio was an extremelydebilitating disease, crippling many of the world’s population, including Franklin DelanoRoosevelt (1882–1945). The Rh-factor was an important extension of the A-B-AB-O scheme,and Landsteiner was a co-discoverer of that as well, in 1937. He died in 1943 while workingin his laboratory. He was 75 years old at the time, and it is said that he never stoppedresearching.
There are receptors on the surface of red blood cells, called antigens. Two particular re-ceptors are very important, and are called “A” and “B.” If you’ve got the “A” antigen, butnot “B,” we say you have blood type “A.” If you’ve got the “B” antigen, but not “A,” wesay you have blood type “B.” If you’ve got both, then we say you’ve got blood type “AB.”Finally, if you have neither, we say you have blood type “O.”
At this moment, in the language of set theory, we know about the antigens {A,B}, andthe four subsets of this set, namely,
{{} ; {A} ; {B} ; {A,B}}
correspond to four possible blood types O, A, B, and AB respectively. (By the way, inEurope the O is usually written as zero.)
This arrangement can be summarized with the following diagram:
A BAB
O
=Everybody
where the left circle represents people with the A antigen, and the right represents peoplewith the B antigen.
• When the patient receives blood, if the donor has an antigen which the patient doesnot, then there will be a major problem.
• Thus, the set of antigens of the donor must be a subset of the antigens of the patient.
One way to remember this is that no new antigens may be introduced when giving apatient blood.
COPYRIGHT NOTICE: This is a work in-progress by Prof. Gregory V. Bard, which is intended to be eventually released under the Creative
Commons License (specifically agreement # 3 “attribution and non-commercial.”) Until such time as the document is completed, however, the
author reserves all rights, to ensure that imperfect copies are not widely circulated.
Module 7.4 Page 719 of 1124.
As often happens in science, the original theory was in need of improvement. About 30years later, another antigen was discovered. This one is called Rh-factor.
Either you have the Rh factor, or you don’t. If you have it, we a�x a plus sign to theend of your blood type. If you do not have it, then we a�x a minus sign to the end of yourblood type. However, the same rules apply as given in the previous box. Now, we knowabout a set of three antigens, namely {A,B,R}, and a blood type is one of the 8 possiblesubsets of this set, namely:
{{} ; {A} ; {B} ; {R} ; {A,B} ; {A,R} ; {B,R} ; {A,B,R}}
and the blood types associated with those are (in order)
O-, A-, B-, O+, AB-, A+, B+, AB+
Take a moment to understand this relationship.
The Venn Diagram now looks like this:
A-
B- O+
AB+A+AB-
B+
O-
= Everybody
where the top circle represents those with the A antigen, and the lower-left circle is those with the B antigen. Likewisethe lower-right circle are those with the Rh antigen.
Suppose Alice and Bob are on vacation, and they get into a bad car accident, and requireblood transfusions. Alice has blood type AB- and Bob has blood type B+. What types ofblood can Alice get? What types of blood can Bob get?
Since Alice has blood type AB-, then the antigens she has are {A,B}, and she canreceive any subset of those, which would be {}, {A}, {B}, or {A,B}. Note, since theantigen set has 2 elements, it must have 22 = 4 subsets (see Page 657). A medical doctorwould call these blood types O-, A-, B-, and AB-.
Since Bob has blood type B+, then the antigens he has are {B,Rh}, and he can receiveany subset of that. Again, there are 2 things in the set, so the set has 4 subsets. Thosesubsets are {}, {B}, {Rh}, and {B,Rh}. Then a doctor would call those O-, B-, O+, B+.
COPYRIGHT NOTICE: This is a work in-progress by Prof. Gregory V. Bard, which is intended to be eventually released under the Creative
Commons License (specifically agreement # 3 “attribution and non-commercial.”) Until such time as the document is completed, however, the
author reserves all rights, to ensure that imperfect copies are not widely circulated.

Module 7.4 Page 720 of 1124.
# 7-4-10
• Charlie has blood type A+. What types can he receive?
• David has blood type AB+. What types can he receive?
• Electra has blood type O+. What types of blood can she receive?
[Answer: Electra can receive either O- or O+. David can receive any of the eight types.Charlie can receive O+, O-, A+, and A-.]
We saw in the above box that David has all three antigens, therefore any set of antigens isa subset of his antigens. For this reason, AB+ is called “the universal recipient.”
On the other hand, do you remember (from Page 656) that we said that the empty setis a subset of any set? This means that someone with the empty set as their antigens candonate blood to anyone. For this reason, O- is called “the universal donor.”
• Who can receive Alice’s blood? Recall, she is of type AB-.
• Since her antigens are {A,B}, then the supersets of that set are {A,B,Rh} and{A,B}, so only patients of type AB+ and AB- can receive her blood.
• Who can receive Bob’s blood? Recall, he is of type B+.
• Since his antigens are {B,Rh} then the supersets are {B,Rh} and {A,B,Rh}. Thismeans he can donate to people of blood types B+ and AB+.
# 7-4-11
• What blood types of patients can receive Charlie’s blood? (He’s A+)
• What blood types of patients can receive David’s blood? (He’s AB+)
• What blood types of patients can receive Electra’s blood? (She’s O+)
[Answer: David can give to only AB+ patients. Electra can give to O+, A+, B+, andAB+. Charlie can give to only to those with types A+ and AB+.]
COPYRIGHT NOTICE: This is a work in-progress by Prof. Gregory V. Bard, which is intended to be eventually released under the Creative
Commons License (specifically agreement # 3 “attribution and non-commercial.”) Until such time as the document is completed, however, the
author reserves all rights, to ensure that imperfect copies are not widely circulated.
Module 7.4 Page 721 of 1124.
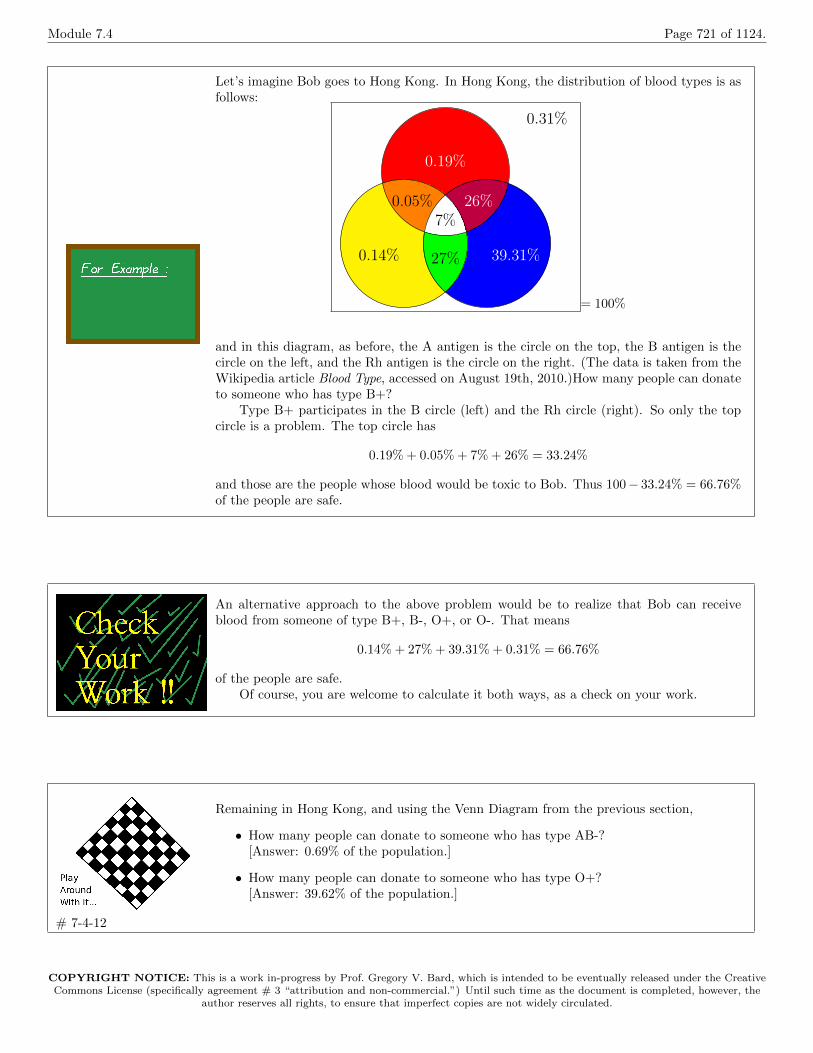
Let’s imagine Bob goes to Hong Kong. In Hong Kong, the distribution of blood types is asfollows:
0.19%
0.14% 39.31%
7%26%0.05%
27%
0.31%
= 100%
and in this diagram, as before, the A antigen is the circle on the top, the B antigen is thecircle on the left, and the Rh antigen is the circle on the right. (The data is taken from theWikipedia article Blood Type, accessed on August 19th, 2010.)How many people can donateto someone who has type B+?
Type B+ participates in the B circle (left) and the Rh circle (right). So only the topcircle is a problem. The top circle has
0.19% + 0.05% + 7%+ 26% = 33.24%
and those are the people whose blood would be toxic to Bob. Thus 100� 33.24% = 66.76%of the people are safe.
An alternative approach to the above problem would be to realize that Bob can receiveblood from someone of type B+, B-, O+, or O-. That means
0.14% + 27% + 39.31% + 0.31% = 66.76%
of the people are safe.Of course, you are welcome to calculate it both ways, as a check on your work.
# 7-4-12
Remaining in Hong Kong, and using the Venn Diagram from the previous section,
• How many people can donate to someone who has type AB-?[Answer: 0.69% of the population.]
• How many people can donate to someone who has type O+?[Answer: 39.62% of the population.]
COPYRIGHT NOTICE: This is a work in-progress by Prof. Gregory V. Bard, which is intended to be eventually released under the Creative
Commons License (specifically agreement # 3 “attribution and non-commercial.”) Until such time as the document is completed, however, the
author reserves all rights, to ensure that imperfect copies are not widely circulated.
Module 7.4 Page 722 of 1124.
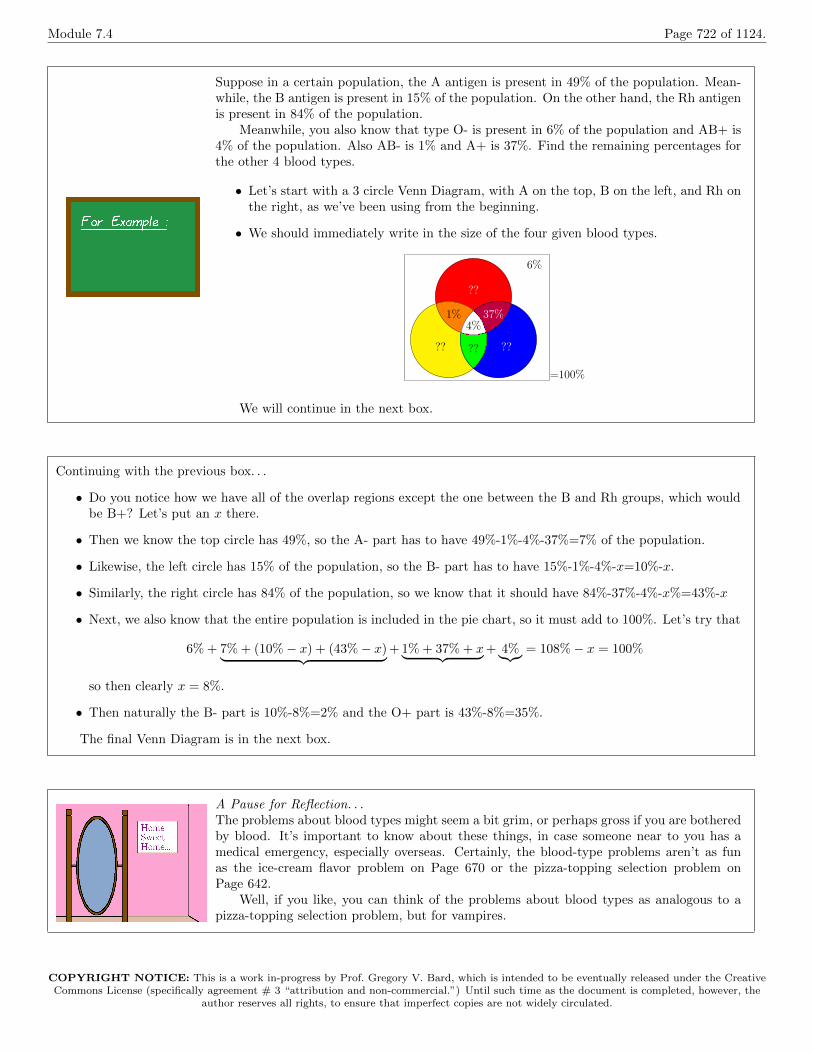
Suppose in a certain population, the A antigen is present in 49% of the population. Mean-while, the B antigen is present in 15% of the population. On the other hand, the Rh antigenis present in 84% of the population.
Meanwhile, you also know that type O- is present in 6% of the population and AB+ is4% of the population. Also AB- is 1% and A+ is 37%. Find the remaining percentages forthe other 4 blood types.
• Let’s start with a 3 circle Venn Diagram, with A on the top, B on the left, and Rh onthe right, as we’ve been using from the beginning.
• We should immediately write in the size of the four given blood types.
??
?? ??
4%37%1%
??
6%
=100%
We will continue in the next box.
Continuing with the previous box. . .
• Do you notice how we have all of the overlap regions except the one between the B and Rh groups, which wouldbe B+? Let’s put an x there.
• Then we know the top circle has 49%, so the A- part has to have 49%-1%-4%-37%=7% of the population.
• Likewise, the left circle has 15% of the population, so the B- part has to have 15%-1%-4%-x=10%-x.
• Similarly, the right circle has 84% of the population, so we know that it should have 84%-37%-4%-x%=43%-x
• Next, we also know that the entire population is included in the pie chart, so it must add to 100%. Let’s try that
6% + 7%+ (10%� x) + (43%� x)| {z }
+1%+ 37% + x| {z }
+ 4%|{z}
= 108%� x = 100%
so then clearly x = 8%.
• Then naturally the B- part is 10%-8%=2% and the O+ part is 43%-8%=35%.
The final Venn Diagram is in the next box.
A Pause for Reflection. . .The problems about blood types might seem a bit grim, or perhaps gross if you are botheredby blood. It’s important to know about these things, in case someone near to you has amedical emergency, especially overseas. Certainly, the blood-type problems aren’t as funas the ice-cream flavor problem on Page 670 or the pizza-topping selection problem onPage 642.
Well, if you like, you can think of the problems about blood types as analogous to apizza-topping selection problem, but for vampires.
COPYRIGHT NOTICE: This is a work in-progress by Prof. Gregory V. Bard, which is intended to be eventually released under the Creative
Commons License (specifically agreement # 3 “attribution and non-commercial.”) Until such time as the document is completed, however, the
author reserves all rights, to ensure that imperfect copies are not widely circulated.
Module 7.4 Page 723 of 1124.
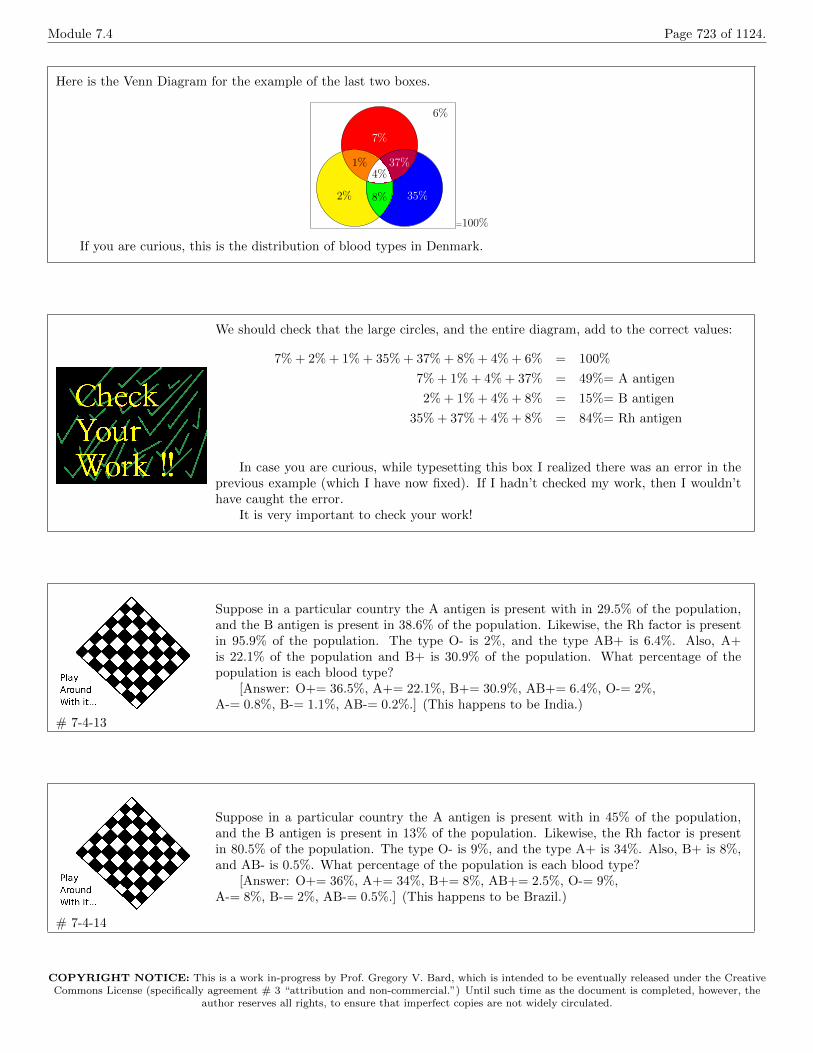
Here is the Venn Diagram for the example of the last two boxes.
7%
2% 35%
4%37%1%
8%
6%
=100%
If you are curious, this is the distribution of blood types in Denmark.
We should check that the large circles, and the entire diagram, add to the correct values:
7% + 2%+ 1%+ 35% + 37% + 8%+ 4%+ 6% = 100%
7%+ 1%+ 4%+ 37% = 49%= A antigen
2% + 1%+ 4%+ 8% = 15%= B antigen
35% + 37% + 4%+ 8% = 84%= Rh antigen
In case you are curious, while typesetting this box I realized there was an error in theprevious example (which I have now fixed). If I hadn’t checked my work, then I wouldn’thave caught the error.
It is very important to check your work!
# 7-4-13
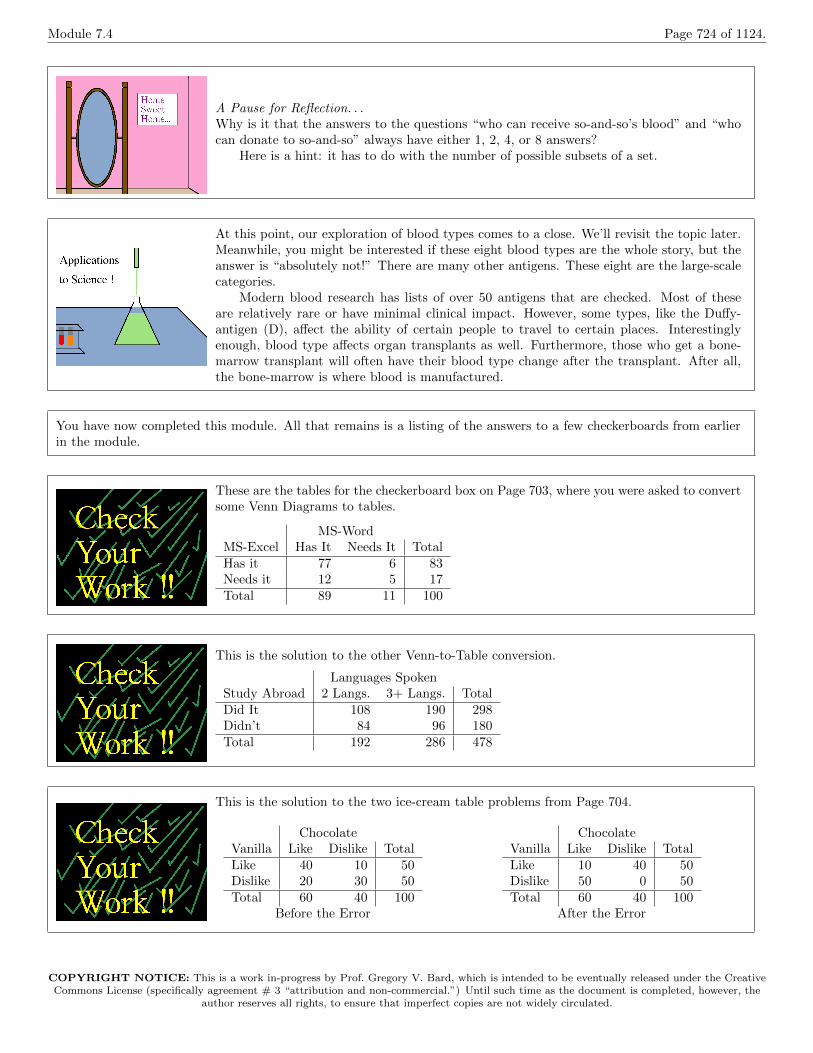
Suppose in a particular country the A antigen is present with in 29.5% of the population,and the B antigen is present in 38.6% of the population. Likewise, the Rh factor is presentin 95.9% of the population. The type O- is 2%, and the type AB+ is 6.4%. Also, A+is 22.1% of the population and B+ is 30.9% of the population. What percentage of thepopulation is each blood type?
[Answer: O+= 36.5%, A+= 22.1%, B+= 30.9%, AB+= 6.4%, O-= 2%,A-= 0.8%, B-= 1.1%, AB-= 0.2%.] (This happens to be India.)
# 7-4-14
Suppose in a particular country the A antigen is present with in 45% of the population,and the B antigen is present in 13% of the population. Likewise, the Rh factor is presentin 80.5% of the population. The type O- is 9%, and the type A+ is 34%. Also, B+ is 8%,and AB- is 0.5%. What percentage of the population is each blood type?
[Answer: O+= 36%, A+= 34%, B+= 8%, AB+= 2.5%, O-= 9%,A-= 8%, B-= 2%, AB-= 0.5%.] (This happens to be Brazil.)
COPYRIGHT NOTICE: This is a work in-progress by Prof. Gregory V. Bard, which is intended to be eventually released under the Creative
Commons License (specifically agreement # 3 “attribution and non-commercial.”) Until such time as the document is completed, however, the
author reserves all rights, to ensure that imperfect copies are not widely circulated.
Module 7.4 Page 724 of 1124.
A Pause for Reflection. . .Why is it that the answers to the questions “who can receive so-and-so’s blood” and “whocan donate to so-and-so” always have either 1, 2, 4, or 8 answers?
Here is a hint: it has to do with the number of possible subsets of a set.
At this point, our exploration of blood types comes to a close. We’ll revisit the topic later.Meanwhile, you might be interested if these eight blood types are the whole story, but theanswer is “absolutely not!” There are many other antigens. These eight are the large-scalecategories.
Modern blood research has lists of over 50 antigens that are checked. Most of theseare relatively rare or have minimal clinical impact. However, some types, like the Du↵y-antigen (D), a↵ect the ability of certain people to travel to certain places. Interestinglyenough, blood type a↵ects organ transplants as well. Furthermore, those who get a bone-marrow transplant will often have their blood type change after the transplant. After all,the bone-marrow is where blood is manufactured.
You have now completed this module. All that remains is a listing of the answers to a few checkerboards from earlierin the module.
These are the tables for the checkerboard box on Page 703, where you were asked to convertsome Venn Diagrams to tables.
MS-WordMS-Excel Has It Needs It TotalHas it 77 6 83Needs it 12 5 17Total 89 11 100
This is the solution to the other Venn-to-Table conversion.
Languages SpokenStudy Abroad 2 Langs. 3+ Langs. TotalDid It 108 190 298Didn’t 84 96 180Total 192 286 478
This is the solution to the two ice-cream table problems from Page 704.
ChocolateVanilla Like Dislike TotalLike 40 10 50Dislike 20 30 50Total 60 40 100
ChocolateVanilla Like Dislike TotalLike 10 40 50Dislike 50 0 50Total 60 40 100
Before the Error After the Error
COPYRIGHT NOTICE: This is a work in-progress by Prof. Gregory V. Bard, which is intended to be eventually released under the Creative
Commons License (specifically agreement # 3 “attribution and non-commercial.”) Until such time as the document is completed, however, the
author reserves all rights, to ensure that imperfect copies are not widely circulated.
Module 7.4 Page 725 of 1124.
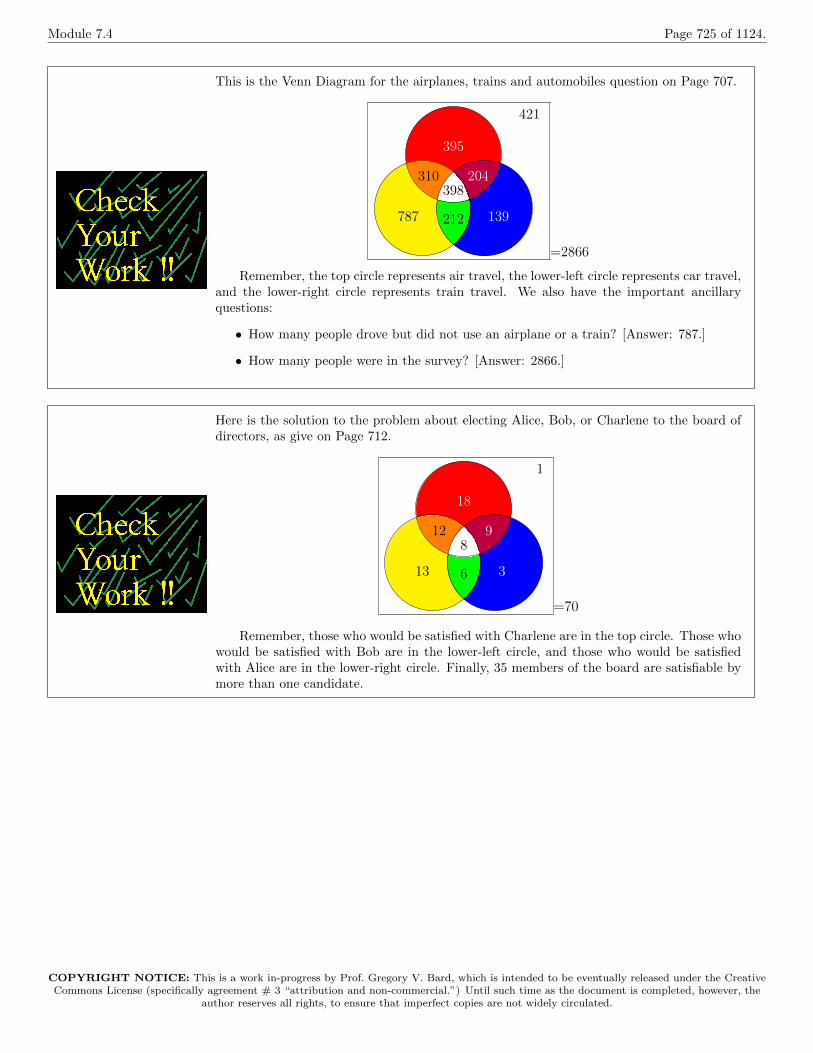
This is the Venn Diagram for the airplanes, trains and automobiles question on Page 707.
395
787 139
398204310
212
421
=2866
Remember, the top circle represents air travel, the lower-left circle represents car travel,and the lower-right circle represents train travel. We also have the important ancillaryquestions:
• How many people drove but did not use an airplane or a train? [Answer: 787.]
• How many people were in the survey? [Answer: 2866.]
Here is the solution to the problem about electing Alice, Bob, or Charlene to the board ofdirectors, as give on Page 712.
18
13 3
8912
6
1
=70
Remember, those who would be satisfied with Charlene are in the top circle. Those whowould be satisfied with Bob are in the lower-left circle, and those who would be satisfiedwith Alice are in the lower-right circle. Finally, 35 members of the board are satisfiable bymore than one candidate.
COPYRIGHT NOTICE: This is a work in-progress by Prof. Gregory V. Bard, which is intended to be eventually released under the Creative
Commons License (specifically agreement # 3 “attribution and non-commercial.”) Until such time as the document is completed, however, the
author reserves all rights, to ensure that imperfect copies are not widely circulated.