Embed Size (px)
Citation preview

Labo
r Mar
ket P
artic
ipat
ion
of
Pers
ons
with
Dis
abili
ties
May 7 – 11, 2012 Washington, D.C.
Zafar Nazarov, Ph.D. ([email protected]) Judy Young, M.A. ([email protected])
Employment and Disability Institute
Cornell University ILR School
World Bank, Disability and Development
May 10, 2012 Cornell work described here has been supported under the Rehabilitation Research and Training Center on Employer Practices Related to Employment Outcomes Among Individuals with Disabilities at Cornell University funded by the U.S. Department of Education, National Institute on Disability and Rehabilitation Research (Grant No. H133B040013), and The National Employer TA Center, funded to Cornell University by cooperative agreement from the U.S. Department of Labor Office of Disability Employment Policy. (Grant No. OD-19529-09-75-4-36).
Presentation Overview • People with disabilities in the U.S. labor force
o Prevalence of disability, CPS-March
o Employment rates; factors contributing to disparities
o Hourly wages; decomposition of wage differential
o SSI/SSDI benefits and work incentives programs
o Workers’ Compensation programs
o Vocational Rehabilitation Services
• Return to work: Principles and best practices o Principles of return-to-work programs (RTW)
o Common causes of leave/absence from the workplace
o Elements of successful RTW programs and implementation barriers
o Advantages for public policy, employers, and employees
o Strategies and best practices

Status of People with Disabilities in the U.S. Labor Force – Zafar Nazarov
May 7 – 11, 2012 Washington, D.C.
• Prevalence of disability, CPS-March
• Employment rates and factors associated with the gap between PWDs and non-PWDs
• Hourly wages and decomposition of the wage differential
• SSI/SSDI benefits; work incentives programs
• Workers’ Compensation programs
• Vocational Rehabilitation Services 5
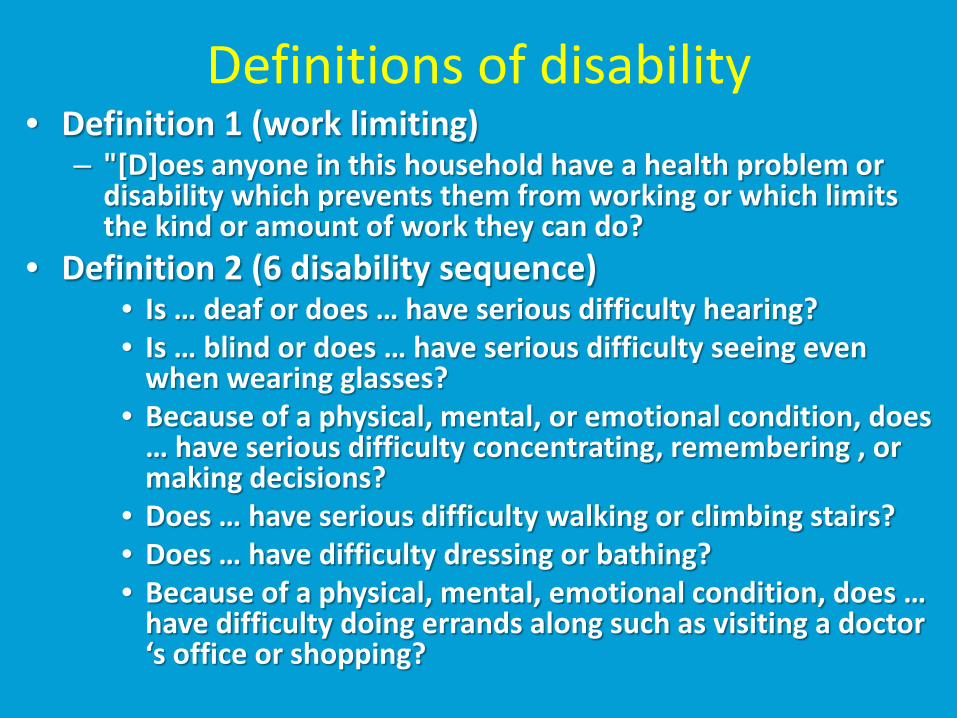
Definitions of disability • Definition 1 (work limiting)
– "[D]oes anyone in this household have a health problem or disability which prevents them from working or which limits the kind or amount of work they can do?
• Definition 2 (6 disability sequence) • Is … deaf or does … have serious difficulty hearing? • Is … blind or does … have serious difficulty seeing even
when wearing glasses? • Because of a physical, mental, or emotional condition, does
… have serious difficulty concentrating, remembering , or making decisions?
• Does … have serious difficulty walking or climbing stairs? • Does … have difficulty dressing or bathing? • Because of a physical, mental, emotional condition, does …
have difficulty doing errands along such as visiting a doctor ‘s office or shopping?
7
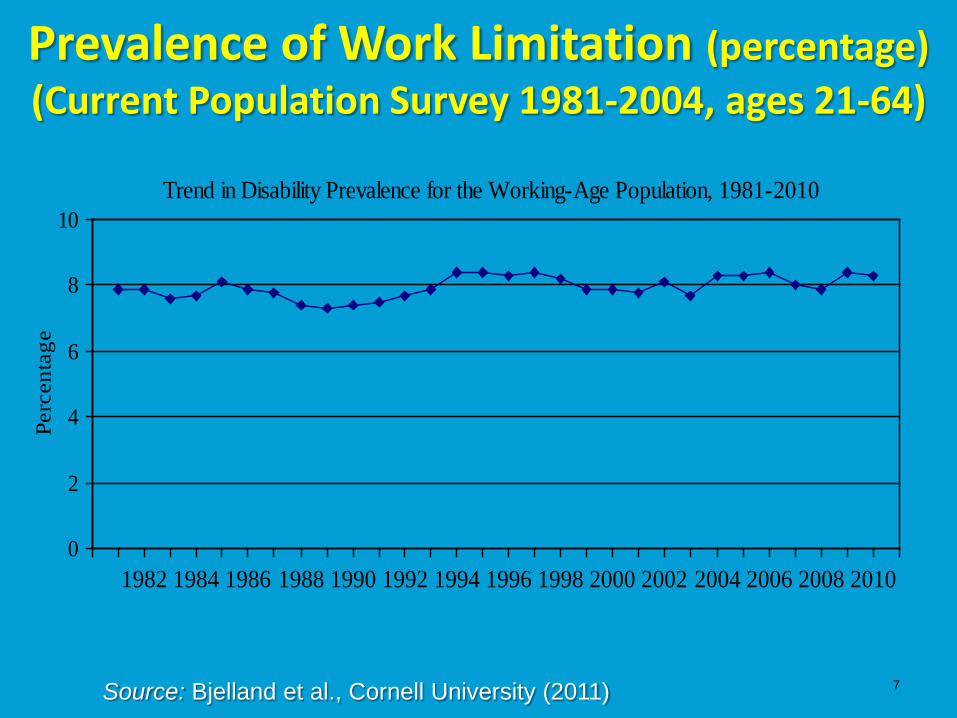
Prevalence of Work Limitation (percentage) (Current Population Survey 1981-2004, ages 21-64)
Trend in Disability Prevalence for the Working-Age Population, 1981-2010
0
2
4
6
8
10
1982 1984 1986 1988 1990 1992 1994 1996 1998 2000 2002 2004 2006 2008 2010
Perc
enta
ge
Source: Bjelland et al., Cornell University (2011)
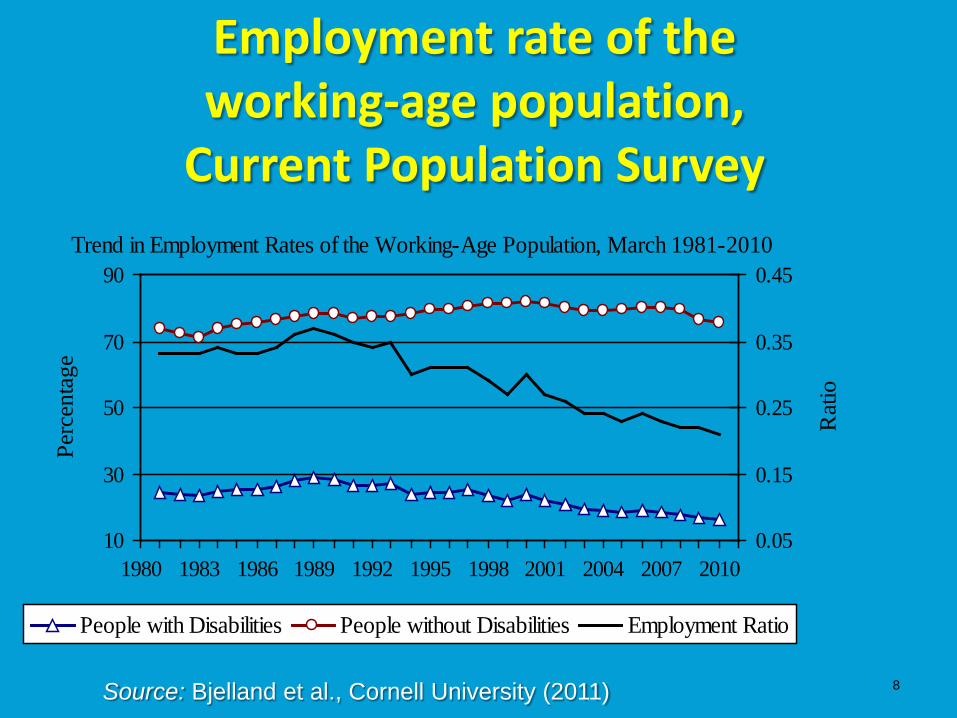
Employment rate of the working-age population,
Current Population Survey
8
Trend in Employment Rates of the Working-Age Population, March 1981-2010
10
30
50
70
90
1980 1983 1986 1989 1992 1995 1998 2001 2004 2007 2010
Perc
enta
ge
0.05
0.15
0.25
0.35
0.45
Rat
io
People with Disabilities People without Disabilities Employment Ratio
Source: Bjelland et al., Cornell University (2011)
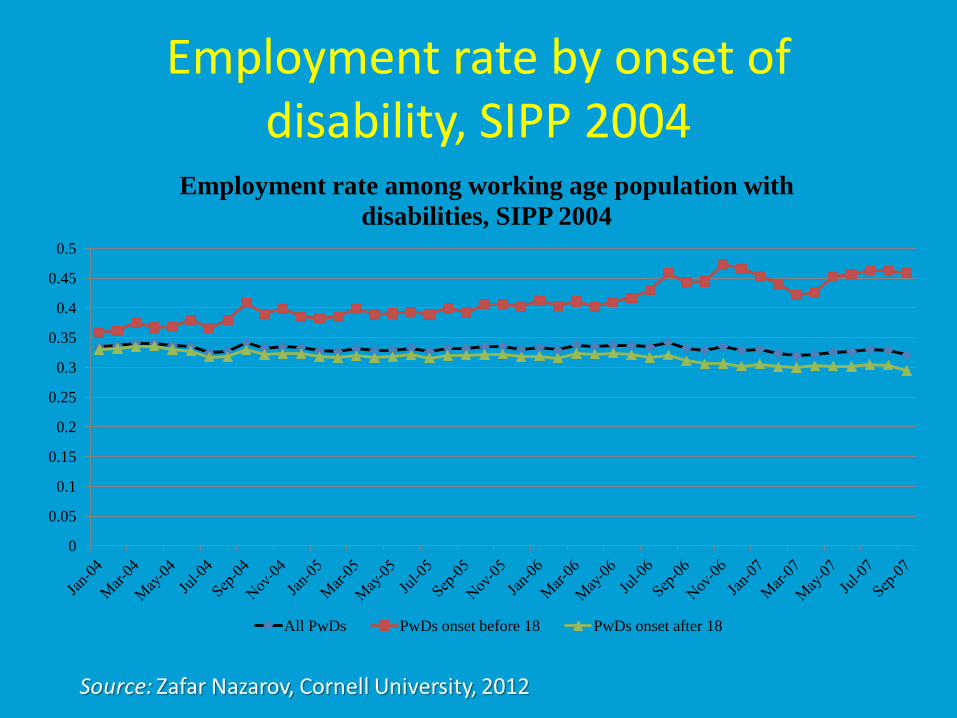
Employment rate by onset of disability, SIPP 2004
0
0.05
0.1
0.15
0.2
0.25
0.3
0.35
0.4
0.45
0.5
Employment rate among working age population with disabilities, SIPP 2004
All PwDs PwDs onset before 18 PwDs onset after 18
Determinants of Employment Outcomes and Return to Work – Evidence from Empirical Studies
10
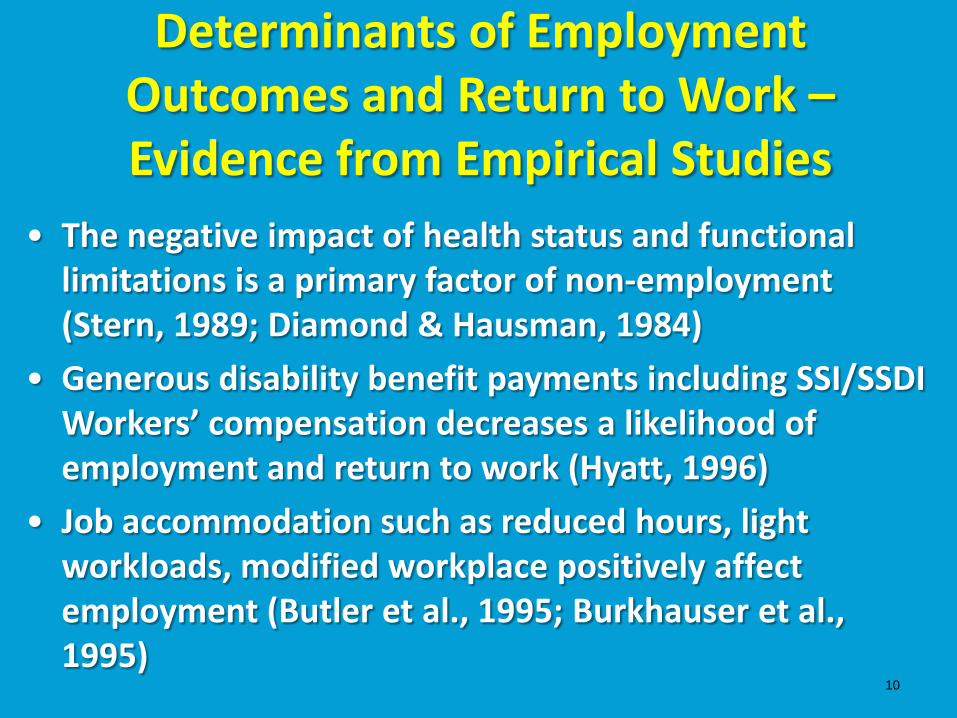
• The negative impact of health status and functional limitations is a primary factor of non-employment (Stern, 1989; Diamond & Hausman, 1984)
• Generous disability benefit payments including SSI/SSDI Workers’ compensation decreases a likelihood of employment and return to work (Hyatt, 1996)
• Job accommodation such as reduced hours, light workloads, modified workplace positively affect employment (Butler et al., 1995; Burkhauser et al., 1995)
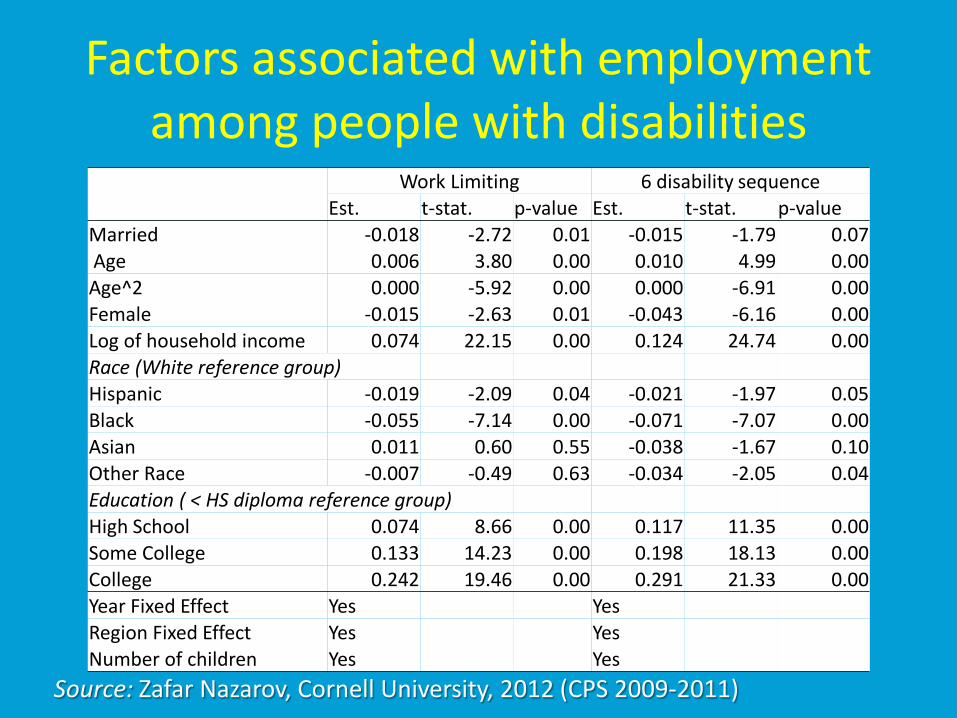
Factors associated with employment among people with disabilities
Work Limiting 6 disability sequence
Est. t-stat. p-value Est. t-stat. p-value Married -0.018 -2.72 0.01 -0.015 -1.79 0.07 Age 0.006 3.80 0.00 0.010 4.99 0.00 Age^2 0.000 -5.92 0.00 0.000 -6.91 0.00 Female -0.015 -2.63 0.01 -0.043 -6.16 0.00 Log of household income 0.074 22.15 0.00 0.124 24.74 0.00 Race (White reference group) Hispanic -0.019 -2.09 0.04 -0.021 -1.97 0.05 Black -0.055 -7.14 0.00 -0.071 -7.07 0.00 Asian 0.011 0.60 0.55 -0.038 -1.67 0.10 Other Race -0.007 -0.49 0.63 -0.034 -2.05 0.04 Education ( < HS diploma reference group) High School 0.074 8.66 0.00 0.117 11.35 0.00 Some College 0.133 14.23 0.00 0.198 18.13 0.00 College 0.242 19.46 0.00 0.291 21.33 0.00 Year Fixed Effect Yes Yes Region Fixed Effect Yes Yes Number of children Yes Yes
Source: Zafar Nazarov, Cornell University, 2012 (CPS 2009-2011)
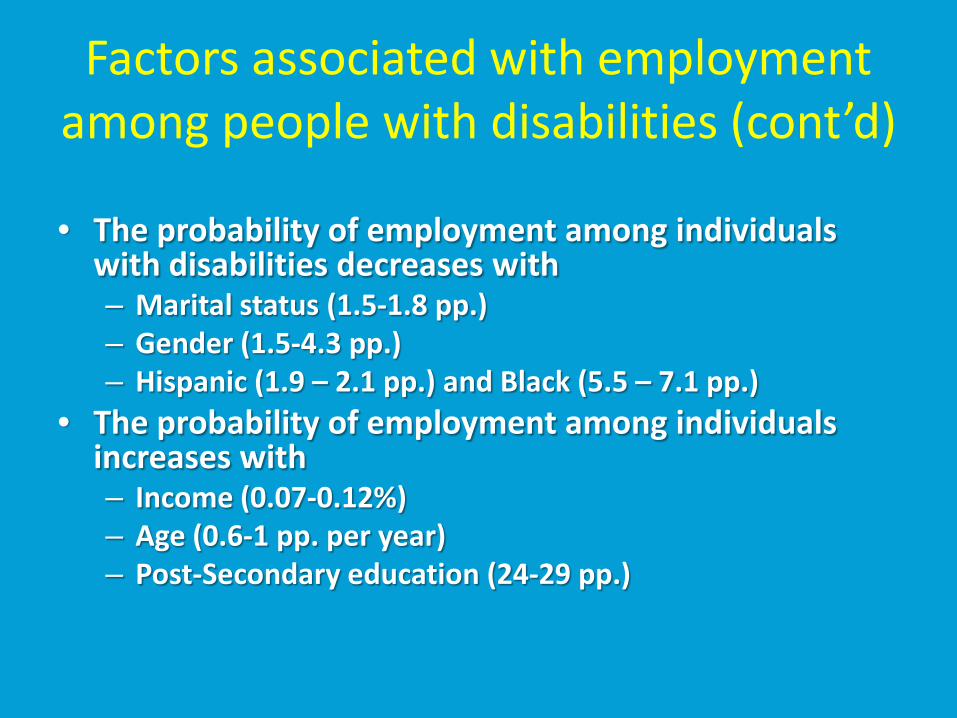
Factors associated with employment among people with disabilities (cont’d)
• The probability of employment among individuals
with disabilities decreases with – Marital status (1.5-1.8 pp.) – Gender (1.5-4.3 pp.) – Hispanic (1.9 – 2.1 pp.) and Black (5.5 – 7.1 pp.)
• The probability of employment among individuals increases with – Income (0.07-0.12%) – Age (0.6-1 pp. per year) – Post-Secondary education (24-29 pp.)
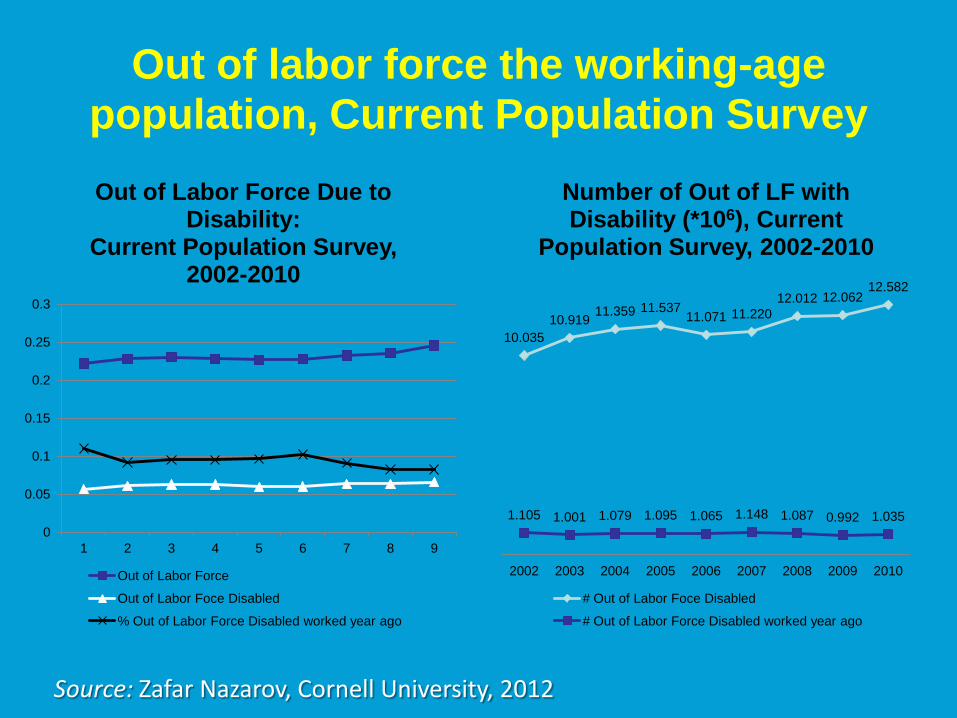
Out of labor force the working-age population, Current Population Survey
0
0.05
0.1
0.15
0.2
0.25
0.3
1 2 3 4 5 6 7 8 9
Out of Labor Force Due to Disability:
Current Population Survey, 2002-2010
Out of Labor Force
Out of Labor Foce Disabled
% Out of Labor Force Disabled worked year ago
10.035 10.919 11.359 11.537
11.071 11.220 12.012 12.062
12.582
1.105 1.001 1.079 1.095 1.065 1.148 1.087 0.992 1.035
2002 2003 2004 2005 2006 2007 2008 2009 2010
Number of Out of LF with Disability (*106), Current
Population Survey, 2002-2010
# Out of Labor Foce Disabled
# Out of Labor Force Disabled worked year ago
Source: Zafar Nazarov, Cornell University, 2012
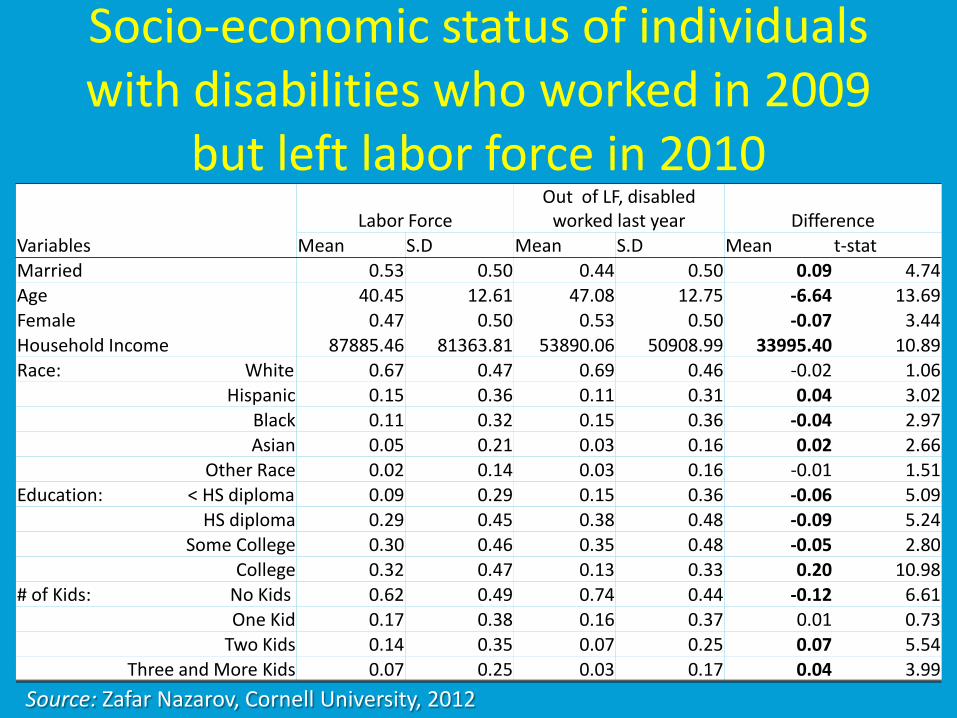
Socio-economic status of individuals with disabilities who worked in 2009
but left labor force in 2010
Variables Labor Force
Out of LF, disabled worked last year Difference
Mean S.D Mean S.D Mean t-stat Married 0.53 0.50 0.44 0.50 0.09 4.74 Age 40.45 12.61 47.08 12.75 -6.64 13.69 Female 0.47 0.50 0.53 0.50 -0.07 3.44 Household Income 87885.46 81363.81 53890.06 50908.99 33995.40 10.89 Race: White 0.67 0.47 0.69 0.46 -0.02 1.06
Hispanic 0.15 0.36 0.11 0.31 0.04 3.02 Black 0.11 0.32 0.15 0.36 -0.04 2.97 Asian 0.05 0.21 0.03 0.16 0.02 2.66
Other Race 0.02 0.14 0.03 0.16 -0.01 1.51 Education: < HS diploma 0.09 0.29 0.15 0.36 -0.06 5.09
HS diploma 0.29 0.45 0.38 0.48 -0.09 5.24 Some College 0.30 0.46 0.35 0.48 -0.05 2.80
College 0.32 0.47 0.13 0.33 0.20 10.98 # of Kids: No Kids 0.62 0.49 0.74 0.44 -0.12 6.61
One Kid 0.17 0.38 0.16 0.37 0.01 0.73 Two Kids 0.14 0.35 0.07 0.25 0.07 5.54
Three and More Kids 0.07 0.25 0.03 0.17 0.04 3.99
Source: Zafar Nazarov, Cornell University, 2012
Socio-economic status of individuals with disabilities who worked in 2009 but left labor force in 2010 (cont’d)
• Individuals with disabilities who left labor force compared to other workers are – Less educated
– Older
– More likely to be single, female and Black
– Less likely to be Hispanic, Asian and have any kids
– More likely to have fewer number of kids under 18
and lower household income
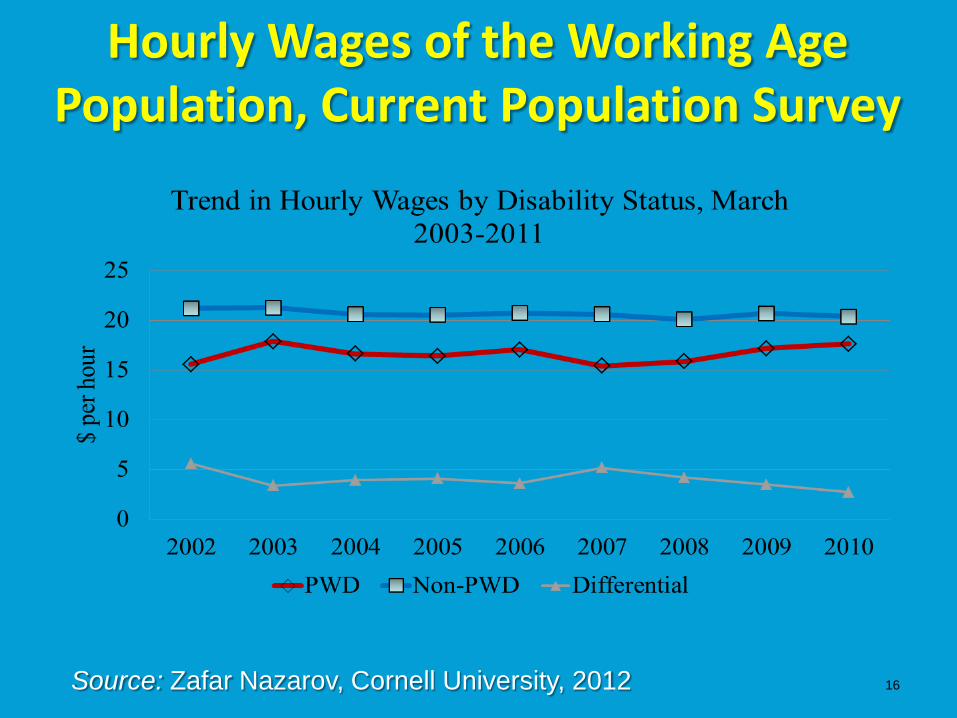
Hourly Wages of the Working Age Population, Current Population Survey
16 Source: Zafar Nazarov, Cornell University, 2012
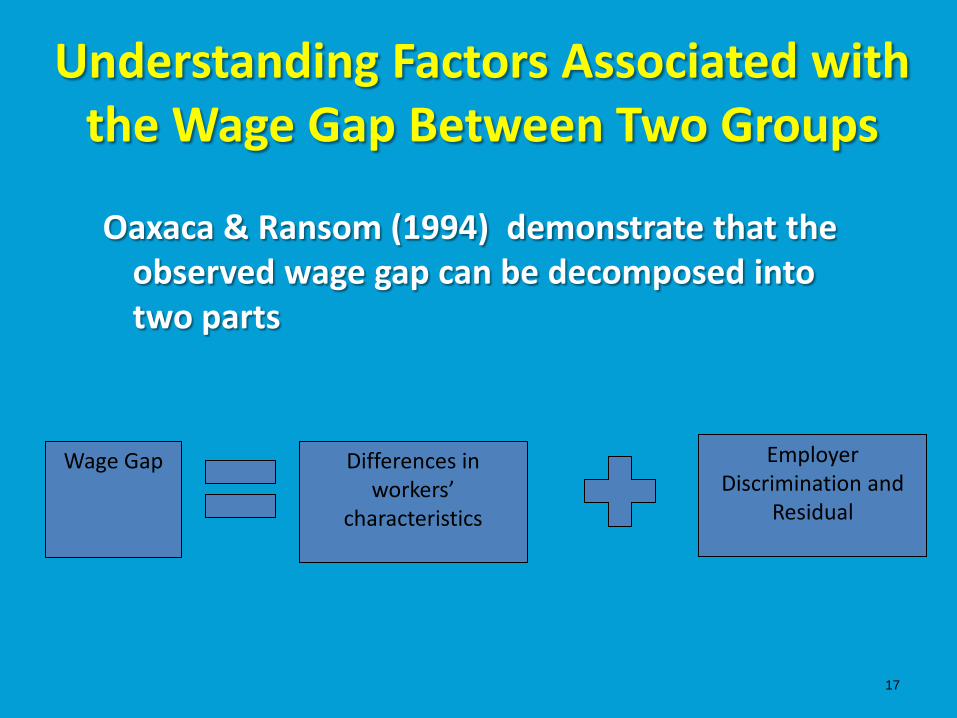
Understanding Factors Associated with the Wage Gap Between Two Groups
17
Oaxaca & Ransom (1994) demonstrate that the observed wage gap can be decomposed into two parts
Wage Gap Differences in workers’
characteristics
Employer Discrimination and
Residual
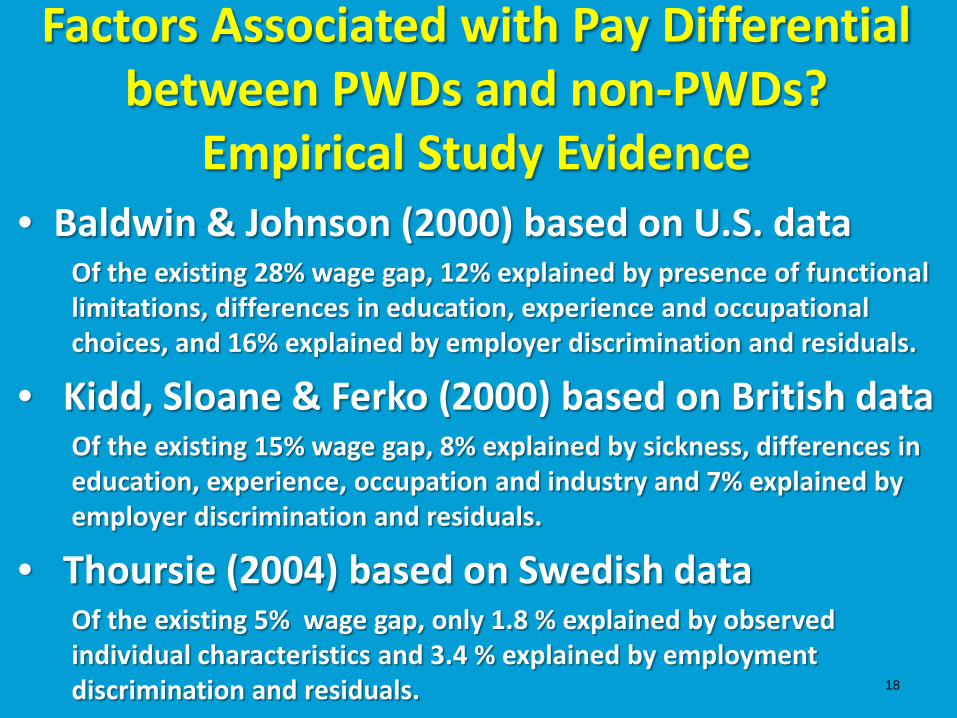
Factors Associated with Pay Differential between PWDs and non-PWDs?
Empirical Study Evidence
18
• Baldwin & Johnson (2000) based on U.S. data Of the existing 28% wage gap, 12% explained by presence of functional limitations, differences in education, experience and occupational choices, and 16% explained by employer discrimination and residuals.
• Kidd, Sloane & Ferko (2000) based on British data Of the existing 15% wage gap, 8% explained by sickness, differences in education, experience, occupation and industry and 7% explained by employer discrimination and residuals.
• Thoursie (2004) based on Swedish data Of the existing 5% wage gap, only 1.8 % explained by observed individual characteristics and 3.4 % explained by employment discrimination and residuals.

U.S. Disability Programs for PWDs
19
In the U.S., two major welfare programs provide cash and health care benefits (Medicare & Medicaid) to PWDs
• Supplemental Security Income
SSI makes cash assistance payments to aged, blind and disabled people (including children under age 18) who have limited income and resources
• Social Security Disability Insurance
SSDI provides benefits to disabled or blind individuals who contributed to the Social Security trust fund (FICA)
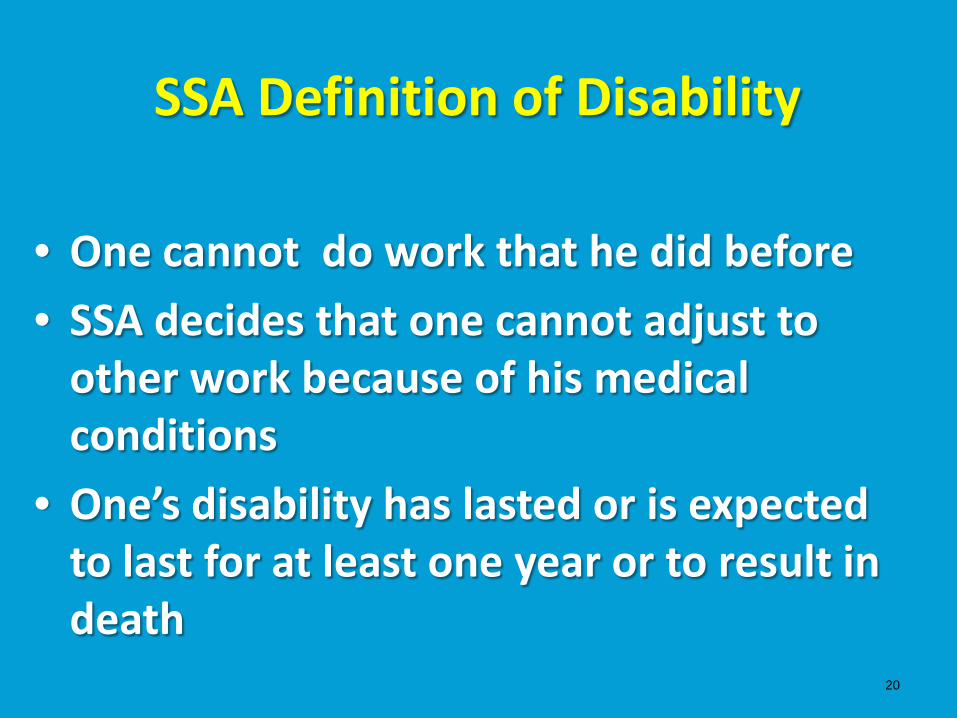
SSA Definition of Disability
20
• One cannot do work that he did before
• SSA decides that one cannot adjust to other work because of his medical conditions
• One’s disability has lasted or is expected to last for at least one year or to result in death
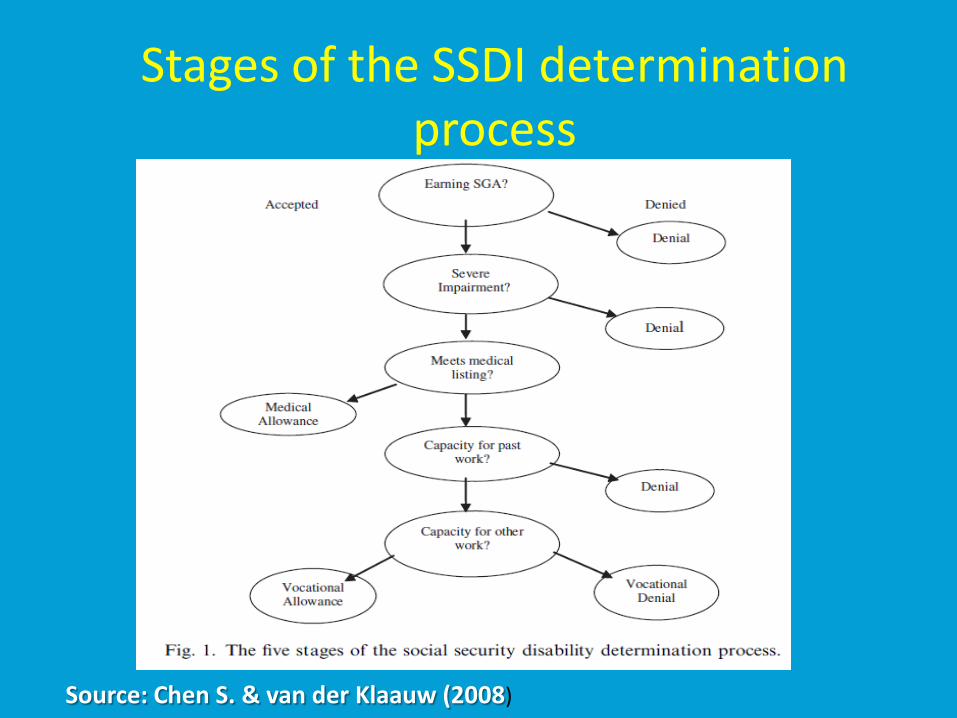
Stages of the SSDI determination process
Source: Chen S. & van der Klaauw (2008)
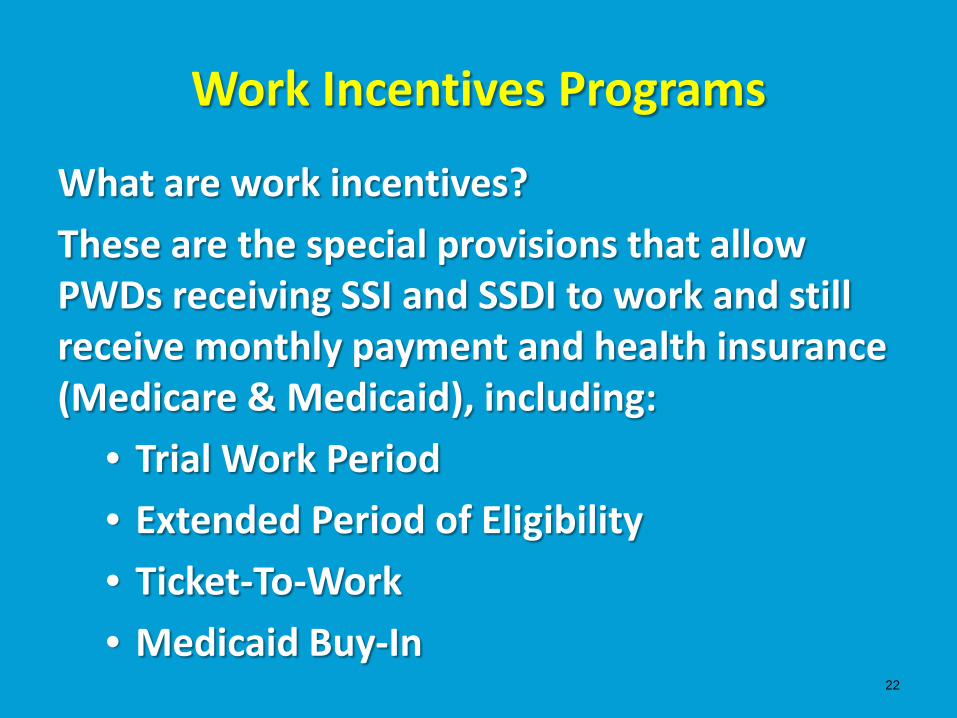
Work Incentives Programs
22
What are work incentives?
These are the special provisions that allow PWDs receiving SSI and SSDI to work and still receive monthly payment and health insurance (Medicare & Medicaid), including:
• Trial Work Period
• Extended Period of Eligibility
• Ticket-To-Work
• Medicaid Buy-In

Trial Work Period (TPW) • Allows SSDI beneficiaries to work for up to 9
months while continuing to receive full SSDI cash benefits.
• Any month in which countable earnings exceed the Substantial Gainful Activity (SGA) level will be counted as a month of work. In 2011 the SGA level for persons who are blind was USD 1,640/month, compared to USD 1,000/month for other disabled.
• TPW ends when a beneficiary have achieved 9 months of work within a rolling 60-month window. 23
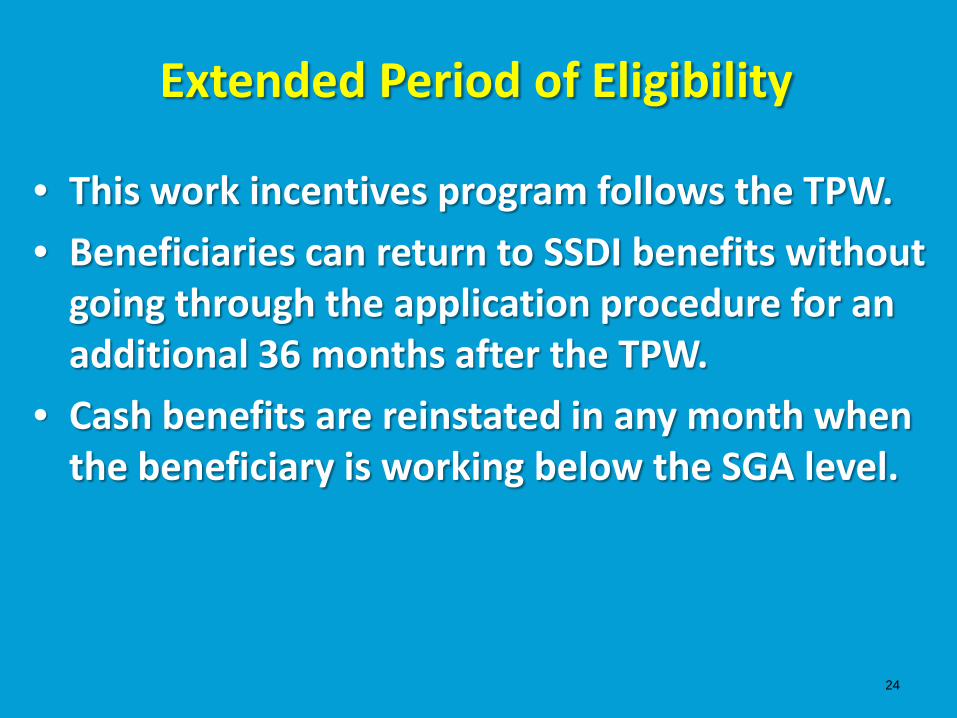
Extended Period of Eligibility
• This work incentives program follows the TPW.
• Beneficiaries can return to SSDI benefits without going through the application procedure for an additional 36 months after the TPW.
• Cash benefits are reinstated in any month when the beneficiary is working below the SGA level.
24

Ticket-to-Work
• This work incentives program provides both SSI and SSDI beneficiaries a ticket that they may exchange for employment services.
• Employment services are offered by an employment network (EN) or state vocational rehabilitation agency (SVRA).
• Employment services include job readiness, placement, job coaching and training.
25
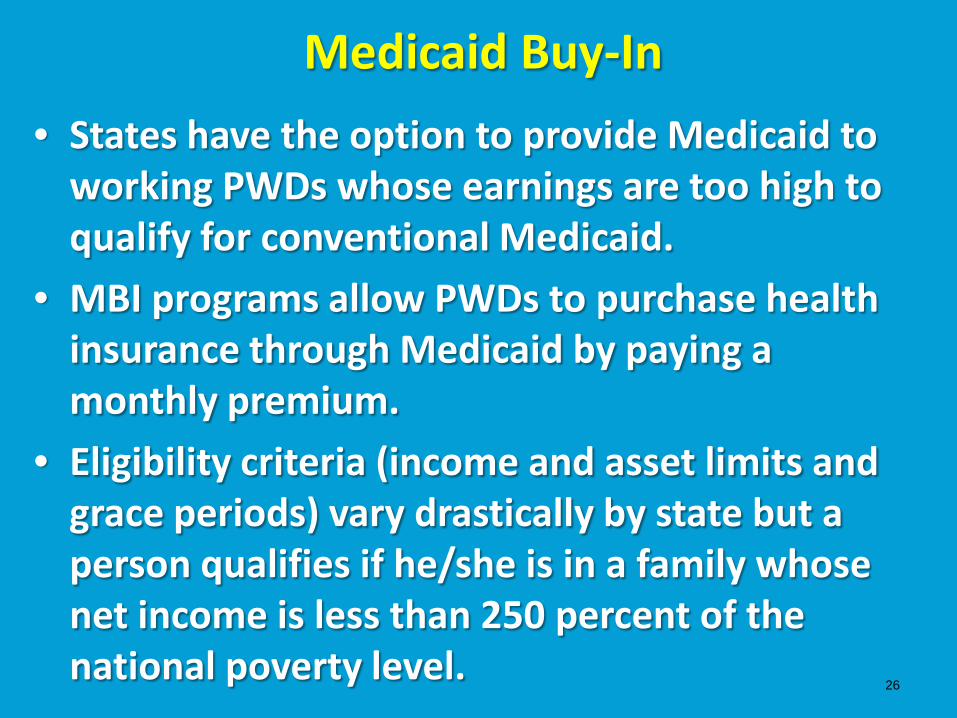
Medicaid Buy-In
• States have the option to provide Medicaid to working PWDs whose earnings are too high to qualify for conventional Medicaid.
• MBI programs allow PWDs to purchase health insurance through Medicaid by paying a monthly premium.
• Eligibility criteria (income and asset limits and grace periods) vary drastically by state but a person qualifies if he/she is in a family whose net income is less than 250 percent of the national poverty level.
26
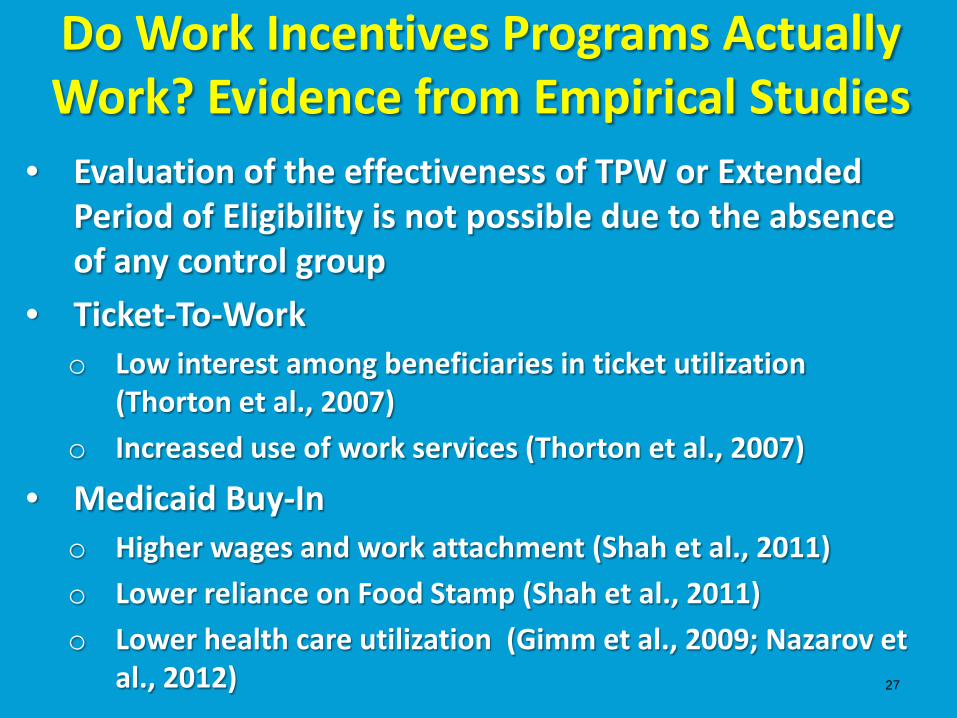
Do Work Incentives Programs Actually Work? Evidence from Empirical Studies
27
• Evaluation of the effectiveness of TPW or Extended Period of Eligibility is not possible due to the absence of any control group
• Ticket-To-Work o Low interest among beneficiaries in ticket utilization
(Thorton et al., 2007)
o Increased use of work services (Thorton et al., 2007)
• Medicaid Buy-In o Higher wages and work attachment (Shah et al., 2011)
o Lower reliance on Food Stamp (Shah et al., 2011)
o Lower health care utilization (Gimm et al., 2009; Nazarov et al., 2012)
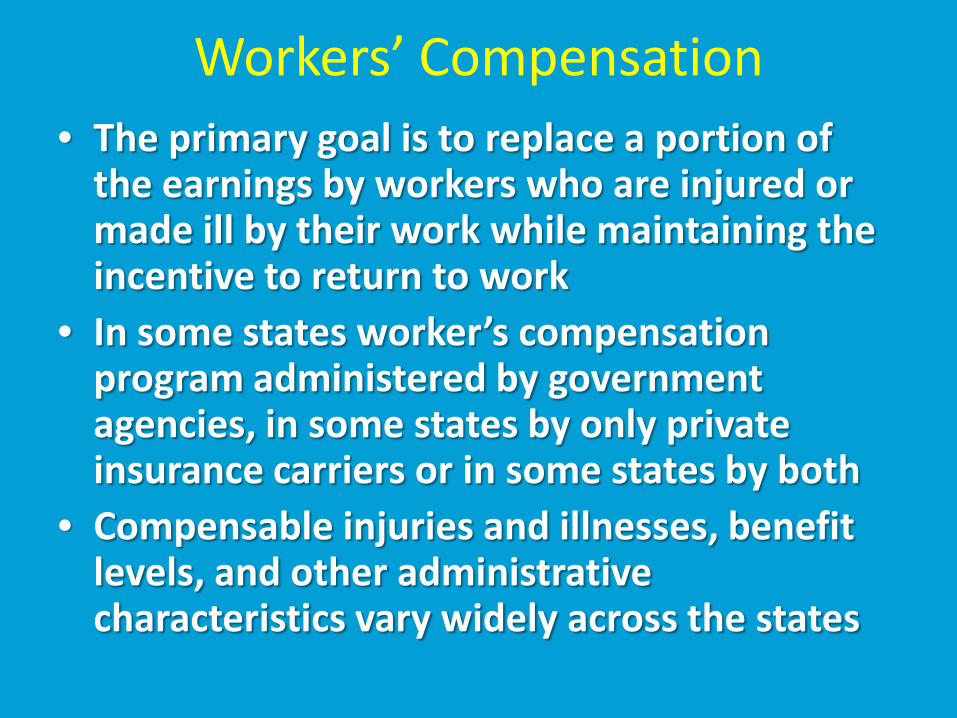
Workers’ Compensation • The primary goal is to replace a portion of
the earnings by workers who are injured or made ill by their work while maintaining the incentive to return to work
• In some states worker’s compensation program administered by government agencies, in some states by only private insurance carriers or in some states by both
• Compensable injuries and illnesses, benefit levels, and other administrative characteristics vary widely across the states
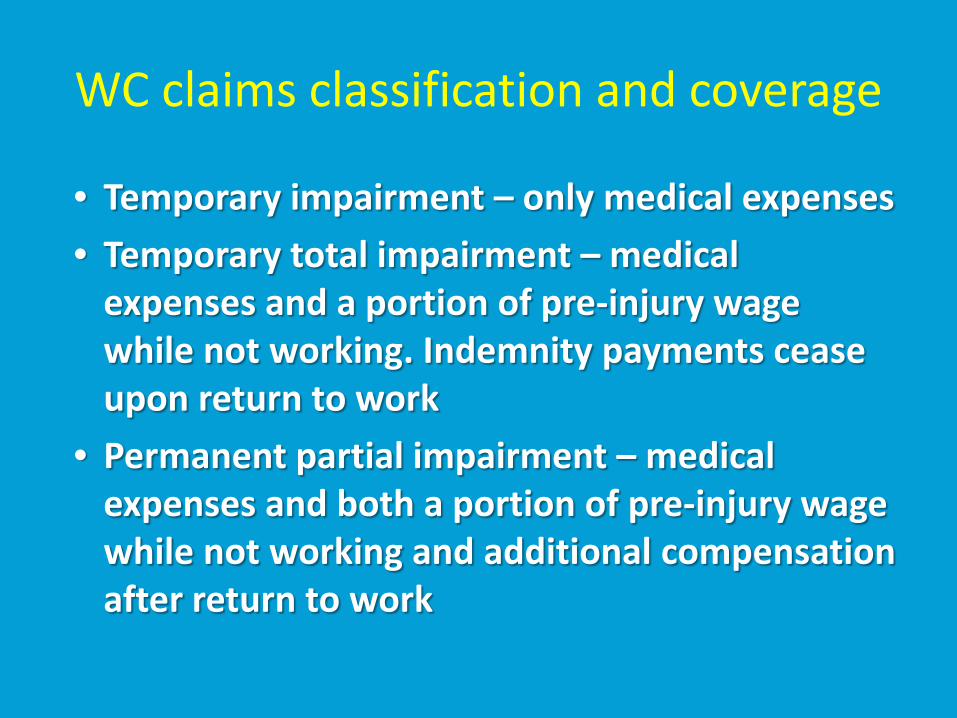
WC claims classification and coverage
• Temporary impairment – only medical expenses
• Temporary total impairment – medical expenses and a portion of pre-injury wage while not working. Indemnity payments cease upon return to work
• Permanent partial impairment – medical expenses and both a portion of pre-injury wage while not working and additional compensation after return to work

Work absence and WC benefits
• Duration of work absence depends on severity of injury, temporary total impairment benefits (TTB), permanent partial impairment benefits (PPB), and earnings after return to work (E) – Moderate severity
• Unambiguous positive effect on the duration of work absence
– High severity • If TTB-PPB-E>0, then positive effect on the duration of
work absence
• If TTB-PPB-E<0, then negative effect on duration of work absence
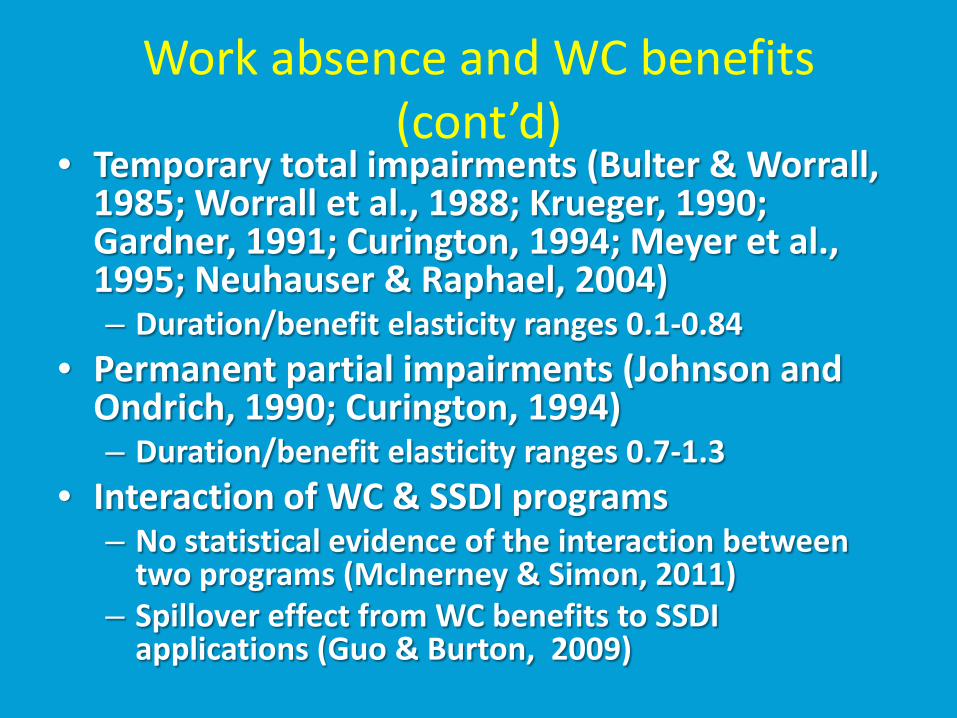
Work absence and WC benefits (cont’d)
• Temporary total impairments (Bulter & Worrall, 1985; Worrall et al., 1988; Krueger, 1990; Gardner, 1991; Curington, 1994; Meyer et al., 1995; Neuhauser & Raphael, 2004) – Duration/benefit elasticity ranges 0.1-0.84
• Permanent partial impairments (Johnson and Ondrich, 1990; Curington, 1994) – Duration/benefit elasticity ranges 0.7-1.3
• Interaction of WC & SSDI programs – No statistical evidence of the interaction between
two programs (McInerney & Simon, 2011) – Spillover effect from WC benefits to SSDI
applications (Guo & Burton, 2009)
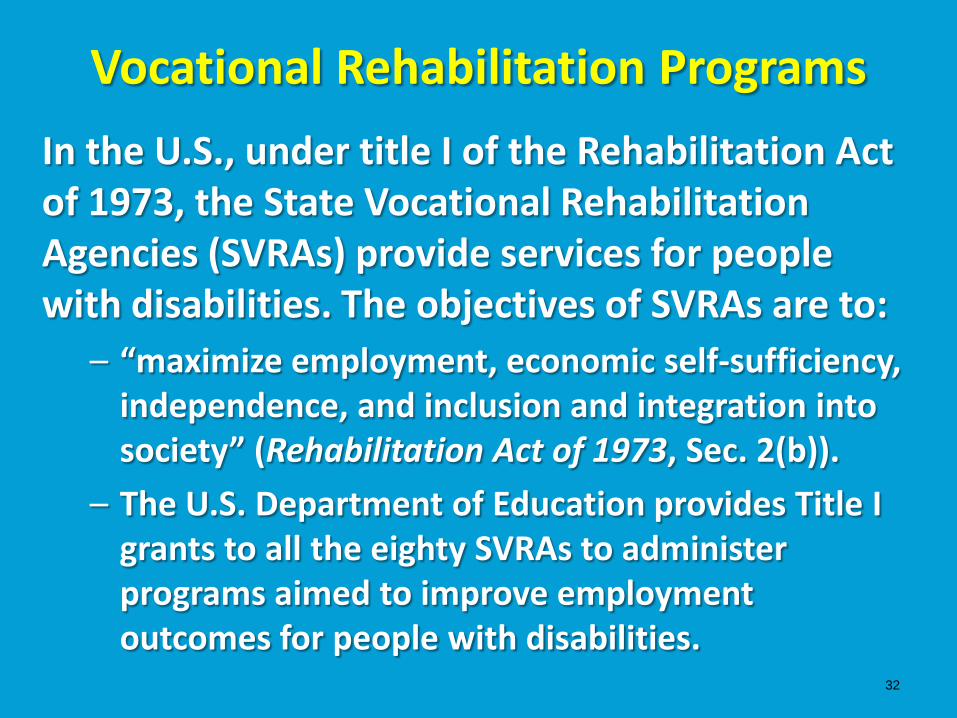
Vocational Rehabilitation Programs
32
In the U.S., under title I of the Rehabilitation Act of 1973, the State Vocational Rehabilitation Agencies (SVRAs) provide services for people with disabilities. The objectives of SVRAs are to:
– “maximize employment, economic self-sufficiency, independence, and inclusion and integration into society” (Rehabilitation Act of 1973, Sec. 2(b)).
– The U.S. Department of Education provides Title I grants to all the eighty SVRAs to administer programs aimed to improve employment outcomes for people with disabilities.
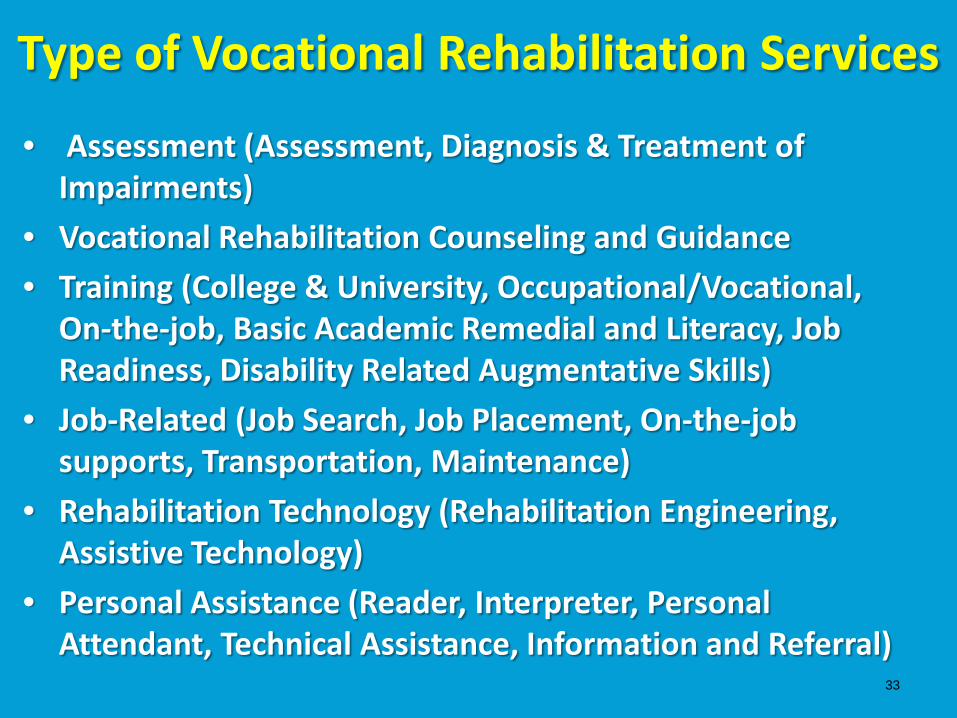
Type of Vocational Rehabilitation Services
33
• Assessment (Assessment, Diagnosis & Treatment of Impairments)
• Vocational Rehabilitation Counseling and Guidance
• Training (College & University, Occupational/Vocational, On-the-job, Basic Academic Remedial and Literacy, Job Readiness, Disability Related Augmentative Skills)
• Job-Related (Job Search, Job Placement, On-the-job supports, Transportation, Maintenance)
• Rehabilitation Technology (Rehabilitation Engineering, Assistive Technology)
• Personal Assistance (Reader, Interpreter, Personal Attendant, Technical Assistance, Information and Referral)
Do VR Services Improve Labor Market Outcomes of PWDs?
Empirical Study Evidence
34
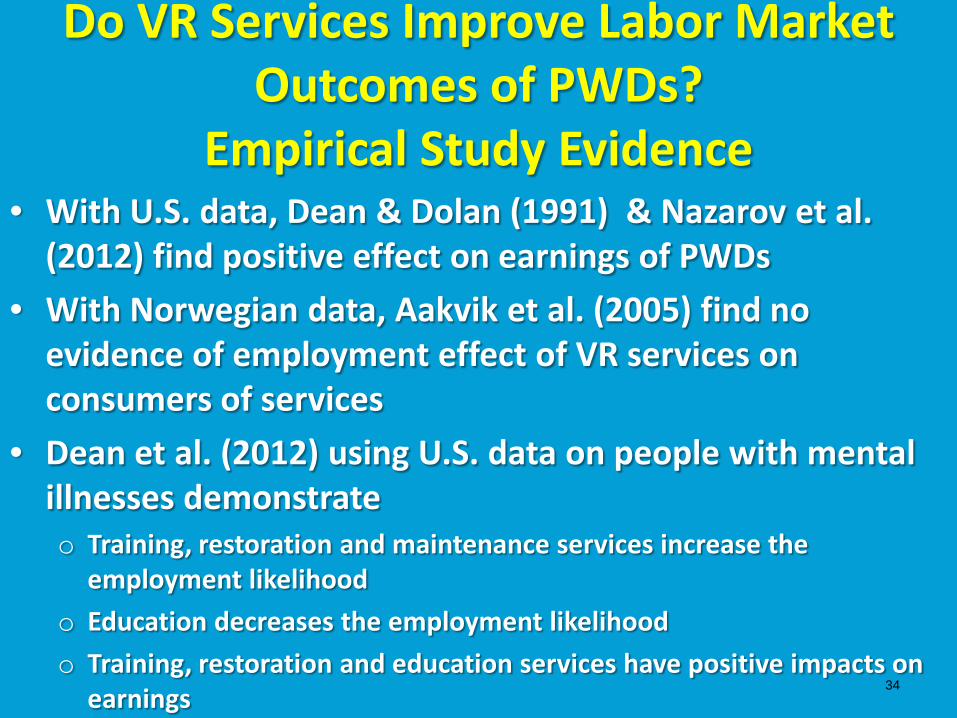
• With U.S. data, Dean & Dolan (1991) & Nazarov et al. (2012) find positive effect on earnings of PWDs
• With Norwegian data, Aakvik et al. (2005) find no evidence of employment effect of VR services on consumers of services
• Dean et al. (2012) using U.S. data on people with mental illnesses demonstrate o Training, restoration and maintenance services increase the
employment likelihood
o Education decreases the employment likelihood
o Training, restoration and education services have positive impacts on earnings
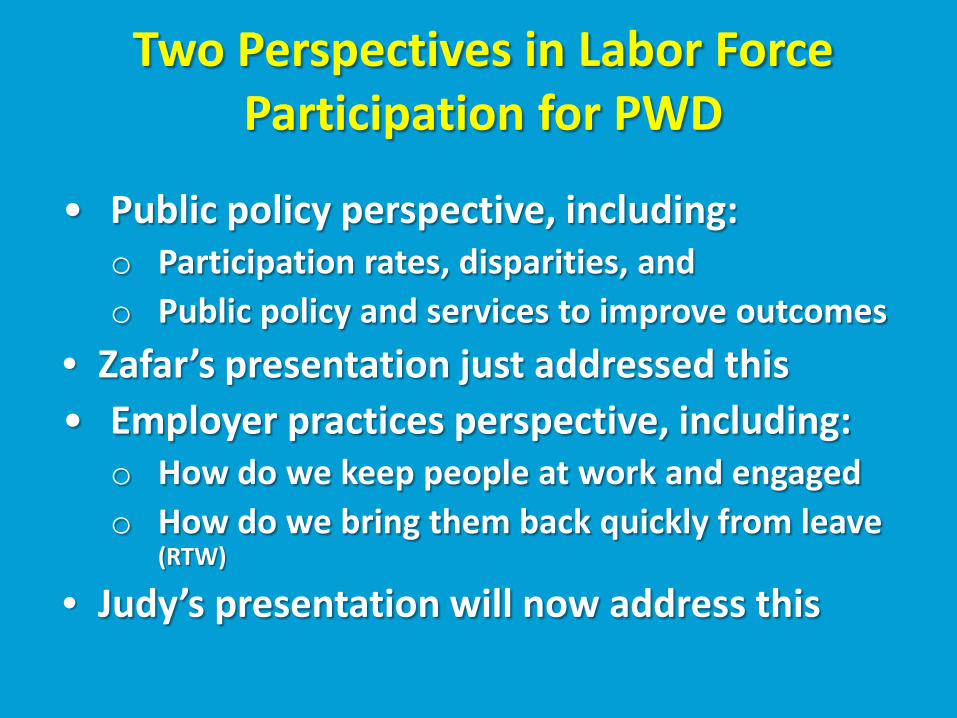
Two Perspectives in Labor Force Participation for PWD
• Public policy perspective, including: o Participation rates, disparities, and o Public policy and services to improve outcomes
• Zafar’s presentation just addressed this • Employer practices perspective, including:
o How do we keep people at work and engaged o How do we bring them back quickly from leave
(RTW)
• Judy’s presentation will now address this

Return to Work: Principles and Best Practices – Judy Young
May 7 – 11, 2012 Washington, D.C.
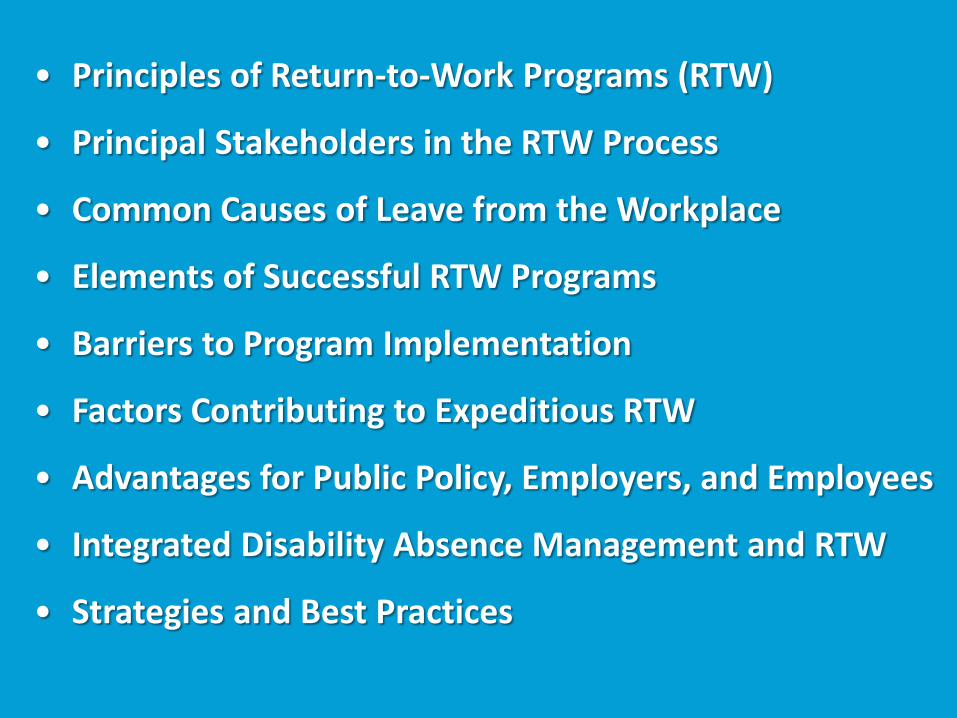
• Principles of Return-to-Work Programs (RTW)
• Principal Stakeholders in the RTW Process
• Common Causes of Leave from the Workplace
• Elements of Successful RTW Programs
• Barriers to Program Implementation
• Factors Contributing to Expeditious RTW
• Advantages for Public Policy, Employers, and Employees
• Integrated Disability Absence Management and RTW
• Strategies and Best Practices
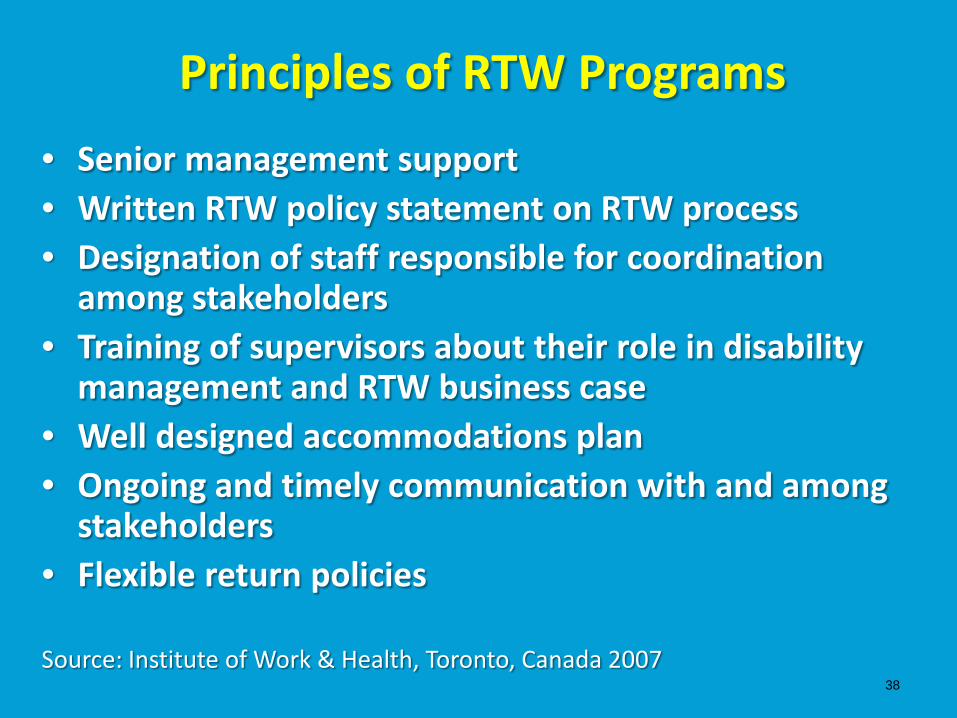
Principles of RTW Programs
• Senior management support • Written RTW policy statement on RTW process • Designation of staff responsible for coordination
among stakeholders • Training of supervisors about their role in disability
management and RTW business case • Well designed accommodations plan • Ongoing and timely communication with and among
stakeholders • Flexible return policies
Source: Institute of Work & Health, Toronto, Canada 2007
38

Principal Stakeholders
• Employee • Supervisor/managers • Human Resources • Disability Management Coordinator • Healthcare provider(s) • Insurance carrier • Safety and risk management • Union representative (where applicable)
39
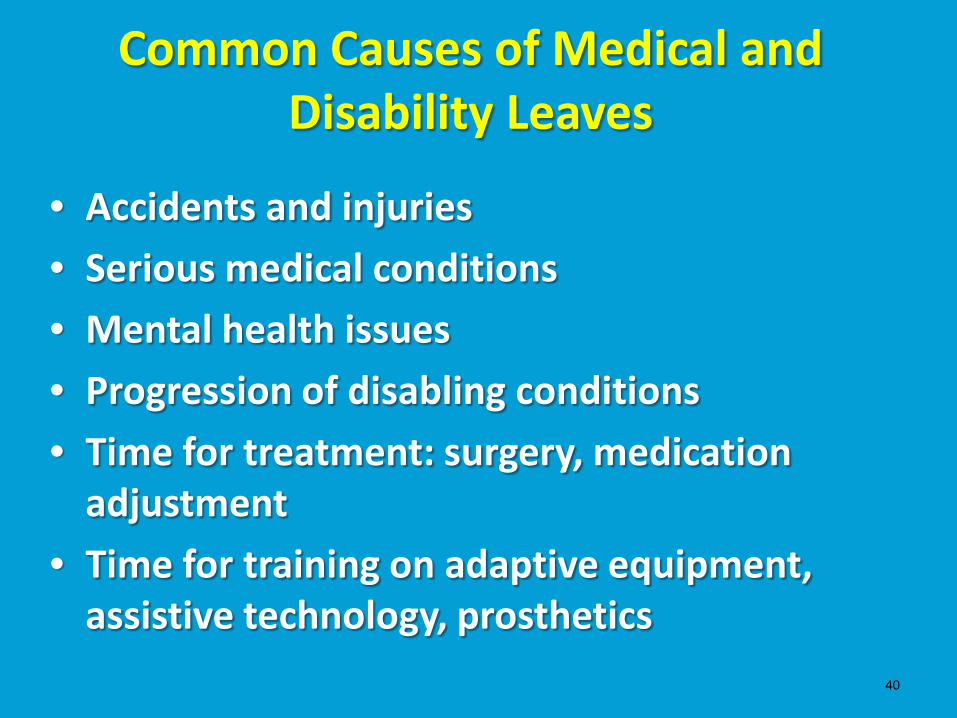
Common Causes of Medical and Disability Leaves
• Accidents and injuries
• Serious medical conditions
• Mental health issues
• Progression of disabling conditions
• Time for treatment: surgery, medication adjustment
• Time for training on adaptive equipment, assistive technology, prosthetics
40
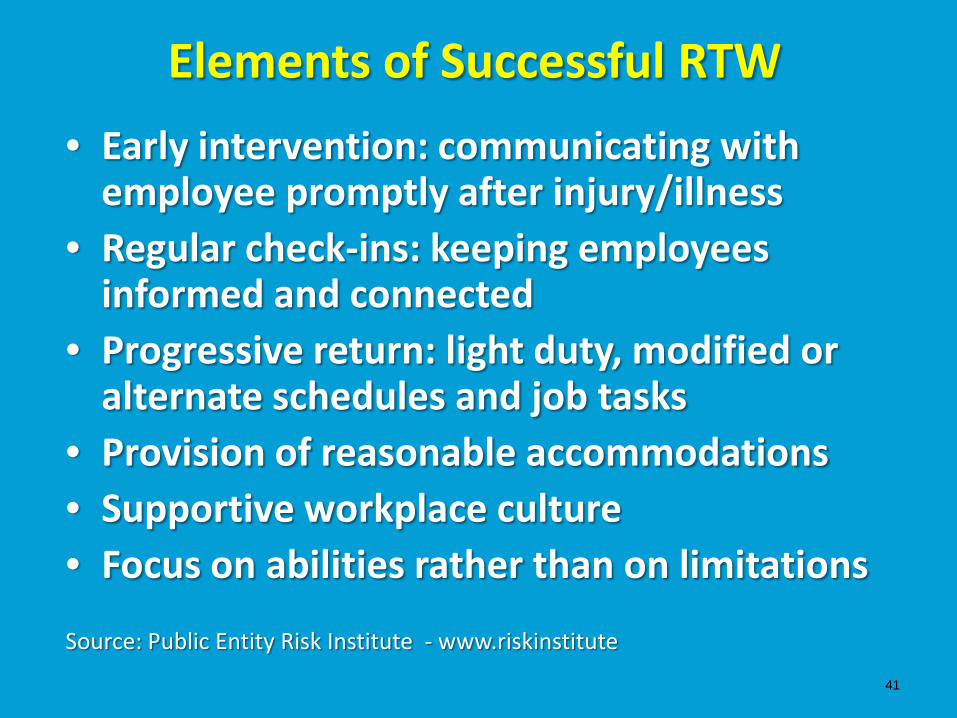
Elements of Successful RTW
• Early intervention: communicating with employee promptly after injury/illness
• Regular check-ins: keeping employees informed and connected
• Progressive return: light duty, modified or alternate schedules and job tasks
• Provision of reasonable accommodations • Supportive workplace culture • Focus on abilities rather than on limitations Source: Public Entity Risk Institute - www.riskinstitute
41
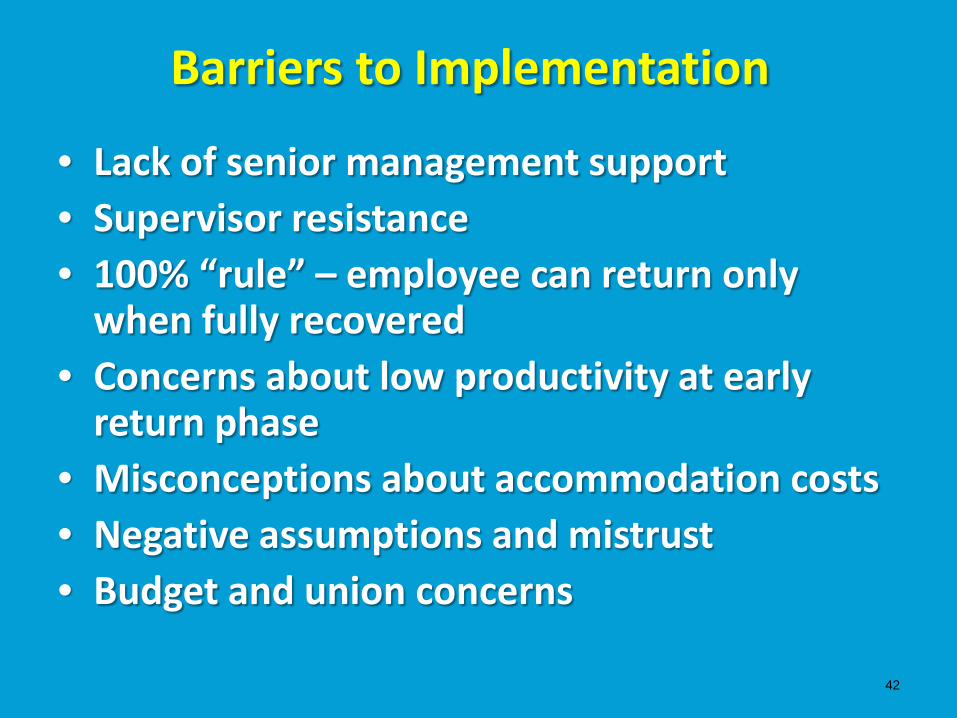
Barriers to Implementation
• Lack of senior management support • Supervisor resistance • 100% “rule” – employee can return only
when fully recovered • Concerns about low productivity at early
return phase • Misconceptions about accommodation costs • Negative assumptions and mistrust • Budget and union concerns
42

Factors Expediting RTW
• Ongoing contact with employee
• Development of a RTW plan in collaboration with all stakeholders
• Provision of training and resources for supervisors
• Analysis of current job and identification of alternative or modified duties
• Identification and procurement of reasonable accommodations in advance
• Modified work schedules to allow for treatment
43
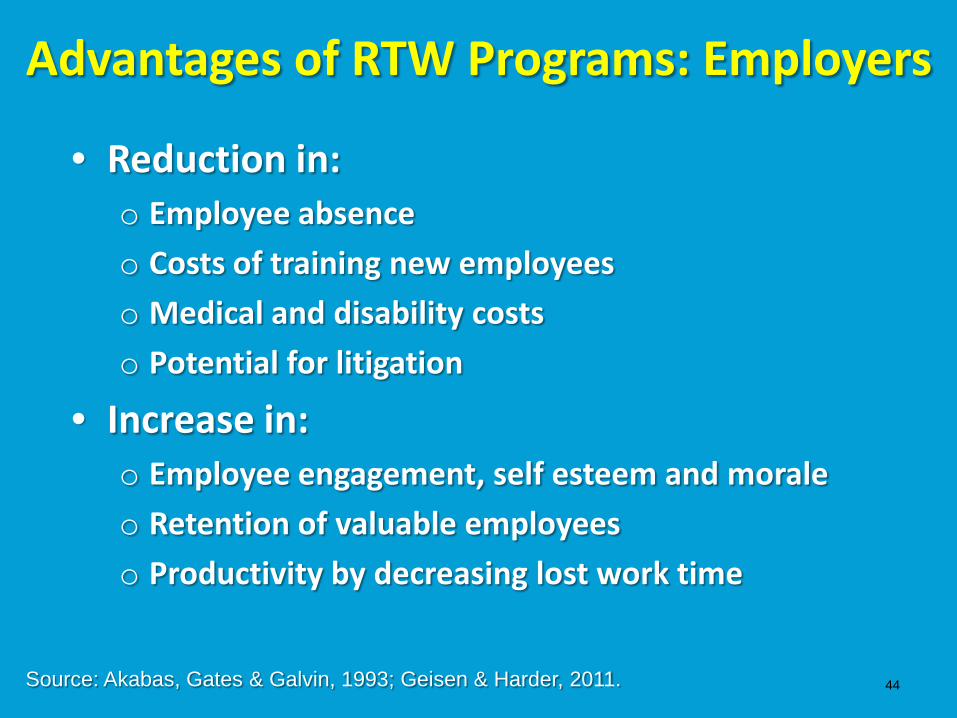
Advantages of RTW Programs: Employers
• Reduction in: o Employee absence
o Costs of training new employees
o Medical and disability costs
o Potential for litigation
• Increase in: o Employee engagement, self esteem and morale
o Retention of valuable employees
o Productivity by decreasing lost work time
44 Source: Akabas, Gates & Galvin, 1993; Geisen & Harder, 2011.

Advantages of RTW Programs: Public Policy
• Contributing to Social Security solvency by reduction in Disability Insurance payments
• Decreasing the need for healthcare services • Ensuring that the increasing numbers of older
workers can maintaining their productivity level • Reducing disability and age discrimination
complaints and lawsuits • Providing incentives for early return • Demonstrating the costs savings to public and
private insurance programs 45
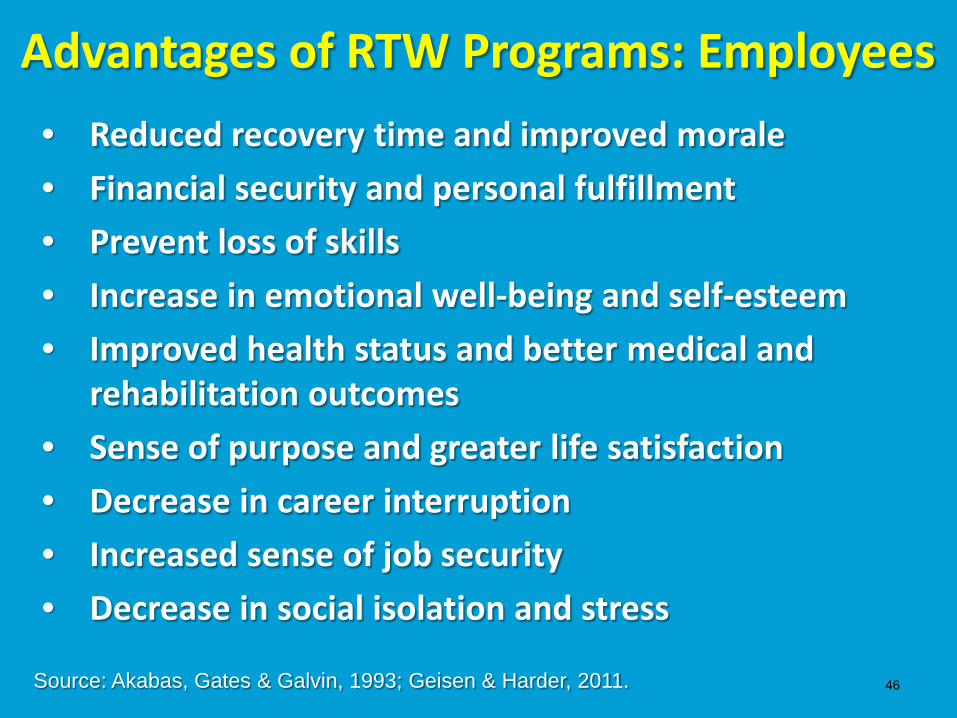
Advantages of RTW Programs: Employees
• Reduced recovery time and improved morale
• Financial security and personal fulfillment
• Prevent loss of skills
• Increase in emotional well-being and self-esteem
• Improved health status and better medical and rehabilitation outcomes
• Sense of purpose and greater life satisfaction
• Decrease in career interruption
• Increased sense of job security
• Decrease in social isolation and stress
46 Source: Akabas, Gates & Galvin, 1993; Geisen & Harder, 2011.
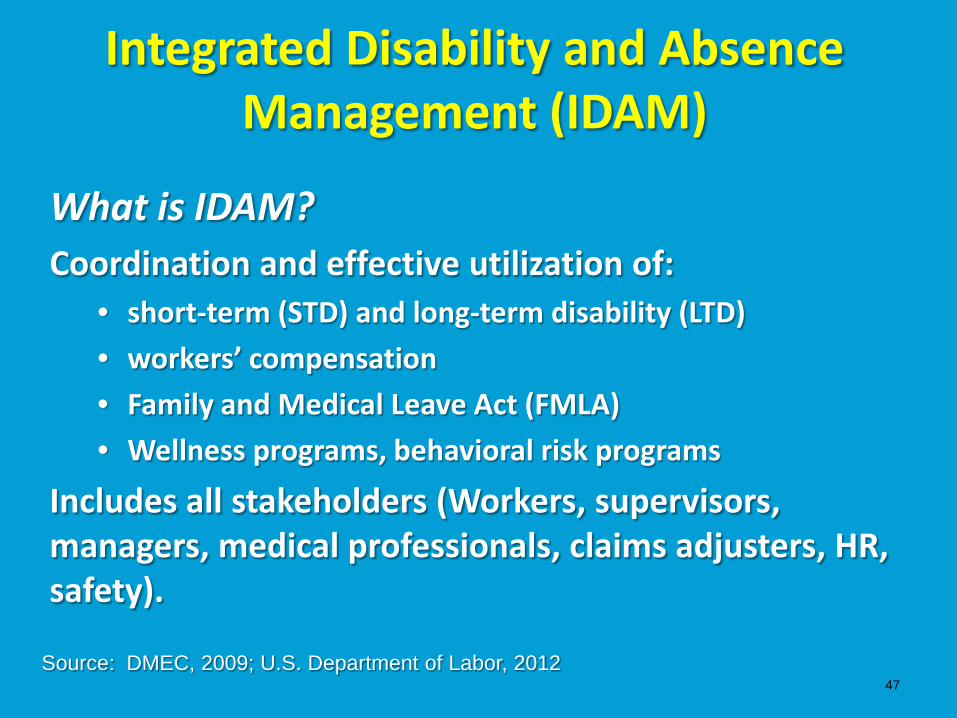
Integrated Disability and Absence Management (IDAM)
What is IDAM? Coordination and effective utilization of:
• short-term (STD) and long-term disability (LTD)
• workers’ compensation
• Family and Medical Leave Act (FMLA)
• Wellness programs, behavioral risk programs
Includes all stakeholders (Workers, supervisors, managers, medical professionals, claims adjusters, HR, safety).
47 Source: DMEC, 2009; U.S. Department of Labor, 2012
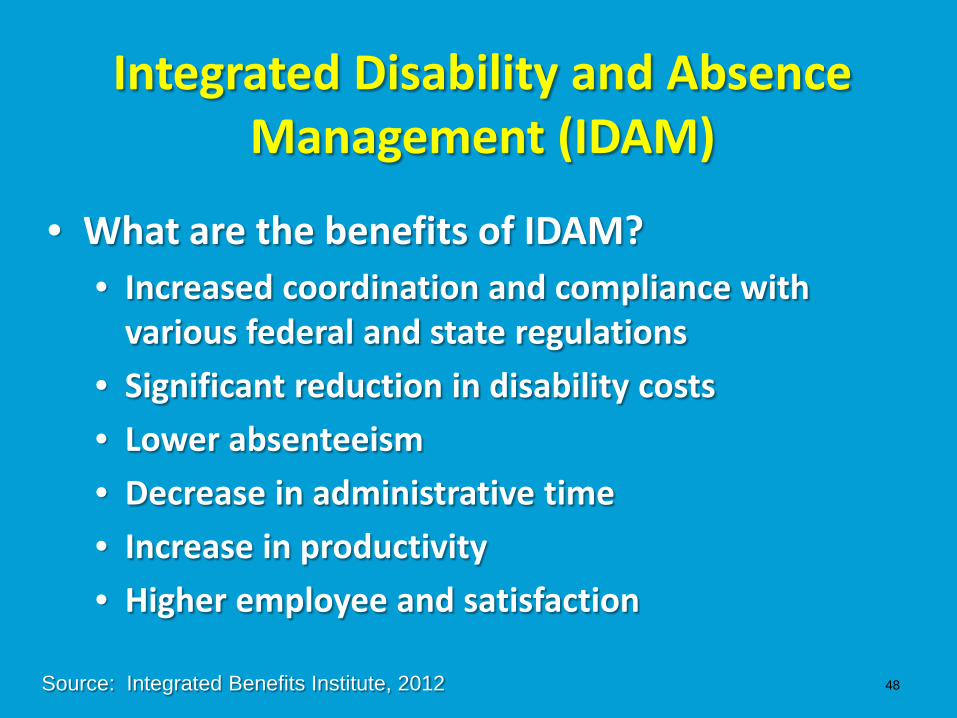
Integrated Disability and Absence Management (IDAM)
• What are the benefits of IDAM? • Increased coordination and compliance with
various federal and state regulations
• Significant reduction in disability costs
• Lower absenteeism
• Decrease in administrative time
• Increase in productivity
• Higher employee and satisfaction
48 Source: Integrated Benefits Institute, 2012
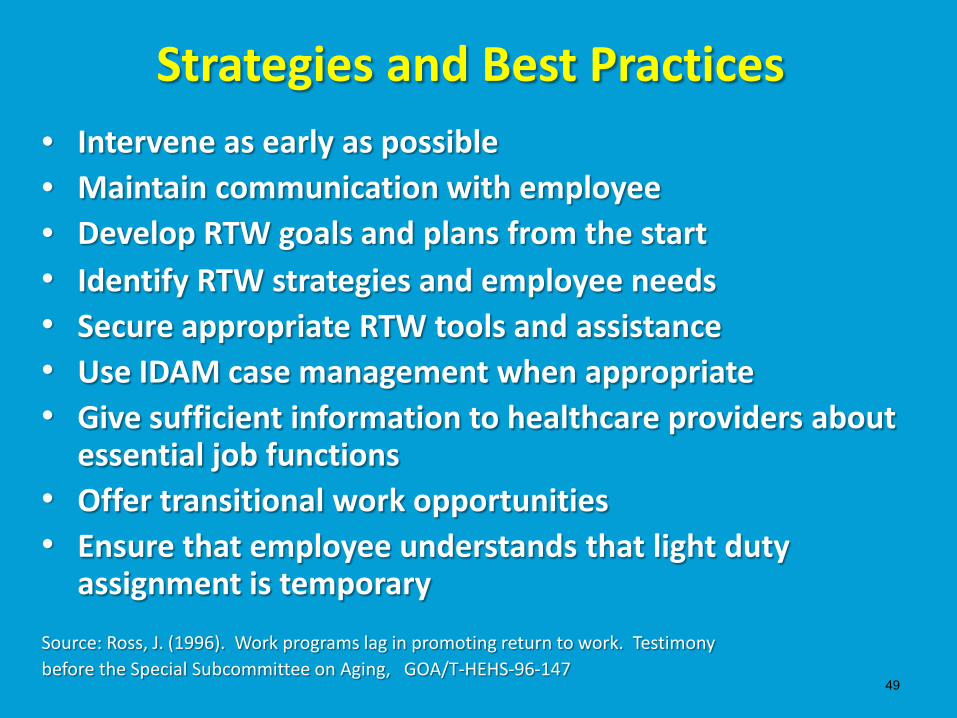
Strategies and Best Practices • Intervene as early as possible • Maintain communication with employee • Develop RTW goals and plans from the start • Identify RTW strategies and employee needs • Secure appropriate RTW tools and assistance • Use IDAM case management when appropriate • Give sufficient information to healthcare providers about
essential job functions • Offer transitional work opportunities • Ensure that employee understands that light duty
assignment is temporary Source: Ross, J. (1996). Work programs lag in promoting return to work. Testimony before the Special Subcommittee on Aging, GOA/T-HEHS-96-147
49

Related Resources
May 7 – 11, 2012 Washington, D.C.
• 2009 U.S. Disability Status Report - www.disabilitystatistics.org
• Ask EARN - www.askEARN.org
• HR (human resources) Tips – www.hrtips.org
• Cornell Employment and Disability Institute publications online - http://digitalcommons.ilr.cornell.edu/
• Employment and Disability Institute at Cornell University - www.ilr.cornell.edu/edi/
• Disability Management Employers Coalition - www.dmec.org
References Akabas, S., Gates, L., & Galvin, D. (1993). Disability management: A complete system to reduce costs,
increase productivity, meet employee needs, and ensure legal compliance. New York: AMACOM.
Bruyère , S., von Schrader, S., Coduti, W., & Bjelland, M. (2011). United States employment disability discrimination charges: Implications for disability management practice. International Journal of Disability Management Research, 5(2), 48-58.
Disability Management Employer Coalition (DMEC). (2009). A compilation of programs and processes for the absence, disability, health, and productivity professional. San Diego, CA: Author.
Disability Management Employer Coalition (DMEC). (2010). Foundation for optimal productivity: The complete return to work program manual. San Diego, CA: Author.
Geisen, T. & Harder, H. (Eds.) (2011). Disability management and workplace integration: International research findings. Farnham, UK: Gower Publishing.
Integrated Benefits Institute. (2012). Understanding Integration: The Bottom Line. Retrieved from http://www.ibiweb.org/do/PublicAccess?documentId=765&linkId=37900
Institute for Work & Health. (2007). Seven principles for successful return to work. Toronto, Canada: Author. Retrieved from http://www.iwh.on.ca/seven-principles-for-rtw
Ross, J. (1996). Work programs lag in promoting return to work. Testimony
before the Special Subcommittee on Aging. GOA/T-HEHS-96-147. Washington DC: Government Printing Office.
U.S. Department of Labor. (2012). Return to work: Integrated Disability and Absence Mangement. Retrieved from the Office of Disability Employment Policy Return to Work Toolkit: http://www.dol.gov/odep/return-to-work/employer-mgmt.htm 52


![Genetically Modified Crops, Inclusion, and Democracyphilsci-archive.pitt.edu/12584/1/Young.pdf · The public controversy over genetically modified [GM] crops is predominantly framed](https://img.pdfslide.net/doc/110x75/5f75f61b2853de19b035cf2c/genetically-modified-crops-inclusion-and-democracyphilsci-the-public-controversy.jpg)