Embed Size (px)
Citation preview
Mohegan Sun Casino & Foxwoods Resort
Casino: Potential Impact of Gaming Expansion
in Massachusetts & New York
Submitted to: Mohegan Tribal Gaming Authority & Mashantucket Pequot Gaming Enterprise
Submitted by: Pyramid Associates, LLC
Contact:
Clyde Barrow, Ph.D.
Pyramid Associates, LLC
151 State Road, Suite 4
Westport, MA 02790
978-340-6234 (phone)
March 2015

Revenue Displacement & Negative Economic Impacts
Report Submitted to MTGA & MPGE
i
Executive Summary
Pyramid Associates, LLC (“Pyramid”) was commissioned by The Mohegan Tribal Gaming
Authority & Mashantucket Pequot Gaming Enterprise to conduct a revenue displacement (market
impact) analysis and an estimate of potential employment and revenue losses to the State of
Connecticut that will occur as the result of competition from new casinos in Massachusetts and New
York. The commissioned work includes:
an estimate of the potential gaming market for the proposed resort casinos and slot parlor in
New York and Massachusetts based on a custom designed gravity model that incorporates
adult population (age 21+), disposable personal income (DPI), and the estimated propensity
to gamble within primary (60 minute drive), secondary (61-120 minute drive), and tertiary
(121-150 minute drive) market areas, including a tourism and out-of-market factor. The
gravity model incorporates all relevant market areas in New York and the six New England
states,
an estimate of annual gross gaming revenue at planned new gaming venues in
Massachusetts and New York (by slot machines and table games) from Fiscal Year 2016
through Fiscal Year 2021,1
an estimate non-gaming revenue (itemized by hotel, food and beverage, retail and
entertainment), and gross revenue (gaming + non-gaming revenue) at planned new gaming
venues in Massachusetts and New York from Fiscal Year 2016 through Fiscal Year 2021.2
Estimates will be based on project and facility specifications made public by the proposed
casino’s developers and owners,
an estimate of the amount of gaming and non-gaming revenues that will be displaced or
captured from Mohegan Sun Casino and Foxwoods Resort Casino by each of the planned
new gaming facilities in the market area on an annual basis over a six year period (FY 2016-
FY 2021). The planned new gaming facilities that will potentially impact the two Connecticut
casino’s revenues are MGM Springfield (Massachusetts), Wynn Everett Casino
(Massachusetts), Montreign Resort & Casino (New York), and Rivers Casino & Resort (New
York).
an economic impact analysis that estimates potential annual losses in direct, indirect,
induced, and total jobs and wages (see Attachment 4) at Mohegan Sun Casino and Foxwoods
Resort Casino on an annual basis over a six year period (FY 2016-FY 2021) based on the
results of the revenue displacement analysis,
1 For purposes of this analysis the Company will rely on estimates submitted to the New York Gaming Facility
Location Board and the Massachusetts Gaming Commission as they have been deemed accurate by those regulatory
agencies and their expert consultants. 2 For purposes of this analysis the Company will rely on estimates submitted to the New York Gaming Facility
Location Board and the Massachusetts Gaming Commission as they have been deemed accurate by those regulatory
agencies and their expert consultants.
Revenue Displacement & Negative Economic Impacts
Report Submitted to MTGA & MPGE
ii
an estimate of the potential negative economic impacts of the planned resort casinos in New
York and Massachusetts on the regional economy (i.e., jobs, output, local purchases,
employee spending) and the State of Connecticut, including incremental impacts on job and
income loss, and business sectors where these losses will occur in the region and state, and
an estimate of lost revenue sharing by the State of Connecticut with Mohegan Sun Casino
and Foxwoods Resort Casino as a result of the displacement impacts of the authorized and
proposed resort casinos and slot parlor in New York and Massachusetts.
METHODOLOGY
The competitive impact and displacement analyses in this report are based on well-
established demand analysis techniques that are commonly utilized for forecasting revenues
at casinos in the United States. The analysis and conclusions are derived from a custom
designed gravity model that incorporates public secondary data sources for population (U.S.
Census), disposable personal income (U.S. Bureau of Economic Analysis), and drive times
between different locations (MS MapPoint).
A Master Database consisting of 2,620 communities in Connecticut, Maine, Massachusetts,
New Hampshire, New York, Rhode Island, and Vermont was built to analyze the gaming
market area for the Mohegan Sun Casino, Foxwoods Resort Casino, and the planned casinos
in Massachusetts and New York, including the latters’ potential displacement impact on the
Connecticut gaming facilities. The Master Database includes data by town and city on total
population, the adult population (age 21+), per capita income, total income, disposable
personal income (DPI), and drive times to each gaming facility in the six states included in
the database. Drive times are based on geocodes for the actual address of each gaming
facility. The initial Master Database contains 170,300 discrete data points.
ANALYSIS AND RESULTS
Using a custom designed gravity model for the New England/New York gaming market, the
competitive impact of the four planned resort casinos in Massachusetts and New York was
estimated for Mohegan Sun Casino and Foxwoods Resort Casino. The existing gaming facilities in
Connecticut have overlapping primary, secondary, and tertiary market areas with the four planned
casinos in Massachusetts and New York and will therefore compete with them directly for many of
the same customers:
It is estimated that at full build out and maturity in CY 2019, MGM Springfield will
capture a maximum of $159.3 million in gross gaming revenue (2014 dollars) from
Mohegan Sun Casino, which is a displacement of 18.9% of Mohegan Sun Casino’s
gross gaming revenue in CY 2019 absent new supply or other changes in the
Connecticut gaming market.
It is estimated that at full build out and maturity in CY 2019, MGM Springfield will
capture a maximum of $170.2 million in gross gaming revenue (2014 dollars) from
Foxwoods Resort Casino, which is a displacement of 24.6% of Foxwoods Resort
Revenue Displacement & Negative Economic Impacts
Report Submitted to MTGA & MPGE
iii
Casino’s gross gaming revenue in CY 2019 absent new supply or other changes in
the Connecticut gaming market.
It is estimated that at full build out and maturity in CY 2019, Wynn Everett will
capture a maximum of $103.7 million in gross gaming revenue (2014 dollars) from
Mohegan Sun Casino, which is a displacement of 12.3% of Mohegan Sun Casino’s
gross gaming revenue in CY 2019 absent new supply or other changes in the
Connecticut gaming market.
It is estimated that at full build out and maturity in CY 2019, Wynn Everett will
capture a maximum of $88.5 million in gross gaming revenue (2014 dollars) from
Foxwoods Resort Casino, which is a displacement of 12.8% of Foxwoods Resort
Casino’s gross gaming revenue in CY 2019 absent new supply or other changes in
the Connecticut gaming market.
It is estimated that at full build out and maturity in CY 2019, the Rivers Casino &
Resort will capture a maximum of $5.7 million in gross gaming revenue (2014
dollars) from Mohegan Sun Casino, which is a displacement of 0.7% of Mohegan Sun
Casino’s gross gaming revenue in CY 2019 absent new supply or other changes in
the Connecticut gaming market.3
It is estimated that at full build out and maturity in CY 2019, the Rivers Casino &
Resort will capture a maximum of $2.6 million in gross gaming revenue (2014
dollars) from Foxwoods Resort Casino, which is a displacement of 0.4% of Foxwoods
Resort Casino’s gross gaming revenue in CY 2019 absent new supply or other
changes in the Connecticut gaming market.
It is estimated that the combined competitive impact of the planned new casinos in
Massachusetts and New York will displace approximately $570.0 million in gross
gaming revenue from Mohegan Sun Casino and Foxwoods Resort Casino by CY
2019, the first full fiscal year of stabilized operations for four casinos modeled in this
analysis.
It is further estimated that the combined competitive impact of the planned new
casinos in Massachusetts and New York will displace approximately $132.7 million
in non-gaming revenue at Connecticut’s two casinos, including $39.1 million in lost
food and beverage sales, $26.5 million in lost hotel revenue, and $67.0 million in lost
retail, entertainment, and other revenue.
3 Rivers Casino & Resort’s impact on Mohegan Sun Casino and Foxwoods Resort Casino is the result of capturing customers from
the Greater Albany, New York area.
Revenue Displacement & Negative Economic Impacts
Report Submitted to MTGA & MPGE
iv
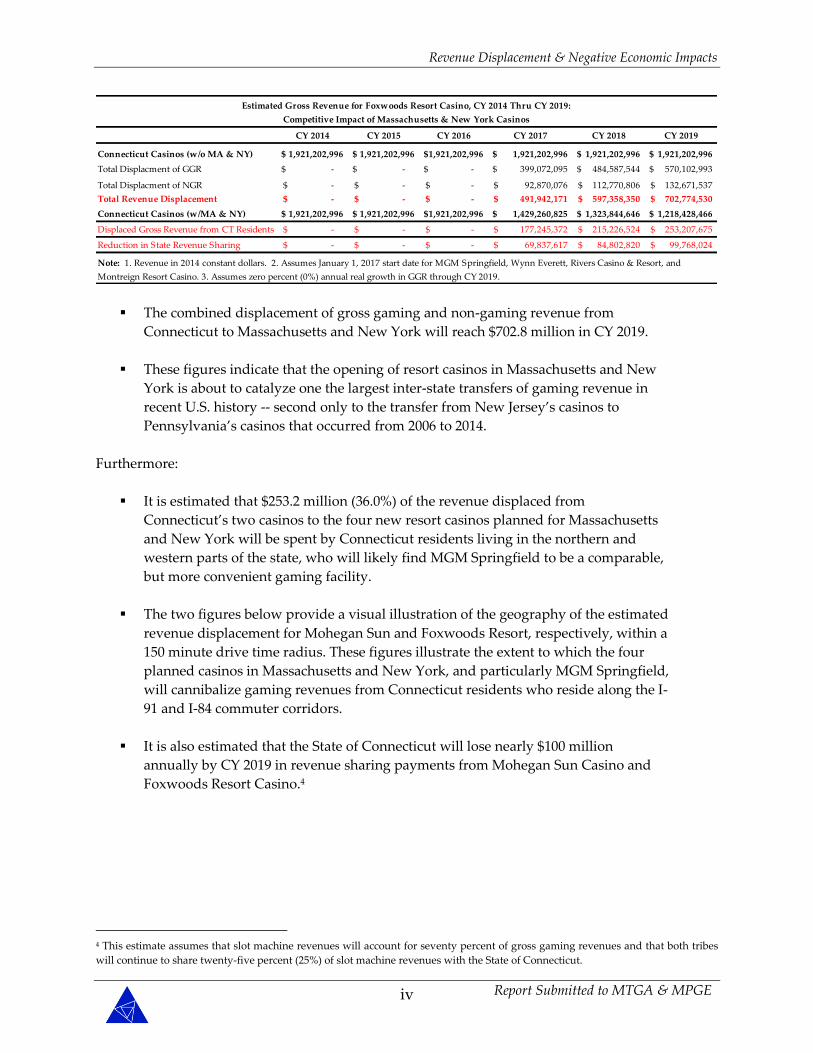
CY 2014 CY 2015 CY 2016 CY 2017 CY 2018 CY 2019
Connecticut Casinos (w/o MA & NY) 1,921,202,996$ 1,921,202,996$ 1,921,202,996$ 1,921,202,996$ 1,921,202,996$ 1,921,202,996$
Total Displacment of GGR -$ -$ -$ 399,072,095$ 484,587,544$ 570,102,993$
Total Displacment of NGR -$ -$ -$ 92,870,076$ 112,770,806$ 132,671,537$
Total Revenue Displacement -$ -$ -$ 491,942,171$ 597,358,350$ 702,774,530$
Connecticut Casinos (w/MA & NY) 1,921,202,996$ 1,921,202,996$ 1,921,202,996$ 1,429,260,825$ 1,323,844,646$ 1,218,428,466$
Displaced Gross Revenue from CT Residents -$ -$ -$ 177,245,372$ 215,226,524$ 253,207,675$
Reduction in State Revenue Sharing -$ -$ -$ 69,837,617$ 84,802,820$ 99,768,024$
Estimated Gross Revenue for Foxwoods Resort Casino, CY 2014 Thru CY 2019:
Competitive Impact of Massachusetts & New York Casinos
Note: 1. Revenue in 2014 constant dollars. 2. Assumes January 1, 2017 start date for MGM Springfield, Wynn Everett, Rivers Casino & Resort, and
Montreign Resort Casino. 3. Assumes zero percent (0%) annual real growth in GGR through CY 2019.
The combined displacement of gross gaming and non-gaming revenue from
Connecticut to Massachusetts and New York will reach $702.8 million in CY 2019.
These figures indicate that the opening of resort casinos in Massachusetts and New
York is about to catalyze one the largest inter-state transfers of gaming revenue in
recent U.S. history -- second only to the transfer from New Jersey’s casinos to
Pennsylvania’s casinos that occurred from 2006 to 2014.
Furthermore:
It is estimated that $253.2 million (36.0%) of the revenue displaced from
Connecticut’s two casinos to the four new resort casinos planned for Massachusetts
and New York will be spent by Connecticut residents living in the northern and
western parts of the state, who will likely find MGM Springfield to be a comparable,
but more convenient gaming facility.
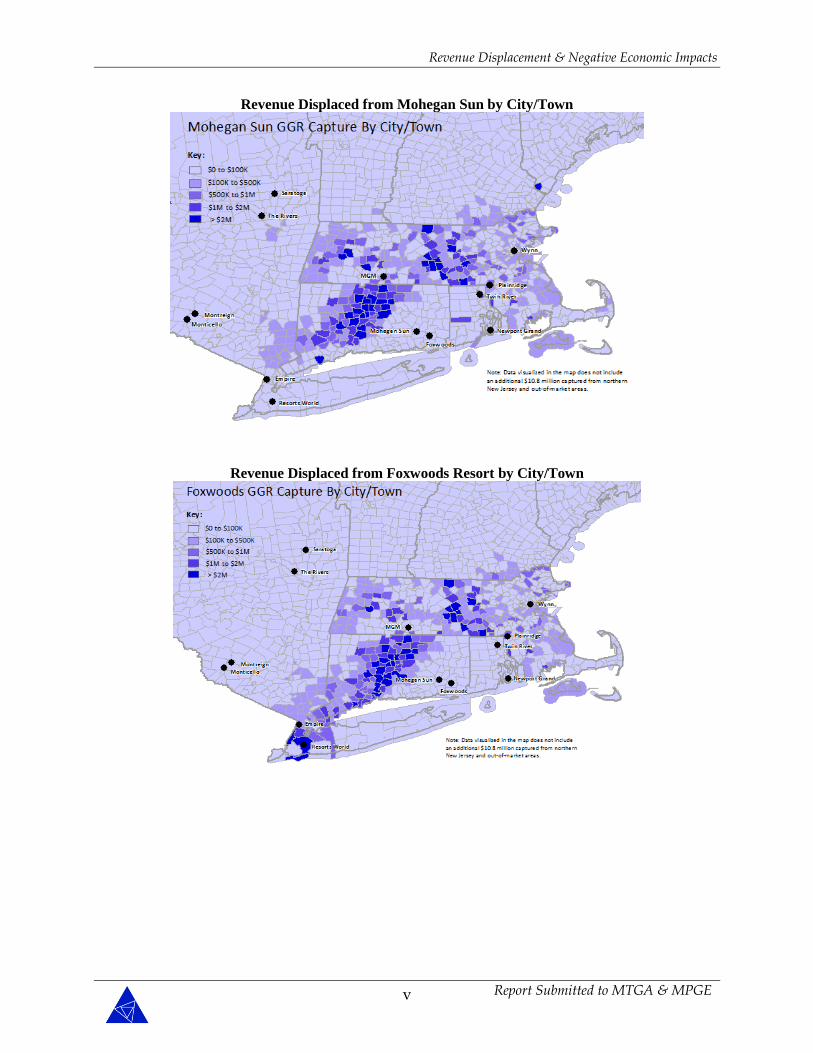
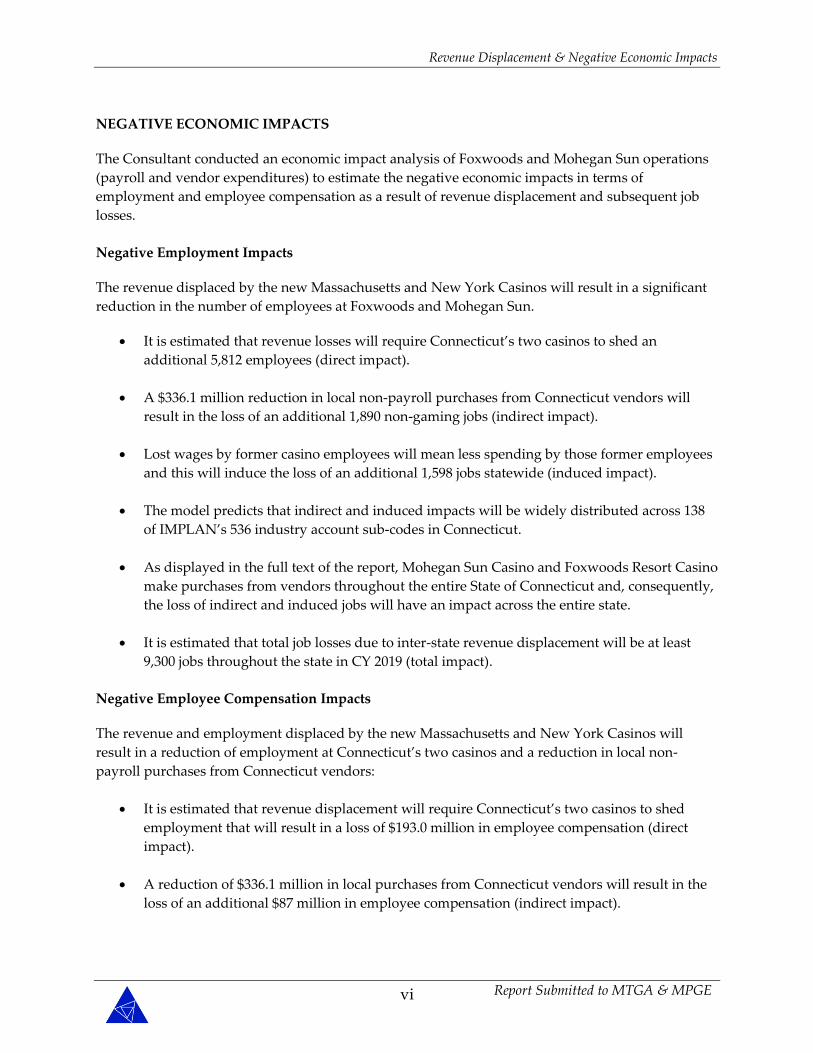
The two figures below provide a visual illustration of the geography of the estimated
revenue displacement for Mohegan Sun and Foxwoods Resort, respectively, within a
150 minute drive time radius. These figures illustrate the extent to which the four
planned casinos in Massachusetts and New York, and particularly MGM Springfield,
will cannibalize gaming revenues from Connecticut residents who reside along the I-
91 and I-84 commuter corridors.
It is also estimated that the State of Connecticut will lose nearly $100 million
annually by CY 2019 in revenue sharing payments from Mohegan Sun Casino and
Foxwoods Resort Casino.4
4 This estimate assumes that slot machine revenues will account for seventy percent of gross gaming revenues and that both tribes
will continue to share twenty-five percent (25%) of slot machine revenues with the State of Connecticut.
Revenue Displacement & Negative Economic Impacts
Report Submitted to MTGA & MPGE
v
Revenue Displaced from Mohegan Sun by City/Town
Revenue Displaced from Foxwoods Resort by City/Town
Revenue Displacement & Negative Economic Impacts
Report Submitted to MTGA & MPGE
vi
NEGATIVE ECONOMIC IMPACTS
The Consultant conducted an economic impact analysis of Foxwoods and Mohegan Sun operations
(payroll and vendor expenditures) to estimate the negative economic impacts in terms of
employment and employee compensation as a result of revenue displacement and subsequent job
losses.
Negative Employment Impacts
The revenue displaced by the new Massachusetts and New York Casinos will result in a significant
reduction in the number of employees at Foxwoods and Mohegan Sun.
It is estimated that revenue losses will require Connecticut’s two casinos to shed an
additional 5,812 employees (direct impact).
A $336.1 million reduction in local non-payroll purchases from Connecticut vendors will
result in the loss of an additional 1,890 non-gaming jobs (indirect impact).
Lost wages by former casino employees will mean less spending by those former employees
and this will induce the loss of an additional 1,598 jobs statewide (induced impact).
The model predicts that indirect and induced impacts will be widely distributed across 138
of IMPLAN’s 536 industry account sub-codes in Connecticut.
As displayed in the full text of the report, Mohegan Sun Casino and Foxwoods Resort Casino
make purchases from vendors throughout the entire State of Connecticut and, consequently,
the loss of indirect and induced jobs will have an impact across the entire state.
It is estimated that total job losses due to inter-state revenue displacement will be at least
9,300 jobs throughout the state in CY 2019 (total impact).
Negative Employee Compensation Impacts
The revenue and employment displaced by the new Massachusetts and New York Casinos will
result in a reduction of employment at Connecticut’s two casinos and a reduction in local non-
payroll purchases from Connecticut vendors:
It is estimated that revenue displacement will require Connecticut’s two casinos to shed
employment that will result in a loss of $193.0 million in employee compensation (direct
impact).
A reduction of $336.1 million in local purchases from Connecticut vendors will result in the
loss of an additional $87 million in employee compensation (indirect impact).
Revenue Displacement & Negative Economic Impacts
Report Submitted to MTGA & MPGE
vii
Lost wages by former casino employees will mean less spending by those former employees
and this will induce the loss of $73.9 million in lost employment compensation (induced
impact).
The reduction in local purchases from Connecticut vendors will result in the estimated total
loss of $353.5 million in lost wages throughout the state (total impact).

Revenue Displacement & Negative Economic Impacts
Report Submitted to MTGA & MPGE
viii
[This page left blank intentionally]
Revenue Displacement & Negative Economic Impacts
Report Submitted to MTGA & MPGE
ix
Table of Contents
Executive Summary ........................................................................................................................................... i
1. Assignment .................................................................................................................................................. 1
2. Background ................................................................................................................................................. 3
2.1 U.S. Casino Gaming .............................................................................................................................. 3
2.2 Overview of Trends In the New England & Northeastern Casino Gaming Market .................. 5
2.3 Regional Casino Gaming.............................................................................................................. - 24 -
2.3.1 New York Casino Gaming ................................................................................................. - 24 -
2.3.2 Existing Casinos In New York ........................................................................................... - 25 -
2.3.3 New York Planned and Recommended Casinos ............................................................. - 30 -
3. Methodology ........................................................................................................................................ - 36 -
3.1 Definitions ...................................................................................................................................... - 36 -
3.2 Gravity Model................................................................................................................................ - 37 -
4. Assumptions ........................................................................................................................................ - 40 -
5. Analysis and Results .......................................................................................................................... - 44 -
5.1 Designated Market Area .............................................................................................................. - 44 -
5.2 Competitive Impact of Planned Massachusetts & New York Casinos ................................... - 45 -
5.2.1 MGM Springfield ................................................................................................................. - 45 -
5.2.1.1 Market Break Points ............................................................................................... - 46 -
5.2.1.2 Impact on Mohegan Sun Casino & Foxwoods Resort Casino Gross Revenue - 48 -
5.2.2 Wynn Everett ........................................................................................................................ - 49 -
5.2.2.1 Market Break Points ................................................................................................ - 50 -
5.2.2.2 Impact on Mohegan Sun Casino & Foxwoods Resort Casino Gross Revenue - 51 -
5.2.3 Rivers Casino & Resort at Mohawk Harbor .................................................................... - 52 -
5.2.3.1 Market Break Points ................................................................................................ - 53 -
5.2.3.2 Impact on Mohegan Sun Casino & Foxwoods Resort Casino Gross Revenue - 53 -
5.2.4 Montreign Resort Casino .................................................................................................... - 54 -
5.2.4.1 Market Break Points ................................................................................................ - 55 -
5.2.4.2 Impact on Mohegan Sun Casino & Foxwoods Resort Casino Gross Revenue - 57 -
5.2.5 Summary Impact on Gross Gaming and Non-Gaming Revenues ............................... - 57 -
5.2.6 Summary Impact ................................................................................................................. - 59 -
6. Negative Economic Impacts .............................................................................................................. - 62 -
6.1 Definitions .................................................................................................................................. - 62 -
6.2 IMPLAN Modeling System ......................................................................................................... - 63 -
6.3 Data Sources .................................................................................................................................. - 65 -
6.3.1 Employee Compensation Expenditures ............................................................................ - 65 -
6.3.2 Vendor Expenditures ........................................................................................................... - 65 -
Revenue Displacement & Negative Economic Impacts
Report Submitted to MTGA & MPGE
x
6.4 Negative Economic Impacts ........................................................................................................ - 66 -
6.4.1 Negative Employment Impacts .......................................................................................... - 66 -
6.4.2 Indirect & Induced Employment & Compensation Impacts .......................................... - 68 -
7. References ............................................................................................................................................... - 72 -
Sources Consulted .......................................................................................... Error! Bookmark not defined.
Appendix A: About the Author .............................................................................................................. - 84 -
Appendix B: About Pyramid Associates, LLC ..................................................................................... - 85 -
Appendix C: Retail Gravity Modeling .................................................................................................. - 86 -
[
Revenue Displacement & Negative Economic Impacts
Report Submitted to MTGA & MPGE
1
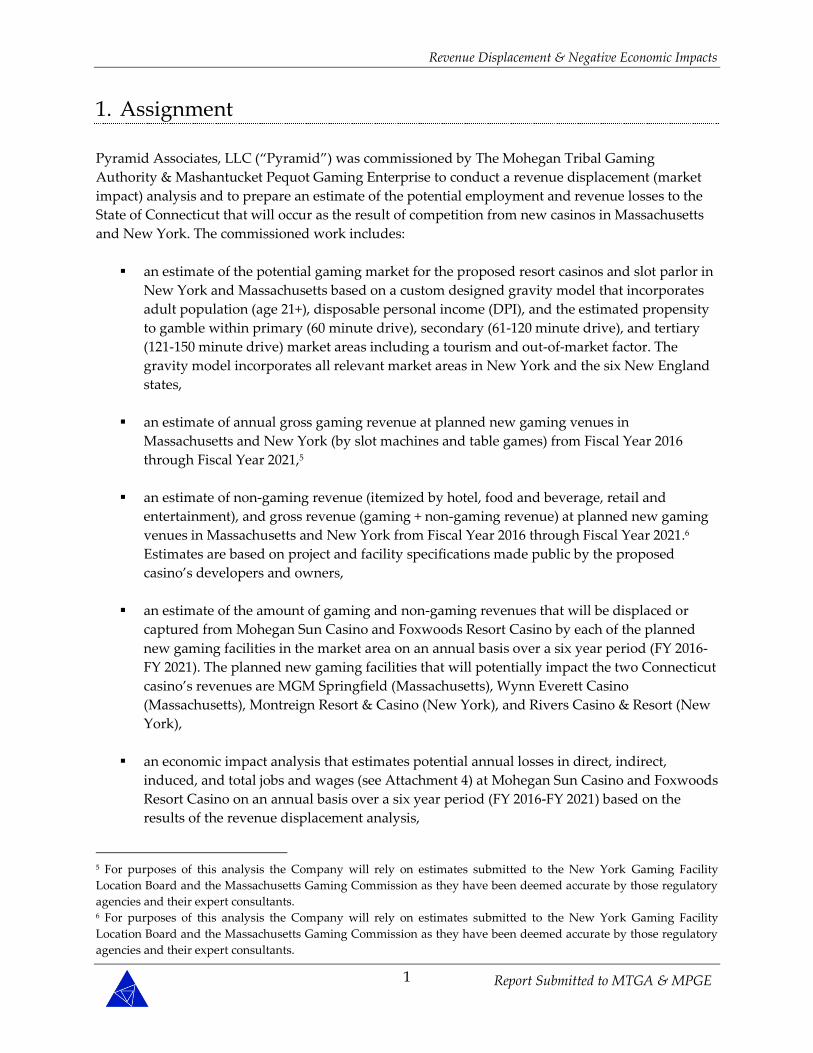
1. Assignment
Pyramid Associates, LLC (“Pyramid”) was commissioned by The Mohegan Tribal Gaming
Authority & Mashantucket Pequot Gaming Enterprise to conduct a revenue displacement (market
impact) analysis and to prepare an estimate of the potential employment and revenue losses to the
State of Connecticut that will occur as the result of competition from new casinos in Massachusetts
and New York. The commissioned work includes:
an estimate of the potential gaming market for the proposed resort casinos and slot parlor in
New York and Massachusetts based on a custom designed gravity model that incorporates
adult population (age 21+), disposable personal income (DPI), and the estimated propensity
to gamble within primary (60 minute drive), secondary (61-120 minute drive), and tertiary
(121-150 minute drive) market areas including a tourism and out-of-market factor. The
gravity model incorporates all relevant market areas in New York and the six New England
states,
an estimate of annual gross gaming revenue at planned new gaming venues in
Massachusetts and New York (by slot machines and table games) from Fiscal Year 2016
through Fiscal Year 2021,5
an estimate of non-gaming revenue (itemized by hotel, food and beverage, retail and
entertainment), and gross revenue (gaming + non-gaming revenue) at planned new gaming
venues in Massachusetts and New York from Fiscal Year 2016 through Fiscal Year 2021.6
Estimates are based on project and facility specifications made public by the proposed
casino’s developers and owners,
an estimate of the amount of gaming and non-gaming revenues that will be displaced or
captured from Mohegan Sun Casino and Foxwoods Resort Casino by each of the planned
new gaming facilities in the market area on an annual basis over a six year period (FY 2016-
FY 2021). The planned new gaming facilities that will potentially impact the two Connecticut
casino’s revenues are MGM Springfield (Massachusetts), Wynn Everett Casino
(Massachusetts), Montreign Resort & Casino (New York), and Rivers Casino & Resort (New
York),
an economic impact analysis that estimates potential annual losses in direct, indirect,
induced, and total jobs and wages (see Attachment 4) at Mohegan Sun Casino and Foxwoods
Resort Casino on an annual basis over a six year period (FY 2016-FY 2021) based on the
results of the revenue displacement analysis,
5 For purposes of this analysis the Company will rely on estimates submitted to the New York Gaming Facility
Location Board and the Massachusetts Gaming Commission as they have been deemed accurate by those regulatory
agencies and their expert consultants. 6 For purposes of this analysis the Company will rely on estimates submitted to the New York Gaming Facility
Location Board and the Massachusetts Gaming Commission as they have been deemed accurate by those regulatory
agencies and their expert consultants.
Revenue Displacement & Negative Economic Impacts
Report Submitted to MTGA & MPGE
2
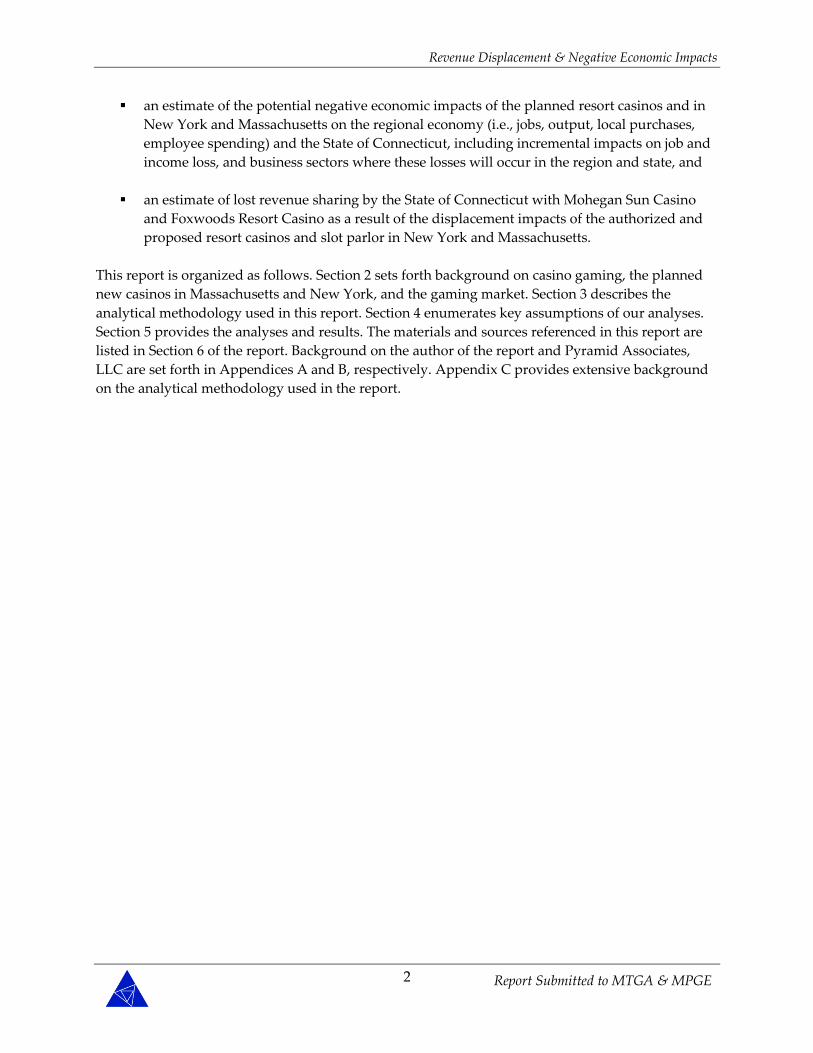
an estimate of the potential negative economic impacts of the planned resort casinos and in
New York and Massachusetts on the regional economy (i.e., jobs, output, local purchases,
employee spending) and the State of Connecticut, including incremental impacts on job and
income loss, and business sectors where these losses will occur in the region and state, and
an estimate of lost revenue sharing by the State of Connecticut with Mohegan Sun Casino
and Foxwoods Resort Casino as a result of the displacement impacts of the authorized and
proposed resort casinos and slot parlor in New York and Massachusetts.
This report is organized as follows. Section 2 sets forth background on casino gaming, the planned
new casinos in Massachusetts and New York, and the gaming market. Section 3 describes the
analytical methodology used in this report. Section 4 enumerates key assumptions of our analyses.
Section 5 provides the analyses and results. The materials and sources referenced in this report are
listed in Section 6 of the report. Background on the author of the report and Pyramid Associates,
LLC are set forth in Appendices A and B, respectively. Appendix C provides extensive background
on the analytical methodology used in the report.
Revenue Displacement & Negative Economic Impacts
Report Submitted to MTGA & MPGE
3
2. Background
This section of the report provides background on U.S. casino gaming, the New England/New York
gaming markets, and the planned resort casinos in Massachusetts and New York.
2.1 U.S. CASINO GAMING
Casino gaming is a significant component of the leisure, hospitality, and entertainment industry in
the United States with 38 states (2012) now hosting some type of casino gaming. There are 960 casino
gaming venues in the United States, including 468 Indian gaming facilities and 492 commercial
casinos (including racetrack casinos).7 Nearly half (46%) of all commercial casinos are now located in
non-traditional jurisdictions (i.e., outside Nevada and New Jersey) and, if one includes Indian
casinos, then seventy-two percent (72%) of all U.S. casinos are now located in non-traditional
jurisdictions. All types of casino gaming combined generated $64.7 billion in gross gaming revenues
in 2012 with $50.8 billion (78.6%) of that amount accruing to venues outside the traditional
jurisdictions of Nevada and New Jersey. It is estimated that total industry revenues (gaming and
non-gaming) were approximately $74 billion in 2012. The casino industry as a whole employed more
than 670,000 people nationwide and made approximately $10.2 billion in direct payments to state
and local governments.8 The percentage of adults who gambled at a casino at least once in the
previous year has climbed from 17 percent in 1990 to 32 percent in 2012, when 76.1 million
Americans made more than 400 million visits to casinos.9 Moreover, since the late 1980s, when new
casinos began opening in non-traditional jurisdictions, nearly 82 percent of the increase in casino
visitations has occurred in non-traditional casino jurisdictions.
The significance of casino gaming within the leisure and hospitality sector is now recognized in the
industrial classification system used by the United States Government to collect data on
employment, wages, and business establishments. In 1997, the United States began phasing out the
old Standard Industrial Classification (SIC) System, which had been designed mainly for classifying
business establishments in an industrial economy. The North American Industry Classification
System (NAICS), which replaced the SIC system, was designed specifically to identify trends in
“new and emerging industries” and to capture the growing importance of “service industries in
general” in the new economy.10
7 Calculated from data in Harrah’s Entertainment, Inc. (2006); American Gaming Association (2013); and Meister
(2014). 8 Calculated from data in Meister (2014) and American Gaming Association (2013). The reported tax payments and
revenue sharing do not include corporate income taxes, sales, meals, and lodging taxes, property taxes, and other
license and fee payments. 9 Harrah’s Entertainment, Inc. (2006); American Gaming Association (2013). 10 Office of Management and Budget (1997, 3).
Revenue Displacement & Negative Economic Impacts
Report Submitted to MTGA & MPGE
4
NAICS classifies business establishments into twenty major Sectors, with gaming establishments
assigned to Sector 71 – Arts, Entertainment, and Recreation and Sector 72 -Accommodation and
Food Services:
Subsector 711. Performing Arts, Spectator Sports, and Related Industries
Subsector 712. Museums, Historical Sites, and Similar Institutions
Subsector 713. Amusement, Gambling, & Recreation
Subsector 721120. Casino Hotels
Spectator sports, art museums, and casinos are classified in the same major sector, because each
industry group provides a comparable service in the form of amusement or entertainment. A
customer can be amused or entertained by a sporting event, an art exhibit, or a slot machine, and
one can be equally disappointed if one’s favorite sports team loses a game, if an art exhibit is
uninspiring, or if a gambler has a bad day at the blackjack table. Each industry provides a service
called amusement or entertainment.
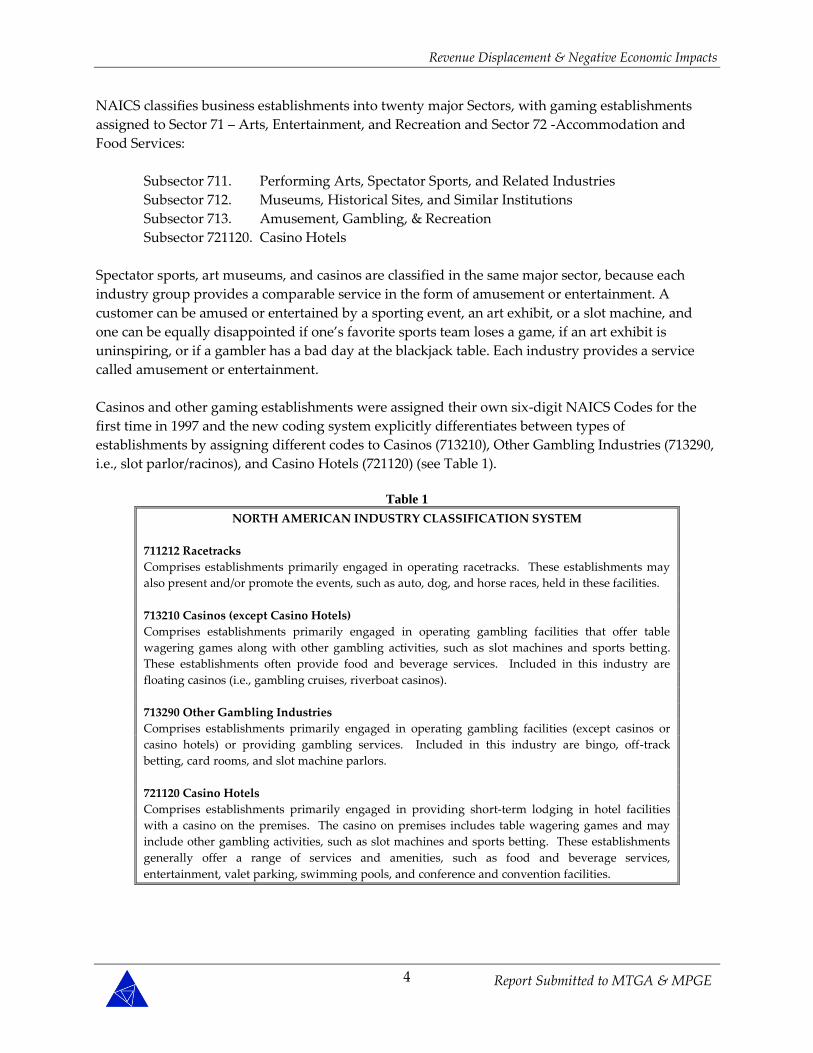
Casinos and other gaming establishments were assigned their own six-digit NAICS Codes for the
first time in 1997 and the new coding system explicitly differentiates between types of
establishments by assigning different codes to Casinos (713210), Other Gambling Industries (713290,
i.e., slot parlor/racinos), and Casino Hotels (721120) (see Table 1).
Table 1
NORTH AMERICAN INDUSTRY CLASSIFICATION SYSTEM
711212 Racetracks
Comprises establishments primarily engaged in operating racetracks. These establishments may
also present and/or promote the events, such as auto, dog, and horse races, held in these facilities.
713210 Casinos (except Casino Hotels)
Comprises establishments primarily engaged in operating gambling facilities that offer table
wagering games along with other gambling activities, such as slot machines and sports betting.
These establishments often provide food and beverage services. Included in this industry are
floating casinos (i.e., gambling cruises, riverboat casinos).
713290 Other Gambling Industries
Comprises establishments primarily engaged in operating gambling facilities (except casinos or
casino hotels) or providing gambling services. Included in this industry are bingo, off-track
betting, card rooms, and slot machine parlors.
721120 Casino Hotels
Comprises establishments primarily engaged in providing short-term lodging in hotel facilities
with a casino on the premises. The casino on premises includes table wagering games and may
include other gambling activities, such as slot machines and sports betting. These establishments
generally offer a range of services and amenities, such as food and beverage services,
entertainment, valet parking, swimming pools, and conference and convention facilities.
Revenue Displacement & Negative Economic Impacts
Report Submitted to MTGA & MPGE
5
Casino establishments include land-based casinos, riverboat casinos, dockside casinos, and cruise
ships, which offer a wide range of slot machine games and table games. Casino hotels typically offer
the same gambling options, but also offer non-gambling amenities, such as retail outlets, dining
establishments, dance clubs, comedy clubs, cabarets, concert and sporting arenas, spas, golf courses,
recreational vehicle parks, water parks, and meeting and conference facilities. Other Gambling
Industries consists primarily of racinos or slot parlors, where slot machines or video lottery
terminals (VLTs) are installed at an existing pari-mutuel facility, such as a dog track, horse track, or
jai-alai fronton.
Thus, the casino industry is actually differentiated into many niche markets that are distinguished
by the type of facility, size of facility, consumer demographics, and customer motivation.
Consequently, the market, economic, and fiscal impacts of the industry vary widely from state to
state, and even within states, depending on the particular configuration of casino establishments and
whether a state’s gaming policy allows essentially unrestricted market entry (subject to licensing),
such as Nevada, New Jersey, and Mississippi, or whether a state limits market entry to a fixed
number of establishments (e.g., Maryland, Massachusetts, and Michigan). The market, economic,
and fiscal impacts of the industry can also vary depending on whether a state hosts state-licensed
and regulated commercial casinos or Indian casinos that operate under federal laws, state gaming
compacts, and tribal ordinances.
2.2 OVERVIEW OF TRENDS IN THE NEW ENGLAND & NORTHEASTERN CASINO
GAMING MARKET
Casino gaming is a $2.7 billion sector of the leisure, hospitality, and entertainment industry in New
England, with two tribal casinos in Connecticut, one casino and one slot parlor in Rhode Island, and
two casinos in Maine.11 The industry employs approximately 16,997 people in New England. The
casino industry made $638.1 million in tax and revenue sharing payments to state governments in
calendar year 2014.12 Connecticut’s two casinos account for approximately $1.9 billion (70.4%) of the
region’s casino gaming market, but this market share has steadily declined since 2007 due to
increased competition from casinos in Rhode Island, Maine, and New York. This competition, and
its potential impact on Connecticut’s share of the regional gaming market, will intensify as
additional competition emerges throughout the region, particularly in the states of Massachusetts
and New York.
The New England casino gaming market is developing and changing as a result of two recent
developments: (1) the lingering impact of the Great Recession (December 2007-June 2009), which
continues to depress discretionary spending on casino gaming and (2) the emergence of an
increasingly competitive Northeastern gaming market that encompasses both the New England13
11 Twin River began offering live table games on June 19, 2013. 12 This figure only includes gaming taxes, sales and meals taxes, and lodging taxes paid to states. It does not include payments for
licensing fees, corporate income taxes, payroll taxes (e.g., unemployment insurance), local property taxes, payments in lieu of taxes
made to local host communities, or any federal tax payments. 13 Connecticut, Maine, Massachusetts, Rhode Island, New Hampshire, and Vermont.
Revenue Displacement & Negative Economic Impacts
Report Submitted to MTGA & MPGE
6
and the Mid-Atlantic14 states. As the national and regional economy continues its slow recovery,
state casino gaming policy and individual gaming operator are shifting their attention to questions
of regional competition, market saturation, and inter-state cannibalization.
Events in New Jersey have been the catalyst for these concerns as the steady expansion of casino
gambling in Atlantic City from 1978 to 2006 made it the United States’ second largest commercial
gambling venue behind Las Vegas.15 Atlantic City reached its peak as a gambling capital in 2006,
when it hosted 12 casinos that generated $5.2 billion in gross gaming revenue (GGR).16
However, by mid-September of 2014, one-third of Atlantic City’s 12 casinos had shuttered their
doors,17 including the $2.4 billion Revel, which was hailed by many public officials and gaming
industry leaders as the beginning of a rebirth for Atlantic City’s faltering fortunes (Kramer 2014).18
The casino closures are a direct result of declining gross gaming revenue, which fell from $5.2
billion in FY 2006 to $2.7 billion (-48.1%) in FY 2014. The gaming revenue declines and consequent
casino closures have resulted in 9,000 lost casino and hospitality jobs (Hoa 2014).
Not surprisingly, media accounts now regularly refer to Atlantic City as the East Coast’s “faded
gambling mecca” (Hurdle 2014). In fact, the resulting newspaper headlines read like an obituary
page for the Northeastern casino gaming industry:19
“Death of Atlantic City Casinos” (Hoa 2014),
“Showboat Casino Closes Amid Tears and Questions About Atlantic City’s Direction
(New York Times, 8-31-2014),
“N.J. Casino Woes” (Boston Globe, 9-1-2014),
“Casino Gambling: Any Hope Has Faded” (Foster’s Daily Democrat, 8-19-2014),
“Casinos: Nothing But Trouble” (Manchester Union-Leader, 8-11-2014),
“Death of Atlantic City Casinos Could Be Omen for N.Y.” (Lower Hudson Valley Journal
News, 8-29-2014),
“U.S. Casino Industry in the Midst of Collapse” (Portsmouth Herald, 7-29-2014),
“America’s Casino Saturation Problem” (Wolfson 2014).
The dour news on casinos in the Northeastern media has not been confined to New Jersey as the
same contagion has spread to Connecticut’s two behemoth Indian casinos – Foxwoods Resort Casino
and Mohegan Sun Casino. At their 2006 peak, Connecticut’s Indian casinos were the two largest
14 Delaware, Maryland, New Jersey, New York, Pennsylvania, and West Virginia. Ohio is also included as part of the northeastern
casino gaming market, because its casinos compete directly with casinos in West Virginia, western Pennsylvania, and western New
York as opposed to competing with casinos in the Midwest casino gaming market (i.e., Illinois, Indiana, Iowa, Kansas, Michigan,
Minnesota, Missouri, and Wisconsin. 15 In 2012, Pennsylvania surpassed New Jersey to become the nation’s second largest commercial gambling jurisdiction based on gross gaming revenues. 16 Atlantic City Hilton (renamed the Atlantic Club), Bally’s Park Place, Borgata, Caesar’s Atlantic City, Harrah’s Atlantic City, Resorts, Sands (later demolished), Showboat, Tropicana, Trump Marina (renamed Golden Nugget), Trump Plaza, and Trump Taj Mahal, New Jersey Casino Control Commission, “Financial and Statistical Information,” Available at http://www.nj.gov/oag/ge/financialandstatisticalinfo.html 17 Atlantic Club, Revel, Showboat, and Trump Plaza. 18 One media account of the Revel’s closing states that “Revel, once thought to be the Boardwalk’s best and brightest, became perhaps its greatest failure,” see Kramer (2014). 19 The Northeastern Gaming Research Project defines the Northeastern gaming market as casinos located in New England (i.e., Maine, New Hampshire, Vermont, Massachusetts, Connecticut, and Rhode Island), the Mid-Atlantic (i.e., Maryland, Delaware, West Virginia, New Jersey, Pennsylvania, and New York), and Ohio (which competes for customers with Pennsylvania, West Virginia, and New York).
Revenue Displacement & Negative Economic Impacts
Report Submitted to MTGA & MPGE
7
resort casinos in the world based on the number of gaming positions, gross gaming revenue, and
total revenue (Barrow and Borges 2007).20 However, New England media outlets now rightly report
that there is “More Financial Trouble at Foxwoods” (Kostrzewa 2014). The Mashantucket Pequot
Tribe, which owns Foxwoods Resort Casino, reports that a sluggish economic recovery and
increasing competition in the Northeast is the explanation for Foxwoods’ “failure to comply with
certain financial covenants” in its credit facility (Journal Wire Services 2014).
Foxwoods’s announcement came only one year after the Tribe had defaulted on a debt of $2.3 billion
and subsequently reached an agreement with lenders to exchange it for $1.7 billion in new debt.
However, the agreement reached in July of 2013 was based on a financial performance forecast that
assumed “improved economic conditions and a leveling out of competitive factors” (Ibid.). In
contrast, gross gaming revenue has continued falling on a year-to-year basis since 2007, while the
competition for gamblers in New England will actually increase as Massachusetts adds two (and
maybe three) destination resort casinos and a slot parlor and as New York builds three resort
casinos.
Consequently, many gaming industry analysts predict that what happened to Atlantic City will also
happen to Foxwoods and Mohegan Sun once Massachusetts and New York open new resort casinos.
For example, casino consultant Gary Green has suggested that Foxwoods Resorts Casino and
Mohegan Sun Casino will be “completely cannibalized” by new casinos in Massachusetts (quoted in
Arsenault 2014) and this claim is supported by the patron origin data collected by the Northeastern
Gaming Research Project.21
At the same time, the troubles in Connecticut and New Jersey have led some industry observers to
suggest that the “Bay State May Not Hit Promised Jackpot with Casinos” (Cassidy 2014), while
elsewhere “N.Y. Casino Bidders Quizzed on Revenue in Saturated Market” (Klopott 2014). Donald
Trump, the former owner of three Atlantic City casinos22 has predicted that the “NY casino projects
will all go down the tubes” (2014).
The media focus on Atlantic City and Foxwoods Resort has ignited a debate about the future of the
Northeastern casino gaming industry with critics claiming that planned expansions in
Massachusetts and New York are doomed to fail (Arsenault 2014), and the on-going debates about
gaming expansion in New Hampshire and Maine have skeptics pointing to Atlantic City to bolster
claims about oversaturation and a declining regional industry. These critics describe Atlantic City as
a harbinger of things to come throughout the Northeast as new supply generates ever stiffer
competition in the gaming market.
Moreover, increased competition in the casino gaming industry comes at a time when many state
economies remain sluggish with slow employment and income growth, while others argue that the
casino gaming is a saturated market with no room for new growth.23 Matt Dalton, the head of Belle
20 In CY 2006, it is estimated that Foxwoods Resort Casino and Mohegan Sun Casino each generated approximately $1.6 billion in total (gaming and non-gaming) revenue, see Barrow and Borges (2007). 21 In CY 2012, Foxwoods drew 32% of its patrons from Massachusetts and 10% of its patrons from New York, while Mohegan Sun drew 19% of its patrons from Massachusetts and 13% of its patrons from New York, see Barrow and Borges (2013a, 23-24). 22 Trump Marina, Trump Plaza, and Trump Taj Mahal. 23 Roger Gros, publisher of Global Gaming Business Magazine, quoted in Hoa (2014).
Revenue Displacement & Negative Economic Impacts
Report Submitted to MTGA & MPGE
8
Haven Investments in White Plains, New York has stated that the main challenge for the
Northeastern gaming industry is “dealing with competition. The casinos that are going to be built
now, they’re not all going to survive.”24 As reported in the Boston Globe (09-01-2014), casino
opponents “have seized upon Atlantic City’s troubles as a campaign issue, arguing the Northeast
cannot support the abundance of casinos that already exist, so why build more?” (Arsenault 2014;
Klopott 2014).
However, other investors, gaming analysts, and public officials believe there is more room for
expansion in the Northeast depending on the number, location and type of new gaming facilities.
For example, New York, Massachusetts, Philadelphia, southern New Hampshire, and Maine have
been identified as planned or potential areas for new gaming expansion, partly on the premise that
by offering attractive gaming facilities closer to major population centers (e.g., Albany, Boston, New
York City, Philadelphia, Portland) local and regional gamblers who currently visit casinos in
Connecticut and New Jersey can be induced to stay closer to home (Arsenault 2014). Many of the
visits to these planned or proposed gaming facilities will come at the expense of legacy states,
especially Connecticut and New Jersey, which entered the market early and enjoyed the rent-
seeking benefits of a regional monopoly for more than three decades. However, even gaming
expansion proponents argue that new facilities will need to offer a mix of convenience, state-of-the
art slot machines, table games, and other entertainment and non-gaming amenities (e.g., golf
courses, retail shopping, water parks, concert arenas, and dance clubs) to out-compete the existing
facilities in these markets (MPBN News 2014, Hurdle 2014).
From this perspective, the events in New Jersey and Connecticut are merely a normal market
shakeout that is typical of a maturing and competitive industry (Hurdle 2014).25 For example, Israel
Posner, an expert on Atlantic City and director of the Levenson Institute of Gaming, Hospitality, and
Tourism at Richard Stockton College of New Jersey, observes that after a decade of gaming
expansion in the Mid-Atlantic region, Atlantic City now “has roughly 45 percent of the region’s
casinos, and gets roughly 45 percent of the revenue” (quoted in Arsenault 2014), which signals
nothing more than the restoration of equilibrium in an expanding, but competitive market.26 In this
vein, Robert Shore of Union Gaming Group has suggested that Atlantic City’s woes actually “reflect
the success of other areas like Maryland and Pennsylvania” (Cassidy 2014).
24 Quoted in Hoa (2014). 25 One might compare the casino industry to the retail trade, airline, and automobile industries as comparative case studies. While individual companies have failed to survive national and global shakeouts, the end result is a modernized, innovative, and healthier industry. For example, while the Detroit automobile industry and other rust belt cities have witnessed calamitous declines in production and employment, the industry has not so much declined as shifted its production to southern states that have induced these businesses to move away from historical or legacy manufacturing centers in the Midwest and Northeast. 26 Posner is using a form of “fair share analysis,” which is a widely accepted method for comparing a casino’s performance to its competitors in a local or regional market. Fair share analysis compares the gross gaming revenues (GGR) a casino should capture in a local or regional market based on its percentage of the total gaming positions in that market. If a casino has 25% of the total gaming positions in a market then its “fair share” of GGR is 25% of the total GGR generated in that market. If it actually captures 25% of total GGR then it has captured 100% of its fair share. Posner is arguing that Atlantic City is capturing its fair share of the Mid-Atlantic gaming market based on its current configuration and the additional of new supply. Thus, officials at Caesars Entertainment, Inc., which owns 3 of the remaining 8 casinos in Atlantic City have stated their belief that “a reduction in supply [in Atlantic City] will buoy the three other casinos” that it still owns in that market, see Kramer (2014), and these forecasts have proven accurate.
Revenue Displacement & Negative Economic Impacts
Report Submitted to MTGA & MPGE
9
Casino Industry No Longer Recession Proof, But Hardly Collapsing
Casino gaming is classified as part of the U.S. economy’s arts, amusement, and recreation sector
(NAICS Code 71) and as part of its hospitality sector (NAICS Code 72 -- Accommodation and Food
Services). Casino gaming in all its forms depends on discretionary consumer spending, which is one
of the first types of spending that is restrained by consumers when they are uncertain about their
jobs and income and it is also the last type of spending to be restored once an economic recovery is
underway.
However, based largely on the previous experience of Las Vegas and Atlantic City, many analysts
had viewed the casino industry as recession proof or at least as recession resistant. Until 2008, Las
Vegas and Atlantic City had seen gambling revenues fall only once since 1970 -- in the aftermath of
the September 11, 2001 terrorist attack on the World Trade Towers -- when gaming revenues
dropped 1 percent in 2002 as compared to 2001 (Freiss 2008).
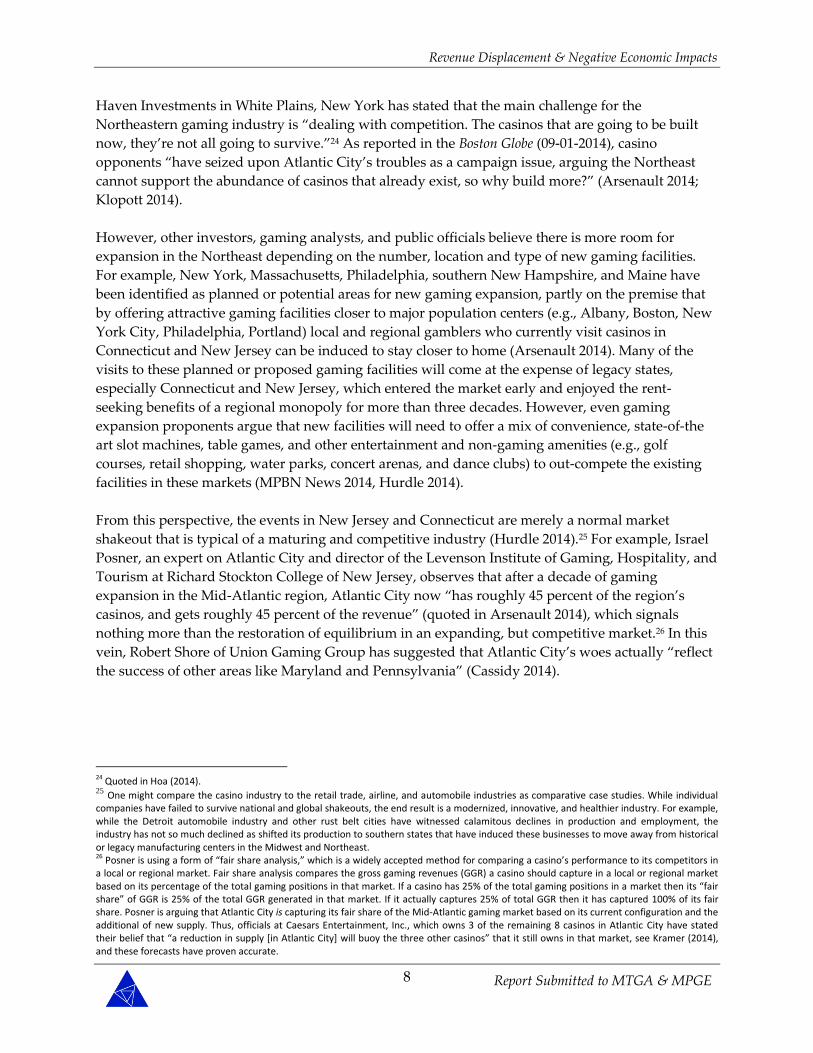
Figure 1
The United States economy essentially dropped off a cliff in calendar year 2008 to begin the longest
and deepest recession since the Great Depression of the 1930s. The National Bureau of Economic
Research (NBER) Business Cycle Dating Committee defines a recession as “a significant decline in
economic activity spread across the economy, lasting more than a few months, normally visible in
production, employment, real income, and other indicators. A recession begins when the economy
reaches a peak of activity and ends when the economy reaches its trough.”27 The Business Cycle
Dating Committee has determined that a peak in economic activity occurred in the United States in
December 2007.28 The NBER recently determined that the Great Recession ended in June 2009.
However, in making this determination, the NBER’s Business Cycle Dating Committee observed
that “in determining that a trough occurred in June 2009, the committee did not conclude that
economic conditions since that month have been favorable or that the economy has returned to
operating at normal capacity. Rather, the committee determined only that the recession ended and
a recovery began in that month.”29
27 NBER Business Cycle Memo (December 11, 2008): “The committee believes that the two most reliable comprehensive estimates of aggregate domestic production are normally the quarterly estimate of real Gross Domestic Product and the quarterly estimate of real Gross Domestic Income, both produced by the Bureau of Economic Analysis. In concept, the two should be the same, because sales of products generate income for producers and workers equal to the value of the sales.” 28 NBER Business Cycle Memo (Nov. 28, 2008): “The [dating] committee determined that a peak in economic activity occurred in the U.S. economy in December 2007.” 29 NBER Business Cycle Memo (September 20, 2010) at http://www.nber.org/cycles/sept2010.html.
Revenue Displacement & Negative Economic Impacts
Report Submitted to MTGA & MPGE
10
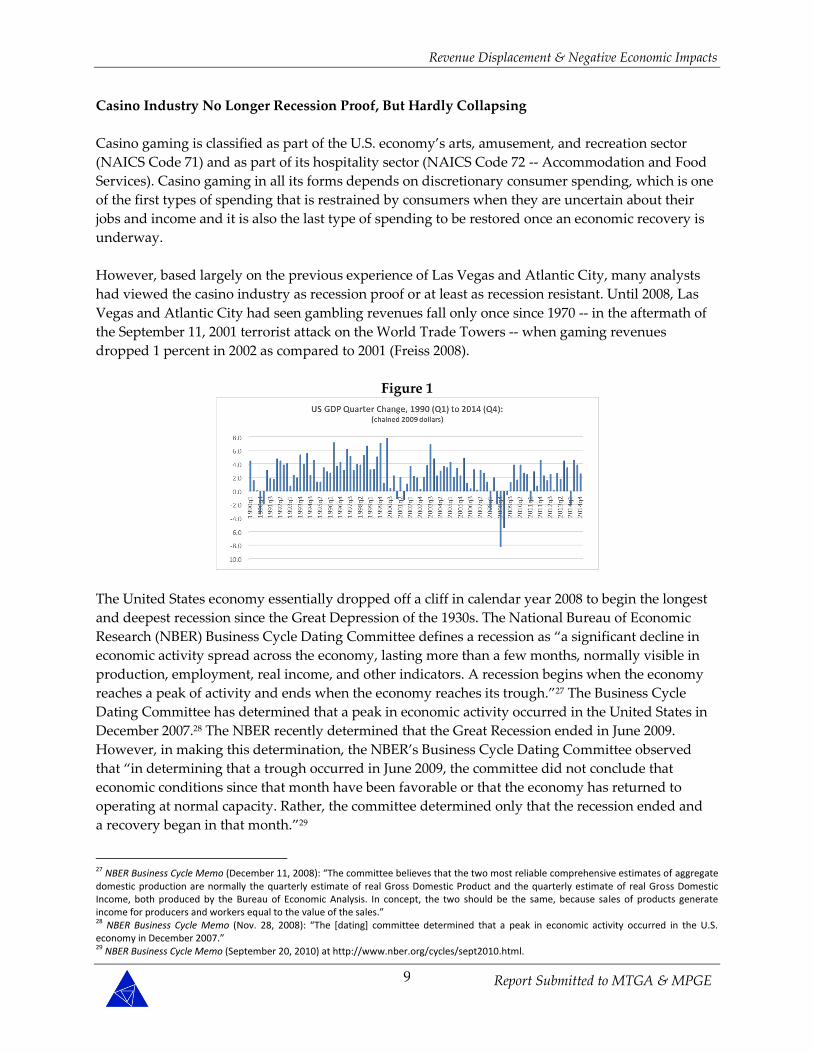
Not coincidentally, in 2008, gross gaming revenue began declining on a year-to-year basis in most
casino jurisdictions (see Figure 2), including Nevada and New Jersey, although some new
jurisdictions such as Maine, Pennsylvania, New York, and Rhode Island, continued to see gaming
revenues increase on a year-to-year basis during this time. Overall, however, gross gaming revenue
at commercial casinos in the United States reached a peak ($37.5 billion) in Calendar Year 2007 – the
last peak in the U.S. business cycle -- and gross gaming revenue at commercial casinos bottomed out
at $34.3 billion (-8.6%) in CY 2009, which includes the trough quarters in U.S. GDP as defined by the
NBER’s Business Cycle Dating Committee (e.g., compare Figure 1 and Figure 2). Since that time,
gross gaming revenue at U.S. commercial casinos has recovered to $38.7 billion (+12.8%) and has
exceeded its previous CY 2007 peak in the last two calendar years.
Figure 2
On the national level, gross gaming revenue at commercial casinos began a two-year 8.6% decline
(2008-2009), which coincided with the worst years of the Great Recession, followed by a five-year
12.8% recovery in gross gaming revenue (2010-2014) (see Figure 2).30 This is not a pattern that
defines a collapsing industry, but it does confirm that casino gaming is no longer recession proof.
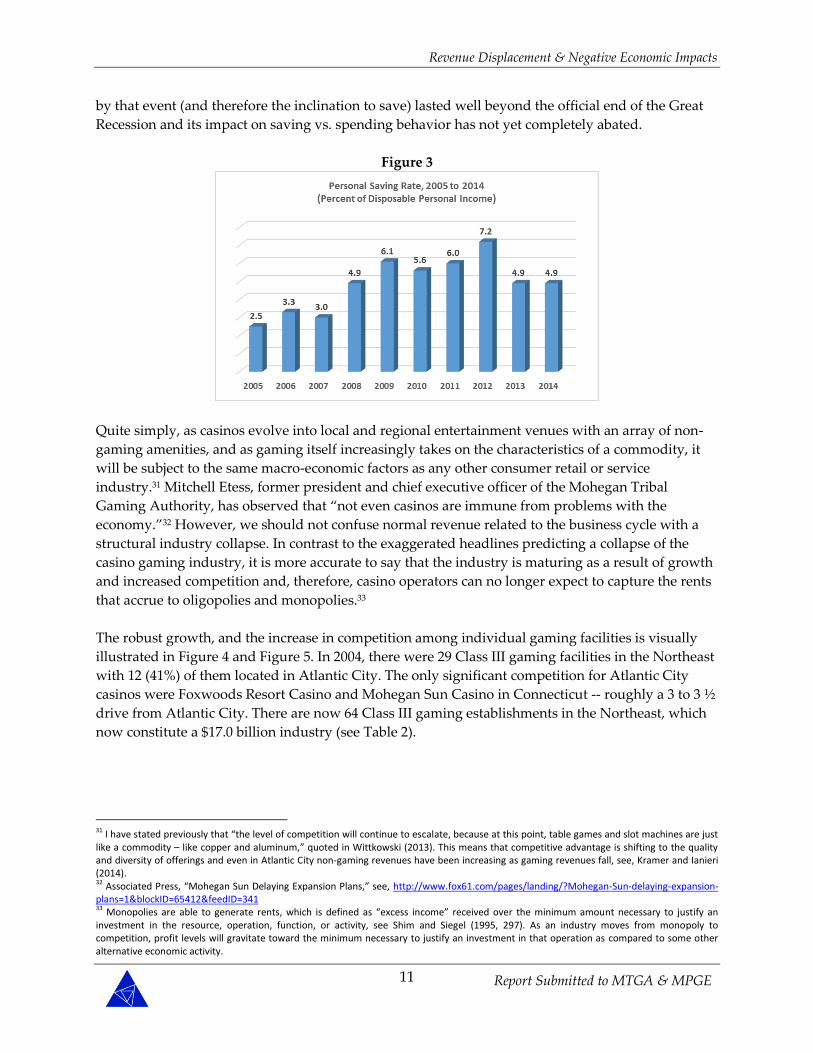
In fact, overall spending on casino gaming closely tracked changes in the personal saving rate from
recent peak levels of casino spending (2007) to the trough in casino spending (2009) through its
recent recovery (2013-2014). As spending on casino gaming peaked nationally in 2005 to 2007, the
personal saving rate averaged about 3.0% during these years. The personal saving rate more than
doubled by 2009 – the trough in casino spending – and fell back to 4.9% in 2013 and 2014 as
spending on casino gaming began to recover in those years (see Figure 3). Spending on casino
gaming depends on discretionary (as opposed to disposable) personal income and, consequently,
small changes in the saving rate of one percentage point or less are likely to have a significant impact
on the casino gaming industry as it matures in the coming years. As Figure 3 illustrates, the Great
Recession induced an immediate increase in the personal saving rate, but the uncertainty generated
30 A similar pattern characterizes the Indian casino industry, see Meister (2007-2014).
Revenue Displacement & Negative Economic Impacts
Report Submitted to MTGA & MPGE
11
by that event (and therefore the inclination to save) lasted well beyond the official end of the Great
Recession and its impact on saving vs. spending behavior has not yet completely abated.
Figure 3
Quite simply, as casinos evolve into local and regional entertainment venues with an array of non-
gaming amenities, and as gaming itself increasingly takes on the characteristics of a commodity, it
will be subject to the same macro-economic factors as any other consumer retail or service
industry.31 Mitchell Etess, former president and chief executive officer of the Mohegan Tribal
Gaming Authority, has observed that “not even casinos are immune from problems with the
economy.”32 However, we should not confuse normal revenue related to the business cycle with a
structural industry collapse. In contrast to the exaggerated headlines predicting a collapse of the
casino gaming industry, it is more accurate to say that the industry is maturing as a result of growth
and increased competition and, therefore, casino operators can no longer expect to capture the rents
that accrue to oligopolies and monopolies.33
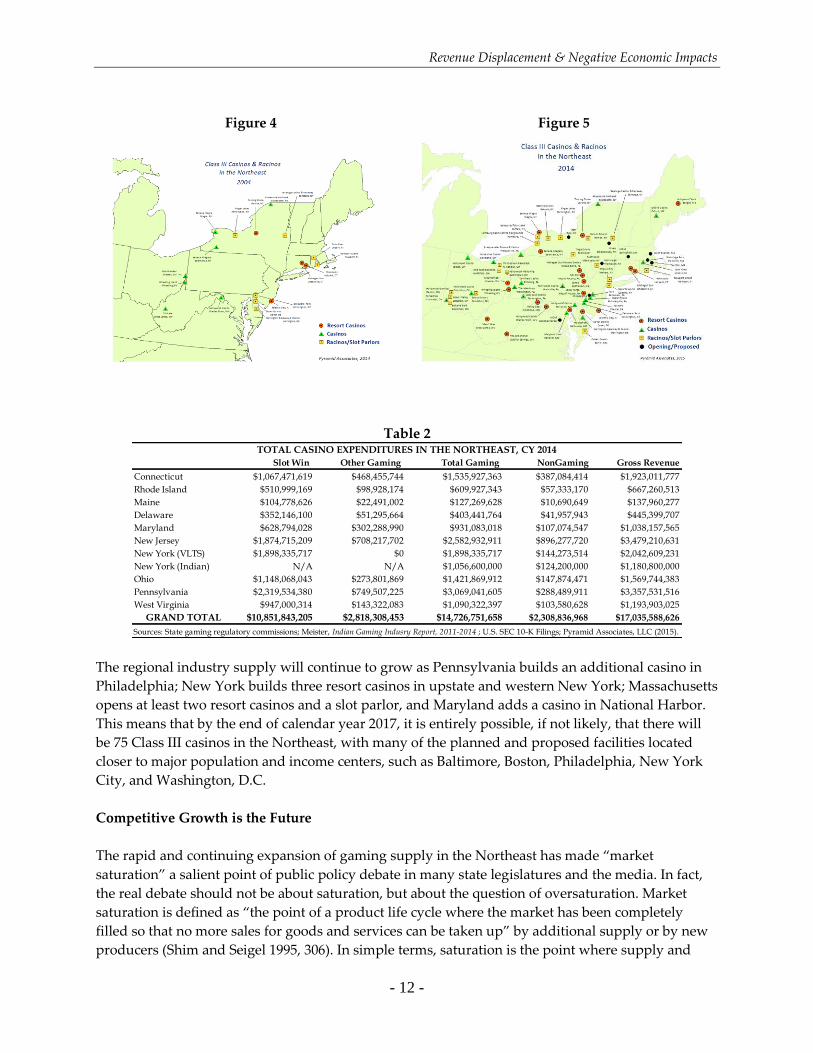
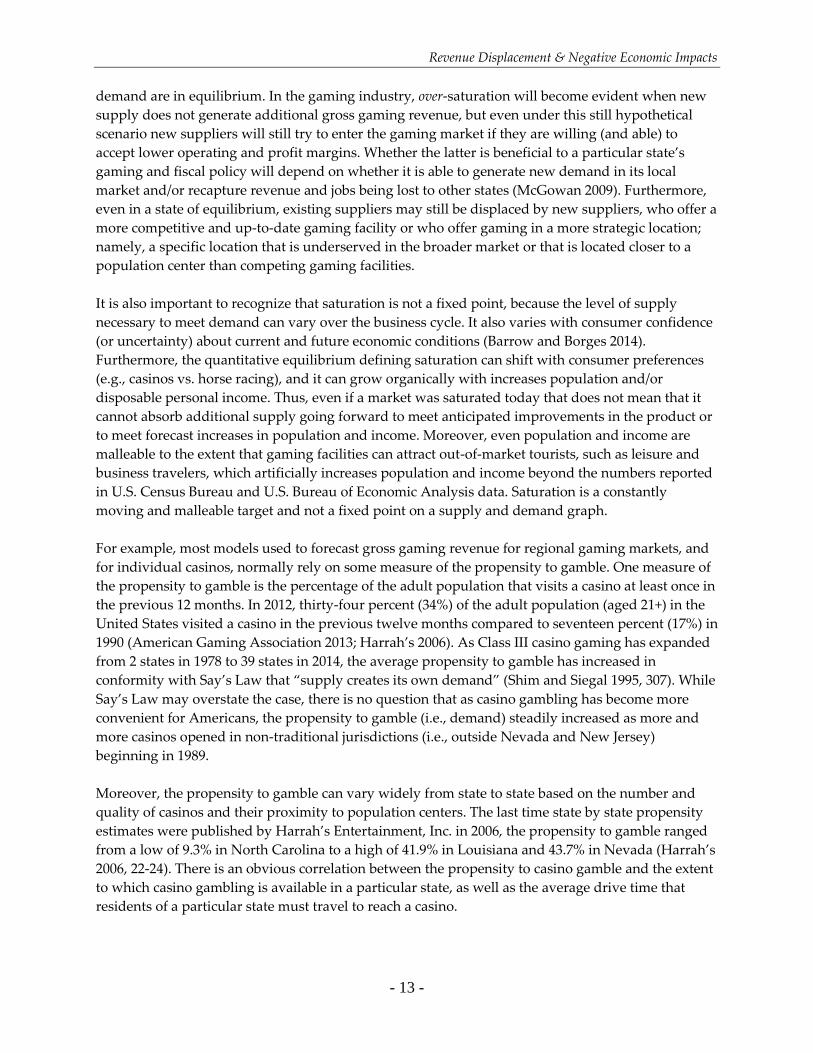
The robust growth, and the increase in competition among individual gaming facilities is visually
illustrated in Figure 4 and Figure 5. In 2004, there were 29 Class III gaming facilities in the Northeast
with 12 (41%) of them located in Atlantic City. The only significant competition for Atlantic City
casinos were Foxwoods Resort Casino and Mohegan Sun Casino in Connecticut -- roughly a 3 to 3 ½
drive from Atlantic City. There are now 64 Class III gaming establishments in the Northeast, which
now constitute a $17.0 billion industry (see Table 2).
31 I have stated previously that “the level of competition will continue to escalate, because at this point, table games and slot machines are just like a commodity – like copper and aluminum,” quoted in Wittkowski (2013). This means that competitive advantage is shifting to the quality and diversity of offerings and even in Atlantic City non-gaming revenues have been increasing as gaming revenues fall, see, Kramer and Ianieri (2014). 32 Associated Press, “Mohegan Sun Delaying Expansion Plans,” see, http://www.fox61.com/pages/landing/?Mohegan-Sun-delaying-expansion-plans=1&blockID=65412&feedID=341 33 Monopolies are able to generate rents, which is defined as “excess income” received over the minimum amount necessary to justify an investment in the resource, operation, function, or activity, see Shim and Siegel (1995, 297). As an industry moves from monopoly to competition, profit levels will gravitate toward the minimum necessary to justify an investment in that operation as compared to some other alternative economic activity.
Revenue Displacement & Negative Economic Impacts
- 12 -
Figure 4
Figure 5
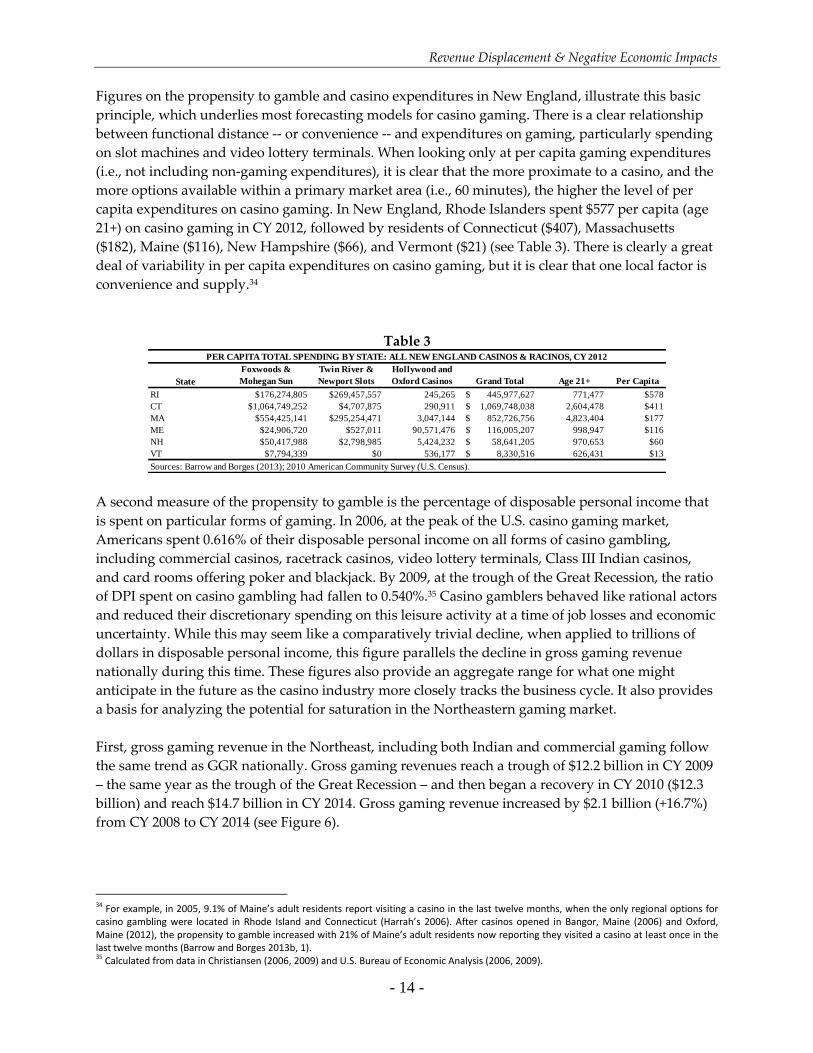
Table 2
Slot Win Other Gaming Total Gaming NonGaming Gross Revenue
Connecticut $1,067,471,619 $468,455,744 $1,535,927,363 $387,084,414 $1,923,011,777
Rhode Island $510,999,169 $98,928,174 $609,927,343 $57,333,170 $667,260,513
Maine $104,778,626 $22,491,002 $127,269,628 $10,690,649 $137,960,277
Delaware $352,146,100 $51,295,664 $403,441,764 $41,957,943 $445,399,707
Maryland $628,794,028 $302,288,990 $931,083,018 $107,074,547 $1,038,157,565
New Jersey $1,874,715,209 $708,217,702 $2,582,932,911 $896,277,720 $3,479,210,631
New York (VLTS) $1,898,335,717 $0 $1,898,335,717 $144,273,514 $2,042,609,231
New York (Indian) N/A N/A $1,056,600,000 $124,200,000 $1,180,800,000
Ohio $1,148,068,043 $273,801,869 $1,421,869,912 $147,874,471 $1,569,744,383
Pennsylvania $2,319,534,380 $749,507,225 $3,069,041,605 $288,489,911 $3,357,531,516
West Virginia $947,000,314 $143,322,083 $1,090,322,397 $103,580,628 $1,193,903,025
GRAND TOTAL $10,851,843,205 $2,818,308,453 $14,726,751,658 $2,308,836,968 $17,035,588,626
TOTAL CASINO EXPENDITURES IN THE NORTHEAST, CY 2014
Sources: State gaming regulatory commissions; Meister, Indian Gaming Indusry Report, 2011-2014 ; U.S. SEC 10-K Filings; Pyramid Associates, LLC (2015).
The regional industry supply will continue to grow as Pennsylvania builds an additional casino in
Philadelphia; New York builds three resort casinos in upstate and western New York; Massachusetts
opens at least two resort casinos and a slot parlor, and Maryland adds a casino in National Harbor.
This means that by the end of calendar year 2017, it is entirely possible, if not likely, that there will
be 75 Class III casinos in the Northeast, with many of the planned and proposed facilities located
closer to major population and income centers, such as Baltimore, Boston, Philadelphia, New York
City, and Washington, D.C.
Competitive Growth is the Future
The rapid and continuing expansion of gaming supply in the Northeast has made “market
saturation” a salient point of public policy debate in many state legislatures and the media. In fact,
the real debate should not be about saturation, but about the question of oversaturation. Market
saturation is defined as “the point of a product life cycle where the market has been completely
filled so that no more sales for goods and services can be taken up” by additional supply or by new
producers (Shim and Seigel 1995, 306). In simple terms, saturation is the point where supply and
Revenue Displacement & Negative Economic Impacts
- 13 -
demand are in equilibrium. In the gaming industry, over-saturation will become evident when new
supply does not generate additional gross gaming revenue, but even under this still hypothetical
scenario new suppliers will still try to enter the gaming market if they are willing (and able) to
accept lower operating and profit margins. Whether the latter is beneficial to a particular state’s
gaming and fiscal policy will depend on whether it is able to generate new demand in its local
market and/or recapture revenue and jobs being lost to other states (McGowan 2009). Furthermore,
even in a state of equilibrium, existing suppliers may still be displaced by new suppliers, who offer a
more competitive and up-to-date gaming facility or who offer gaming in a more strategic location;
namely, a specific location that is underserved in the broader market or that is located closer to a
population center than competing gaming facilities.
It is also important to recognize that saturation is not a fixed point, because the level of supply
necessary to meet demand can vary over the business cycle. It also varies with consumer confidence
(or uncertainty) about current and future economic conditions (Barrow and Borges 2014).
Furthermore, the quantitative equilibrium defining saturation can shift with consumer preferences
(e.g., casinos vs. horse racing), and it can grow organically with increases population and/or
disposable personal income. Thus, even if a market was saturated today that does not mean that it
cannot absorb additional supply going forward to meet anticipated improvements in the product or
to meet forecast increases in population and income. Moreover, even population and income are
malleable to the extent that gaming facilities can attract out-of-market tourists, such as leisure and
business travelers, which artificially increases population and income beyond the numbers reported
in U.S. Census Bureau and U.S. Bureau of Economic Analysis data. Saturation is a constantly
moving and malleable target and not a fixed point on a supply and demand graph.
For example, most models used to forecast gross gaming revenue for regional gaming markets, and
for individual casinos, normally rely on some measure of the propensity to gamble. One measure of
the propensity to gamble is the percentage of the adult population that visits a casino at least once in
the previous 12 months. In 2012, thirty-four percent (34%) of the adult population (aged 21+) in the
United States visited a casino in the previous twelve months compared to seventeen percent (17%) in
1990 (American Gaming Association 2013; Harrah’s 2006). As Class III casino gaming has expanded
from 2 states in 1978 to 39 states in 2014, the average propensity to gamble has increased in
conformity with Say’s Law that “supply creates its own demand” (Shim and Siegal 1995, 307). While
Say’s Law may overstate the case, there is no question that as casino gambling has become more
convenient for Americans, the propensity to gamble (i.e., demand) steadily increased as more and
more casinos opened in non-traditional jurisdictions (i.e., outside Nevada and New Jersey)
beginning in 1989.
Moreover, the propensity to gamble can vary widely from state to state based on the number and
quality of casinos and their proximity to population centers. The last time state by state propensity
estimates were published by Harrah’s Entertainment, Inc. in 2006, the propensity to gamble ranged
from a low of 9.3% in North Carolina to a high of 41.9% in Louisiana and 43.7% in Nevada (Harrah’s
2006, 22-24). There is an obvious correlation between the propensity to casino gamble and the extent
to which casino gambling is available in a particular state, as well as the average drive time that
residents of a particular state must travel to reach a casino.
Revenue Displacement & Negative Economic Impacts
- 14 -
Figures on the propensity to gamble and casino expenditures in New England, illustrate this basic
principle, which underlies most forecasting models for casino gaming. There is a clear relationship
between functional distance -- or convenience -- and expenditures on gaming, particularly spending
on slot machines and video lottery terminals. When looking only at per capita gaming expenditures
(i.e., not including non-gaming expenditures), it is clear that the more proximate to a casino, and the
more options available within a primary market area (i.e., 60 minutes), the higher the level of per
capita expenditures on casino gaming. In New England, Rhode Islanders spent $577 per capita (age
21+) on casino gaming in CY 2012, followed by residents of Connecticut ($407), Massachusetts
($182), Maine ($116), New Hampshire ($66), and Vermont ($21) (see Table 3). There is clearly a great
deal of variability in per capita expenditures on casino gaming, but it is clear that one local factor is
convenience and supply.34
Table 3
State
Foxwoods &
Mohegan Sun
Twin River &
Newport Slots
Hollywood and
Oxford Casinos Grand Total Age 21+ Per Capita
RI $176,274,805 $269,457,557 245,265 445,977,627$ 771,477 $578
CT $1,064,749,252 $4,707,875 290,911 1,069,748,038$ 2,604,478 $411
MA $554,425,141 $295,254,471 3,047,144 852,726,756$ 4,823,404 $177
ME $24,906,720 $527,011 90,571,476 116,005,207$ 998,947 $116
NH $50,417,988 $2,798,985 5,424,232 58,641,205$ 970,653 $60
VT $7,794,339 $0 536,177 8,330,516$ 626,431 $13
PER CAPITA TOTAL SPENDING BY STATE: ALL NEW ENGLAND CASINOS & RACINOS, CY 2012
Sources: Barrow and Borges (2013); 2010 American Community Survey (U.S. Census).
A second measure of the propensity to gamble is the percentage of disposable personal income that
is spent on particular forms of gaming. In 2006, at the peak of the U.S. casino gaming market,
Americans spent 0.616% of their disposable personal income on all forms of casino gambling,
including commercial casinos, racetrack casinos, video lottery terminals, Class III Indian casinos,
and card rooms offering poker and blackjack. By 2009, at the trough of the Great Recession, the ratio
of DPI spent on casino gambling had fallen to 0.540%.35 Casino gamblers behaved like rational actors
and reduced their discretionary spending on this leisure activity at a time of job losses and economic
uncertainty. While this may seem like a comparatively trivial decline, when applied to trillions of
dollars in disposable personal income, this figure parallels the decline in gross gaming revenue
nationally during this time. These figures also provide an aggregate range for what one might
anticipate in the future as the casino industry more closely tracks the business cycle. It also provides
a basis for analyzing the potential for saturation in the Northeastern gaming market.
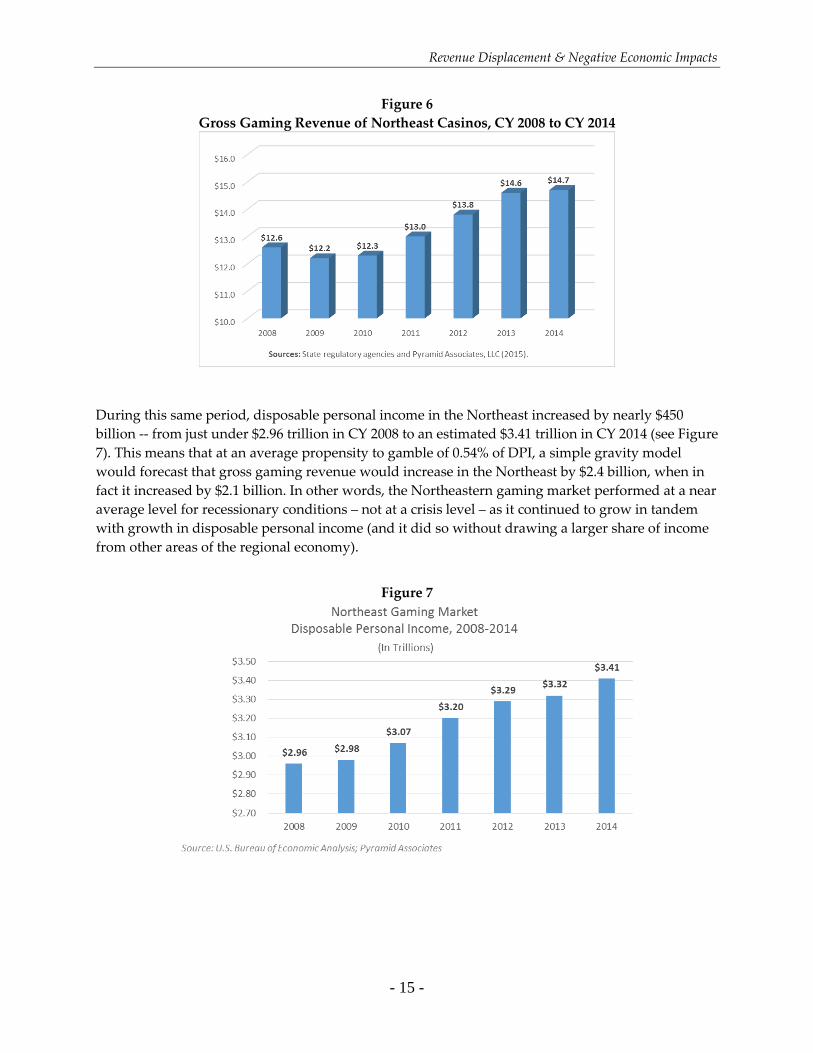
First, gross gaming revenue in the Northeast, including both Indian and commercial gaming follow
the same trend as GGR nationally. Gross gaming revenues reach a trough of $12.2 billion in CY 2009
– the same year as the trough of the Great Recession – and then began a recovery in CY 2010 ($12.3
billion) and reach $14.7 billion in CY 2014. Gross gaming revenue increased by $2.1 billion (+16.7%)
from CY 2008 to CY 2014 (see Figure 6).
34 For example, in 2005, 9.1% of Maine’s adult residents report visiting a casino in the last twelve months, when the only regional options for casino gambling were located in Rhode Island and Connecticut (Harrah’s 2006). After casinos opened in Bangor, Maine (2006) and Oxford, Maine (2012), the propensity to gamble increased with 21% of Maine’s adult residents now reporting they visited a casino at least once in the last twelve months (Barrow and Borges 2013b, 1). 35 Calculated from data in Christiansen (2006, 2009) and U.S. Bureau of Economic Analysis (2006, 2009).
Revenue Displacement & Negative Economic Impacts
- 15 -
Figure 6
Gross Gaming Revenue of Northeast Casinos, CY 2008 to CY 2014
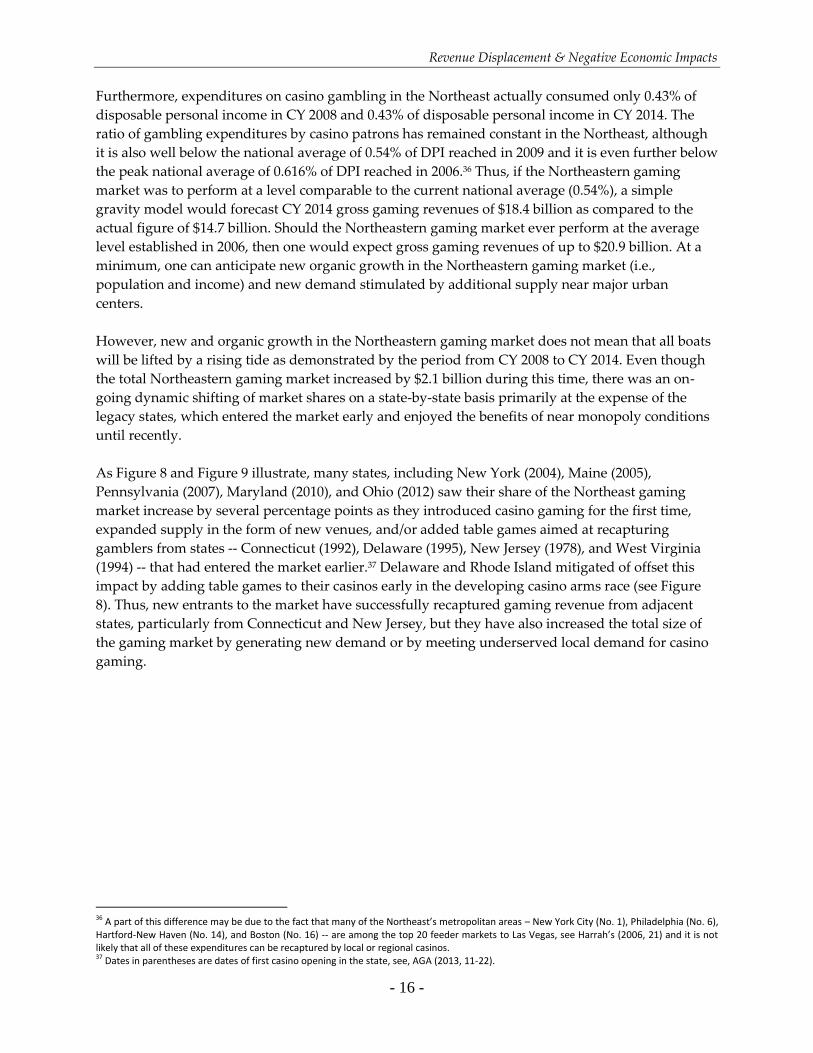
During this same period, disposable personal income in the Northeast increased by nearly $450
billion -- from just under $2.96 trillion in CY 2008 to an estimated $3.41 trillion in CY 2014 (see Figure
7). This means that at an average propensity to gamble of 0.54% of DPI, a simple gravity model
would forecast that gross gaming revenue would increase in the Northeast by $2.4 billion, when in
fact it increased by $2.1 billion. In other words, the Northeastern gaming market performed at a near
average level for recessionary conditions – not at a crisis level – as it continued to grow in tandem
with growth in disposable personal income (and it did so without drawing a larger share of income
from other areas of the regional economy).
Figure 7
Revenue Displacement & Negative Economic Impacts
- 16 -
Furthermore, expenditures on casino gambling in the Northeast actually consumed only 0.43% of
disposable personal income in CY 2008 and 0.43% of disposable personal income in CY 2014. The
ratio of gambling expenditures by casino patrons has remained constant in the Northeast, although
it is also well below the national average of 0.54% of DPI reached in 2009 and it is even further below
the peak national average of 0.616% of DPI reached in 2006.36 Thus, if the Northeastern gaming
market was to perform at a level comparable to the current national average (0.54%), a simple
gravity model would forecast CY 2014 gross gaming revenues of $18.4 billion as compared to the
actual figure of $14.7 billion. Should the Northeastern gaming market ever perform at the average
level established in 2006, then one would expect gross gaming revenues of up to $20.9 billion. At a
minimum, one can anticipate new organic growth in the Northeastern gaming market (i.e.,
population and income) and new demand stimulated by additional supply near major urban
centers.
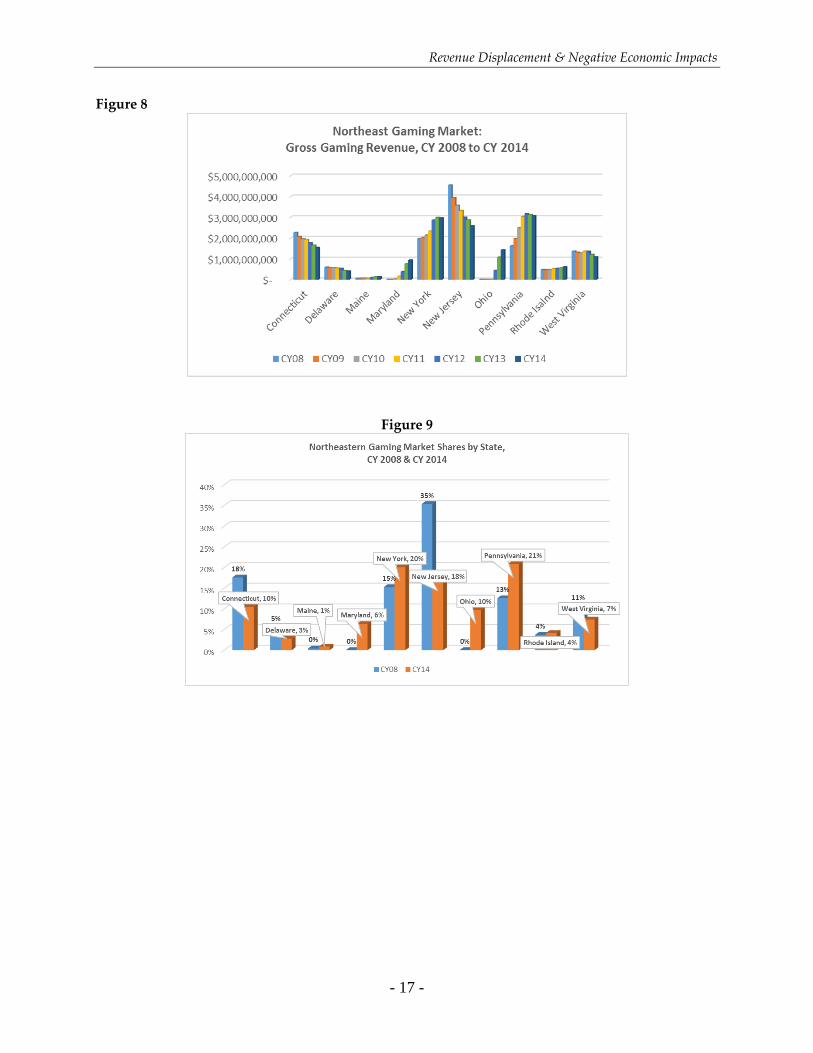
However, new and organic growth in the Northeastern gaming market does not mean that all boats
will be lifted by a rising tide as demonstrated by the period from CY 2008 to CY 2014. Even though
the total Northeastern gaming market increased by $2.1 billion during this time, there was an on-
going dynamic shifting of market shares on a state-by-state basis primarily at the expense of the
legacy states, which entered the market early and enjoyed the benefits of near monopoly conditions
until recently.
As Figure 8 and Figure 9 illustrate, many states, including New York (2004), Maine (2005),
Pennsylvania (2007), Maryland (2010), and Ohio (2012) saw their share of the Northeast gaming
market increase by several percentage points as they introduced casino gaming for the first time,
expanded supply in the form of new venues, and/or added table games aimed at recapturing
gamblers from states -- Connecticut (1992), Delaware (1995), New Jersey (1978), and West Virginia
(1994) -- that had entered the market earlier.37 Delaware and Rhode Island mitigated of offset this
impact by adding table games to their casinos early in the developing casino arms race (see Figure
8). Thus, new entrants to the market have successfully recaptured gaming revenue from adjacent
states, particularly from Connecticut and New Jersey, but they have also increased the total size of
the gaming market by generating new demand or by meeting underserved local demand for casino
gaming.
36 A part of this difference may be due to the fact that many of the Northeast’s metropolitan areas – New York City (No. 1), Philadelphia (No. 6), Hartford-New Haven (No. 14), and Boston (No. 16) -- are among the top 20 feeder markets to Las Vegas, see Harrah’s (2006, 21) and it is not likely that all of these expenditures can be recaptured by local or regional casinos. 37 Dates in parentheses are dates of first casino opening in the state, see, AGA (2013, 11-22).
Revenue Displacement & Negative Economic Impacts
- 17 -
Figure 8
Figure 9
Revenue Displacement & Negative Economic Impacts
- 18 -
Historical Impact of Expanded Gaming on Connecticut Casinos
Foxwoods Resort Casino and Mohegan Sun Casino were the two largest casinos in the world until
2010, when Resorts World Senosa and Marina Bay Sands opened in Singapore. Until recently, the
Connecticut’s two behemoth casinos remained the largest in the Western Hemisphere until they
were quietly surpassed by WinStar World Resort in Thackerville, Oklahoma. This change in status
occurred not only because newer and larger casinos have been constructed elsewhere in the world,
but because increased gaming competition in the Northeast, as well as the lingering impact of the
Great Recession, has resulted in eight consecutive year-to-year declines in gross gaming revenue
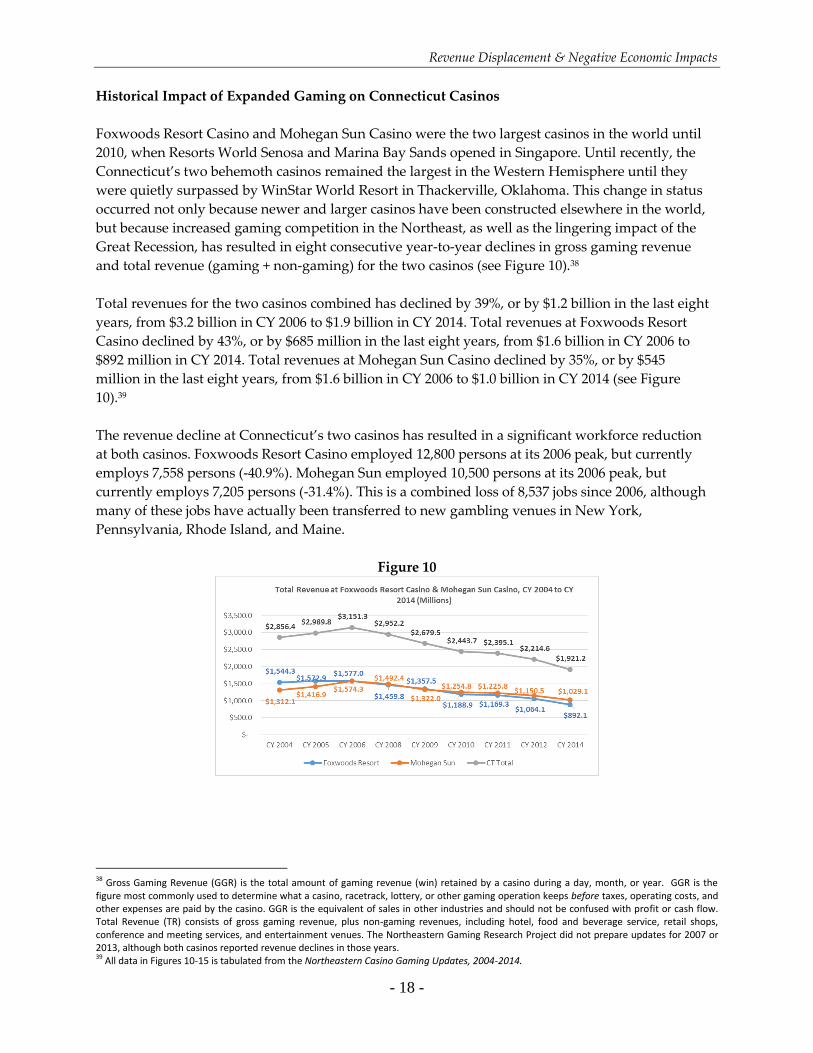
and total revenue (gaming + non-gaming) for the two casinos (see Figure 10).38
Total revenues for the two casinos combined has declined by 39%, or by $1.2 billion in the last eight
years, from $3.2 billion in CY 2006 to $1.9 billion in CY 2014. Total revenues at Foxwoods Resort
Casino declined by 43%, or by $685 million in the last eight years, from $1.6 billion in CY 2006 to
$892 million in CY 2014. Total revenues at Mohegan Sun Casino declined by 35%, or by $545
million in the last eight years, from $1.6 billion in CY 2006 to $1.0 billion in CY 2014 (see Figure
10).39
The revenue decline at Connecticut’s two casinos has resulted in a significant workforce reduction
at both casinos. Foxwoods Resort Casino employed 12,800 persons at its 2006 peak, but currently
employs 7,558 persons (-40.9%). Mohegan Sun employed 10,500 persons at its 2006 peak, but
currently employs 7,205 persons (-31.4%). This is a combined loss of 8,537 jobs since 2006, although
many of these jobs have actually been transferred to new gambling venues in New York,
Pennsylvania, Rhode Island, and Maine.
Figure 10
38 Gross Gaming Revenue (GGR) is the total amount of gaming revenue (win) retained by a casino during a day, month, or year. GGR is the figure most commonly used to determine what a casino, racetrack, lottery, or other gaming operation keeps before taxes, operating costs, and other expenses are paid by the casino. GGR is the equivalent of sales in other industries and should not be confused with profit or cash flow. Total Revenue (TR) consists of gross gaming revenue, plus non-gaming revenues, including hotel, food and beverage service, retail shops, conference and meeting services, and entertainment venues. The Northeastern Gaming Research Project did not prepare updates for 2007 or 2013, although both casinos reported revenue declines in those years. 39 All data in Figures 10-15 is tabulated from the Northeastern Casino Gaming Updates, 2004-2014.
Revenue Displacement & Negative Economic Impacts
- 19 -
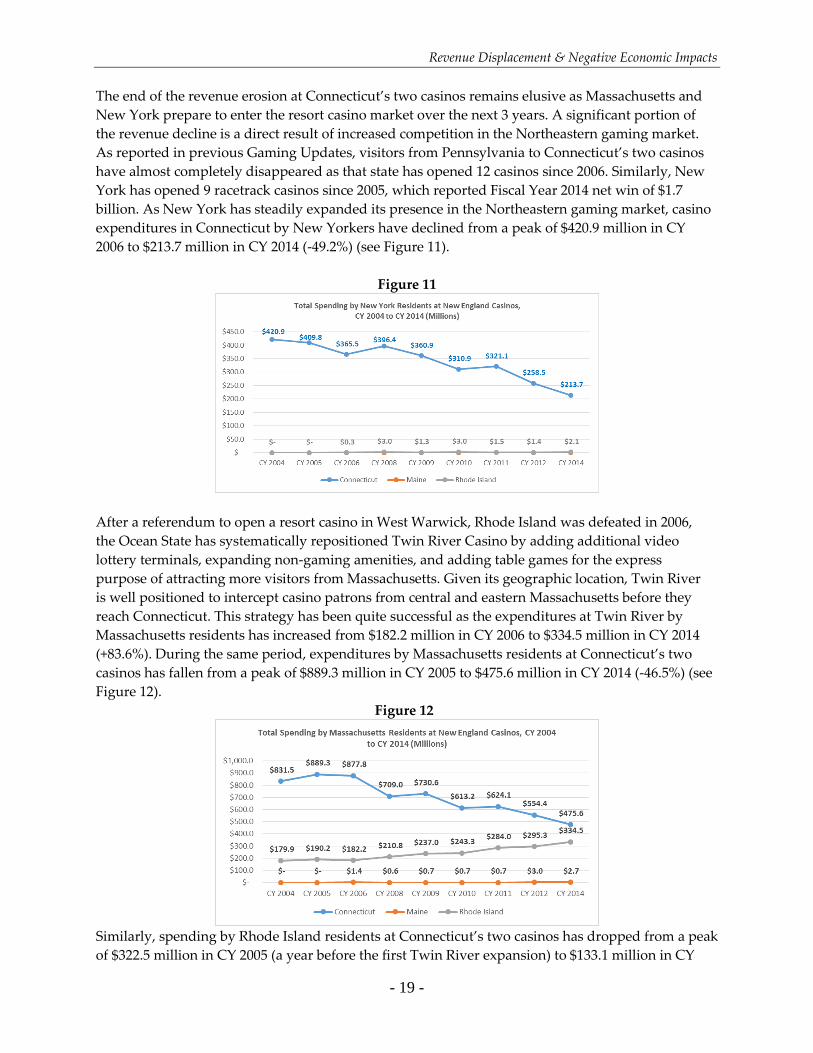
The end of the revenue erosion at Connecticut’s two casinos remains elusive as Massachusetts and
New York prepare to enter the resort casino market over the next 3 years. A significant portion of
the revenue decline is a direct result of increased competition in the Northeastern gaming market.
As reported in previous Gaming Updates, visitors from Pennsylvania to Connecticut’s two casinos
have almost completely disappeared as that state has opened 12 casinos since 2006. Similarly, New
York has opened 9 racetrack casinos since 2005, which reported Fiscal Year 2014 net win of $1.7
billion. As New York has steadily expanded its presence in the Northeastern gaming market, casino
expenditures in Connecticut by New Yorkers have declined from a peak of $420.9 million in CY
2006 to $213.7 million in CY 2014 (-49.2%) (see Figure 11).
Figure 11
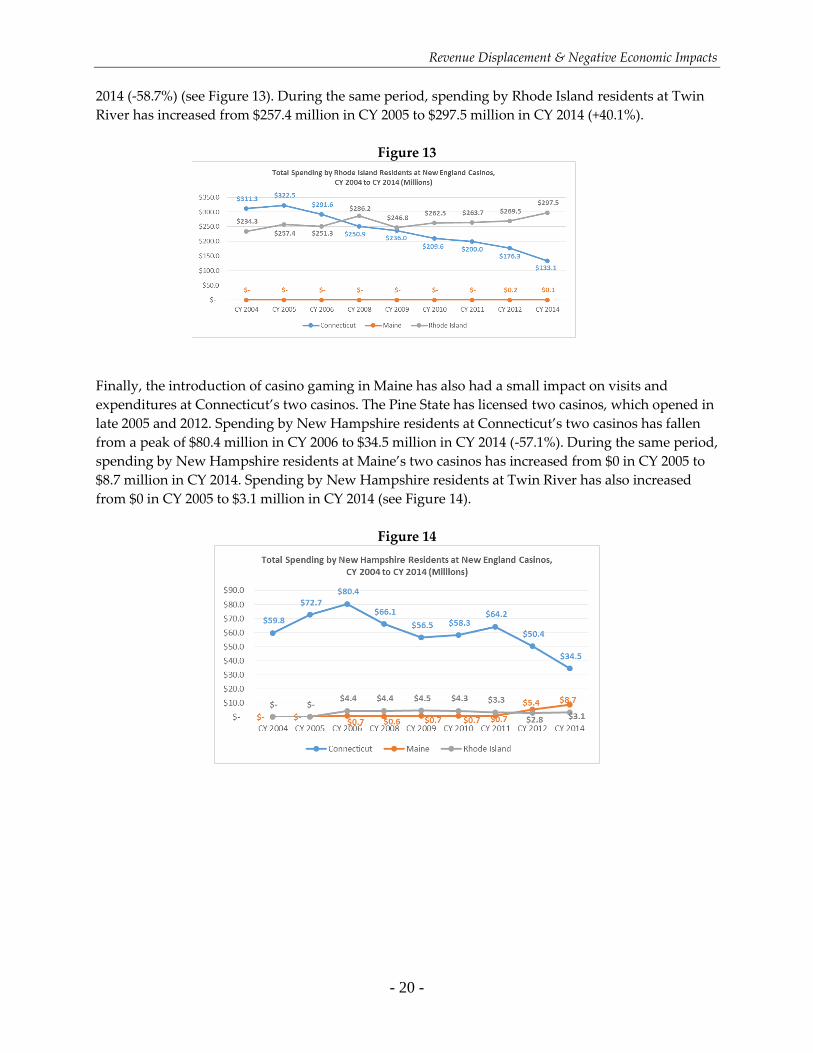
After a referendum to open a resort casino in West Warwick, Rhode Island was defeated in 2006,
the Ocean State has systematically repositioned Twin River Casino by adding additional video
lottery terminals, expanding non-gaming amenities, and adding table games for the express
purpose of attracting more visitors from Massachusetts. Given its geographic location, Twin River
is well positioned to intercept casino patrons from central and eastern Massachusetts before they
reach Connecticut. This strategy has been quite successful as the expenditures at Twin River by
Massachusetts residents has increased from $182.2 million in CY 2006 to $334.5 million in CY 2014
(+83.6%). During the same period, expenditures by Massachusetts residents at Connecticut’s two
casinos has fallen from a peak of $889.3 million in CY 2005 to $475.6 million in CY 2014 (-46.5%) (see
Figure 12).
Figure 12
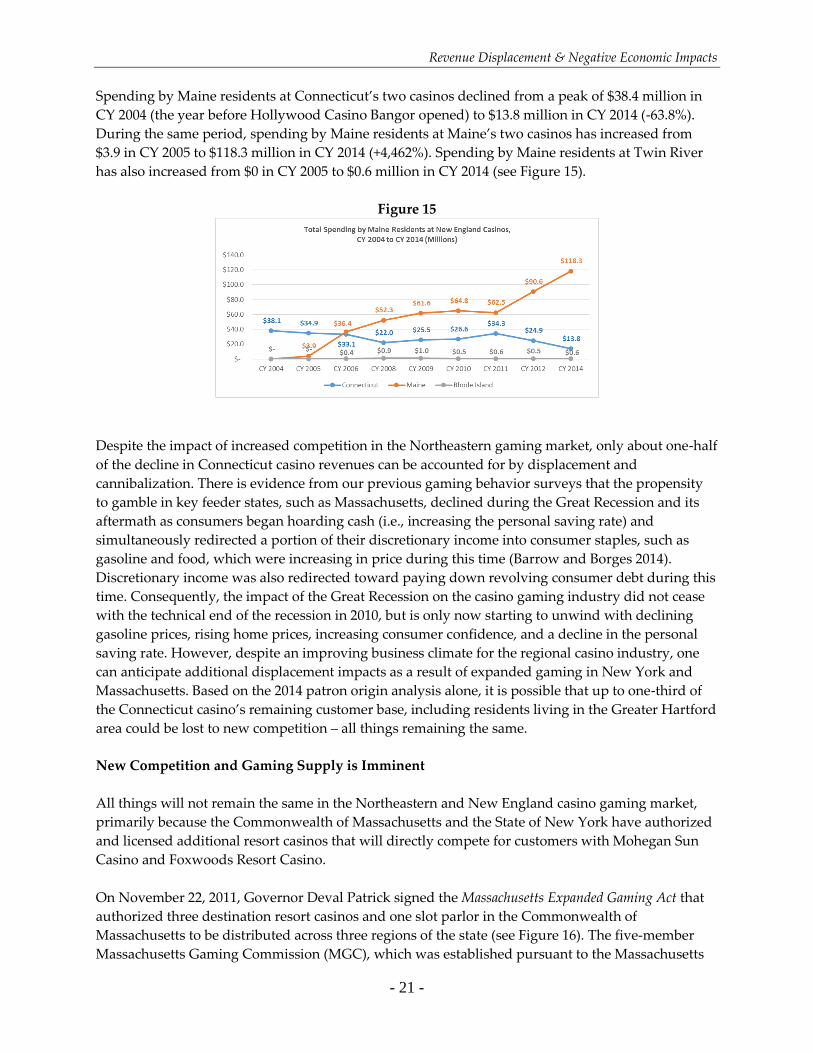
Similarly, spending by Rhode Island residents at Connecticut’s two casinos has dropped from a peak
of $322.5 million in CY 2005 (a year before the first Twin River expansion) to $133.1 million in CY
Revenue Displacement & Negative Economic Impacts
- 20 -
2014 (-58.7%) (see Figure 13). During the same period, spending by Rhode Island residents at Twin
River has increased from $257.4 million in CY 2005 to $297.5 million in CY 2014 (+40.1%).
Figure 13
Finally, the introduction of casino gaming in Maine has also had a small impact on visits and
expenditures at Connecticut’s two casinos. The Pine State has licensed two casinos, which opened in
late 2005 and 2012. Spending by New Hampshire residents at Connecticut’s two casinos has fallen
from a peak of $80.4 million in CY 2006 to $34.5 million in CY 2014 (-57.1%). During the same period,
spending by New Hampshire residents at Maine’s two casinos has increased from $0 in CY 2005 to
$8.7 million in CY 2014. Spending by New Hampshire residents at Twin River has also increased
from $0 in CY 2005 to $3.1 million in CY 2014 (see Figure 14).
Figure 14
Revenue Displacement & Negative Economic Impacts
- 21 -
Spending by Maine residents at Connecticut’s two casinos declined from a peak of $38.4 million in
CY 2004 (the year before Hollywood Casino Bangor opened) to $13.8 million in CY 2014 (-63.8%).
During the same period, spending by Maine residents at Maine’s two casinos has increased from
$3.9 in CY 2005 to $118.3 million in CY 2014 (+4,462%). Spending by Maine residents at Twin River
has also increased from $0 in CY 2005 to $0.6 million in CY 2014 (see Figure 15).
Figure 15
Despite the impact of increased competition in the Northeastern gaming market, only about one-half
of the decline in Connecticut casino revenues can be accounted for by displacement and
cannibalization. There is evidence from our previous gaming behavior surveys that the propensity
to gamble in key feeder states, such as Massachusetts, declined during the Great Recession and its
aftermath as consumers began hoarding cash (i.e., increasing the personal saving rate) and
simultaneously redirected a portion of their discretionary income into consumer staples, such as
gasoline and food, which were increasing in price during this time (Barrow and Borges 2014).
Discretionary income was also redirected toward paying down revolving consumer debt during this
time. Consequently, the impact of the Great Recession on the casino gaming industry did not cease
with the technical end of the recession in 2010, but is only now starting to unwind with declining
gasoline prices, rising home prices, increasing consumer confidence, and a decline in the personal
saving rate. However, despite an improving business climate for the regional casino industry, one
can anticipate additional displacement impacts as a result of expanded gaming in New York and
Massachusetts. Based on the 2014 patron origin analysis alone, it is possible that up to one-third of
the Connecticut casino’s remaining customer base, including residents living in the Greater Hartford
area could be lost to new competition – all things remaining the same.
New Competition and Gaming Supply is Imminent
All things will not remain the same in the Northeastern and New England casino gaming market,
primarily because the Commonwealth of Massachusetts and the State of New York have authorized
and licensed additional resort casinos that will directly compete for customers with Mohegan Sun
Casino and Foxwoods Resort Casino.
On November 22, 2011, Governor Deval Patrick signed the Massachusetts Expanded Gaming Act that
authorized three destination resort casinos and one slot parlor in the Commonwealth of
Massachusetts to be distributed across three regions of the state (see Figure 16). The five-member
Massachusetts Gaming Commission (MGC), which was established pursuant to the Massachusetts
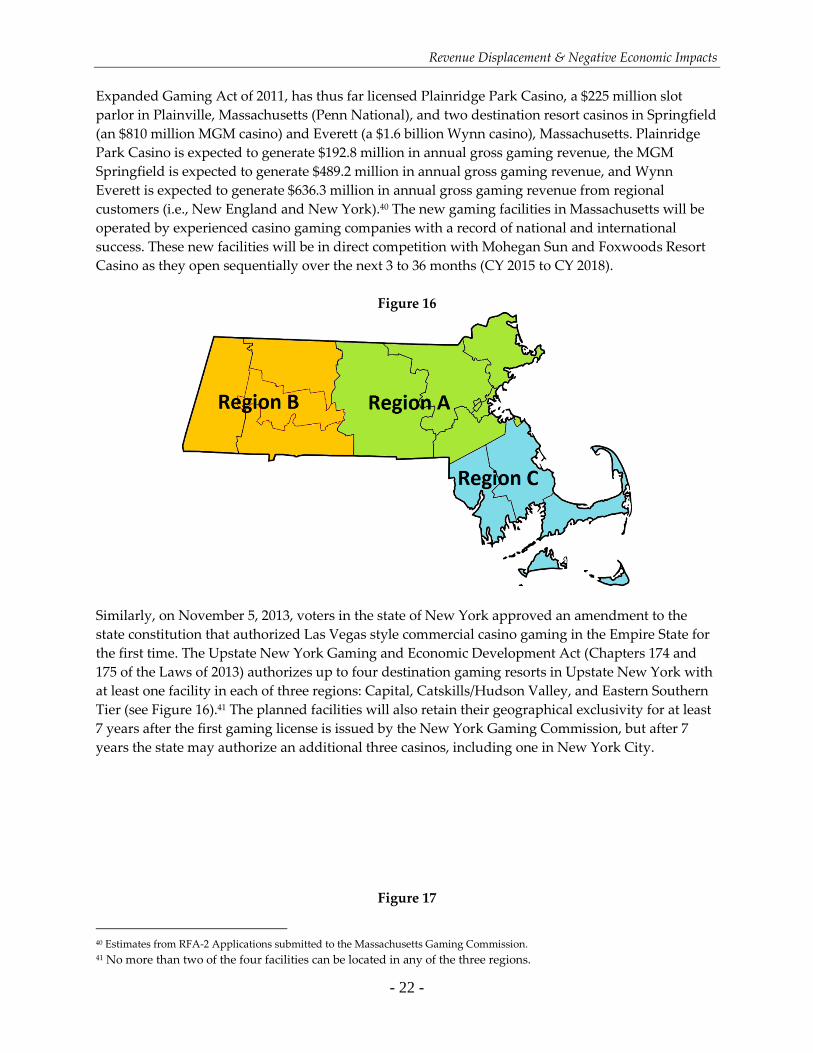
Revenue Displacement & Negative Economic Impacts
- 22 -
Expanded Gaming Act of 2011, has thus far licensed Plainridge Park Casino, a $225 million slot
parlor in Plainville, Massachusetts (Penn National), and two destination resort casinos in Springfield
(an $810 million MGM casino) and Everett (a $1.6 billion Wynn casino), Massachusetts. Plainridge
Park Casino is expected to generate $192.8 million in annual gross gaming revenue, the MGM
Springfield is expected to generate $489.2 million in annual gross gaming revenue, and Wynn
Everett is expected to generate $636.3 million in annual gross gaming revenue from regional
customers (i.e., New England and New York).40 The new gaming facilities in Massachusetts will be
operated by experienced casino gaming companies with a record of national and international
success. These new facilities will be in direct competition with Mohegan Sun and Foxwoods Resort
Casino as they open sequentially over the next 3 to 36 months (CY 2015 to CY 2018).
Figure 16
Similarly, on November 5, 2013, voters in the state of New York approved an amendment to the
state constitution that authorized Las Vegas style commercial casino gaming in the Empire State for
the first time. The Upstate New York Gaming and Economic Development Act (Chapters 174 and
175 of the Laws of 2013) authorizes up to four destination gaming resorts in Upstate New York with
at least one facility in each of three regions: Capital, Catskills/Hudson Valley, and Eastern Southern
Tier (see Figure 16).41 The planned facilities will also retain their geographical exclusivity for at least
7 years after the first gaming license is issued by the New York Gaming Commission, but after 7
years the state may authorize an additional three casinos, including one in New York City.
Figure 17
40 Estimates from RFA-2 Applications submitted to the Massachusetts Gaming Commission. 41 No more than two of the four facilities can be located in any of the three regions.
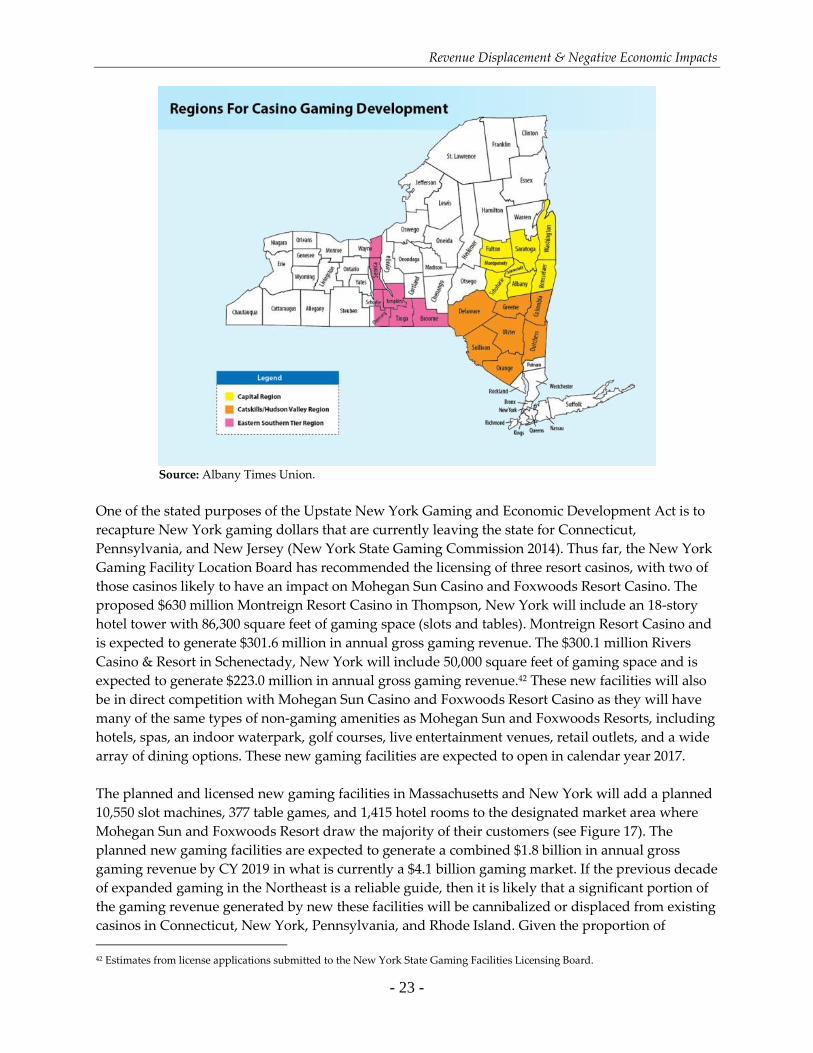
Revenue Displacement & Negative Economic Impacts
- 23 -
Source: Albany Times Union.
One of the stated purposes of the Upstate New York Gaming and Economic Development Act is to
recapture New York gaming dollars that are currently leaving the state for Connecticut,
Pennsylvania, and New Jersey (New York State Gaming Commission 2014). Thus far, the New York
Gaming Facility Location Board has recommended the licensing of three resort casinos, with two of
those casinos likely to have an impact on Mohegan Sun Casino and Foxwoods Resort Casino. The
proposed $630 million Montreign Resort Casino in Thompson, New York will include an 18-story
hotel tower with 86,300 square feet of gaming space (slots and tables). Montreign Resort Casino and
is expected to generate $301.6 million in annual gross gaming revenue. The $300.1 million Rivers
Casino & Resort in Schenectady, New York will include 50,000 square feet of gaming space and is
expected to generate $223.0 million in annual gross gaming revenue.42 These new facilities will also
be in direct competition with Mohegan Sun Casino and Foxwoods Resort Casino as they will have
many of the same types of non-gaming amenities as Mohegan Sun and Foxwoods Resorts, including
hotels, spas, an indoor waterpark, golf courses, live entertainment venues, retail outlets, and a wide
array of dining options. These new gaming facilities are expected to open in calendar year 2017.
The planned and licensed new gaming facilities in Massachusetts and New York will add a planned
10,550 slot machines, 377 table games, and 1,415 hotel rooms to the designated market area where
Mohegan Sun and Foxwoods Resort draw the majority of their customers (see Figure 17). The
planned new gaming facilities are expected to generate a combined $1.8 billion in annual gross
gaming revenue by CY 2019 in what is currently a $4.1 billion gaming market. If the previous decade
of expanded gaming in the Northeast is a reliable guide, then it is likely that a significant portion of
the gaming revenue generated by new these facilities will be cannibalized or displaced from existing
casinos in Connecticut, New York, Pennsylvania, and Rhode Island. Given the proportion of
42 Estimates from license applications submitted to the New York State Gaming Facilities Licensing Board.
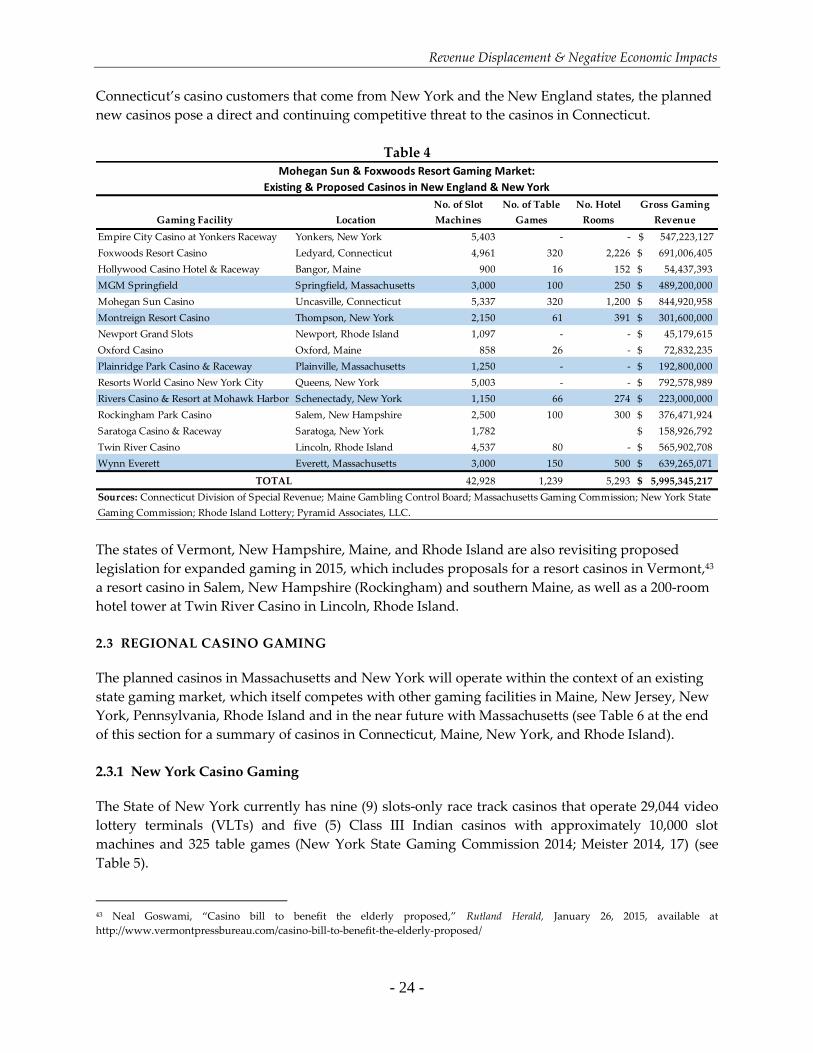
Revenue Displacement & Negative Economic Impacts
- 24 -
Connecticut’s casino customers that come from New York and the New England states, the planned
new casinos pose a direct and continuing competitive threat to the casinos in Connecticut.
Table 4
Gaming Facility Location
No. of Slot
Machines
No. of Table
Games
No. Hotel
Rooms
Gross Gaming
Revenue
Empire City Casino at Yonkers Raceway Yonkers, New York 5,403 - - $ 547,223,127
Foxwoods Resort Casino Ledyard, Connecticut 4,961 320 2,226 691,006,405$
Hollywood Casino Hotel & Raceway Bangor, Maine 900 16 152 54,437,393$
MGM Springfield Springfield, Massachusetts 3,000 100 250 489,200,000$
Mohegan Sun Casino Uncasville, Connecticut 5,337 320 1,200 844,920,958$
Montreign Resort Casino Thompson, New York 2,150 61 391 301,600,000$
Newport Grand Slots Newport, Rhode Island 1,097 - - 45,179,615$
Oxford Casino Oxford, Maine 858 26 - 72,832,235$
Plainridge Park Casino & Raceway Plainville, Massachusetts 1,250 - - 192,800,000$
Resorts World Casino New York City Queens, New York 5,003 - - 792,578,989$
Rivers Casino & Resort at Mohawk Harbor Schenectady, New York 1,150 66 274 223,000,000$
Rockingham Park Casino Salem, New Hampshire 2,500 100 300 376,471,924$
Saratoga Casino & Raceway Saratoga, New York 1,782 158,926,792$
Twin River Casino Lincoln, Rhode Island 4,537 80 - 565,902,708$
Wynn Everett Everett, Massachusetts 3,000 150 500 639,265,071$
TOTAL 42,928 1,239 5,293 5,995,345,217$
Sources: Connecticut Division of Special Revenue; Maine Gambling Control Board; Massachusetts Gaming Commission; New York State
Gaming Commission; Rhode Island Lottery; Pyramid Associates, LLC.
Mohegan Sun & Foxwoods Resort Gaming Market:
Existing & Proposed Casinos in New England & New York
The states of Vermont, New Hampshire, Maine, and Rhode Island are also revisiting proposed
legislation for expanded gaming in 2015, which includes proposals for a resort casinos in Vermont,43
a resort casino in Salem, New Hampshire (Rockingham) and southern Maine, as well as a 200-room
hotel tower at Twin River Casino in Lincoln, Rhode Island.
2.3 REGIONAL CASINO GAMING
The planned casinos in Massachusetts and New York will operate within the context of an existing
state gaming market, which itself competes with other gaming facilities in Maine, New Jersey, New
York, Pennsylvania, Rhode Island and in the near future with Massachusetts (see Table 6 at the end
of this section for a summary of casinos in Connecticut, Maine, New York, and Rhode Island).
2.3.1 New York Casino Gaming
The State of New York currently has nine (9) slots-only race track casinos that operate 29,044 video
lottery terminals (VLTs) and five (5) Class III Indian casinos with approximately 10,000 slot
machines and 325 table games (New York State Gaming Commission 2014; Meister 2014, 17) (see
Table 5).
43 Neal Goswami, “Casino bill to benefit the elderly proposed,” Rutland Herald, January 26, 2015, available at
http://www.vermontpressbureau.com/casino-bill-to-benefit-the-elderly-proposed/
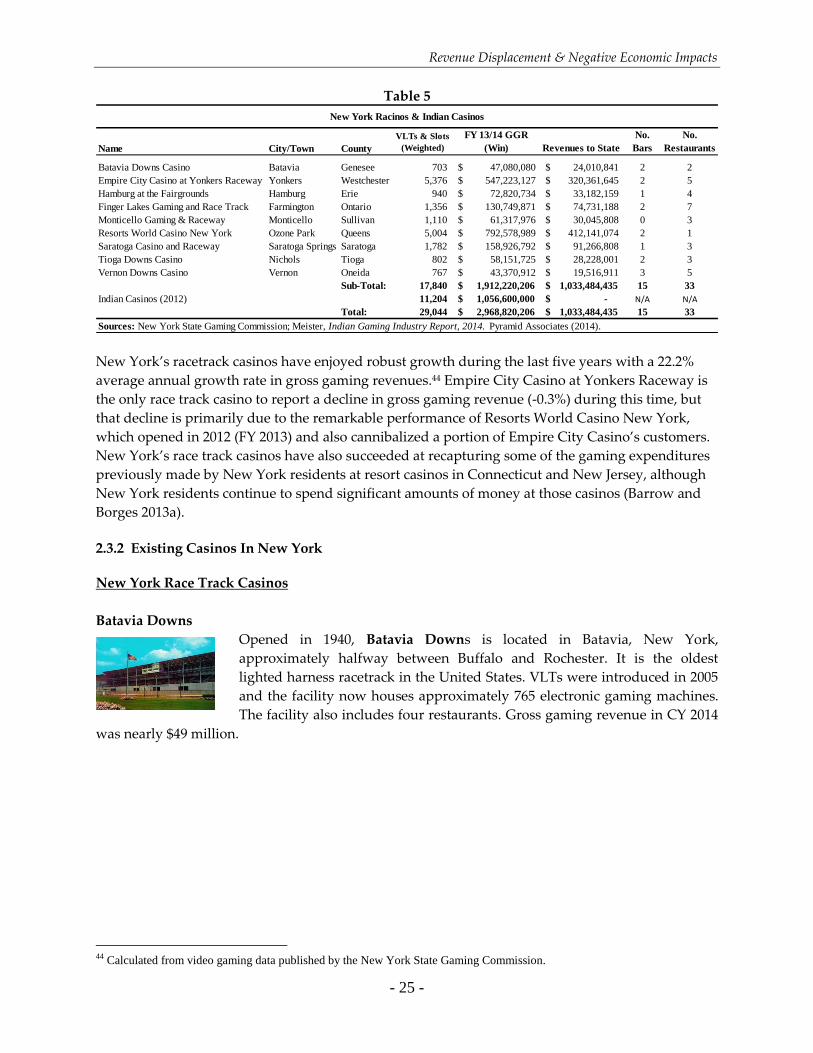
Revenue Displacement & Negative Economic Impacts
- 25 -
Table 5
Name City/Town County
VLTs & Slots
(Weighted)
FY 13/14 GGR
(Win) Revenues to State
No.
Bars
No.
Restaurants
Batavia Downs Casino Batavia Genesee 703 47,080,080$ 24,010,841$ 2 2
Empire City Casino at Yonkers Raceway Yonkers Westchester 5,376 547,223,127$ 320,361,645$ 2 5
Hamburg at the Fairgrounds Hamburg Erie 940 72,820,734$ 33,182,159$ 1 4
Finger Lakes Gaming and Race Track Farmington Ontario 1,356 130,749,871$ 74,731,188$ 2 7
Monticello Gaming & Raceway Monticello Sullivan 1,110 61,317,976$ 30,045,808$ 0 3
Resorts World Casino New York Ozone Park Queens 5,004 792,578,989$ 412,141,074$ 2 1
Saratoga Casino and Raceway Saratoga Springs Saratoga 1,782 158,926,792$ 91,266,808$ 1 3
Tioga Downs Casino Nichols Tioga 802 58,151,725$ 28,228,001$ 2 3
Vernon Downs Casino Vernon Oneida 767 43,370,912$ 19,516,911$ 3 5
Sub-Total: 17,840 1,912,220,206$ 1,033,484,435$ 15 33
Indian Casinos (2012) 11,204 1,056,600,000$ -$ N/A N/A
Total: 29,044 2,968,820,206$ 1,033,484,435$ 15 33
New York Racinos & Indian Casinos
Sources: New York State Gaming Commission; Meister, Indian Gaming Industry Report, 2014. Pyramid Associates (2014).
New York’s racetrack casinos have enjoyed robust growth during the last five years with a 22.2%
average annual growth rate in gross gaming revenues.44 Empire City Casino at Yonkers Raceway is
the only race track casino to report a decline in gross gaming revenue (-0.3%) during this time, but
that decline is primarily due to the remarkable performance of Resorts World Casino New York,
which opened in 2012 (FY 2013) and also cannibalized a portion of Empire City Casino’s customers.
New York’s race track casinos have also succeeded at recapturing some of the gaming expenditures
previously made by New York residents at resort casinos in Connecticut and New Jersey, although
New York residents continue to spend significant amounts of money at those casinos (Barrow and
Borges 2013a).
2.3.2 Existing Casinos In New York
New York Race Track Casinos
Batavia Downs
Opened in 1940, Batavia Downs is located in Batavia, New York,
approximately halfway between Buffalo and Rochester. It is the oldest
lighted harness racetrack in the United States. VLTs were introduced in 2005
and the facility now houses approximately 765 electronic gaming machines.
The facility also includes four restaurants. Gross gaming revenue in CY 2014
was nearly $49 million.
44 Calculated from video gaming data published by the New York State Gaming Commission.
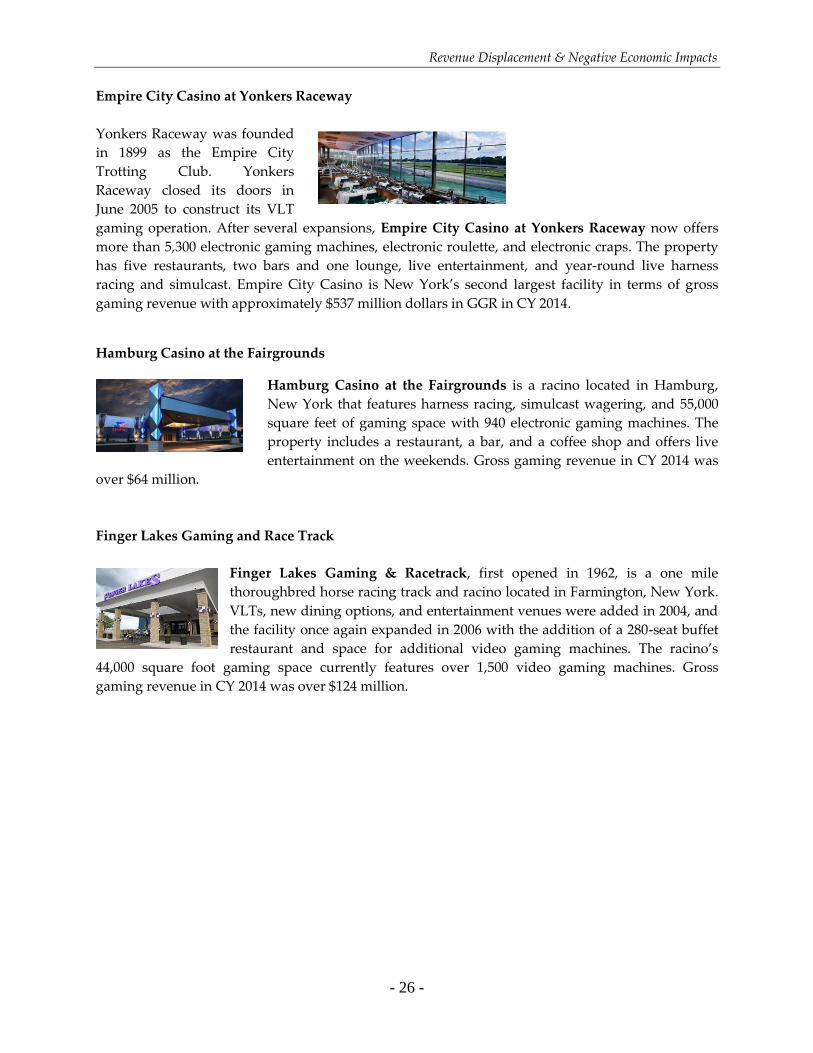
Revenue Displacement & Negative Economic Impacts
- 26 -
Empire City Casino at Yonkers Raceway
Yonkers Raceway was founded
in 1899 as the Empire City
Trotting Club. Yonkers
Raceway closed its doors in
June 2005 to construct its VLT
gaming operation. After several expansions, Empire City Casino at Yonkers Raceway now offers
more than 5,300 electronic gaming machines, electronic roulette, and electronic craps. The property
has five restaurants, two bars and one lounge, live entertainment, and year-round live harness
racing and simulcast. Empire City Casino is New York’s second largest facility in terms of gross
gaming revenue with approximately $537 million dollars in GGR in CY 2014.
Hamburg Casino at the Fairgrounds
Hamburg Casino at the Fairgrounds is a racino located in Hamburg,
New York that features harness racing, simulcast wagering, and 55,000
square feet of gaming space with 940 electronic gaming machines. The
property includes a restaurant, a bar, and a coffee shop and offers live
entertainment on the weekends. Gross gaming revenue in CY 2014 was
over $64 million.
Finger Lakes Gaming and Race Track
Finger Lakes Gaming & Racetrack, first opened in 1962, is a one mile
thoroughbred horse racing track and racino located in Farmington, New York.
VLTs, new dining options, and entertainment venues were added in 2004, and
the facility once again expanded in 2006 with the addition of a 280-seat buffet
restaurant and space for additional video gaming machines. The racino’s
44,000 square foot gaming space currently features over 1,500 video gaming machines. Gross
gaming revenue in CY 2014 was over $124 million.

Revenue Displacement & Negative Economic Impacts
- 27 -
Monticello Casino and Raceway
Monticello Casino and Raceway is a racino located in Monticello, New
York. The racino features year round harness racing on one of the largest all-
weather tracks in the country along with 40,000 square feet of gaming space
with over 1,100 electronic gaming machines. The property has two
restaurants, a buffet, and a food court. Gross gaming revenue in CY 2014 was over $59 million.
Resorts World at Aqueduct
Resorts World New York is located at the Aqueduct Raceway in Queens. The
facility offers more than 5,000 slot and table game machines in its two casinos
as well as a high slot limit area. The casino also has two restaurants, a buffet,
food court, bar, and nightclub. Gross gaming revenue in CY 2014 was nearly
$808 million. The facility continues to offer thoroughbred racing at its
Aqueduct Racetrack from October through May.
Saratoga Gaming and Raceway
Saratoga Casino and Raceway is located in Saratoga
Springs, New York and includes a half mile harness
racing track. In 2004, the property became the first
racing facility in New York to open video lottery
games. The racino’s 55,000 square foot gaming space
features over 1,700 electronic gaming machines. The
property also includes multiple restaurants, three bars and a nightclub. Gross gaming revenue in CY
2014 was approximately $159 million.
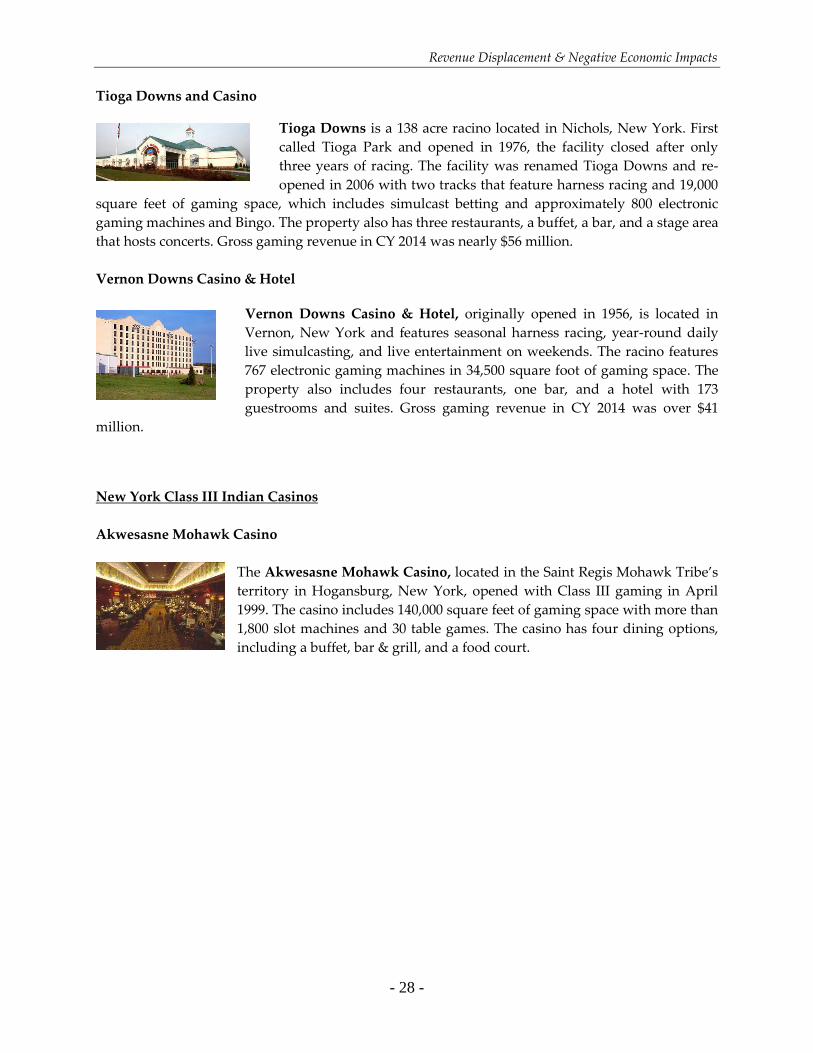
Revenue Displacement & Negative Economic Impacts
- 28 -
Tioga Downs and Casino
Tioga Downs is a 138 acre racino located in Nichols, New York. First
called Tioga Park and opened in 1976, the facility closed after only
three years of racing. The facility was renamed Tioga Downs and re-
opened in 2006 with two tracks that feature harness racing and 19,000
square feet of gaming space, which includes simulcast betting and approximately 800 electronic
gaming machines and Bingo. The property also has three restaurants, a buffet, a bar, and a stage area
that hosts concerts. Gross gaming revenue in CY 2014 was nearly $56 million.
Vernon Downs Casino & Hotel
Vernon Downs Casino & Hotel, originally opened in 1956, is located in
Vernon, New York and features seasonal harness racing, year-round daily
live simulcasting, and live entertainment on weekends. The racino features
767 electronic gaming machines in 34,500 square foot of gaming space. The
property also includes four restaurants, one bar, and a hotel with 173
guestrooms and suites. Gross gaming revenue in CY 2014 was over $41
million.
New York Class III Indian Casinos
Akwesasne Mohawk Casino
The Akwesasne Mohawk Casino, located in the Saint Regis Mohawk Tribe’s
territory in Hogansburg, New York, opened with Class III gaming in April
1999. The casino includes 140,000 square feet of gaming space with more than
1,800 slot machines and 30 table games. The casino has four dining options,
including a buffet, bar & grill, and a food court.
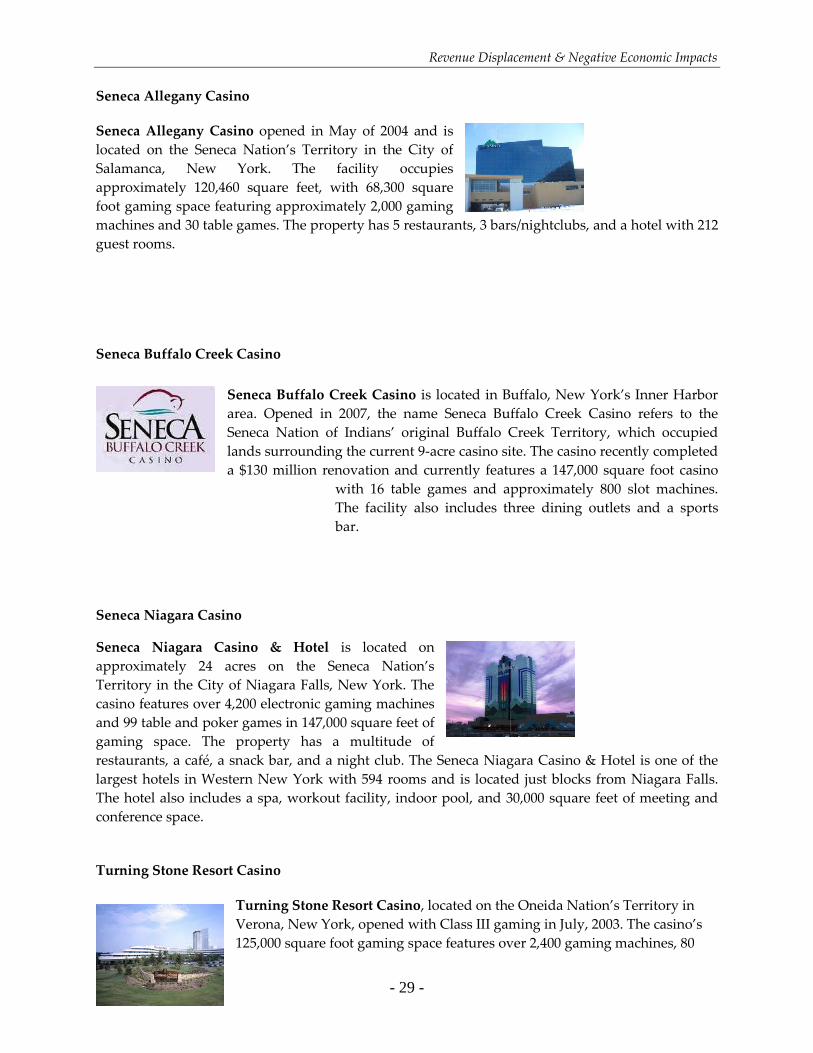
Revenue Displacement & Negative Economic Impacts
- 29 -
Seneca Allegany Casino
Seneca Allegany Casino opened in May of 2004 and is
located on the Seneca Nation’s Territory in the City of
Salamanca, New York. The facility occupies
approximately 120,460 square feet, with 68,300 square
foot gaming space featuring approximately 2,000 gaming
machines and 30 table games. The property has 5 restaurants, 3 bars/nightclubs, and a hotel with 212
guest rooms.
Seneca Buffalo Creek Casino
Seneca Buffalo Creek Casino is located in Buffalo, New York’s Inner Harbor
area. Opened in 2007, the name Seneca Buffalo Creek Casino refers to the
Seneca Nation of Indians’ original Buffalo Creek Territory, which occupied
lands surrounding the current 9-acre casino site. The casino recently completed
a $130 million renovation and currently features a 147,000 square foot casino
with 16 table games and approximately 800 slot machines.
The facility also includes three dining outlets and a sports
bar.
Seneca Niagara Casino
Seneca Niagara Casino & Hotel is located on
approximately 24 acres on the Seneca Nation’s
Territory in the City of Niagara Falls, New York. The
casino features over 4,200 electronic gaming machines
and 99 table and poker games in 147,000 square feet of
gaming space. The property has a multitude of
restaurants, a café, a snack bar, and a night club. The Seneca Niagara Casino & Hotel is one of the
largest hotels in Western New York with 594 rooms and is located just blocks from Niagara Falls.
The hotel also includes a spa, workout facility, indoor pool, and 30,000 square feet of meeting and
conference space.
Turning Stone Resort Casino
Turning Stone Resort Casino, located on the Oneida Nation’s Territory in
Verona, New York, opened with Class III gaming in July, 2003. The casino’s
125,000 square foot gaming space features over 2,400 gaming machines, 80
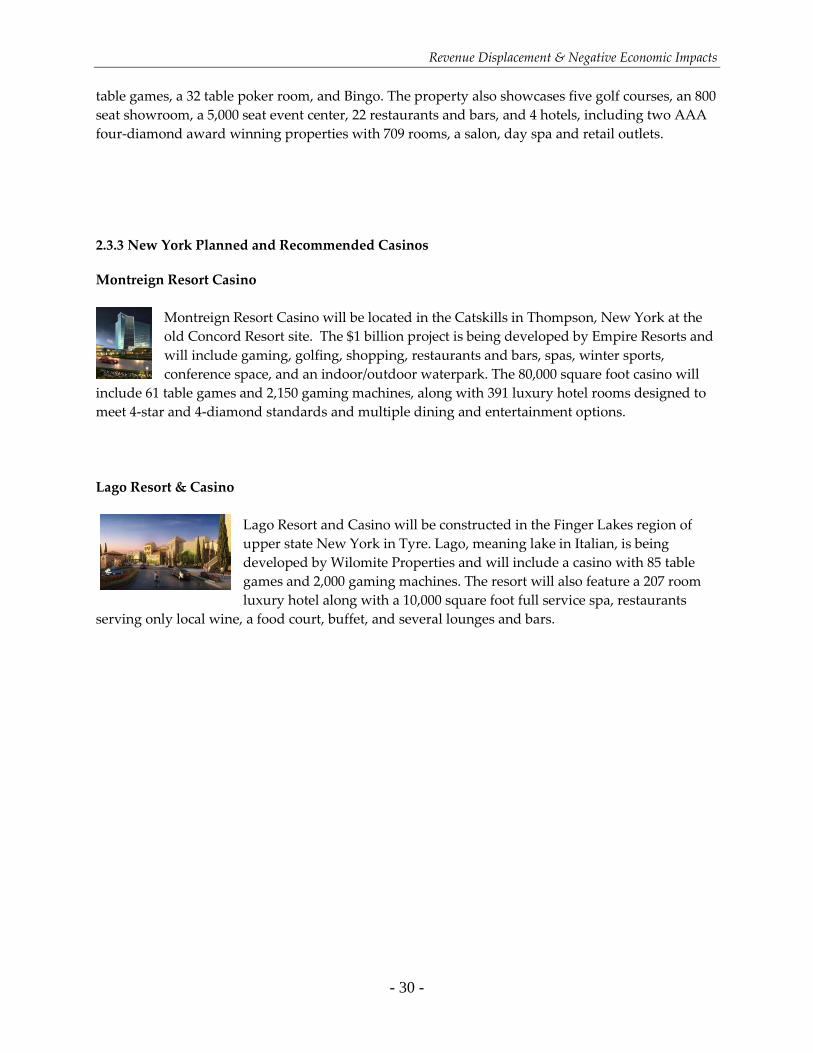
Revenue Displacement & Negative Economic Impacts
- 30 -
table games, a 32 table poker room, and Bingo. The property also showcases five golf courses, an 800
seat showroom, a 5,000 seat event center, 22 restaurants and bars, and 4 hotels, including two AAA
four-diamond award winning properties with 709 rooms, a salon, day spa and retail outlets.
2.3.3 New York Planned and Recommended Casinos
Montreign Resort Casino
Montreign Resort Casino will be located in the Catskills in Thompson, New York at the
old Concord Resort site. The $1 billion project is being developed by Empire Resorts and
will include gaming, golfing, shopping, restaurants and bars, spas, winter sports,
conference space, and an indoor/outdoor waterpark. The 80,000 square foot casino will
include 61 table games and 2,150 gaming machines, along with 391 luxury hotel rooms designed to
meet 4-star and 4-diamond standards and multiple dining and entertainment options.
Lago Resort & Casino
Lago Resort and Casino will be constructed in the Finger Lakes region of
upper state New York in Tyre. Lago, meaning lake in Italian, is being
developed by Wilomite Properties and will include a casino with 85 table
games and 2,000 gaming machines. The resort will also feature a 207 room
luxury hotel along with a 10,000 square foot full service spa, restaurants
serving only local wine, a food court, buffet, and several lounges and bars.
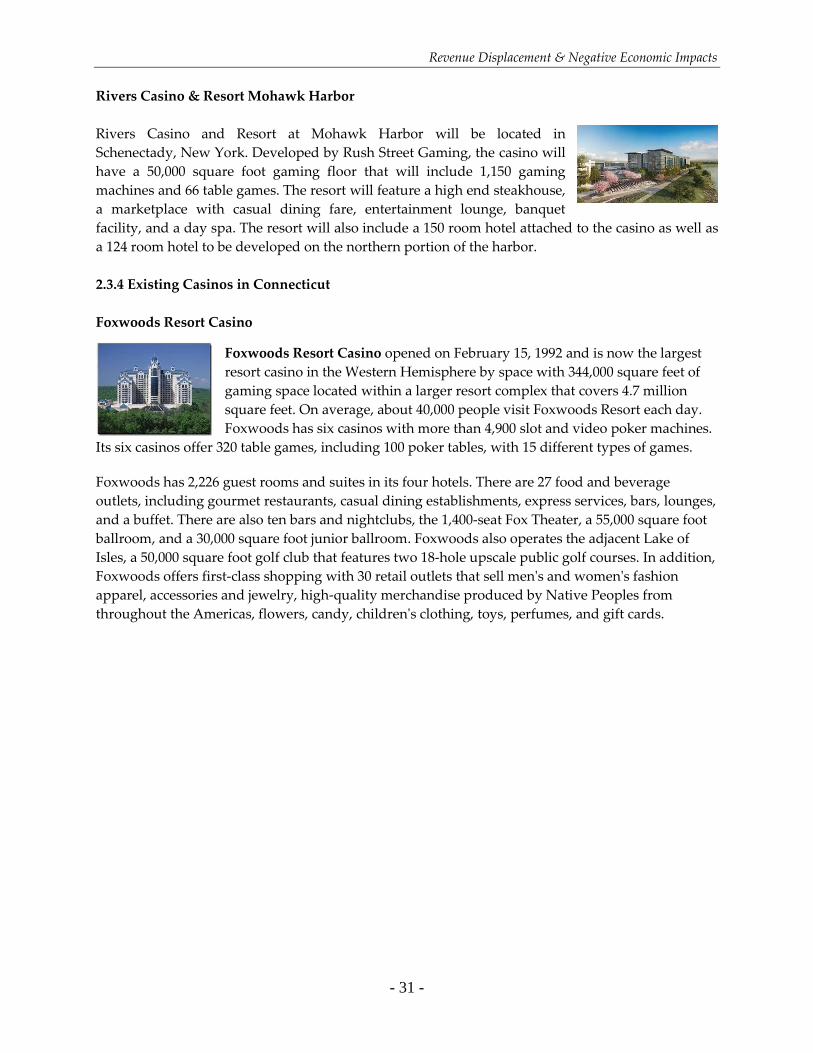
Revenue Displacement & Negative Economic Impacts
- 31 -
Rivers Casino & Resort Mohawk Harbor
Rivers Casino and Resort at Mohawk Harbor will be located in
Schenectady, New York. Developed by Rush Street Gaming, the casino will
have a 50,000 square foot gaming floor that will include 1,150 gaming
machines and 66 table games. The resort will feature a high end steakhouse,
a marketplace with casual dining fare, entertainment lounge, banquet
facility, and a day spa. The resort will also include a 150 room hotel attached to the casino as well as
a 124 room hotel to be developed on the northern portion of the harbor.
2.3.4 Existing Casinos in Connecticut
Foxwoods Resort Casino
Foxwoods Resort Casino opened on February 15, 1992 and is now the largest
resort casino in the Western Hemisphere by space with 344,000 square feet of
gaming space located within a larger resort complex that covers 4.7 million
square feet. On average, about 40,000 people visit Foxwoods Resort each day.
Foxwoods has six casinos with more than 4,900 slot and video poker machines.
Its six casinos offer 320 table games, including 100 poker tables, with 15 different types of games.
Foxwoods has 2,226 guest rooms and suites in its four hotels. There are 27 food and beverage
outlets, including gourmet restaurants, casual dining establishments, express services, bars, lounges,
and a buffet. There are also ten bars and nightclubs, the 1,400-seat Fox Theater, a 55,000 square foot
ballroom, and a 30,000 square foot junior ballroom. Foxwoods also operates the adjacent Lake of
Isles, a 50,000 square foot golf club that features two 18-hole upscale public golf courses. In addition,
Foxwoods offers first-class shopping with 30 retail outlets that sell men's and women's fashion
apparel, accessories and jewelry, high-quality merchandise produced by Native Peoples from
throughout the Americas, flowers, candy, children's clothing, toys, perfumes, and gift cards.
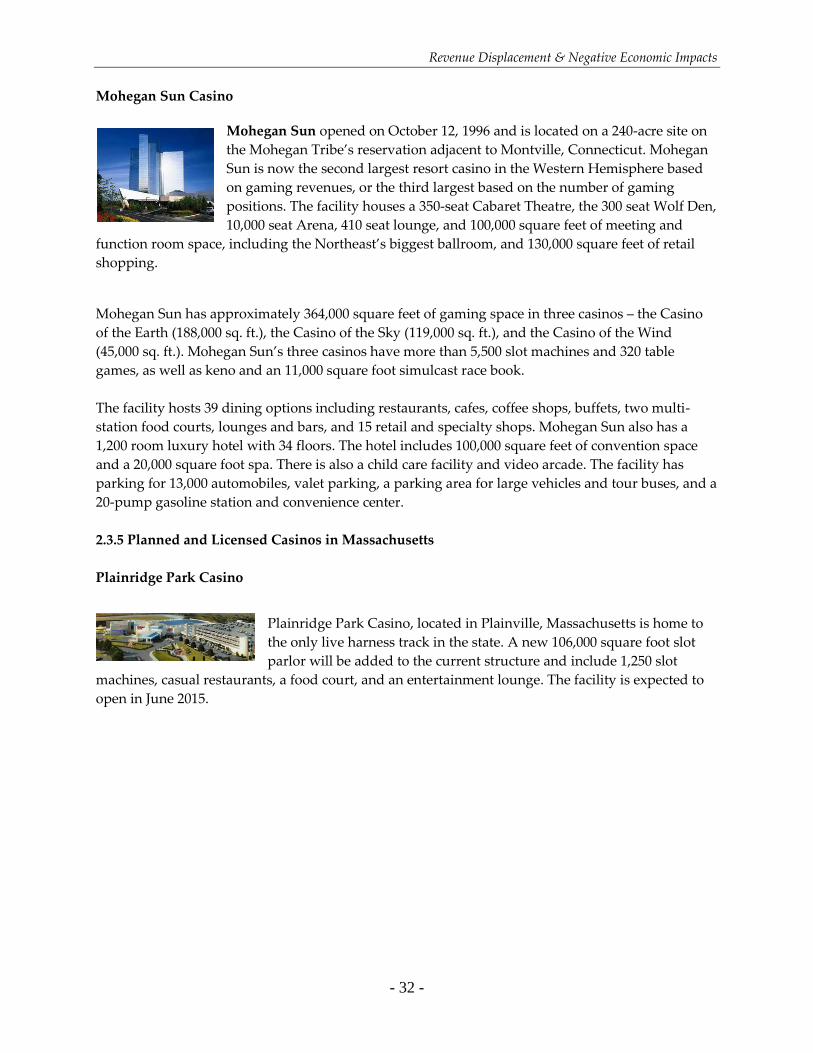
Revenue Displacement & Negative Economic Impacts
- 32 -
Mohegan Sun Casino
Mohegan Sun opened on October 12, 1996 and is located on a 240-acre site on
the Mohegan Tribe’s reservation adjacent to Montville, Connecticut. Mohegan
Sun is now the second largest resort casino in the Western Hemisphere based
on gaming revenues, or the third largest based on the number of gaming
positions. The facility houses a 350-seat Cabaret Theatre, the 300 seat Wolf Den,
10,000 seat Arena, 410 seat lounge, and 100,000 square feet of meeting and
function room space, including the Northeast’s biggest ballroom, and 130,000 square feet of retail
shopping.
Mohegan Sun has approximately 364,000 square feet of gaming space in three casinos – the Casino
of the Earth (188,000 sq. ft.), the Casino of the Sky (119,000 sq. ft.), and the Casino of the Wind
(45,000 sq. ft.). Mohegan Sun’s three casinos have more than 5,500 slot machines and 320 table
games, as well as keno and an 11,000 square foot simulcast race book.
The facility hosts 39 dining options including restaurants, cafes, coffee shops, buffets, two multi-
station food courts, lounges and bars, and 15 retail and specialty shops. Mohegan Sun also has a
1,200 room luxury hotel with 34 floors. The hotel includes 100,000 square feet of convention space
and a 20,000 square foot spa. There is also a child care facility and video arcade. The facility has
parking for 13,000 automobiles, valet parking, a parking area for large vehicles and tour buses, and a
20-pump gasoline station and convenience center.
2.3.5 Planned and Licensed Casinos in Massachusetts
Plainridge Park Casino
Plainridge Park Casino, located in Plainville, Massachusetts is home to
the only live harness track in the state. A new 106,000 square foot slot
parlor will be added to the current structure and include 1,250 slot
machines, casual restaurants, a food court, and an entertainment lounge. The facility is expected to
open in June 2015.
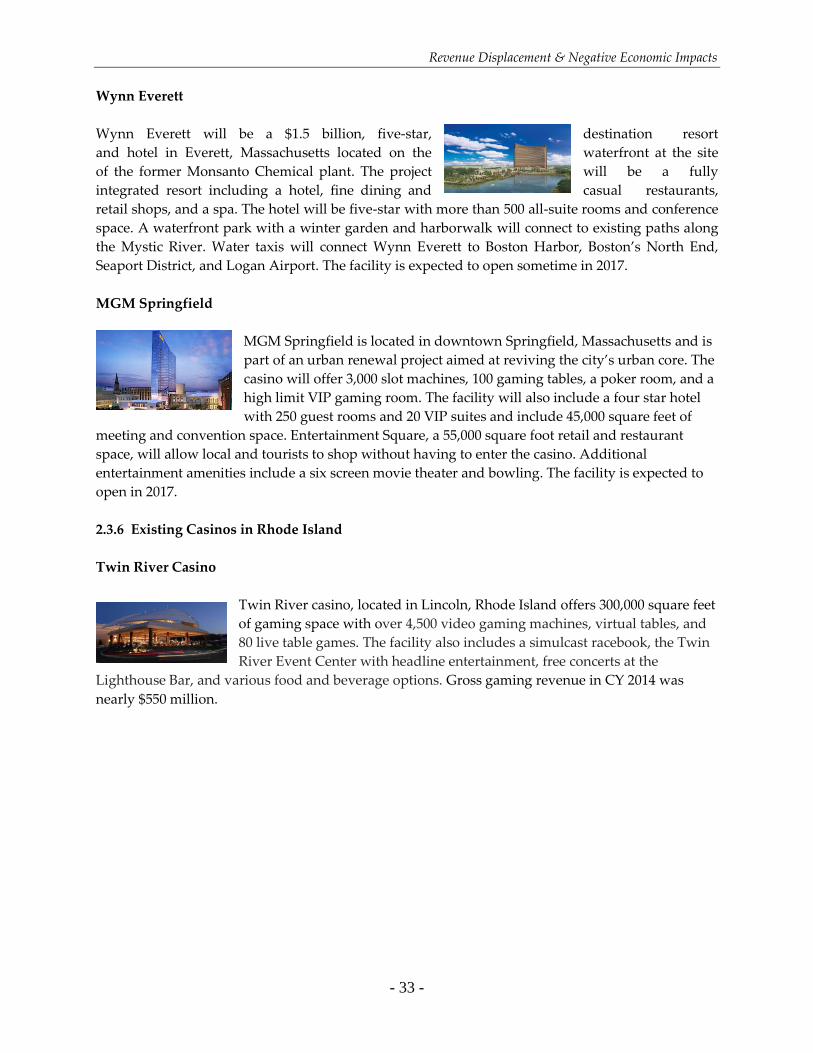
Revenue Displacement & Negative Economic Impacts
- 33 -
Wynn Everett
Wynn Everett will be a $1.5 billion, five-star, destination resort
and hotel in Everett, Massachusetts located on the waterfront at the site
of the former Monsanto Chemical plant. The project will be a fully
integrated resort including a hotel, fine dining and casual restaurants,
retail shops, and a spa. The hotel will be five-star with more than 500 all-suite rooms and conference
space. A waterfront park with a winter garden and harborwalk will connect to existing paths along
the Mystic River. Water taxis will connect Wynn Everett to Boston Harbor, Boston’s North End,
Seaport District, and Logan Airport. The facility is expected to open sometime in 2017.
MGM Springfield
MGM Springfield is located in downtown Springfield, Massachusetts and is
part of an urban renewal project aimed at reviving the city’s urban core. The
casino will offer 3,000 slot machines, 100 gaming tables, a poker room, and a
high limit VIP gaming room. The facility will also include a four star hotel
with 250 guest rooms and 20 VIP suites and include 45,000 square feet of
meeting and convention space. Entertainment Square, a 55,000 square foot retail and restaurant
space, will allow local and tourists to shop without having to enter the casino. Additional
entertainment amenities include a six screen movie theater and bowling. The facility is expected to
open in 2017.
2.3.6 Existing Casinos in Rhode Island
Twin River Casino
Twin River casino, located in Lincoln, Rhode Island offers 300,000 square feet
of gaming space with over 4,500 video gaming machines, virtual tables, and
80 live table games. The facility also includes a simulcast racebook, the Twin
River Event Center with headline entertainment, free concerts at the
Lighthouse Bar, and various food and beverage options. Gross gaming revenue in CY 2014 was
nearly $550 million.
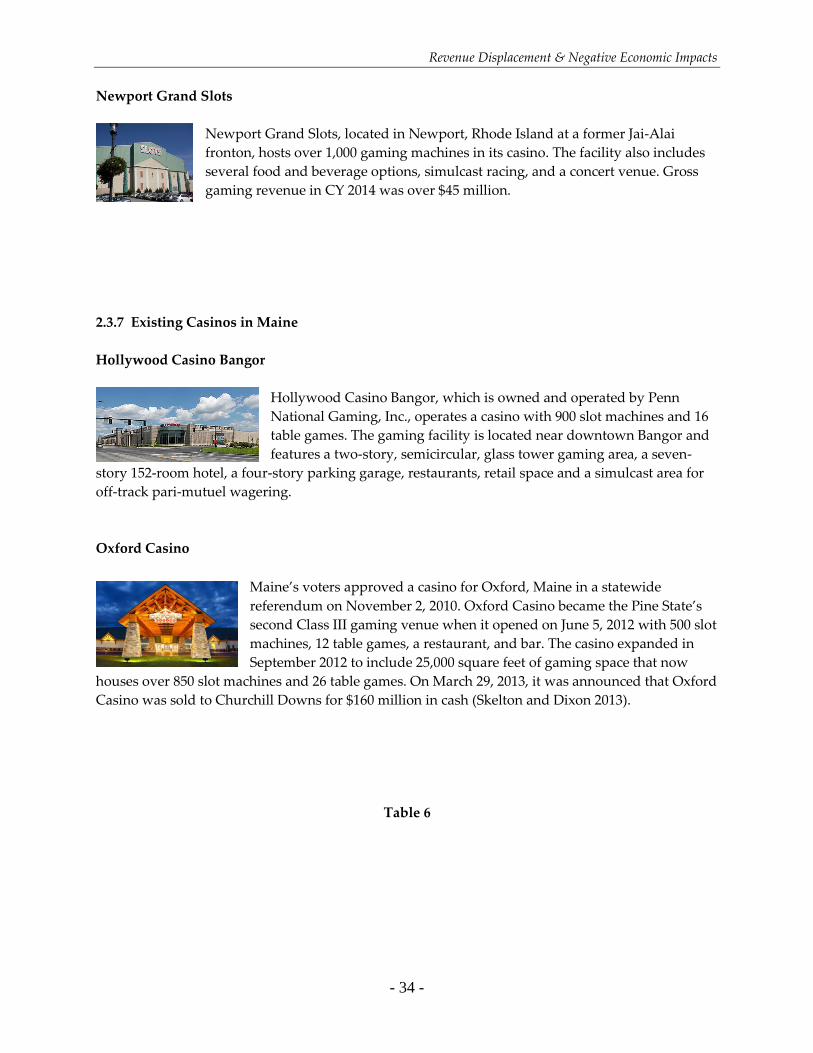
Revenue Displacement & Negative Economic Impacts
- 34 -
Newport Grand Slots
Newport Grand Slots, located in Newport, Rhode Island at a former Jai-Alai
fronton, hosts over 1,000 gaming machines in its casino. The facility also includes
several food and beverage options, simulcast racing, and a concert venue. Gross
gaming revenue in CY 2014 was over $45 million.
2.3.7 Existing Casinos in Maine
Hollywood Casino Bangor
Hollywood Casino Bangor, which is owned and operated by Penn
National Gaming, Inc., operates a casino with 900 slot machines and 16
table games. The gaming facility is located near downtown Bangor and
features a two-story, semicircular, glass tower gaming area, a seven-
story 152-room hotel, a four-story parking garage, restaurants, retail space and a simulcast area for
off-track pari-mutuel wagering.
Oxford Casino
Maine’s voters approved a casino for Oxford, Maine in a statewide
referendum on November 2, 2010. Oxford Casino became the Pine State’s
second Class III gaming venue when it opened on June 5, 2012 with 500 slot
machines, 12 table games, a restaurant, and bar. The casino expanded in
September 2012 to include 25,000 square feet of gaming space that now
houses over 850 slot machines and 26 table games. On March 29, 2013, it was announced that Oxford
Casino was sold to Churchill Downs for $160 million in cash (Skelton and Dixon 2013).
Table 6
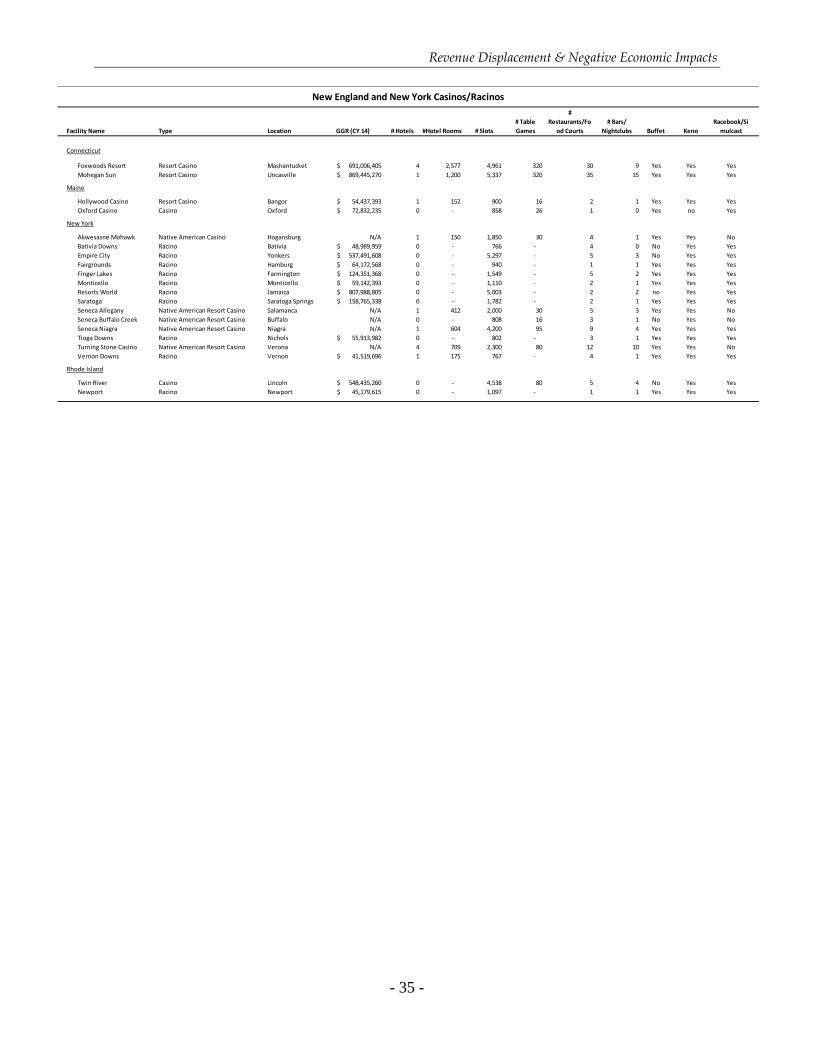
Revenue Displacement & Negative Economic Impacts
- 35 -
Facility Name Type Location GGR (CY 14) # Hotels #Hotel Rooms # Slots
# Table
Games
#
Restaurants/Fo
od Courts
# Bars/
Nightclubs Buffet Keno
Racebook/Si
mulcast
Connecticut
Foxwoods Resort Resort Casino Mashantucket 691,006,405$ 4 2,577 4,961 320 30 9 Yes Yes Yes
Mohegan Sun Resort Casino Uncasville 869,445,270$ 1 1,200 5,337 320 35 15 Yes Yes Yes
Maine
Hollywood Casino Resort Casino Bangor 54,437,393$ 1 152 900 16 2 1 Yes Yes Yes
Oxford Casino Casino Oxford 72,832,235$ 0 - 858 26 1 0 Yes no Yes
New York
Akwesasne Mohawk Native American Casino Hogansburg N/A 1 150 1,850 30 4 1 Yes Yes No
Bativia Downs Racino Bativia 48,989,959$ 0 - 766 - 4 0 No Yes Yes
Empire City Racino Yonkers 537,491,608$ 0 - 5,297 - 5 3 No Yes Yes
Fairgrounds Racino Hamburg 64,172,568$ 0 - 940 - 1 1 Yes Yes Yes
Finger Lakes Racino Farmington 124,351,368$ 0 - 1,549 - 5 2 Yes Yes Yes
Monticello Racino Monticello 59,142,393$ 0 - 1,110 - 2 1 Yes Yes Yes
Resorts World Racino Jamaica 807,988,805$ 0 - 5,003 - 2 2 no Yes Yes
Saratoga Racino Saratoga Springs 158,765,338$ 0 - 1,782 - 2 1 Yes Yes Yes
Seneca Allegany Native American Resort Casino Salamanca N/A 1 412 2,000 30 5 3 Yes Yes No
Seneca Buffalo Creek Native American Resort Casino Buffalo N/A 0 - 808 16 3 1 No Yes No
Seneca Niagra Native American Resort Casino Niagra N/A 1 604 4,200 95 9 4 Yes Yes Yes
Tioga Downs Racino Nichols 55,913,982$ 0 - 802 - 3 1 Yes Yes Yes
Turning Stone Casino Native American Resort Casino Verona N/A 4 709 2,300 80 12 10 Yes Yes No
Vernon Downs Racino Vernon 41,519,696$ 1 175 767 - 4 1 Yes Yes Yes
Rhode Island
Twin River Casino Lincoln 548,435,260$ 0 - 4,538 80 5 4 No Yes Yes
Newport Racino Newport 45,179,615$ 0 - 1,097 - 1 1 Yes Yes Yes
New England and New York Casinos/Racinos
Revenue Displacement & Negative Economic Impacts
- 36 -
3. Methodology
The market and economic impact analyses in this report are based on well-established demand
analysis techniques that are commonly utilized for forecasting visits and revenues at casinos in the
United States, including the potential impact of new gaming facilities on existing gaming facilities.
The analysis and conclusions are derived from a custom designed gravity model. The inputs to the
model include public secondary data sources for population (U.S. Census), disposable personal
income (U.S. Bureau of Economic Analysis), and drive times between different locations (MS
MapPoint).
3.1 DEFINITIONS
Many specialized terms and concepts are unique to the gaming industry. These terms include:
Handle – the total amount of money and tokens bet during the course of a day,
month, or year. It does not measure the amount of money won or lost by a patron,
but measures the velocity of money. For example, if a casino patron starts the
evening with an initial stake of $100, loses $75 of it, then wins back $150, and
continues to successively win and lose money over the course of an evening, then the
amount actually wagered by the patron could be $500, $1,000, $2,000, or more over
several hours. However, if at the end of the evening the patron leaves with $20 of
their original $100 gambling stake, then over the course of the evening the patron
lost $80. The $80 would be recorded by the casino as the “win” (see below) from that
patron, while the total amount wagered during the evening would be the handle.
Drop – the total amount of cash and other negotiable instruments that are taken by
the dealer at a table game and placed into the drop box in exchange for chips or the
actual amount of cash inserted into a slot machine. Drop is different from handle,
since it is the initial stake put at risk by a player and not the total amount wagered by
a patron (and a patron may “cash out” and not wager the total drop).
Payout – the amount of money returned to casino gamblers from the handle or
wager. Resort casinos in non-traditional jurisdictions usually return from 90% to
93% of the total amount wagered (handle) on slot machines each month to casino
gamblers.45 The average payout on table games varies by the type of game, but it is
generally 82% to 85% on most games, although the payout on particular games can
fluctuate from month to month depending on the skill and luck of players.
Win or Hold – the amount of money retained by a casino from the handle wagered
by patrons. Resort casinos in non-traditional jurisdictions usually retain 7% to 10%
of the total amount wagered (handle) on slot machines each month by casino
gamblers. Resort casinos in non-traditional jurisdictions usually win 15% to 18% of
the total amount dropped or paid in commissions at table games each month by
casino gamblers, although this number can vary.
45 Non-traditional casino gaming jurisdictions include all states other than Nevada and New Jersey.
Revenue Displacement & Negative Economic Impacts
- 37 -
Gross Gaming Revenue (GGR) – the total amount of gaming revenue (win) retained
by the casino during a day, month, or year, including the value of promotional
allowances. GGR is the figure most commonly used to determine what a casino,
racetrack, lottery, or other gaming operation earns before taxes, salaries, and other
expenses are paid. GGR is the equivalent of “sales” in other retail and service
industries and should not be confused with “profit.” GGR is the revenue base for
levying gaming taxes, although different jurisdictions may have different treatments
of promotional allowances (see below).
Non-Gaming Revenue (NGR) – the total amount of sales by non-gaming operations,
such as a hotel, retail outlets, food and beverage outlets, convention and meeting
space, golf course, and spa, including the value of promotional allowances.
Gross Revenue – the total revenue retained by a casino from both its gaming (GGR)
and non-gaming operations (NGR).
Operating Revenue – the total revenue retained by a casino from both its gaming
(GGR) and non-gaming operations (NGR) after subtracting promotional allowances.
Earnings Before Interest, Taxes, Depreciation, and Amortization (EBITDA) –
operating revenue minus operating expenses. EBITDA does not include deductions
for interest expense, principal payments, depreciation, or management and
development fees.46
Propensity to Gamble – the percentage of the adult population that gambles at least
once per year and the average number of visits per year to casinos by those who
gamble.
Promotional Allowances – complimentary food and beverage, hotel, retail,
entertainment, and other services provided to casino patrons. The retail value of
these complimentary items is included in gross revenues and then deducted as
promotional allowances to arrive at net or operating revenue.
3.2 GRAVITY MODEL
Gravity modeling is the most reliable and commonly used method for estimating the demand and
competitive impact of casinos in a specific market area. Gravity modeling is based on a modified
version of Sir Isaac Newton’s Law of Gravitation, which has been in use since 1931 when Professor
William J. Reilly of the University of Texas introduced his Law of Retail Gravitation to predict the
movement of people, commodities, and sales (money) between competing commercial centers (see
Appendix B). Newton’s Law of Gravitation states that the gravitational force between two objects is
proportional to the product of their masses and inversely proportional to the square of the distance
between the two objects. William J. Reilly’s restatement of this principle as the Law of Retail
Gravitation states that larger retail facilities (i.e., those with greater mass) will have larger spheres of
attraction -- or a greater gravitational force -- than smaller facilities of a comparable type. The Law of
46 Management and development fees are incurred by many tribal casinos.
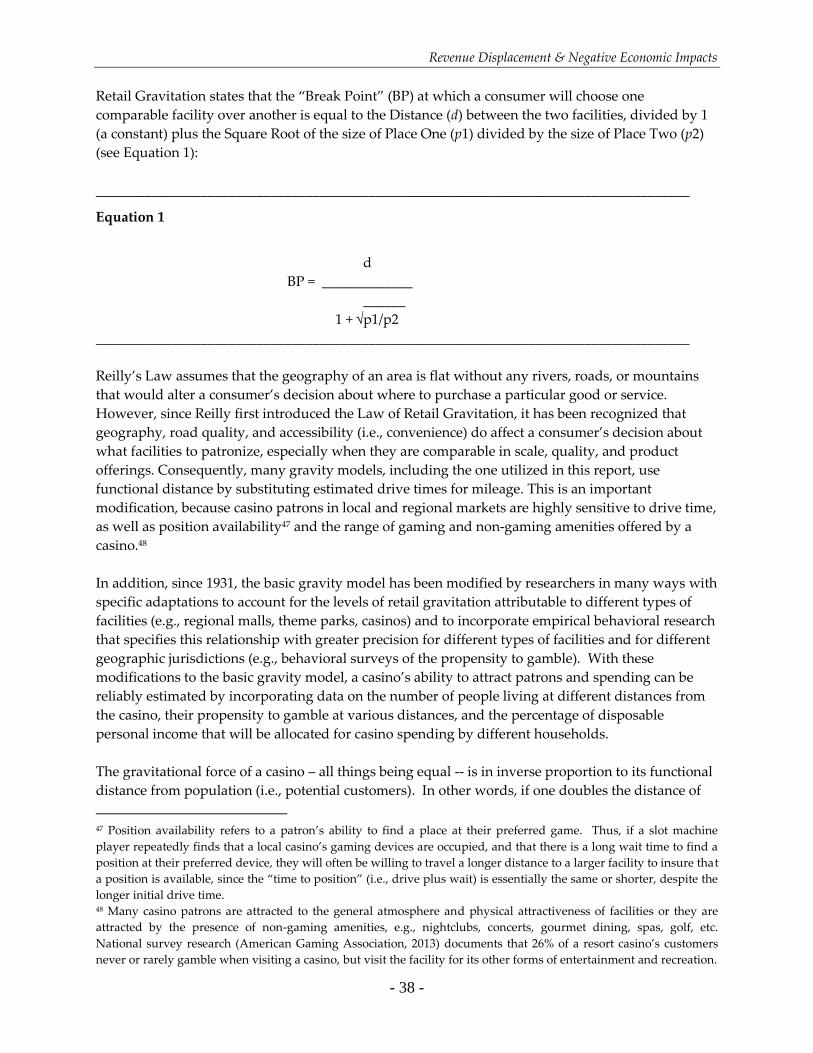
Revenue Displacement & Negative Economic Impacts
- 38 -
Retail Gravitation states that the “Break Point” (BP) at which a consumer will choose one
comparable facility over another is equal to the Distance (d) between the two facilities, divided by 1
(a constant) plus the Square Root of the size of Place One (p1) divided by the size of Place Two (p2)
(see Equation 1):
_____________________________________________________________________________________
Equation 1
d
BP = _____________
______
1 + √p1/p2
_____________________________________________________________________________________
Reilly’s Law assumes that the geography of an area is flat without any rivers, roads, or mountains
that would alter a consumer’s decision about where to purchase a particular good or service.
However, since Reilly first introduced the Law of Retail Gravitation, it has been recognized that
geography, road quality, and accessibility (i.e., convenience) do affect a consumer’s decision about
what facilities to patronize, especially when they are comparable in scale, quality, and product
offerings. Consequently, many gravity models, including the one utilized in this report, use
functional distance by substituting estimated drive times for mileage. This is an important
modification, because casino patrons in local and regional markets are highly sensitive to drive time,
as well as position availability47 and the range of gaming and non-gaming amenities offered by a
casino.48
In addition, since 1931, the basic gravity model has been modified by researchers in many ways with
specific adaptations to account for the levels of retail gravitation attributable to different types of
facilities (e.g., regional malls, theme parks, casinos) and to incorporate empirical behavioral research
that specifies this relationship with greater precision for different types of facilities and for different
geographic jurisdictions (e.g., behavioral surveys of the propensity to gamble). With these
modifications to the basic gravity model, a casino’s ability to attract patrons and spending can be
reliably estimated by incorporating data on the number of people living at different distances from
the casino, their propensity to gamble at various distances, and the percentage of disposable
personal income that will be allocated for casino spending by different households.
The gravitational force of a casino – all things being equal -- is in inverse proportion to its functional
distance from population (i.e., potential customers). In other words, if one doubles the distance of
47 Position availability refers to a patron’s ability to find a place at their preferred game. Thus, if a slot machine
player repeatedly finds that a local casino’s gaming devices are occupied, and that there is a long wait time to find a
position at their preferred device, they will often be willing to travel a longer distance to a larger facility to insure that
a position is available, since the “time to position” (i.e., drive plus wait) is essentially the same or shorter, despite the
longer initial drive time. 48 Many casino patrons are attracted to the general atmosphere and physical attractiveness of facilities or they are
attracted by the presence of non-gaming amenities, e.g., nightclubs, concerts, gourmet dining, spas, golf, etc.
National survey research (American Gaming Association, 2013) documents that 26% of a resort casino’s customers
never or rarely gamble when visiting a casino, but visit the facility for its other forms of entertainment and recreation.
Revenue Displacement & Negative Economic Impacts
- 39 -
an individual’s residence from a casino, visitations to the casino decline in inverse proportion to that
distance, although this mathematical relationship can be modified in gravity models by
incorporating empirically-based behavioral data, or players club customer data, given it has been
documented that a casino’s gravitational force is “not always according to Reilly” (Cummings 2006).
Normally, however, the further the distance from a casino, the less likely residents are to visit it
(unless there is no alternative), and those who do visit it will visit it less frequently. It has generally
been found that while patrons who live further away from a casino will visit it less often, they are
likely to spend more per visit, since they will generally stay longer and spend on a wider range of
amenities. As competing casinos get closer to residents, one eventually reaches a Break Point, where
the retail gravitation of the competing facility exerts greater force over potential patrons and
customer visits and revenues shift toward the competing facility.
The size (mass) of a retail facility is a critical element in any casino’s ability to attract customers in a
competitive environment. Most gravity models measure a casino’s mass exclusively in terms of the
number of slot machines or the number of gaming positions.49 However, it is known that customer
decisions about competing facilities are also influenced by the types of gaming options available
(i.e., video poker terminals, slot machines, table games, poker, bingo, keno), parking availability,
and the availability of non-gaming amenities, such as a hotel, spa, entertainment venues, retail
outlets, food and beverage offerings, a golf course, etc. While non-gaming entertainment and resort
amenities are not usually incorporated into most gravity models, the model used for this analysis in
this report explicitly and transparently incorporates these amenities into its calculation of gravity
factors.
A Master Database consisting of 2,620 communities in Connecticut, Maine, Massachusetts, New
Hampshire, New York, Rhode Island, and Vermont was built to analyze the gaming market area for
the Mohegan Sun Casino, Foxwoods Resort Casino, and the planned casinos in Massachusetts and
New York, including the latters’ potential displacement impact on the Connecticut gaming facilities.
The Master Database includes data by town and city on total population, the adult population (age
21+), per capita income, total income, disposable personal income (DPI), and drive times to each
gaming facility in the six states included in the database. Drive times are based on geocodes for the
actual address of each gaming facility. The initial Master Database contains 170,300 discrete data
points.
The Master Database was sorted to exclude communities beyond a 2½ hour drive time from
Uncasville, Connecticut and Ledyard, Connecticut, since it is assumed that patrons visiting a gaming
facility from outside a 2½ hour drive time will do so primarily as the result of non-gaming related
travel for leisure or business purposes. These potential visitors are classified as out-of-market
tourists for purposes of the analysis, rather than as regular patrons of the existing facilities, although
they are incorporated into the gravity model. The initial gravity model developed from this database
relies on reasonable and conservative assumptions about the propensity to gamble at different
functional distances, as well as gaming expenditures as a ratio of DPI at different functional
distances.
49 One slot machine equals one gaming position, while one table game is normally six positions because it can
accommodate multiple players.
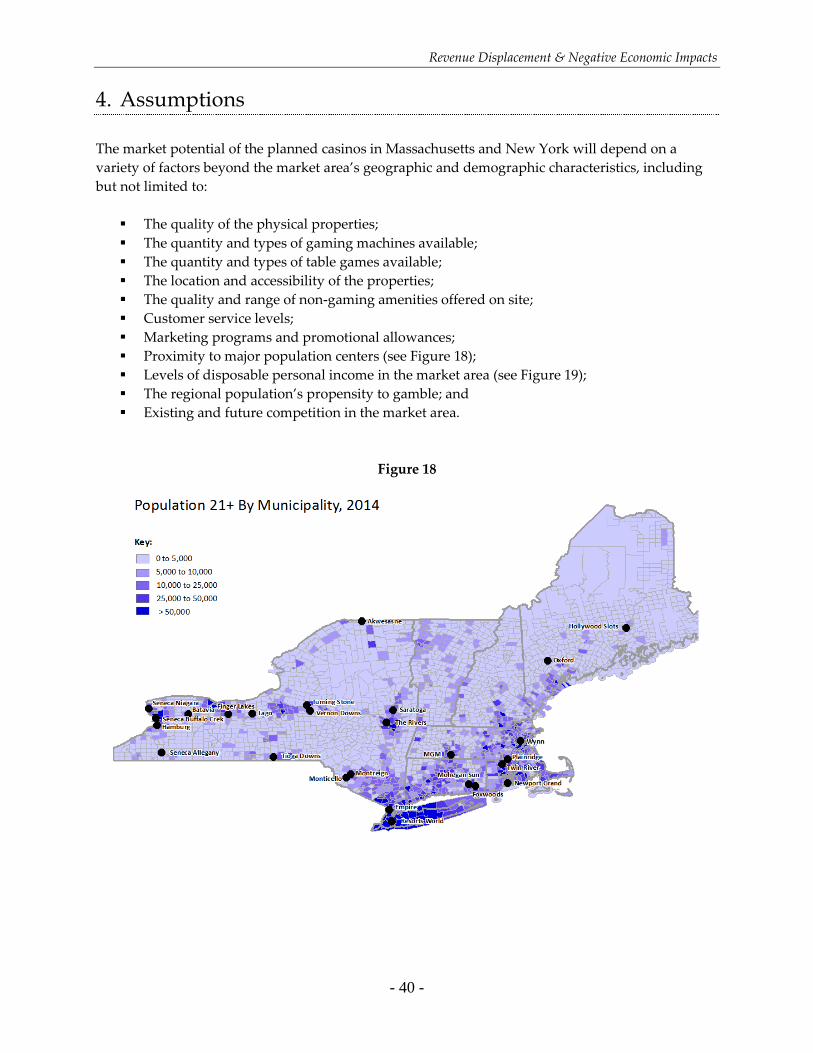
Revenue Displacement & Negative Economic Impacts
- 40 -
4. Assumptions
The market potential of the planned casinos in Massachusetts and New York will depend on a
variety of factors beyond the market area’s geographic and demographic characteristics, including
but not limited to:
The quality of the physical properties;
The quantity and types of gaming machines available;
The quantity and types of table games available;
The location and accessibility of the properties;
The quality and range of non-gaming amenities offered on site;
Customer service levels;
Marketing programs and promotional allowances;
Proximity to major population centers (see Figure 18);
Levels of disposable personal income in the market area (see Figure 19);
The regional population’s propensity to gamble; and
Existing and future competition in the market area.
Figure 18
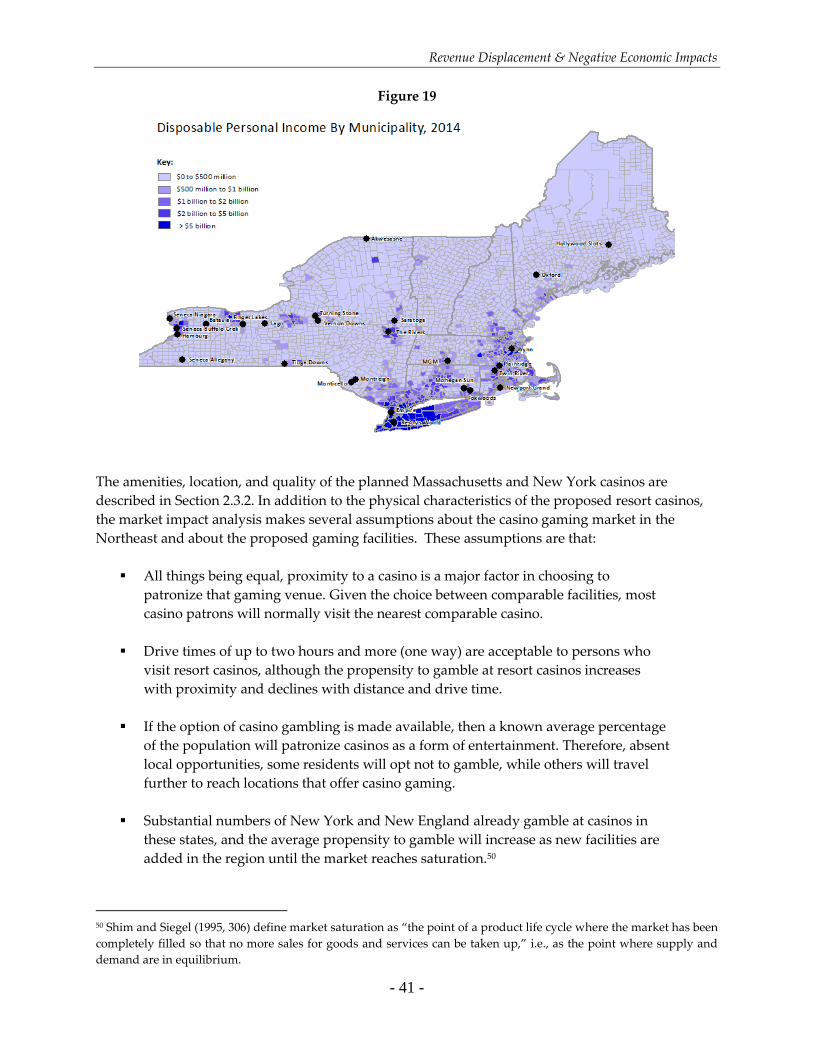
Revenue Displacement & Negative Economic Impacts
- 41 -
Figure 19
The amenities, location, and quality of the planned Massachusetts and New York casinos are
described in Section 2.3.2. In addition to the physical characteristics of the proposed resort casinos,
the market impact analysis makes several assumptions about the casino gaming market in the
Northeast and about the proposed gaming facilities. These assumptions are that:
All things being equal, proximity to a casino is a major factor in choosing to
patronize that gaming venue. Given the choice between comparable facilities, most
casino patrons will normally visit the nearest comparable casino.
Drive times of up to two hours and more (one way) are acceptable to persons who
visit resort casinos, although the propensity to gamble at resort casinos increases
with proximity and declines with distance and drive time.
If the option of casino gambling is made available, then a known average percentage
of the population will patronize casinos as a form of entertainment. Therefore, absent
local opportunities, some residents will opt not to gamble, while others will travel
further to reach locations that offer casino gaming.
Substantial numbers of New York and New England already gamble at casinos in
these states, and the average propensity to gamble will increase as new facilities are
added in the region until the market reaches saturation.50
50 Shim and Siegel (1995, 306) define market saturation as “the point of a product life cycle where the market has been
completely filled so that no more sales for goods and services can be taken up,” i.e., as the point where supply and
demand are in equilibrium.
Revenue Displacement & Negative Economic Impacts
- 42 -
The planned MGM Springfield casino:
will be an $800 million capital investment that is well-designed and attractive
to potential customers, and which will be consistent with the MGM brand;
will open January 1, 2017 with a fully built out gaming facility that will
include 3,000 slot machines and 100 table games, and a 250 room hotel, as
well as entertainment venues, meeting facilities, multiple food and beverage
outlets, and retail stores;
will (under an average case scenario) generate gross gaming revenue of
$412.2 million, $485.0 million, $499.5 million, $512.0 million and $524.8
million, respectively, during its first five years of operation.
will (under an average case scenario) generate non-gaming revenue of $105.3
million, $123.5 million, $127.2 million, $130.3 million and $133.6 million,
respectively, during its first five years of operation.51
The planned Wynn Everett casino:
will be an $1.5 billion capital investment that is well-designed and attractive
to potential customers, and which will be consistent with the Wynn brand;
will open January 1, 2017 with a fully built out gaming facility that will
include 3,000 slot machines and 150 table games, and a 500 room hotel, as
well as entertainment venues, multiple food and beverage outlets, and retail
stores, and a spa;
will (under an average case scenario) generate gross gaming revenue of
$447.3 million, $543.2 million, $639.0 million, $651.8 million, and $664.8
million, respectively during its first five years of operations.
will (under an average case scenario) generate non-gaming revenue of $53.7
million, $65.2 million, $76.7 million, $78.2 million, and $79.8 million,
respectively, during its first five years of operations.52
51 Blue Tarp redevelopment, LLC, RFA-2 Application for a Category 1 or Category 2 Gaming License (Boston: Massachusetts Gaming
Commission, 2014), pp. 39-51. 52 TMG Consulting, Inc., Wynn Everett Gaming Market Assessment (New Orleans, LA, 2013), pp. 4-8; Wynn Massachusetts, LLC, RFA-
2 Application for a Category 1 or Category 2 Gaming License (Boston: Massachusetts Gaming Commission, 2014), p. 51 states that “on a
cash basis…the Wynn Resort in Everett will generate approximately 12% of its total gross cash revenue, from non-gaming sources.”
The Wynn Everett application to M.G.C. includes a CY 2017 estimate of gaming and non-gaming revenue, but does not provide a
five-year forecast. These estimates assume that the facility reaches 70% of stabilized revenues in CY 2017, 85% in CY 2018 and 100%
in CY 2019, which is its first year of stabilized operations. It is further assumed that revenue grows by 2% annually in CY 2020 and
CY 2021. These figures are for regional customers only.
Revenue Displacement & Negative Economic Impacts
- 43 -
The planned Rivers Casino & Resort at Mohawk Harbor:
will be an $450 million capital investment that is well-designed and attractive
to potential customers, and which will be consistent with the Rivers Casino
brand;
will open January 1, 2017 with a fully built out gaming facility that will
include 1,150 slot machines and 66 table games, an attached 150-room hotel,
an adjacent 124-room hotel, as well as an entertainment lounge, multiple
food and beverage outlets, a banquet facility, and a day spa;
will (under an average case scenario) generate gross gaming revenue of
$156.1 million, $189.6 million, $223.0 million, $227.5 million, and $232.0
million, respectively, during its first five years of operations.
will (under an average case scenario) generate non-gaming revenue of $18.7
million, $22.8 million, $26.8 million, $27.3 million, and $27.8 million,
respectively, during its first five years of operations.53
The planned Montreign Resort Casino
will be a $452 million capital investment that is well-designed and attractive
to potential customers,
will open January 1, 2017 with a fully built out gaming facility that will
include 2,150 slot machines and 61 table games, and a 391-room luxury hotel,
as well as multiple dining and entertainment venues, meeting and conference
space, golf course, indoor water park, and specialty retail stores;
will (under an average case scenario) generate gross gaming revenue of
$211.1 million, $256.4 million, $301.6 million, $307.6 million, and $313.8
million, respectively, during its first five years of operations.
will (under an average case scenario) generate non-gaming revenue of $25.3
million, $30.8 million, $36.2 million, $36.9 million, and $37.7 million,
respectively, during its first five years of operations.54
53 New York State Gaming Commission, “Casino Applicant Materials and Presentation: River Casino & Resort at Mohawk Harbor,
Exhibit V. Executive Summary,” available at http://gaming.ny.gov/gaming/casinos.php?ID=1 provides an estimate of third year (CY
2019) stabilized gross gaming revenue. The estimates in this report assume that the facility reaches 70% of stabilized revenues in CY
2017, 85% in CY 2018 and 100% in CY 2019. It is further assumed that revenue grows by 2% annually in CY 2020 and CY 2021 and
that non-gaming revenue will constitute approximately 11% of its total gross cash revenue. 54 New York State Gaming Commission, “Casino Applicant Materials and Presentation: Montreign Resort Casino, Exhibit V.
Executive Summary,” available at http://gaming.ny.gov/gaming/casinos.php?ID=1 provides an estimate of third year (CY 2019)
stabilized gross gaming revenue. The estimates in this report assume that the facility reaches 70% of stabilized revenues in CY 2017,
85% in CY 2018 and 100% in CY 2019. It is further assumed that revenue grows by 2% annually in CY 2020 and CY 2021 and that
non-gaming revenue will constitute approximately 11% of its total gross cash revenue.
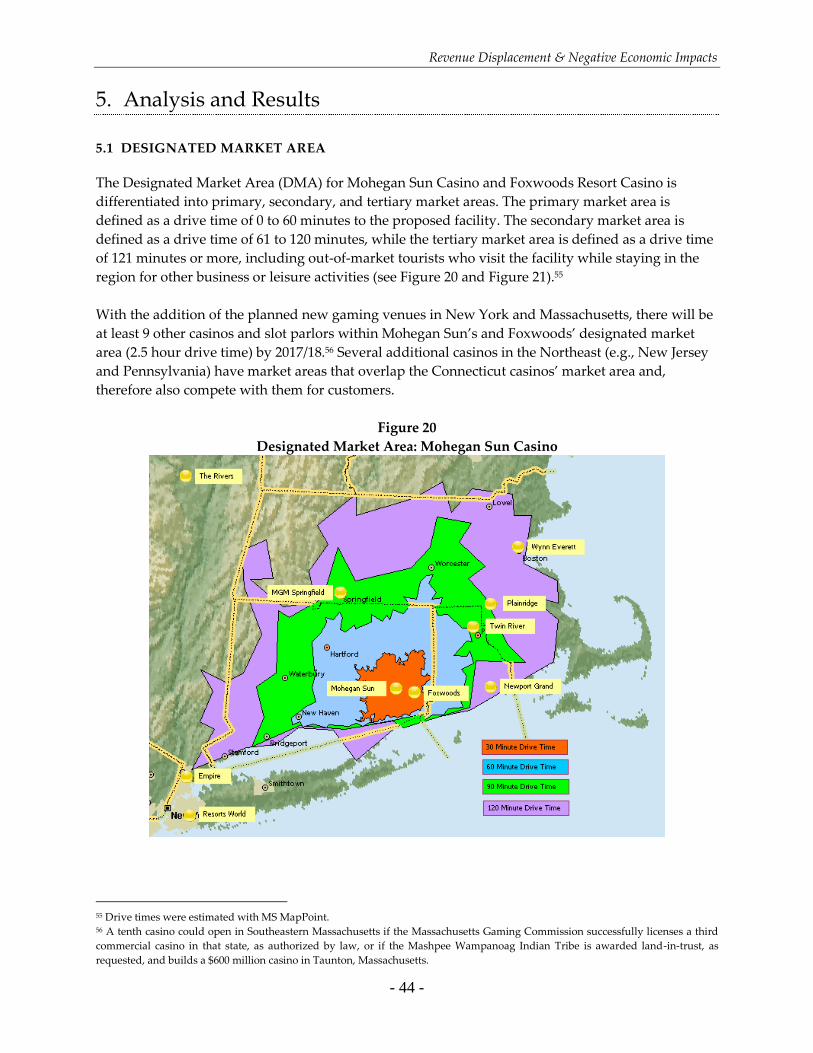
Revenue Displacement & Negative Economic Impacts
- 44 -
5. Analysis and Results
5.1 DESIGNATED MARKET AREA
The Designated Market Area (DMA) for Mohegan Sun Casino and Foxwoods Resort Casino is
differentiated into primary, secondary, and tertiary market areas. The primary market area is
defined as a drive time of 0 to 60 minutes to the proposed facility. The secondary market area is
defined as a drive time of 61 to 120 minutes, while the tertiary market area is defined as a drive time
of 121 minutes or more, including out-of-market tourists who visit the facility while staying in the
region for other business or leisure activities (see Figure 20 and Figure 21).55
With the addition of the planned new gaming venues in New York and Massachusetts, there will be
at least 9 other casinos and slot parlors within Mohegan Sun’s and Foxwoods’ designated market
area (2.5 hour drive time) by 2017/18.56 Several additional casinos in the Northeast (e.g., New Jersey
and Pennsylvania) have market areas that overlap the Connecticut casinos’ market area and,
therefore also compete with them for customers.
Figure 20
Designated Market Area: Mohegan Sun Casino
55 Drive times were estimated with MS MapPoint. 56 A tenth casino could open in Southeastern Massachusetts if the Massachusetts Gaming Commission successfully licenses a third
commercial casino in that state, as authorized by law, or if the Mashpee Wampanoag Indian Tribe is awarded land-in-trust, as
requested, and builds a $600 million casino in Taunton, Massachusetts.
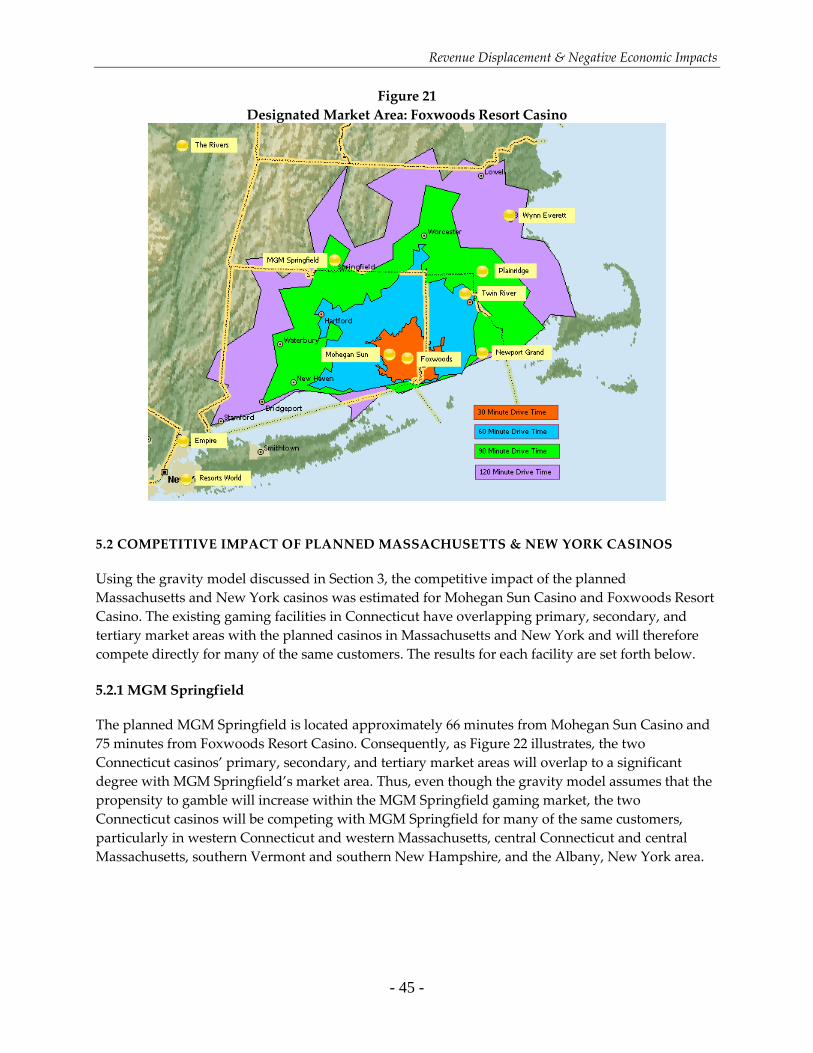
Revenue Displacement & Negative Economic Impacts
- 45 -
Figure 21
Designated Market Area: Foxwoods Resort Casino
5.2 COMPETITIVE IMPACT OF PLANNED MASSACHUSETTS & NEW YORK CASINOS
Using the gravity model discussed in Section 3, the competitive impact of the planned
Massachusetts and New York casinos was estimated for Mohegan Sun Casino and Foxwoods Resort
Casino. The existing gaming facilities in Connecticut have overlapping primary, secondary, and
tertiary market areas with the planned casinos in Massachusetts and New York and will therefore
compete directly for many of the same customers. The results for each facility are set forth below.
5.2.1 MGM Springfield
The planned MGM Springfield is located approximately 66 minutes from Mohegan Sun Casino and
75 minutes from Foxwoods Resort Casino. Consequently, as Figure 22 illustrates, the two
Connecticut casinos’ primary, secondary, and tertiary market areas will overlap to a significant
degree with MGM Springfield’s market area. Thus, even though the gravity model assumes that the
propensity to gamble will increase within the MGM Springfield gaming market, the two
Connecticut casinos will be competing with MGM Springfield for many of the same customers,
particularly in western Connecticut and western Massachusetts, central Connecticut and central
Massachusetts, southern Vermont and southern New Hampshire, and the Albany, New York area.
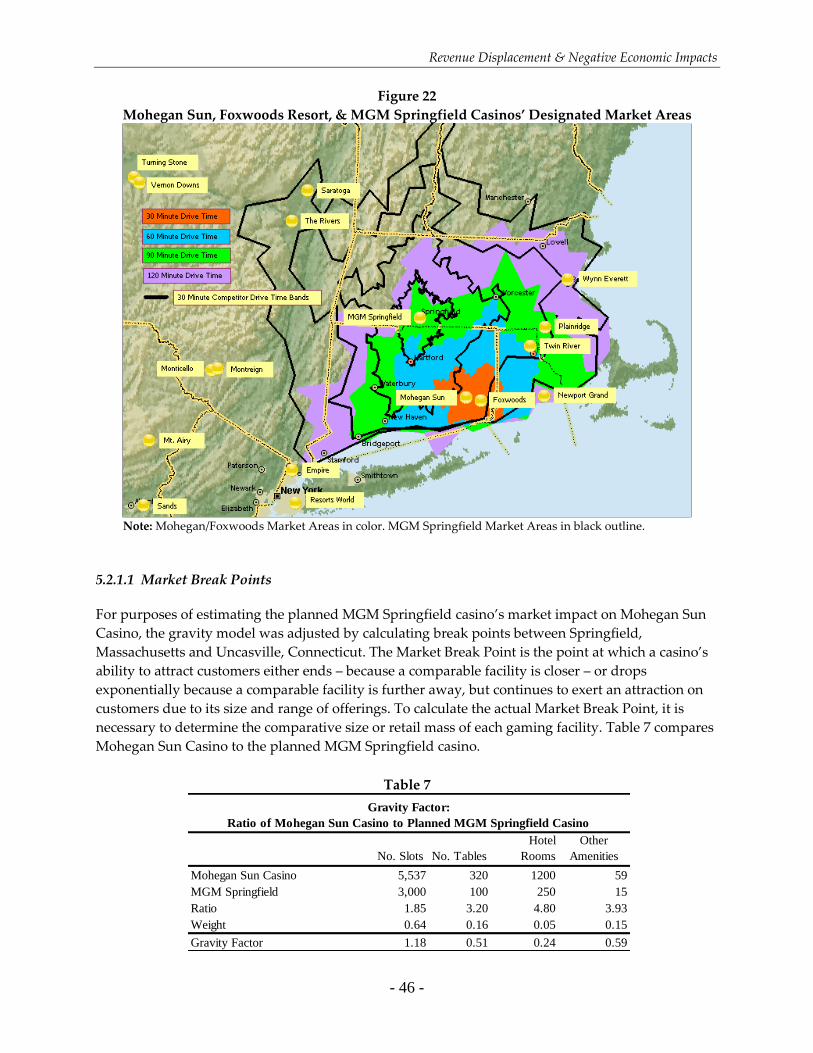
Revenue Displacement & Negative Economic Impacts
- 46 -
Figure 22
Mohegan Sun, Foxwoods Resort, & MGM Springfield Casinos’ Designated Market Areas
Note: Mohegan/Foxwoods Market Areas in color. MGM Springfield Market Areas in black outline.
5.2.1.1 Market Break Points
For purposes of estimating the planned MGM Springfield casino’s market impact on Mohegan Sun
Casino, the gravity model was adjusted by calculating break points between Springfield,
Massachusetts and Uncasville, Connecticut. The Market Break Point is the point at which a casino’s
ability to attract customers either ends – because a comparable facility is closer – or drops
exponentially because a comparable facility is further away, but continues to exert an attraction on
customers due to its size and range of offerings. To calculate the actual Market Break Point, it is
necessary to determine the comparative size or retail mass of each gaming facility. Table 7 compares
Mohegan Sun Casino to the planned MGM Springfield casino.
Table 7
No. Slots No. Tables
Hotel
Rooms
Other
Amenities
Mohegan Sun Casino 5,537 320 1200 59
MGM Springfield 3,000 100 250 15
Ratio 1.85 3.20 4.80 3.93
Weight 0.64 0.16 0.05 0.15
Gravity Factor 1.18 0.51 0.24 0.59
Gravity Factor:
Ratio of Mohegan Sun Casino to Planned MGM Springfield Casino
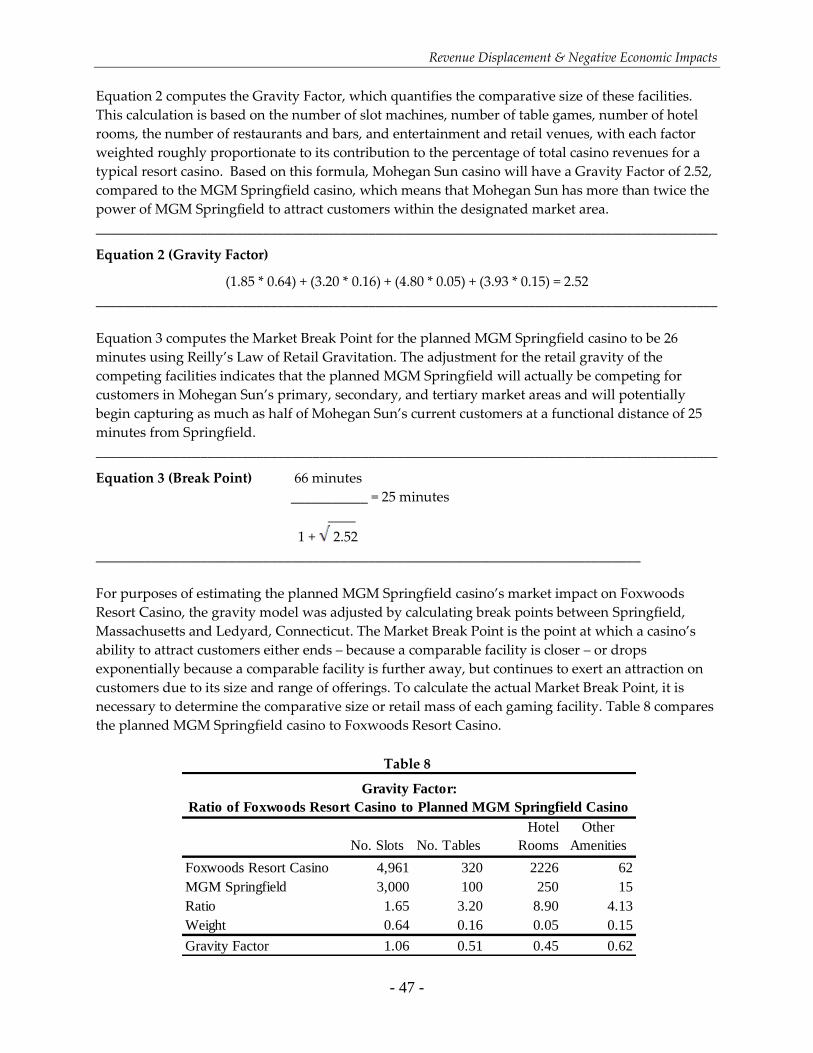
Revenue Displacement & Negative Economic Impacts
- 47 -
Equation 2 computes the Gravity Factor, which quantifies the comparative size of these facilities.
This calculation is based on the number of slot machines, number of table games, number of hotel
rooms, the number of restaurants and bars, and entertainment and retail venues, with each factor
weighted roughly proportionate to its contribution to the percentage of total casino revenues for a
typical resort casino. Based on this formula, Mohegan Sun casino will have a Gravity Factor of 2.52,
compared to the MGM Springfield casino, which means that Mohegan Sun has more than twice the
power of MGM Springfield to attract customers within the designated market area.
_________________________________________________________________________________________
Equation 2 (Gravity Factor)
(1.85 * 0.64) + (3.20 * 0.16) + (4.80 * 0.05) + (3.93 * 0.15) = 2.52
_________________________________________________________________________________________
Equation 3 computes the Market Break Point for the planned MGM Springfield casino to be 26
minutes using Reilly’s Law of Retail Gravitation. The adjustment for the retail gravity of the
competing facilities indicates that the planned MGM Springfield will actually be competing for
customers in Mohegan Sun’s primary, secondary, and tertiary market areas and will potentially
begin capturing as much as half of Mohegan Sun’s current customers at a functional distance of 25
minutes from Springfield.
_________________________________________________________________________________________
Equation 3 (Break Point) 66 minutes
___________ = 25 minutes
____
1 + 2.52
______________________________________________________________________________
For purposes of estimating the planned MGM Springfield casino’s market impact on Foxwoods
Resort Casino, the gravity model was adjusted by calculating break points between Springfield,
Massachusetts and Ledyard, Connecticut. The Market Break Point is the point at which a casino’s
ability to attract customers either ends – because a comparable facility is closer – or drops
exponentially because a comparable facility is further away, but continues to exert an attraction on
customers due to its size and range of offerings. To calculate the actual Market Break Point, it is
necessary to determine the comparative size or retail mass of each gaming facility. Table 8 compares
the planned MGM Springfield casino to Foxwoods Resort Casino.
Table 8
No. Slots No. Tables
Hotel
Rooms
Other
Amenities
Foxwoods Resort Casino 4,961 320 2226 62
MGM Springfield 3,000 100 250 15
Ratio 1.65 3.20 8.90 4.13
Weight 0.64 0.16 0.05 0.15
Gravity Factor 1.06 0.51 0.45 0.62
Gravity Factor:
Ratio of Foxwoods Resort Casino to Planned MGM Springfield Casino
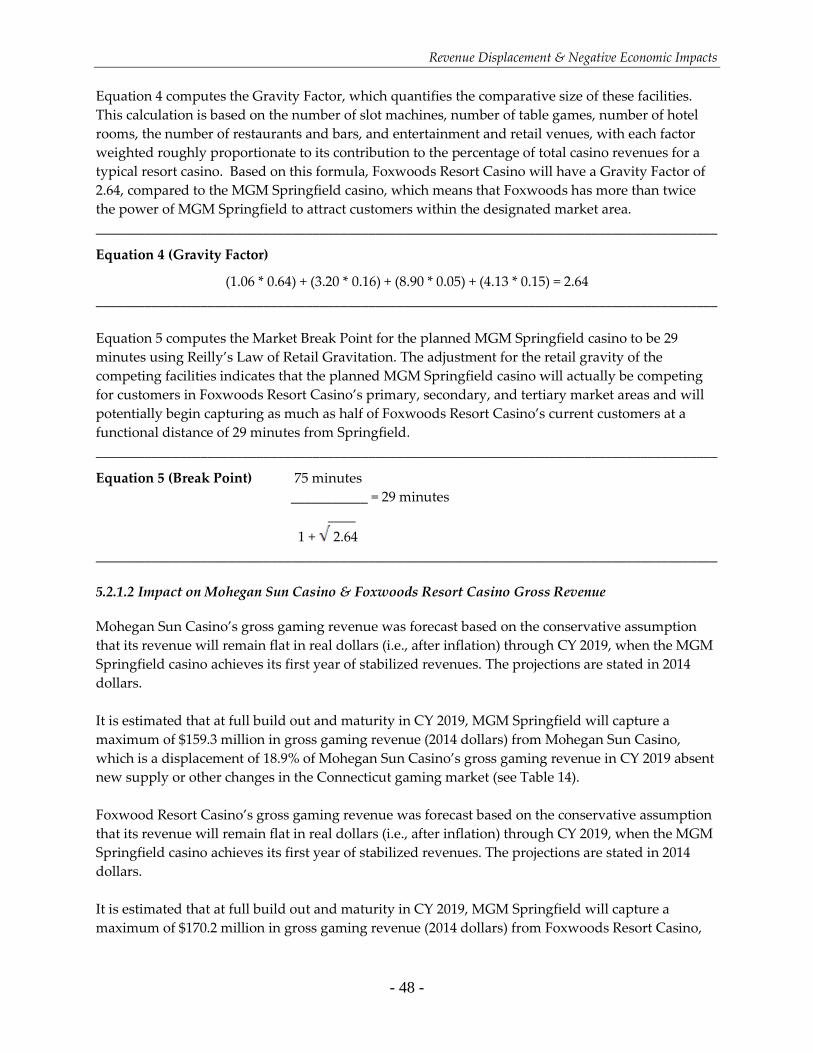
Revenue Displacement & Negative Economic Impacts
- 48 -
Equation 4 computes the Gravity Factor, which quantifies the comparative size of these facilities.
This calculation is based on the number of slot machines, number of table games, number of hotel
rooms, the number of restaurants and bars, and entertainment and retail venues, with each factor
weighted roughly proportionate to its contribution to the percentage of total casino revenues for a
typical resort casino. Based on this formula, Foxwoods Resort Casino will have a Gravity Factor of
2.64, compared to the MGM Springfield casino, which means that Foxwoods has more than twice
the power of MGM Springfield to attract customers within the designated market area.
_________________________________________________________________________________________
Equation 4 (Gravity Factor)
(1.06 * 0.64) + (3.20 * 0.16) + (8.90 * 0.05) + (4.13 * 0.15) = 2.64
_________________________________________________________________________________________
Equation 5 computes the Market Break Point for the planned MGM Springfield casino to be 29
minutes using Reilly’s Law of Retail Gravitation. The adjustment for the retail gravity of the
competing facilities indicates that the planned MGM Springfield casino will actually be competing
for customers in Foxwoods Resort Casino’s primary, secondary, and tertiary market areas and will
potentially begin capturing as much as half of Foxwoods Resort Casino’s current customers at a
functional distance of 29 minutes from Springfield.
_________________________________________________________________________________________
Equation 5 (Break Point) 75 minutes
___________ = 29 minutes
____
1 + 2.64
_________________________________________________________________________________________
5.2.1.2 Impact on Mohegan Sun Casino & Foxwoods Resort Casino Gross Revenue
Mohegan Sun Casino’s gross gaming revenue was forecast based on the conservative assumption
that its revenue will remain flat in real dollars (i.e., after inflation) through CY 2019, when the MGM
Springfield casino achieves its first year of stabilized revenues. The projections are stated in 2014
dollars.
It is estimated that at full build out and maturity in CY 2019, MGM Springfield will capture a
maximum of $159.3 million in gross gaming revenue (2014 dollars) from Mohegan Sun Casino,
which is a displacement of 18.9% of Mohegan Sun Casino’s gross gaming revenue in CY 2019 absent
new supply or other changes in the Connecticut gaming market (see Table 14).
Foxwood Resort Casino’s gross gaming revenue was forecast based on the conservative assumption
that its revenue will remain flat in real dollars (i.e., after inflation) through CY 2019, when the MGM
Springfield casino achieves its first year of stabilized revenues. The projections are stated in 2014
dollars.
It is estimated that at full build out and maturity in CY 2019, MGM Springfield will capture a
maximum of $170.2 million in gross gaming revenue (2014 dollars) from Foxwoods Resort Casino,
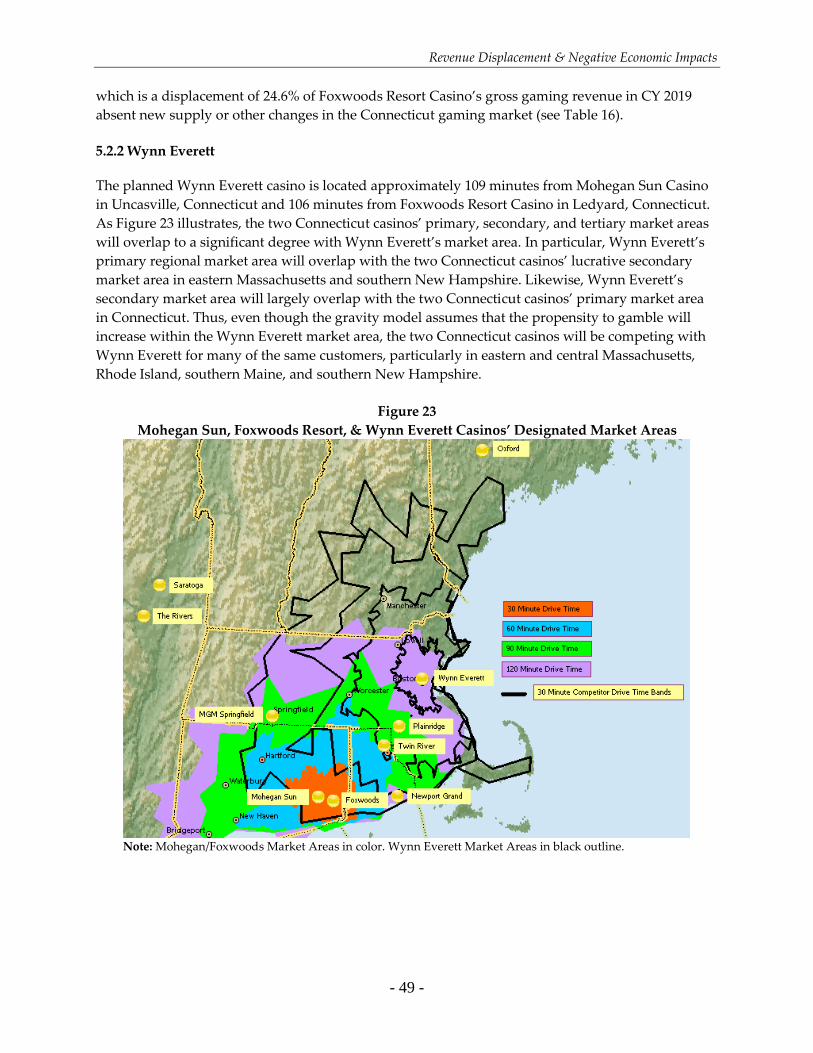
Revenue Displacement & Negative Economic Impacts
- 49 -
which is a displacement of 24.6% of Foxwoods Resort Casino’s gross gaming revenue in CY 2019
absent new supply or other changes in the Connecticut gaming market (see Table 16).
5.2.2 Wynn Everett
The planned Wynn Everett casino is located approximately 109 minutes from Mohegan Sun Casino
in Uncasville, Connecticut and 106 minutes from Foxwoods Resort Casino in Ledyard, Connecticut.
As Figure 23 illustrates, the two Connecticut casinos’ primary, secondary, and tertiary market areas
will overlap to a significant degree with Wynn Everett’s market area. In particular, Wynn Everett’s
primary regional market area will overlap with the two Connecticut casinos’ lucrative secondary
market area in eastern Massachusetts and southern New Hampshire. Likewise, Wynn Everett’s
secondary market area will largely overlap with the two Connecticut casinos’ primary market area
in Connecticut. Thus, even though the gravity model assumes that the propensity to gamble will
increase within the Wynn Everett market area, the two Connecticut casinos will be competing with
Wynn Everett for many of the same customers, particularly in eastern and central Massachusetts,
Rhode Island, southern Maine, and southern New Hampshire.
Figure 23
Mohegan Sun, Foxwoods Resort, & Wynn Everett Casinos’ Designated Market Areas
Note: Mohegan/Foxwoods Market Areas in color. Wynn Everett Market Areas in black outline.
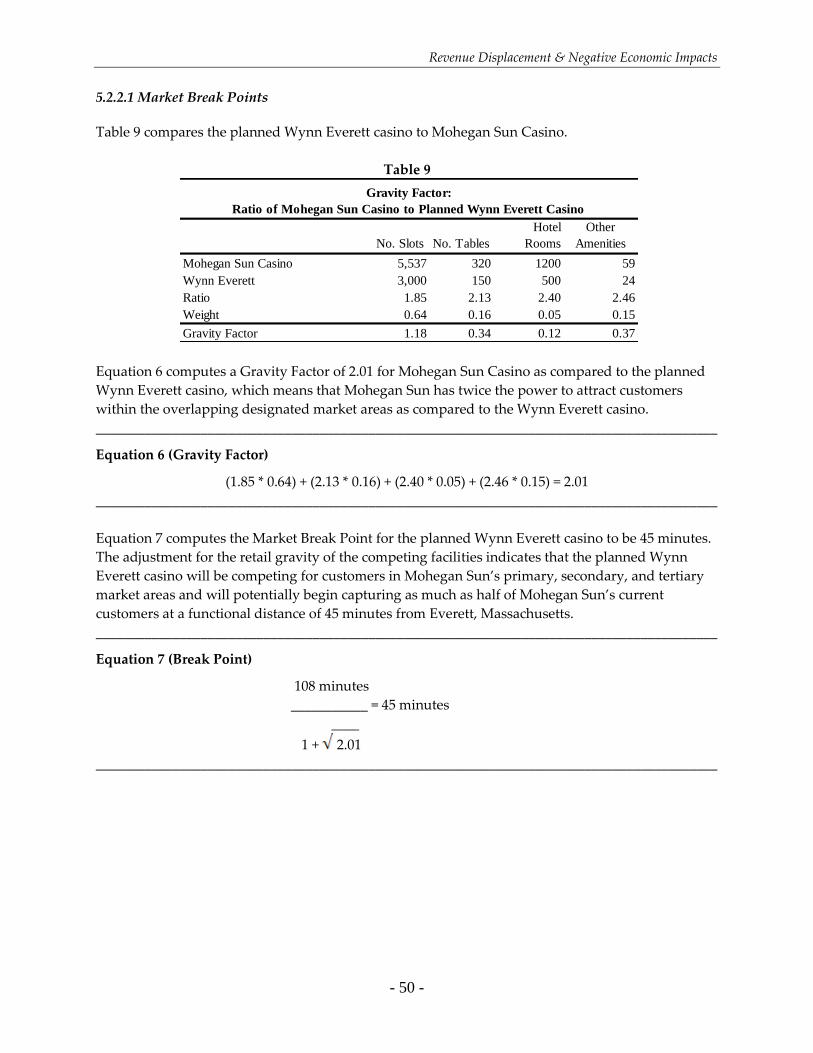
Revenue Displacement & Negative Economic Impacts
- 50 -
5.2.2.1 Market Break Points
Table 9 compares the planned Wynn Everett casino to Mohegan Sun Casino.
Table 9
No. Slots No. Tables
Hotel
Rooms
Other
Amenities
Mohegan Sun Casino 5,537 320 1200 59
Wynn Everett 3,000 150 500 24
Ratio 1.85 2.13 2.40 2.46
Weight 0.64 0.16 0.05 0.15
Gravity Factor 1.18 0.34 0.12 0.37
Gravity Factor:
Ratio of Mohegan Sun Casino to Planned Wynn Everett Casino
Equation 6 computes a Gravity Factor of 2.01 for Mohegan Sun Casino as compared to the planned
Wynn Everett casino, which means that Mohegan Sun has twice the power to attract customers
within the overlapping designated market areas as compared to the Wynn Everett casino.
_________________________________________________________________________________________
Equation 6 (Gravity Factor)
(1.85 * 0.64) + (2.13 * 0.16) + (2.40 * 0.05) + (2.46 * 0.15) = 2.01
_________________________________________________________________________________________
Equation 7 computes the Market Break Point for the planned Wynn Everett casino to be 45 minutes.
The adjustment for the retail gravity of the competing facilities indicates that the planned Wynn
Everett casino will be competing for customers in Mohegan Sun’s primary, secondary, and tertiary
market areas and will potentially begin capturing as much as half of Mohegan Sun’s current
customers at a functional distance of 45 minutes from Everett, Massachusetts.
_________________________________________________________________________________________
Equation 7 (Break Point)
108 minutes
___________ = 45 minutes
____
1 + 2.01
_________________________________________________________________________________________
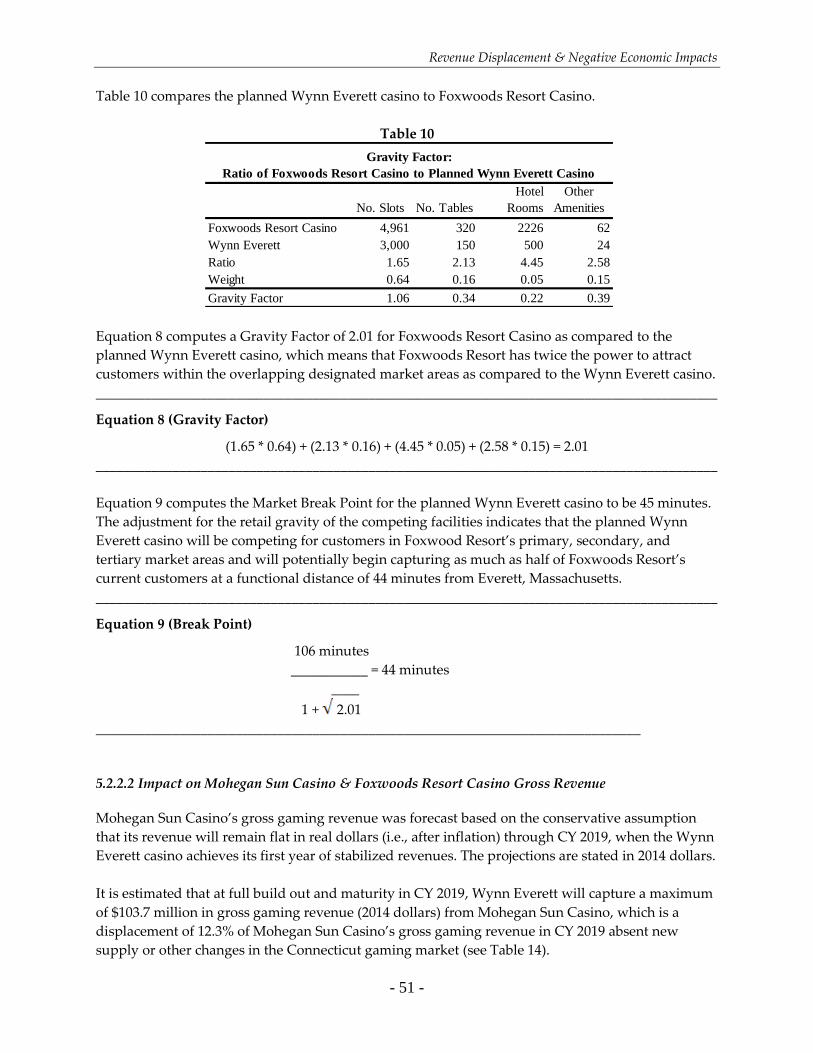
Revenue Displacement & Negative Economic Impacts
- 51 -
Table 10 compares the planned Wynn Everett casino to Foxwoods Resort Casino.
Table 10
No. Slots No. Tables
Hotel
Rooms
Other
Amenities
Foxwoods Resort Casino 4,961 320 2226 62
Wynn Everett 3,000 150 500 24
Ratio 1.65 2.13 4.45 2.58
Weight 0.64 0.16 0.05 0.15
Gravity Factor 1.06 0.34 0.22 0.39
Gravity Factor:
Ratio of Foxwoods Resort Casino to Planned Wynn Everett Casino
Equation 8 computes a Gravity Factor of 2.01 for Foxwoods Resort Casino as compared to the
planned Wynn Everett casino, which means that Foxwoods Resort has twice the power to attract
customers within the overlapping designated market areas as compared to the Wynn Everett casino.
_________________________________________________________________________________________
Equation 8 (Gravity Factor)
(1.65 * 0.64) + (2.13 * 0.16) + (4.45 * 0.05) + (2.58 * 0.15) = 2.01
_________________________________________________________________________________________
Equation 9 computes the Market Break Point for the planned Wynn Everett casino to be 45 minutes.
The adjustment for the retail gravity of the competing facilities indicates that the planned Wynn
Everett casino will be competing for customers in Foxwood Resort’s primary, secondary, and
tertiary market areas and will potentially begin capturing as much as half of Foxwoods Resort’s
current customers at a functional distance of 44 minutes from Everett, Massachusetts.
_________________________________________________________________________________________
Equation 9 (Break Point)
106 minutes
___________ = 44 minutes
____
1 + 2.01
______________________________________________________________________________
5.2.2.2 Impact on Mohegan Sun Casino & Foxwoods Resort Casino Gross Revenue
Mohegan Sun Casino’s gross gaming revenue was forecast based on the conservative assumption
that its revenue will remain flat in real dollars (i.e., after inflation) through CY 2019, when the Wynn
Everett casino achieves its first year of stabilized revenues. The projections are stated in 2014 dollars.
It is estimated that at full build out and maturity in CY 2019, Wynn Everett will capture a maximum
of $103.7 million in gross gaming revenue (2014 dollars) from Mohegan Sun Casino, which is a
displacement of 12.3% of Mohegan Sun Casino’s gross gaming revenue in CY 2019 absent new
supply or other changes in the Connecticut gaming market (see Table 14).
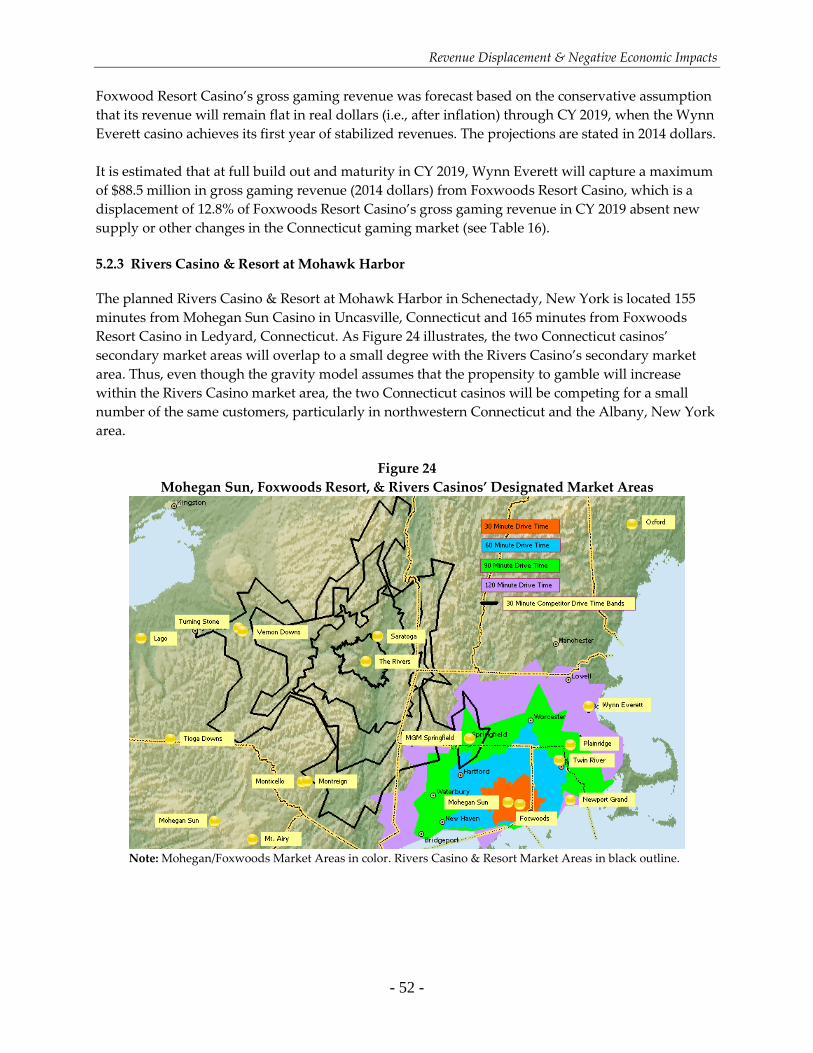
Revenue Displacement & Negative Economic Impacts
- 52 -
Foxwood Resort Casino’s gross gaming revenue was forecast based on the conservative assumption
that its revenue will remain flat in real dollars (i.e., after inflation) through CY 2019, when the Wynn
Everett casino achieves its first year of stabilized revenues. The projections are stated in 2014 dollars.
It is estimated that at full build out and maturity in CY 2019, Wynn Everett will capture a maximum
of $88.5 million in gross gaming revenue (2014 dollars) from Foxwoods Resort Casino, which is a
displacement of 12.8% of Foxwoods Resort Casino’s gross gaming revenue in CY 2019 absent new
supply or other changes in the Connecticut gaming market (see Table 16).
5.2.3 Rivers Casino & Resort at Mohawk Harbor
The planned Rivers Casino & Resort at Mohawk Harbor in Schenectady, New York is located 155
minutes from Mohegan Sun Casino in Uncasville, Connecticut and 165 minutes from Foxwoods
Resort Casino in Ledyard, Connecticut. As Figure 24 illustrates, the two Connecticut casinos’
secondary market areas will overlap to a small degree with the Rivers Casino’s secondary market
area. Thus, even though the gravity model assumes that the propensity to gamble will increase
within the Rivers Casino market area, the two Connecticut casinos will be competing for a small
number of the same customers, particularly in northwestern Connecticut and the Albany, New York
area.
Figure 24
Mohegan Sun, Foxwoods Resort, & Rivers Casinos’ Designated Market Areas
Note: Mohegan/Foxwoods Market Areas in color. Rivers Casino & Resort Market Areas in black outline.
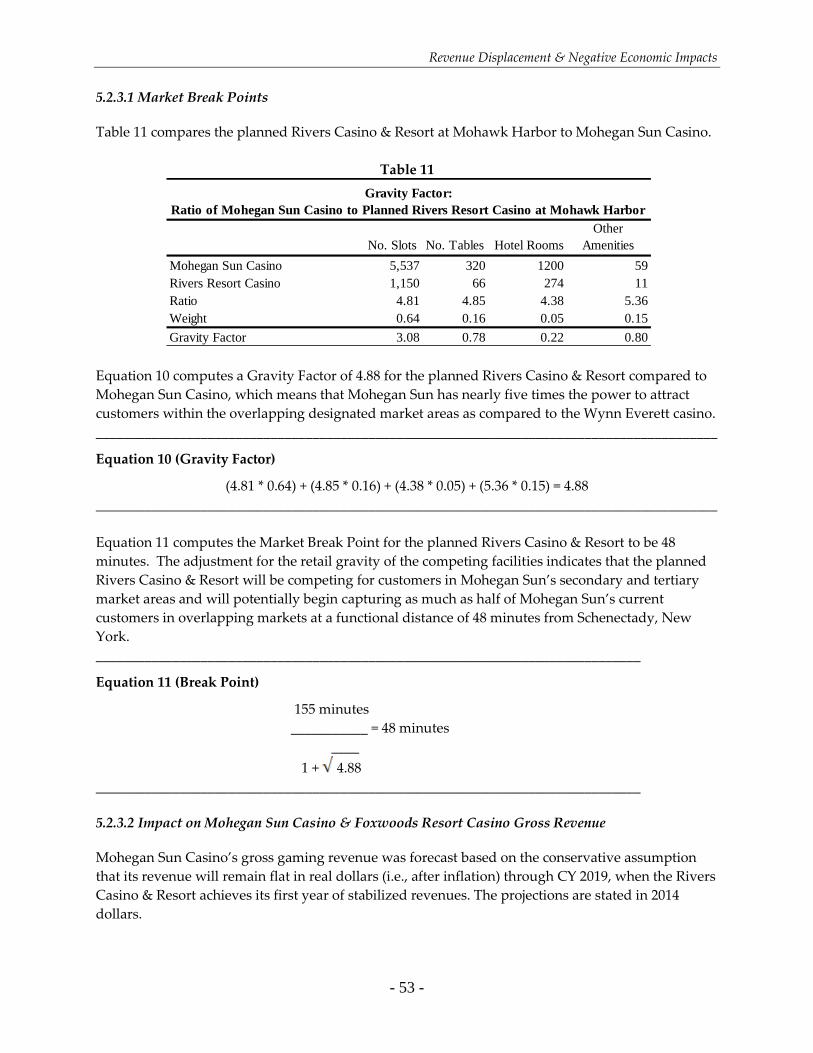
Revenue Displacement & Negative Economic Impacts
- 53 -
5.2.3.1 Market Break Points
Table 11 compares the planned Rivers Casino & Resort at Mohawk Harbor to Mohegan Sun Casino.
Table 11
No. Slots No. Tables Hotel Rooms
Other
Amenities
Mohegan Sun Casino 5,537 320 1200 59
Rivers Resort Casino 1,150 66 274 11
Ratio 4.81 4.85 4.38 5.36
Weight 0.64 0.16 0.05 0.15
Gravity Factor 3.08 0.78 0.22 0.80
Gravity Factor:
Ratio of Mohegan Sun Casino to Planned Rivers Resort Casino at Mohawk Harbor
Equation 10 computes a Gravity Factor of 4.88 for the planned Rivers Casino & Resort compared to
Mohegan Sun Casino, which means that Mohegan Sun has nearly five times the power to attract
customers within the overlapping designated market areas as compared to the Wynn Everett casino.
_________________________________________________________________________________________
Equation 10 (Gravity Factor)
(4.81 * 0.64) + (4.85 * 0.16) + (4.38 * 0.05) + (5.36 * 0.15) = 4.88
_________________________________________________________________________________________
Equation 11 computes the Market Break Point for the planned Rivers Casino & Resort to be 48
minutes. The adjustment for the retail gravity of the competing facilities indicates that the planned
Rivers Casino & Resort will be competing for customers in Mohegan Sun’s secondary and tertiary
market areas and will potentially begin capturing as much as half of Mohegan Sun’s current
customers in overlapping markets at a functional distance of 48 minutes from Schenectady, New
York.
______________________________________________________________________________
Equation 11 (Break Point)
155 minutes
___________ = 48 minutes
____
1 + 4.88
______________________________________________________________________________
5.2.3.2 Impact on Mohegan Sun Casino & Foxwoods Resort Casino Gross Revenue
Mohegan Sun Casino’s gross gaming revenue was forecast based on the conservative assumption
that its revenue will remain flat in real dollars (i.e., after inflation) through CY 2019, when the Rivers
Casino & Resort achieves its first year of stabilized revenues. The projections are stated in 2014
dollars.
Revenue Displacement & Negative Economic Impacts
- 54 -
It is estimated that at full build out and maturity in CY 2019, the Rivers Casino & Resort will capture
a maximum of $5.7 million in gross gaming revenue (2014 dollars) from Mohegan Sun Casino,
which is a displacement of 0.7% of Mohegan Sun Casino’s gross gaming revenue in CY 2019 absent
new supply or other changes in the Connecticut gaming market (see Table 14).57
Foxwood Resort Casino’s gross gaming revenue was forecast based on the conservative assumption
that its revenue will remain flat in real dollars (i.e., after inflation) through CY 2019, when the Rivers
Casino & Resort casino achieves its first year of stabilized revenues. The projections are stated in
2014 dollars.
It is estimated that at full build out and maturity in CY 2019, the Rivers Casino & Resort will capture
a maximum of $2.6 million in gross gaming revenue (2014 dollars) from Foxwoods Resort Casino,
which is a displacement of 0.4% of Foxwoods Resort Casino’s gross gaming revenue in CY 2019
absent new supply or other changes in the Connecticut gaming market (see Table 16).
5.2.4 Montreign Resort Casino
The planned Montreign Resort Casino in Thompson, New York is located 168 minutes from
Mohegan Sun Casino in Uncasville, Connecticut and 178 minutes from Foxwoods Resort Casino in
Ledyard, Connecticut. As Figure 25 illustrates, the two Connecticut casinos’ secondary market areas
will overlap to a small degree with the Montreign Resort Casino’s secondary market area. Thus,
even though the gravity model assumes that the propensity to gamble will increase within the
Montreign Resort Casino’s market area, the two Connecticut casinos will be competing for a small
number of the same customers, particularly in southwestern Connecticut and the lower Hudson
River Valley.
57 Rivers Casino & Resort’s impact on Mohegan Sun Casino and Foxwoods Resort Casino is the result of capturing customers from
the Greater Albany, New York area.
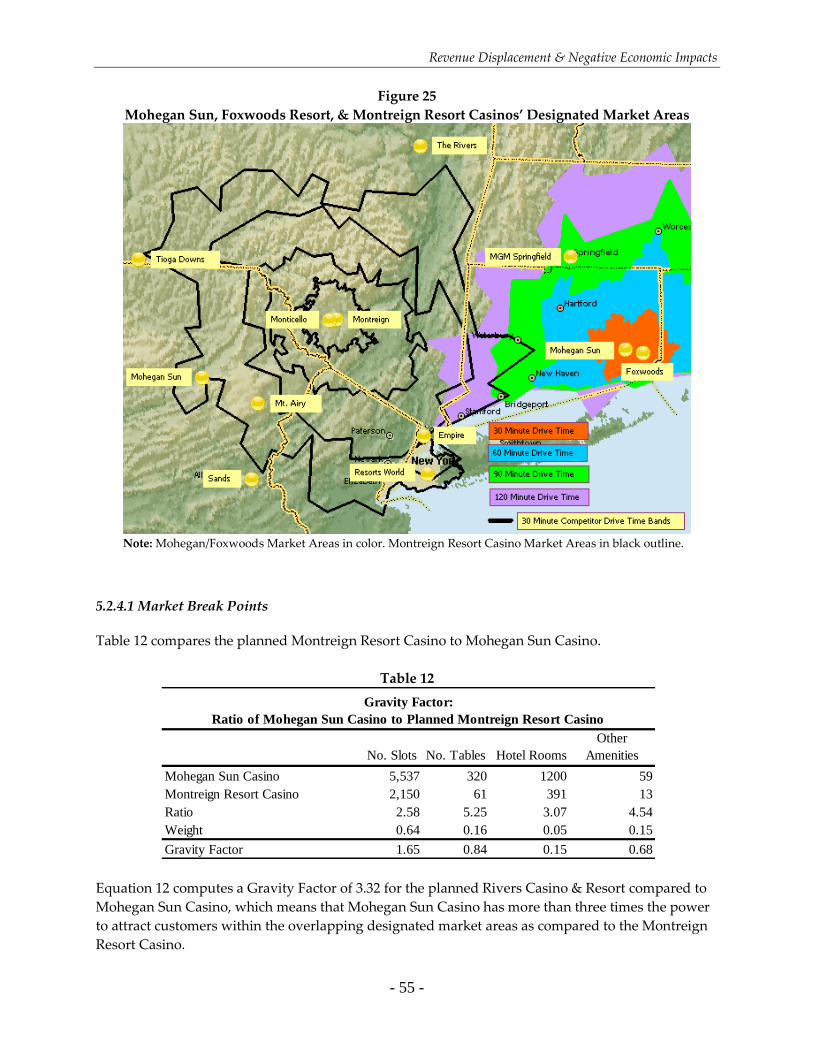
Revenue Displacement & Negative Economic Impacts
- 55 -
Figure 25
Mohegan Sun, Foxwoods Resort, & Montreign Resort Casinos’ Designated Market Areas
Note: Mohegan/Foxwoods Market Areas in color. Montreign Resort Casino Market Areas in black outline.
5.2.4.1 Market Break Points
Table 12 compares the planned Montreign Resort Casino to Mohegan Sun Casino.
Table 12
No. Slots No. Tables Hotel Rooms
Other
Amenities
Mohegan Sun Casino 5,537 320 1200 59
Montreign Resort Casino 2,150 61 391 13
Ratio 2.58 5.25 3.07 4.54
Weight 0.64 0.16 0.05 0.15
Gravity Factor 1.65 0.84 0.15 0.68
Gravity Factor:
Ratio of Mohegan Sun Casino to Planned Montreign Resort Casino
Equation 12 computes a Gravity Factor of 3.32 for the planned Rivers Casino & Resort compared to
Mohegan Sun Casino, which means that Mohegan Sun Casino has more than three times the power
to attract customers within the overlapping designated market areas as compared to the Montreign
Resort Casino.
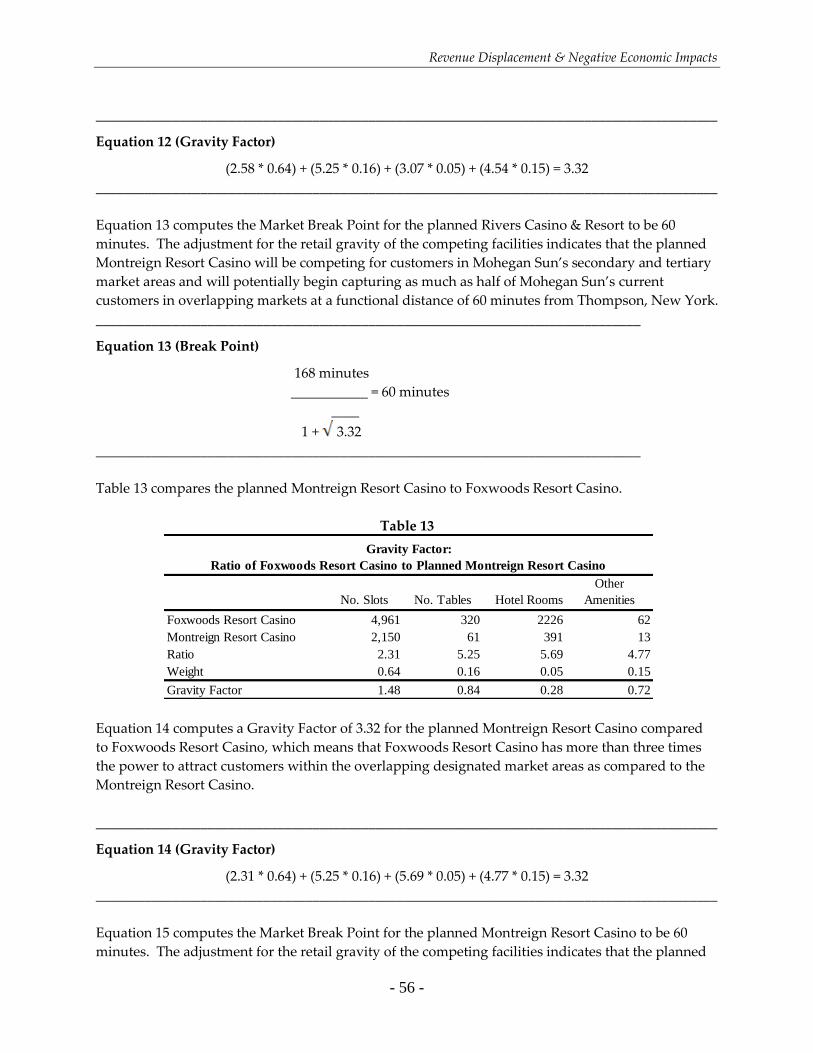
Revenue Displacement & Negative Economic Impacts
- 56 -
_________________________________________________________________________________________
Equation 12 (Gravity Factor)
(2.58 * 0.64) + (5.25 * 0.16) + (3.07 * 0.05) + (4.54 * 0.15) = 3.32
_________________________________________________________________________________________
Equation 13 computes the Market Break Point for the planned Rivers Casino & Resort to be 60
minutes. The adjustment for the retail gravity of the competing facilities indicates that the planned
Montreign Resort Casino will be competing for customers in Mohegan Sun’s secondary and tertiary
market areas and will potentially begin capturing as much as half of Mohegan Sun’s current
customers in overlapping markets at a functional distance of 60 minutes from Thompson, New York.
______________________________________________________________________________
Equation 13 (Break Point)
168 minutes
___________ = 60 minutes
____
1 + 3.32
______________________________________________________________________________
Table 13 compares the planned Montreign Resort Casino to Foxwoods Resort Casino.
Table 13
No. Slots No. Tables Hotel Rooms
Other
Amenities
Foxwoods Resort Casino 4,961 320 2226 62
Montreign Resort Casino 2,150 61 391 13
Ratio 2.31 5.25 5.69 4.77
Weight 0.64 0.16 0.05 0.15
Gravity Factor 1.48 0.84 0.28 0.72
Gravity Factor:
Ratio of Foxwoods Resort Casino to Planned Montreign Resort Casino
Equation 14 computes a Gravity Factor of 3.32 for the planned Montreign Resort Casino compared
to Foxwoods Resort Casino, which means that Foxwoods Resort Casino has more than three times
the power to attract customers within the overlapping designated market areas as compared to the
Montreign Resort Casino.
_________________________________________________________________________________________
Equation 14 (Gravity Factor)
(2.31 * 0.64) + (5.25 * 0.16) + (5.69 * 0.05) + (4.77 * 0.15) = 3.32
_________________________________________________________________________________________
Equation 15 computes the Market Break Point for the planned Montreign Resort Casino to be 60
minutes. The adjustment for the retail gravity of the competing facilities indicates that the planned
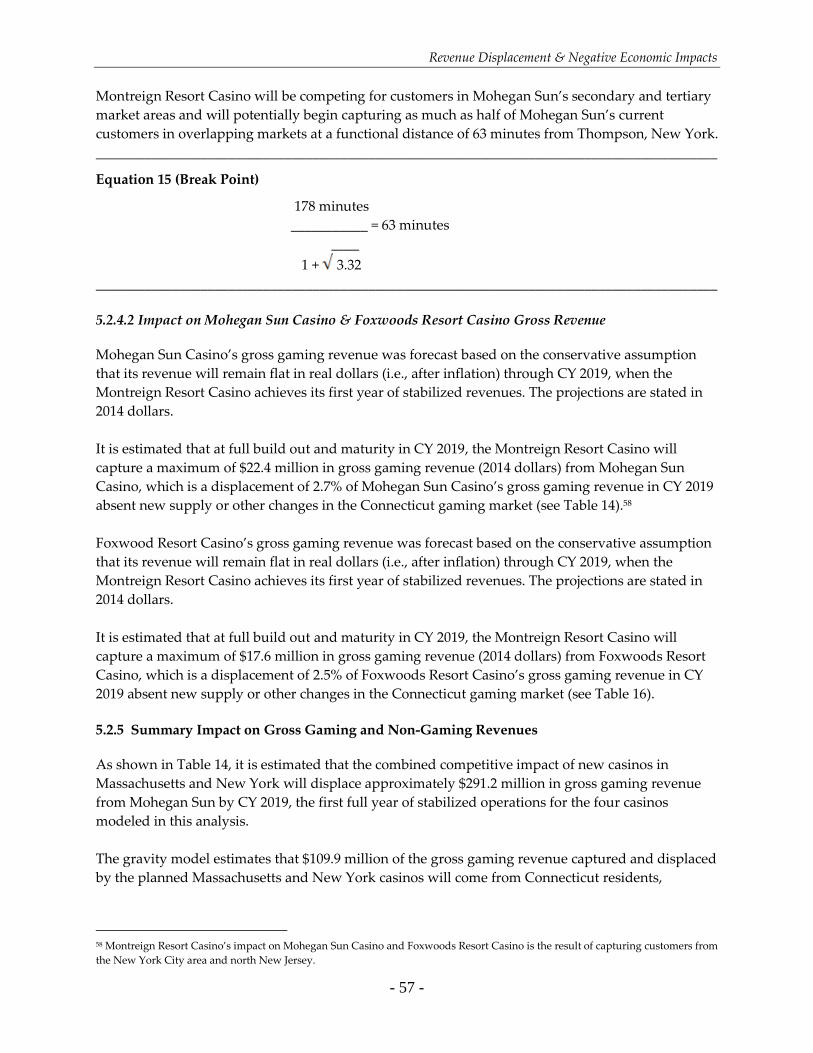
Revenue Displacement & Negative Economic Impacts
- 57 -
Montreign Resort Casino will be competing for customers in Mohegan Sun’s secondary and tertiary
market areas and will potentially begin capturing as much as half of Mohegan Sun’s current
customers in overlapping markets at a functional distance of 63 minutes from Thompson, New York.
_________________________________________________________________________________________
Equation 15 (Break Point)
178 minutes
___________ = 63 minutes
____
1 + 3.32
_________________________________________________________________________________________
5.2.4.2 Impact on Mohegan Sun Casino & Foxwoods Resort Casino Gross Revenue
Mohegan Sun Casino’s gross gaming revenue was forecast based on the conservative assumption
that its revenue will remain flat in real dollars (i.e., after inflation) through CY 2019, when the
Montreign Resort Casino achieves its first year of stabilized revenues. The projections are stated in
2014 dollars.
It is estimated that at full build out and maturity in CY 2019, the Montreign Resort Casino will
capture a maximum of $22.4 million in gross gaming revenue (2014 dollars) from Mohegan Sun
Casino, which is a displacement of 2.7% of Mohegan Sun Casino’s gross gaming revenue in CY 2019
absent new supply or other changes in the Connecticut gaming market (see Table 14).58
Foxwood Resort Casino’s gross gaming revenue was forecast based on the conservative assumption
that its revenue will remain flat in real dollars (i.e., after inflation) through CY 2019, when the
Montreign Resort Casino achieves its first year of stabilized revenues. The projections are stated in
2014 dollars.
It is estimated that at full build out and maturity in CY 2019, the Montreign Resort Casino will
capture a maximum of $17.6 million in gross gaming revenue (2014 dollars) from Foxwoods Resort
Casino, which is a displacement of 2.5% of Foxwoods Resort Casino’s gross gaming revenue in CY
2019 absent new supply or other changes in the Connecticut gaming market (see Table 16).
5.2.5 Summary Impact on Gross Gaming and Non-Gaming Revenues
As shown in Table 14, it is estimated that the combined competitive impact of new casinos in
Massachusetts and New York will displace approximately $291.2 million in gross gaming revenue
from Mohegan Sun by CY 2019, the first full year of stabilized operations for the four casinos
modeled in this analysis.
The gravity model estimates that $109.9 million of the gross gaming revenue captured and displaced
by the planned Massachusetts and New York casinos will come from Connecticut residents,
58 Montreign Resort Casino’s impact on Mohegan Sun Casino and Foxwoods Resort Casino is the result of capturing customers from
the New York City area and north New Jersey.
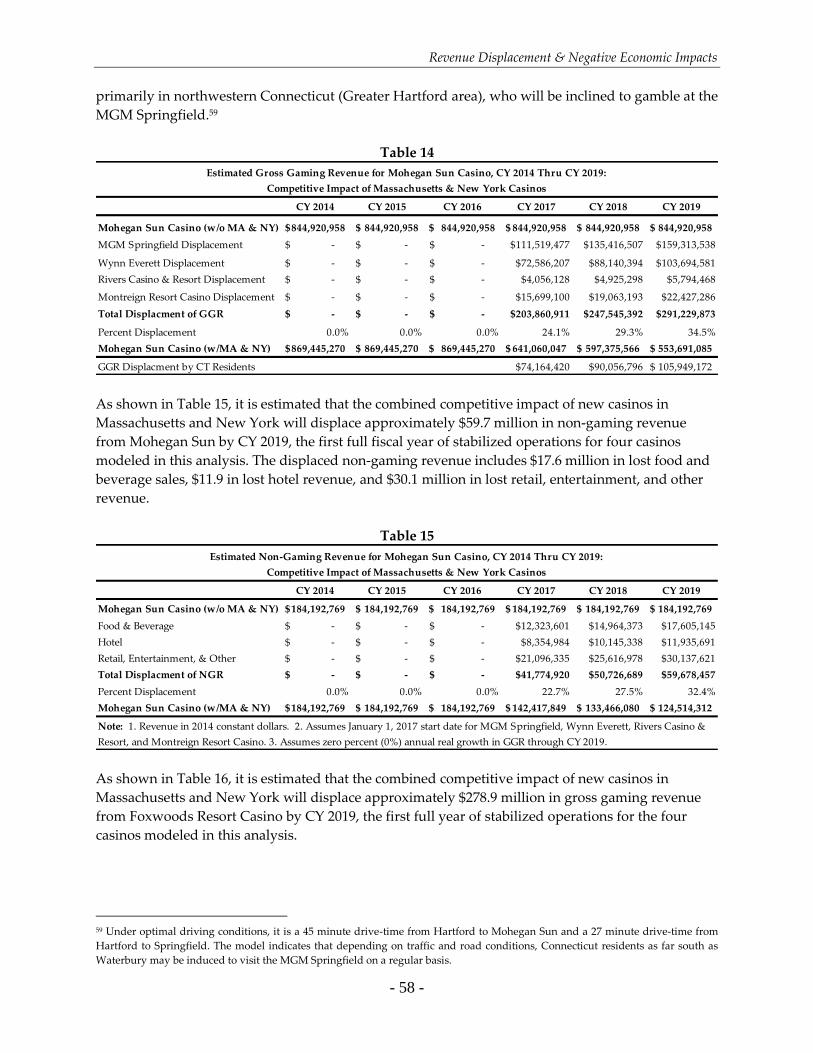
Revenue Displacement & Negative Economic Impacts
- 58 -
primarily in northwestern Connecticut (Greater Hartford area), who will be inclined to gamble at the
MGM Springfield.59
Table 14
CY 2014 CY 2015 CY 2016 CY 2017 CY 2018 CY 2019
Mohegan Sun Casino (w/o MA & NY) 844,920,958$ 844,920,958$ 844,920,958$ 844,920,958$ 844,920,958$ 844,920,958$
MGM Springfield Displacement -$ -$ -$ $111,519,477 $135,416,507 $159,313,538
Wynn Everett Displacement -$ -$ -$ $72,586,207 $88,140,394 $103,694,581
Rivers Casino & Resort Displacement -$ -$ -$ $4,056,128 $4,925,298 $5,794,468
Montreign Resort Casino Displacement -$ -$ -$ $15,699,100 $19,063,193 $22,427,286
Total Displacment of GGR -$ -$ -$ $203,860,911 $247,545,392 $291,229,873
Percent Displacement 0.0% 0.0% 0.0% 24.1% 29.3% 34.5%
Mohegan Sun Casino (w/MA & NY) 869,445,270$ 869,445,270$ 869,445,270$ 641,060,047$ 597,375,566$ 553,691,085$
GGR Displacment by CT Residents $74,164,420 $90,056,796 105,949,172$
Estimated Gross Gaming Revenue for Mohegan Sun Casino, CY 2014 Thru CY 2019:
Competitive Impact of Massachusetts & New York Casinos
As shown in Table 15, it is estimated that the combined competitive impact of new casinos in
Massachusetts and New York will displace approximately $59.7 million in non-gaming revenue
from Mohegan Sun by CY 2019, the first full fiscal year of stabilized operations for four casinos
modeled in this analysis. The displaced non-gaming revenue includes $17.6 million in lost food and
beverage sales, $11.9 in lost hotel revenue, and $30.1 million in lost retail, entertainment, and other
revenue.
Table 15
CY 2014 CY 2015 CY 2016 CY 2017 CY 2018 CY 2019
Mohegan Sun Casino (w/o MA & NY) 184,192,769$ 184,192,769$ 184,192,769$ 184,192,769$ 184,192,769$ 184,192,769$
Food & Beverage -$ -$ -$ $12,323,601 $14,964,373 $17,605,145
Hotel -$ -$ -$ $8,354,984 $10,145,338 $11,935,691
Retail, Entertainment, & Other -$ -$ -$ $21,096,335 $25,616,978 $30,137,621
Total Displacment of NGR -$ -$ -$ $41,774,920 $50,726,689 $59,678,457
Percent Displacement 0.0% 0.0% 0.0% 22.7% 27.5% 32.4%
Mohegan Sun Casino (w/MA & NY) 184,192,769$ 184,192,769$ 184,192,769$ 142,417,849$ 133,466,080$ 124,514,312$
Estimated Non-Gaming Revenue for Mohegan Sun Casino, CY 2014 Thru CY 2019:
Competitive Impact of Massachusetts & New York Casinos
Note: 1. Revenue in 2014 constant dollars. 2. Assumes January 1, 2017 start date for MGM Springfield, Wynn Everett, Rivers Casino &
Resort, and Montreign Resort Casino. 3. Assumes zero percent (0%) annual real growth in GGR through CY 2019.
As shown in Table 16, it is estimated that the combined competitive impact of new casinos in
Massachusetts and New York will displace approximately $278.9 million in gross gaming revenue
from Foxwoods Resort Casino by CY 2019, the first full year of stabilized operations for the four
casinos modeled in this analysis.
59 Under optimal driving conditions, it is a 45 minute drive-time from Hartford to Mohegan Sun and a 27 minute drive-time from
Hartford to Springfield. The model indicates that depending on traffic and road conditions, Connecticut residents as far south as
Waterbury may be induced to visit the MGM Springfield on a regular basis.
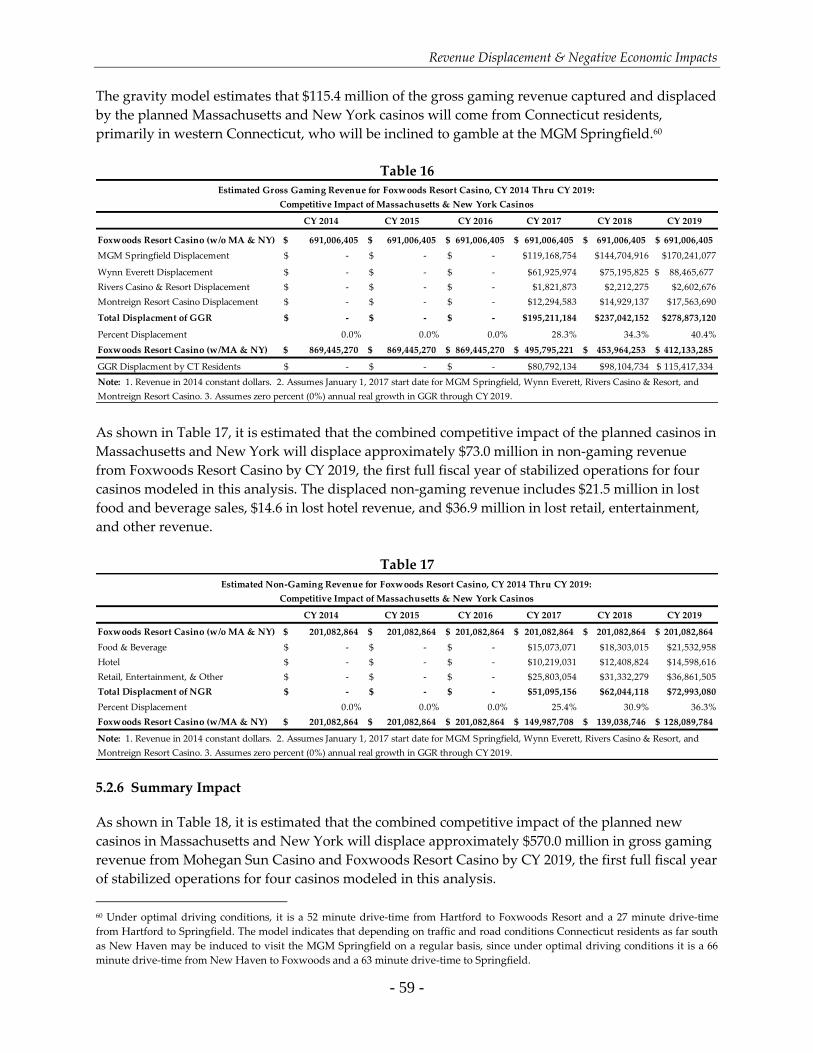
Revenue Displacement & Negative Economic Impacts
- 59 -
The gravity model estimates that $115.4 million of the gross gaming revenue captured and displaced
by the planned Massachusetts and New York casinos will come from Connecticut residents,
primarily in western Connecticut, who will be inclined to gamble at the MGM Springfield.60
Table 16
CY 2014 CY 2015 CY 2016 CY 2017 CY 2018 CY 2019
Foxwoods Resort Casino (w/o MA & NY) 691,006,405$ 691,006,405$ 691,006,405$ 691,006,405$ 691,006,405$ 691,006,405$
MGM Springfield Displacement -$ -$ -$ $119,168,754 $144,704,916 $170,241,077
Wynn Everett Displacement -$ -$ -$ $61,925,974 $75,195,825 $ 88,465,677
Rivers Casino & Resort Displacement -$ -$ -$ $1,821,873 $2,212,275 $2,602,676
Montreign Resort Casino Displacement -$ -$ -$ $12,294,583 $14,929,137 $17,563,690
Total Displacment of GGR -$ -$ -$ $195,211,184 $237,042,152 $278,873,120
Percent Displacement 0.0% 0.0% 0.0% 28.3% 34.3% 40.4%
Foxwoods Resort Casino (w/MA & NY) 869,445,270$ 869,445,270$ 869,445,270$ 495,795,221$ 453,964,253$ 412,133,285$
GGR Displacment by CT Residents -$ -$ -$ $80,792,134 $98,104,734 115,417,334$
Estimated Gross Gaming Revenue for Foxwoods Resort Casino, CY 2014 Thru CY 2019:
Competitive Impact of Massachusetts & New York Casinos
Note: 1. Revenue in 2014 constant dollars. 2. Assumes January 1, 2017 start date for MGM Springfield, Wynn Everett, Rivers Casino & Resort, and
Montreign Resort Casino. 3. Assumes zero percent (0%) annual real growth in GGR through CY 2019.
As shown in Table 17, it is estimated that the combined competitive impact of the planned casinos in
Massachusetts and New York will displace approximately $73.0 million in non-gaming revenue
from Foxwoods Resort Casino by CY 2019, the first full fiscal year of stabilized operations for four
casinos modeled in this analysis. The displaced non-gaming revenue includes $21.5 million in lost
food and beverage sales, $14.6 in lost hotel revenue, and $36.9 million in lost retail, entertainment,
and other revenue.
Table 17
CY 2014 CY 2015 CY 2016 CY 2017 CY 2018 CY 2019
Foxwoods Resort Casino (w/o MA & NY) 201,082,864$ 201,082,864$ 201,082,864$ 201,082,864$ 201,082,864$ 201,082,864$
Food & Beverage -$ -$ -$ $15,073,071 $18,303,015 $21,532,958
Hotel -$ -$ -$ $10,219,031 $12,408,824 $14,598,616
Retail, Entertainment, & Other -$ -$ -$ $25,803,054 $31,332,279 $36,861,505
Total Displacment of NGR -$ -$ -$ $51,095,156 $62,044,118 $72,993,080
Percent Displacement 0.0% 0.0% 0.0% 25.4% 30.9% 36.3%
Foxwoods Resort Casino (w/MA & NY) 201,082,864$ 201,082,864$ 201,082,864$ 149,987,708$ 139,038,746$ 128,089,784$
Estimated Non-Gaming Revenue for Foxwoods Resort Casino, CY 2014 Thru CY 2019:
Competitive Impact of Massachusetts & New York Casinos
Note: 1. Revenue in 2014 constant dollars. 2. Assumes January 1, 2017 start date for MGM Springfield, Wynn Everett, Rivers Casino & Resort, and
Montreign Resort Casino. 3. Assumes zero percent (0%) annual real growth in GGR through CY 2019.
5.2.6 Summary Impact
As shown in Table 18, it is estimated that the combined competitive impact of the planned new
casinos in Massachusetts and New York will displace approximately $570.0 million in gross gaming
revenue from Mohegan Sun Casino and Foxwoods Resort Casino by CY 2019, the first full fiscal year
of stabilized operations for four casinos modeled in this analysis.
60 Under optimal driving conditions, it is a 52 minute drive-time from Hartford to Foxwoods Resort and a 27 minute drive-time
from Hartford to Springfield. The model indicates that depending on traffic and road conditions Connecticut residents as far south
as New Haven may be induced to visit the MGM Springfield on a regular basis, since under optimal driving conditions it is a 66
minute drive-time from New Haven to Foxwoods and a 63 minute drive-time to Springfield.
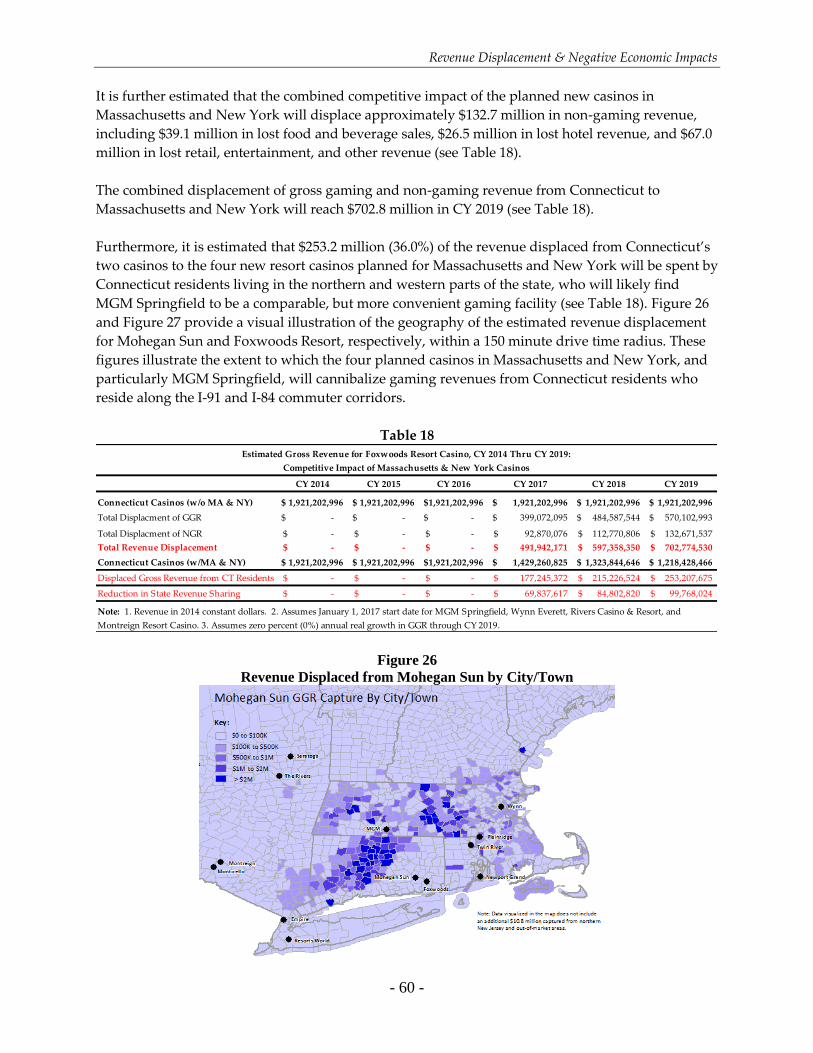
Revenue Displacement & Negative Economic Impacts
- 60 -
It is further estimated that the combined competitive impact of the planned new casinos in
Massachusetts and New York will displace approximately $132.7 million in non-gaming revenue,
including $39.1 million in lost food and beverage sales, $26.5 million in lost hotel revenue, and $67.0
million in lost retail, entertainment, and other revenue (see Table 18).
The combined displacement of gross gaming and non-gaming revenue from Connecticut to
Massachusetts and New York will reach $702.8 million in CY 2019 (see Table 18).
Furthermore, it is estimated that $253.2 million (36.0%) of the revenue displaced from Connecticut’s
two casinos to the four new resort casinos planned for Massachusetts and New York will be spent by
Connecticut residents living in the northern and western parts of the state, who will likely find
MGM Springfield to be a comparable, but more convenient gaming facility (see Table 18). Figure 26
and Figure 27 provide a visual illustration of the geography of the estimated revenue displacement
for Mohegan Sun and Foxwoods Resort, respectively, within a 150 minute drive time radius. These
figures illustrate the extent to which the four planned casinos in Massachusetts and New York, and
particularly MGM Springfield, will cannibalize gaming revenues from Connecticut residents who
reside along the I-91 and I-84 commuter corridors.
Table 18
CY 2014 CY 2015 CY 2016 CY 2017 CY 2018 CY 2019
Connecticut Casinos (w/o MA & NY) 1,921,202,996$ 1,921,202,996$ 1,921,202,996$ 1,921,202,996$ 1,921,202,996$ 1,921,202,996$
Total Displacment of GGR -$ -$ -$ 399,072,095$ 484,587,544$ 570,102,993$
Total Displacment of NGR -$ -$ -$ 92,870,076$ 112,770,806$ 132,671,537$
Total Revenue Displacement -$ -$ -$ 491,942,171$ 597,358,350$ 702,774,530$
Connecticut Casinos (w/MA & NY) 1,921,202,996$ 1,921,202,996$ 1,921,202,996$ 1,429,260,825$ 1,323,844,646$ 1,218,428,466$
Displaced Gross Revenue from CT Residents -$ -$ -$ 177,245,372$ 215,226,524$ 253,207,675$
Reduction in State Revenue Sharing -$ -$ -$ 69,837,617$ 84,802,820$ 99,768,024$
Estimated Gross Revenue for Foxwoods Resort Casino, CY 2014 Thru CY 2019:
Competitive Impact of Massachusetts & New York Casinos
Note: 1. Revenue in 2014 constant dollars. 2. Assumes January 1, 2017 start date for MGM Springfield, Wynn Everett, Rivers Casino & Resort, and
Montreign Resort Casino. 3. Assumes zero percent (0%) annual real growth in GGR through CY 2019.
Figure 26
Revenue Displaced from Mohegan Sun by City/Town
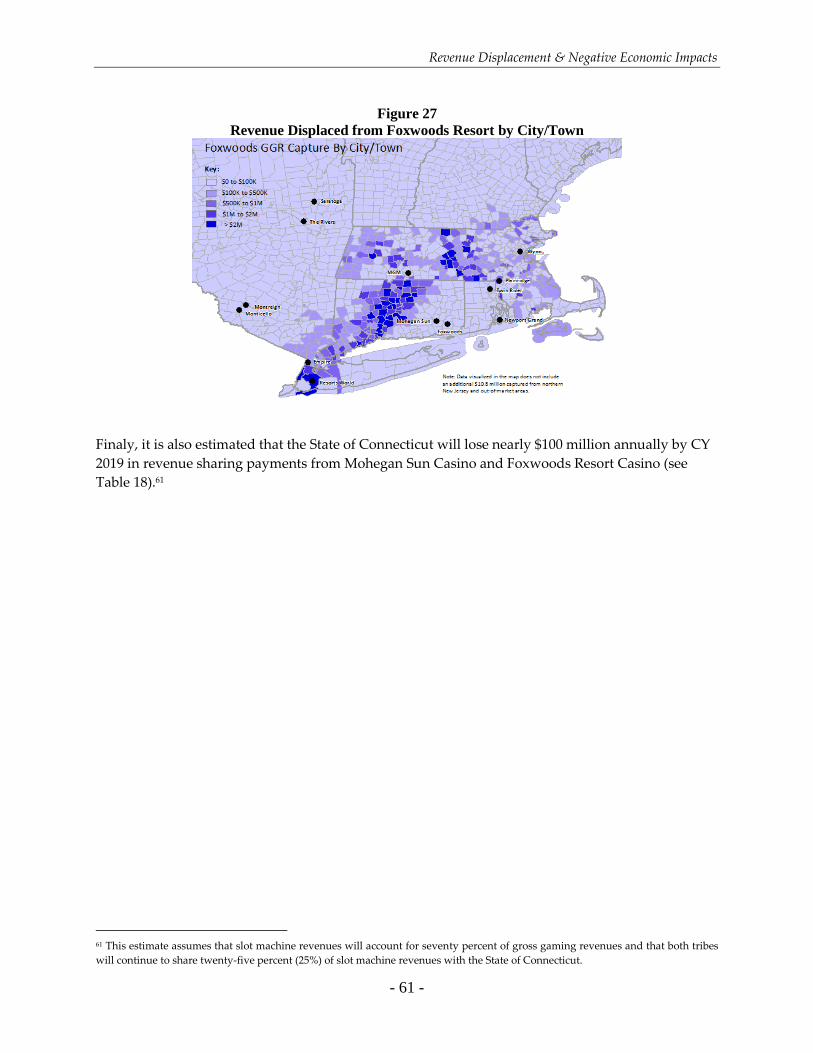
Revenue Displacement & Negative Economic Impacts
- 61 -
Figure 27
Revenue Displaced from Foxwoods Resort by City/Town
Finaly, it is also estimated that the State of Connecticut will lose nearly $100 million annually by CY
2019 in revenue sharing payments from Mohegan Sun Casino and Foxwoods Resort Casino (see
Table 18).61
61 This estimate assumes that slot machine revenues will account for seventy percent of gross gaming revenues and that both tribes
will continue to share twenty-five percent (25%) of slot machine revenues with the State of Connecticut.
Revenue Displacement & Negative Economic Impacts
- 62 -
6. Negative Economic Impacts
The Consultant conducted an economic impact analysis of Foxwoods and Mohegan Sun operations
(payroll and vendor expenditures) to estimate the negative economic effects of revenue
displacement and subsequent job losses at Connecticut’s two casinos. These impacts are expressed
as direct, indirect, and induced economic impacts.
Negative Direct Impacts: Job losses and subsequent wages lost as a result of additional
layoffs and lower employment levels at the two casinos.62
Negative Indirect Impacts: Downsized operations due to inter-state revenue displacement
resulting in a reduction in local purchases from Connecticut vendors.
Negative Induced Impacts: Lost wages by former casino employees resulting in lower
spending by these former employees, which in turn negatively impacts businesses that rely
on these expenditures (e.g., grocery stores, gas stations, restaurants, clothing stores).63
6.1 DEFINITIONS
Many specialized terms and concepts are utilized in measuring the economic impacts of the gaming
(or any other) industry. Economic impacts measure the importance of an economic activity primarily
in terms of the output (total gross revenues), employment, and personal income generated by that
activity:
Output -- the value of goods and services produced at the identified business
establishment or construction project.
Employment -- the number of people employed at the identified business
establishment or construction project, including wage and salary employees and self-
employed persons.
Personal income -- the wages, benefits, and other income derived from employment
that is linked geographically to the identified work site.
Economic impacts consist of direct impacts, indirect impacts, induced impacts, and total impacts.
Direct impacts are the economic activities carried out at a business establishment or construction
62 It is possible that some of the casino employees who lose jobs in Connecticut could find comparable employment at
MGM Springfield, particularly if they live near the Massachusetts border, but one of the criteria for awarding and
renewing the casino licenses in Massachusetts is that casino operators demonstrate a commitment to hiring local
Massachusetts residents and buying from local Massachusetts vendors. 63 Most of the take-home income earned by employees is spent locally. Some of this spending becomes income to
local individuals who provide services to employees. Some of the spending by employees goes to local businesses
and becomes income to the business owners and their employees. Subsequently, part of these second-round incomes
are also spent locally and thus become income to another set of individuals. As successive rounds of spending occur,
additional income is lost in the local area, region, and state. The impact of these successive rounds of spending is
called the multiplier effect.
Revenue Displacement & Negative Economic Impacts
- 63 -
project and are therefore an immediate consequence of the economic activity that would not have
occurred in the absence of the business establishment or construction project.
Indirect impacts derive primarily from off-site economic activities that are attributable to the
identified business establishment. These economic activities occur mainly as a result of non-payroll
expenditures by the business within a defined local area (i.e., town, city, county, metropolitan
statistical area). Local expenditures include a range of operating expenses such as construction
materials, office supplies, motor transport, horticultural services, furniture, utilities, maintenance
and repairs, business machines, business services, management consulting, and so forth. Indirect
impacts differ from direct impacts insofar as they originate entirely off-site, although the indirect
impacts would not have occurred in the absence of the identified business establishment.
Induced impacts are the multiplier effects of the direct and indirect impacts created by successive
rounds of spending by employees and proprietors. Total impacts are the sum of the direct, indirect,
and induced impacts.
The direct, indirect, and induced impacts for this study are specified using IMPLAN (IMpact
Analysis for PLANing), which is an econometric modeling system developed by applied economists
at the University of Minnesota and the U.S. Forest Service. The IMPLAN modeling system has been
in use since 1979 and is currently used by over 500 private consulting firms, university research
centers, and government agencies. The Consultant has been a licensed IMPLAN user since 1999 and
regularly employs its econometric modeling system in conducting economic and fiscal impact
analyses.
6.2 IMPLAN MODELING SYSTEM
The IMPLAN modeling system combines the U.S. Bureau of Economic Analysis’ Input-Output
Benchmarks with other data to construct quantitative models of trade flow relationships between
businesses and between businesses and final consumers. From this data, one can examine the effects
of a change in one or several economic activities to predict its effect on a specific state, regional, or
local economy (impact analysis). The IMPLAN input-output accounts capture all monetary market
transactions for consumption in a given time period. The IMPLAN input-output accounts are based
on industry survey data collected periodically by the U.S. Bureau of Economic Analysis and follow a
balanced account format recommended by the United Nations.
IMPLAN also includes social accounting data (e.g., personal income and gross state product) that
makes it possible to measure non-industrial transactions such as the payment of indirect taxes by
businesses and households. The IMPLAN data base provides data coverage for the entire United
States by county and has the ability to incorporate user-supplied data at each stage of the model
building process to insure that estimates of economic impacts are both up-to-date and specific to an
economic impact area.64 IMPLAN can construct local input-output models in units as small as five-
zip code clusters.
64 The IMPLAN modeling system draws on a variety of statistical sources, including the Bureau of Labor Statistics
Growth Model, Bureau of the Census population data, ES-202 employment and earnings data, the Regional
Economic Information System (REIS), and the Bureau of Economic Analysis Gross State Product data.
Revenue Displacement & Negative Economic Impacts
- 64 -
IMPLAN’s Regional Economic Accounts and the Social Accounting Matrices are used to construct
local, county, or state-level multipliers specific to an impact area. Multipliers describe the response
of an economy to a change in demand or production. The multipliers allow economic impact
analysis to move from a descriptive input-outputs model to a predictive model. Each industry that
produces goods or services generates demand for other goods and services and this demand is
multiplied through a particular economy until it dissipates through “leakage” to economies outside
the specified area. Thus, multipliers calculate the response of the economic impact area to a change
in demand or production.
IMPLAN models discern and calculate leakage from local, regional, and state economic areas based on
workforce configuration, the inputs required by specific types of businesses, and the availability of
both inputs in the economic area. Consequently, economic impacts that accrue to other regions or states
as a consequence of a change in demand are not counted as impacts within the economic area. The model
accounts for substitution and displacement effects by deflating industry-specific multipliers to levels
well below those recommended by the U.S. Bureau of Economic Analysis. In addition, multipliers
are applied only to personal disposable income to obtain a more realistic estimate of the multiplier
effects from increased demand. The reliability of these estimates has been proven through empirical
testing (Department of Commerce 1981; Brucker et al 1990).
A predictive model is constructed by specifying a series of new expenditures in a specific economic
area (e.g., new employment or construction), which is then applied to the industry multipliers for
that particular region. Based on these calculations, the model estimates final demand, which
includes employment, employee compensation (excluding benefits), and point-of-work personal
income (including benefits). The initial IMPLAN data details all purchases in a given area, including
imported goods and services. Importantly, IMPLAN’s Regional Economic Accounts exclude imports
to an economic area so the calculation of economic impacts identifies only those impacts specific to
the economic impact area. IMPLAN calculates this distinction by applying Regional Purchase
Coefficients (RPC) to predict regional purchases based on an economic area’s particular
characteristics. The Regional Purchase Coefficient represents the proportion of goods and services
that will be purchased regionally under normal circumstances, based on the area’s economic
characteristics described in terms of actual trade flows within the area.
The Consultant built an input-output model for the State of Connecticut using the IMPLAN
Professional 3.1 model building software and data packages. The data used in the model are for
2013, which is the latest available. Where necessary, all inputs were converted to 2013 dollars using
appropriate deflators (producer price indices for industrial commodities and the personal
consumption expenditure deflator for personal income). Model outputs are reported in 2015 dollars.
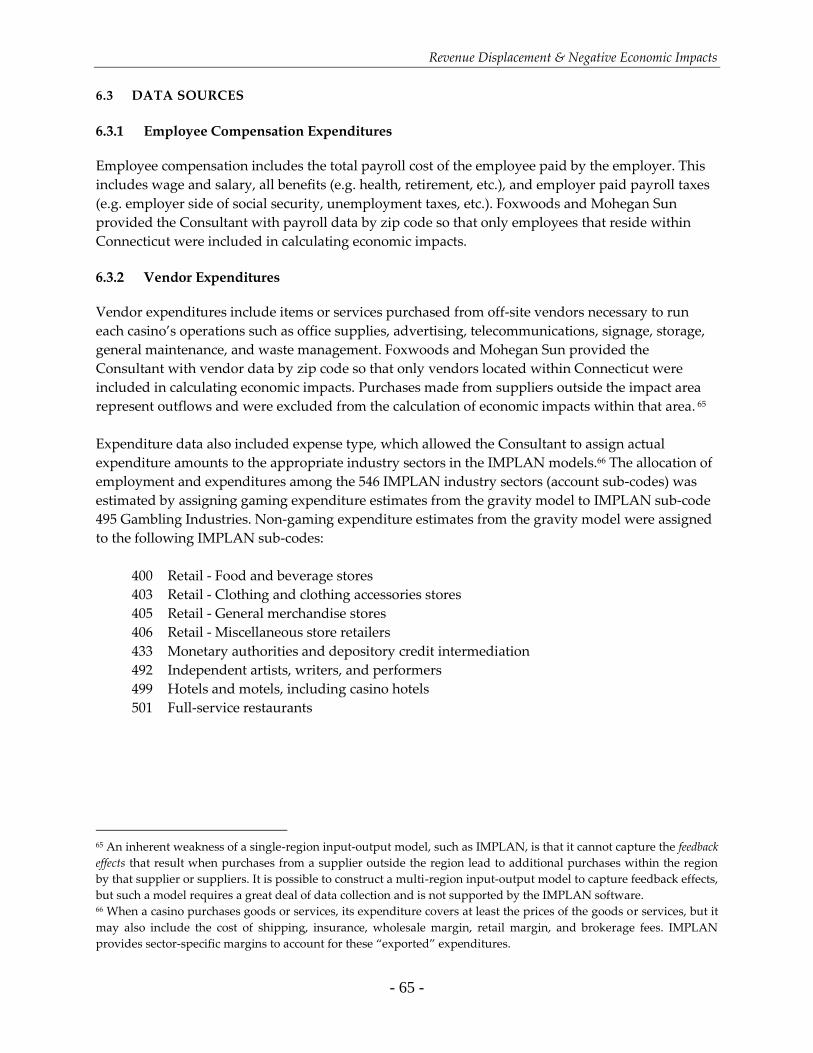
Revenue Displacement & Negative Economic Impacts
- 65 -
6.3 DATA SOURCES
6.3.1 Employee Compensation Expenditures
Employee compensation includes the total payroll cost of the employee paid by the employer. This
includes wage and salary, all benefits (e.g. health, retirement, etc.), and employer paid payroll taxes
(e.g. employer side of social security, unemployment taxes, etc.). Foxwoods and Mohegan Sun
provided the Consultant with payroll data by zip code so that only employees that reside within
Connecticut were included in calculating economic impacts.
6.3.2 Vendor Expenditures
Vendor expenditures include items or services purchased from off-site vendors necessary to run
each casino’s operations such as office supplies, advertising, telecommunications, signage, storage,
general maintenance, and waste management. Foxwoods and Mohegan Sun provided the
Consultant with vendor data by zip code so that only vendors located within Connecticut were
included in calculating economic impacts. Purchases made from suppliers outside the impact area
represent outflows and were excluded from the calculation of economic impacts within that area. 65
Expenditure data also included expense type, which allowed the Consultant to assign actual
expenditure amounts to the appropriate industry sectors in the IMPLAN models.66 The allocation of
employment and expenditures among the 546 IMPLAN industry sectors (account sub-codes) was
estimated by assigning gaming expenditure estimates from the gravity model to IMPLAN sub-code
495 Gambling Industries. Non-gaming expenditure estimates from the gravity model were assigned
to the following IMPLAN sub-codes:
400 Retail - Food and beverage stores
403 Retail - Clothing and clothing accessories stores
405 Retail - General merchandise stores
406 Retail - Miscellaneous store retailers
433 Monetary authorities and depository credit intermediation
492 Independent artists, writers, and performers
499 Hotels and motels, including casino hotels
501 Full-service restaurants
65 An inherent weakness of a single-region input-output model, such as IMPLAN, is that it cannot capture the feedback
effects that result when purchases from a supplier outside the region lead to additional purchases within the region
by that supplier or suppliers. It is possible to construct a multi-region input-output model to capture feedback effects,
but such a model requires a great deal of data collection and is not supported by the IMPLAN software. 66 When a casino purchases goods or services, its expenditure covers at least the prices of the goods or services, but it
may also include the cost of shipping, insurance, wholesale margin, retail margin, and brokerage fees. IMPLAN
provides sector-specific margins to account for these “exported” expenditures.
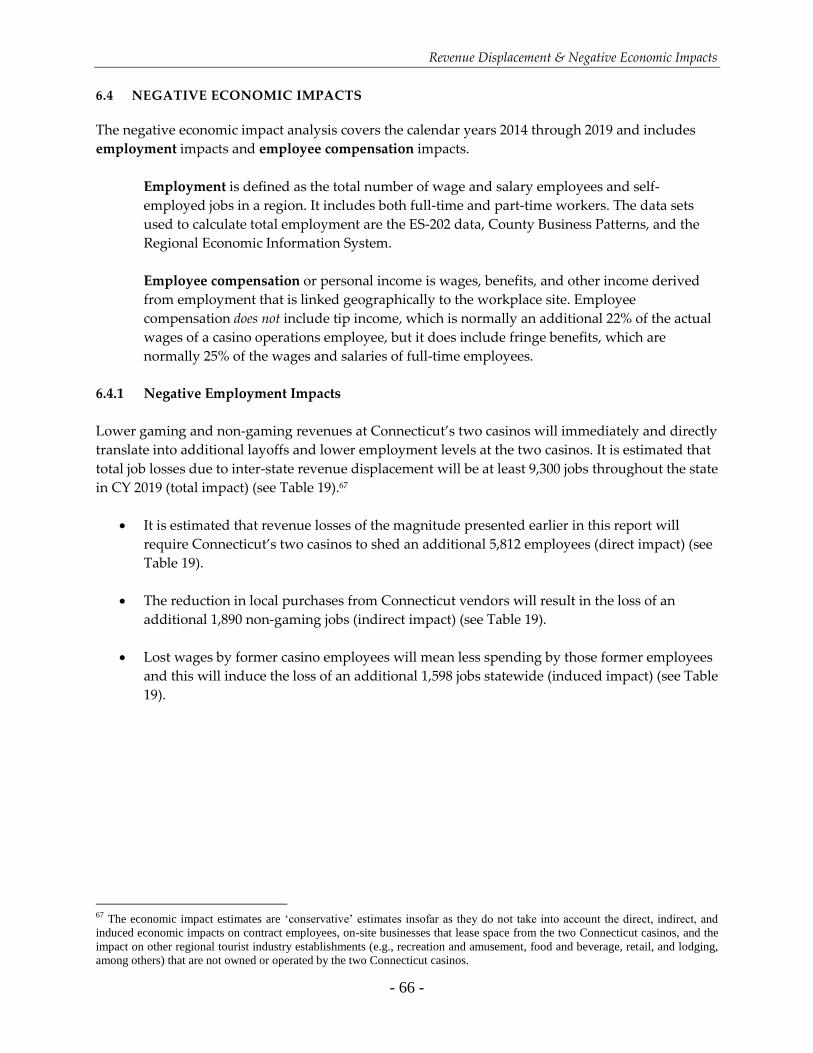
Revenue Displacement & Negative Economic Impacts
- 66 -
6.4 NEGATIVE ECONOMIC IMPACTS
The negative economic impact analysis covers the calendar years 2014 through 2019 and includes
employment impacts and employee compensation impacts.
Employment is defined as the total number of wage and salary employees and self-
employed jobs in a region. It includes both full-time and part-time workers. The data sets
used to calculate total employment are the ES-202 data, County Business Patterns, and the
Regional Economic Information System.
Employee compensation or personal income is wages, benefits, and other income derived
from employment that is linked geographically to the workplace site. Employee
compensation does not include tip income, which is normally an additional 22% of the actual
wages of a casino operations employee, but it does include fringe benefits, which are
normally 25% of the wages and salaries of full-time employees.
6.4.1 Negative Employment Impacts
Lower gaming and non-gaming revenues at Connecticut’s two casinos will immediately and directly
translate into additional layoffs and lower employment levels at the two casinos. It is estimated that
total job losses due to inter-state revenue displacement will be at least 9,300 jobs throughout the state
in CY 2019 (total impact) (see Table 19).67
It is estimated that revenue losses of the magnitude presented earlier in this report will
require Connecticut’s two casinos to shed an additional 5,812 employees (direct impact) (see
Table 19).
The reduction in local purchases from Connecticut vendors will result in the loss of an
additional 1,890 non-gaming jobs (indirect impact) (see Table 19).
Lost wages by former casino employees will mean less spending by those former employees
and this will induce the loss of an additional 1,598 jobs statewide (induced impact) (see Table
19).
67 The economic impact estimates are ‘conservative’ estimates insofar as they do not take into account the direct, indirect, and
induced economic impacts on contract employees, on-site businesses that lease space from the two Connecticut casinos, and the
impact on other regional tourist industry establishments (e.g., recreation and amusement, food and beverage, retail, and lodging,
among others) that are not owned or operated by the two Connecticut casinos.
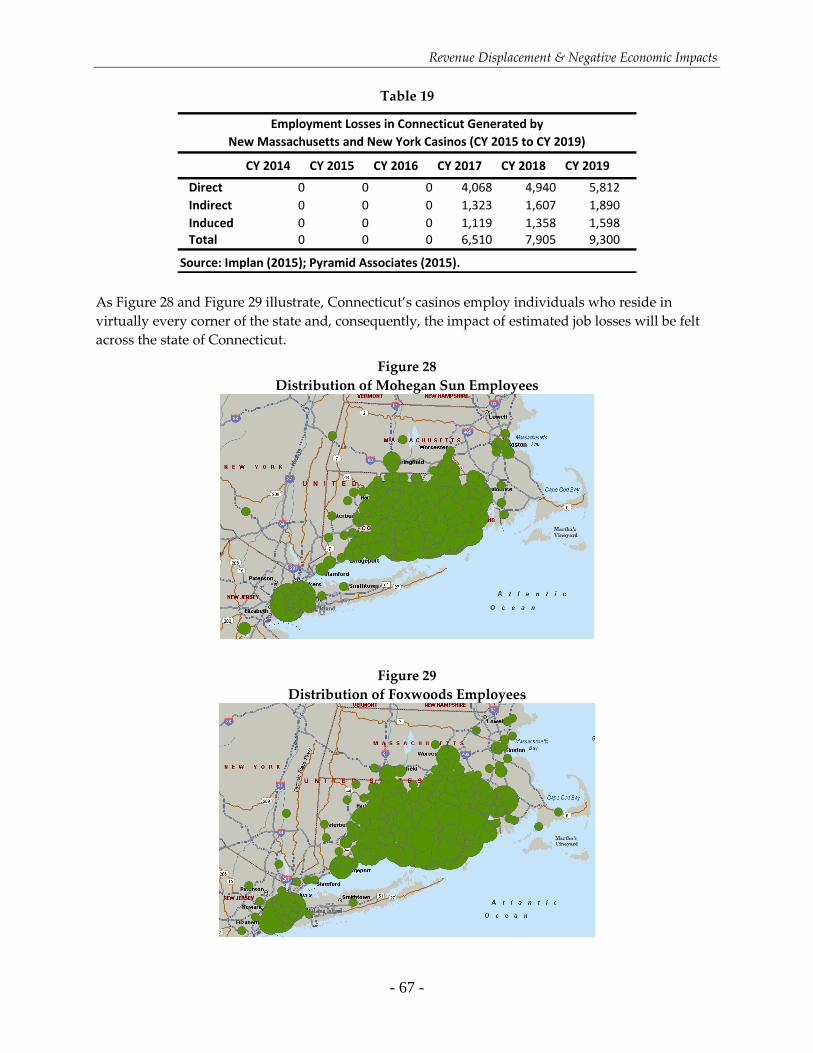
Revenue Displacement & Negative Economic Impacts
- 67 -
Table 19
CY 2014 CY 2015 CY 2016 CY 2017 CY 2018 CY 2019
Direct 0 0 0 4,068 4,940 5,812
Indirect 0 0 0 1,323 1,607 1,890
Induced 0 0 0 1,119 1,358 1,598 Total 0 0 0 6,510 7,905 9,300
Source: Implan (2015); Pyramid Associates (2015).
Employment Losses in Connecticut Generated by
New Massachusetts and New York Casinos (CY 2015 to CY 2019)
As Figure 28 and Figure 29 illustrate, Connecticut’s casinos employ individuals who reside in
virtually every corner of the state and, consequently, the impact of estimated job losses will be felt
across the state of Connecticut.
Figure 28
Distribution of Mohegan Sun Employees
Figure 29
Distribution of Foxwoods Employees
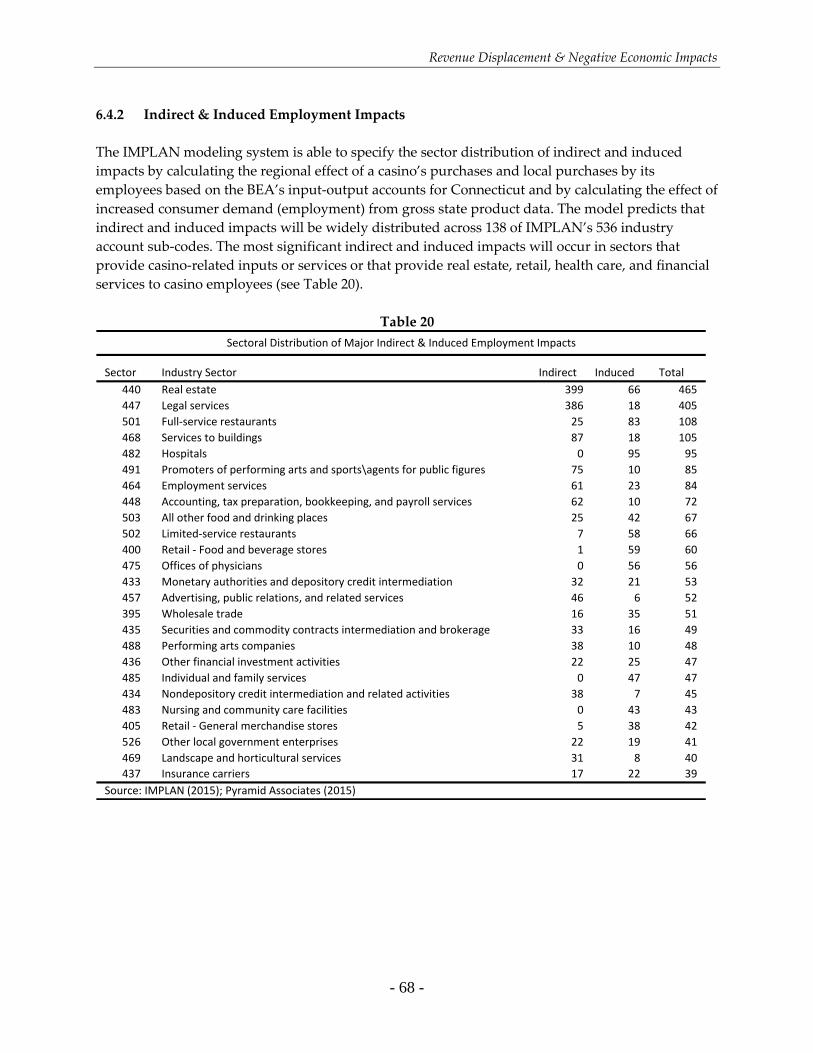
Revenue Displacement & Negative Economic Impacts
- 68 -
6.4.2 Indirect & Induced Employment Impacts
The IMPLAN modeling system is able to specify the sector distribution of indirect and induced
impacts by calculating the regional effect of a casino’s purchases and local purchases by its
employees based on the BEA’s input-output accounts for Connecticut and by calculating the effect of
increased consumer demand (employment) from gross state product data. The model predicts that
indirect and induced impacts will be widely distributed across 138 of IMPLAN’s 536 industry
account sub-codes. The most significant indirect and induced impacts will occur in sectors that
provide casino-related inputs or services or that provide real estate, retail, health care, and financial
services to casino employees (see Table 20).
Table 20
Sector Industry Sector Indirect Induced Total
440 Real estate 399 66 465
447 Legal services 386 18 405
501 Full-service restaurants 25 83 108
468 Services to buildings 87 18 105
482 Hospitals 0 95 95
491 Promoters of performing arts and sports\agents for public figures 75 10 85
464 Employment services 61 23 84
448 Accounting, tax preparation, bookkeeping, and payroll services 62 10 72
503 All other food and drinking places 25 42 67
502 Limited-service restaurants 7 58 66
400 Retail - Food and beverage stores 1 59 60
475 Offices of physicians 0 56 56
433 Monetary authorities and depository credit intermediation 32 21 53
457 Advertising, public relations, and related services 46 6 52
395 Wholesale trade 16 35 51
435 Securities and commodity contracts intermediation and brokerage 33 16 49
488 Performing arts companies 38 10 48
436 Other financial investment activities 22 25 47
485 Individual and family services 0 47 47
434 Nondepository credit intermediation and related activities 38 7 45
483 Nursing and community care facilities 0 43 43
405 Retail - General merchandise stores 5 38 42
526 Other local government enterprises 22 19 41
469 Landscape and horticultural services 31 8 40
437 Insurance carriers 17 22 39
Source: IMPLAN (2015); Pyramid Associates (2015)
Sectoral Distribution of Major Indirect & Induced Employment Impacts
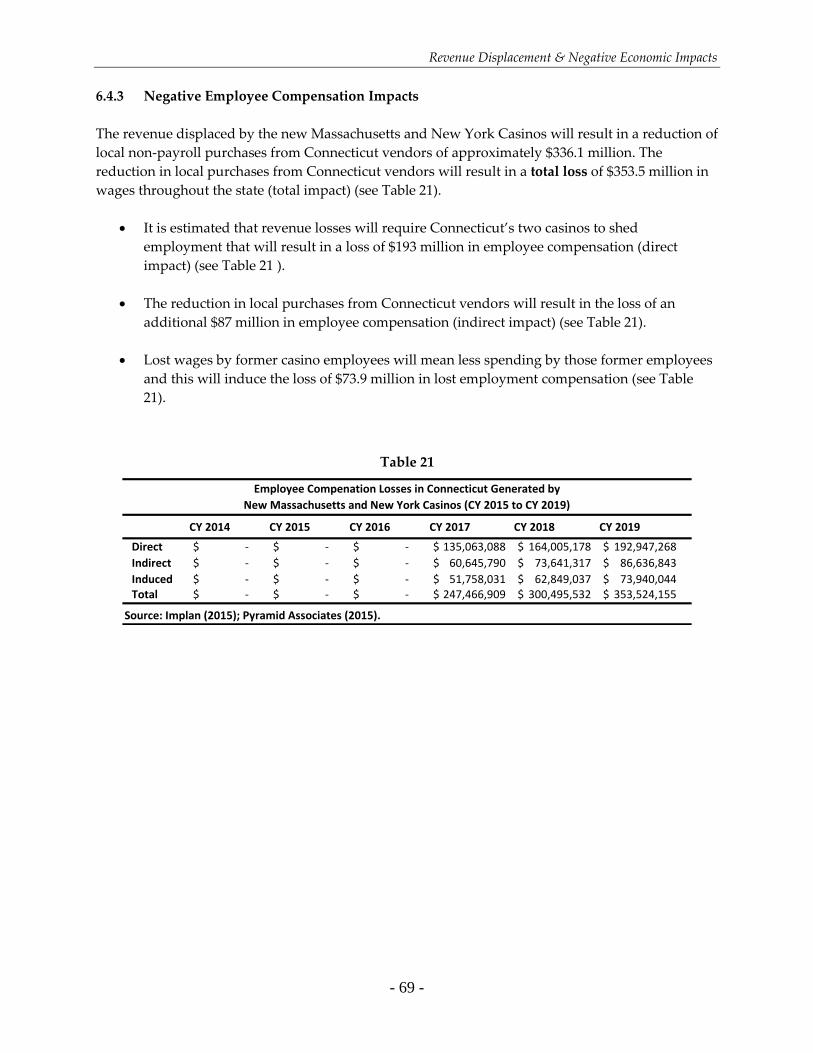
Revenue Displacement & Negative Economic Impacts
- 69 -
6.4.3 Negative Employee Compensation Impacts
The revenue displaced by the new Massachusetts and New York Casinos will result in a reduction of
local non-payroll purchases from Connecticut vendors of approximately $336.1 million. The
reduction in local purchases from Connecticut vendors will result in a total loss of $353.5 million in
wages throughout the state (total impact) (see Table 21).
It is estimated that revenue losses will require Connecticut’s two casinos to shed
employment that will result in a loss of $193 million in employee compensation (direct
impact) (see Table 21 ).
The reduction in local purchases from Connecticut vendors will result in the loss of an
additional $87 million in employee compensation (indirect impact) (see Table 21).
Lost wages by former casino employees will mean less spending by those former employees
and this will induce the loss of $73.9 million in lost employment compensation (see Table
21).
Table 21
CY 2014 CY 2015 CY 2016 CY 2017 CY 2018 CY 2019
Direct -$ -$ -$ 135,063,088$ 164,005,178$ 192,947,268$
Indirect -$ -$ -$ 60,645,790$ 73,641,317$ 86,636,843$
Induced -$ -$ -$ 51,758,031$ 62,849,037$ 73,940,044$ Total -$ -$ -$ 247,466,909$ 300,495,532$ 353,524,155$
Source: Implan (2015); Pyramid Associates (2015).
Employee Compenation Losses in Connecticut Generated by
New Massachusetts and New York Casinos (CY 2015 to CY 2019)
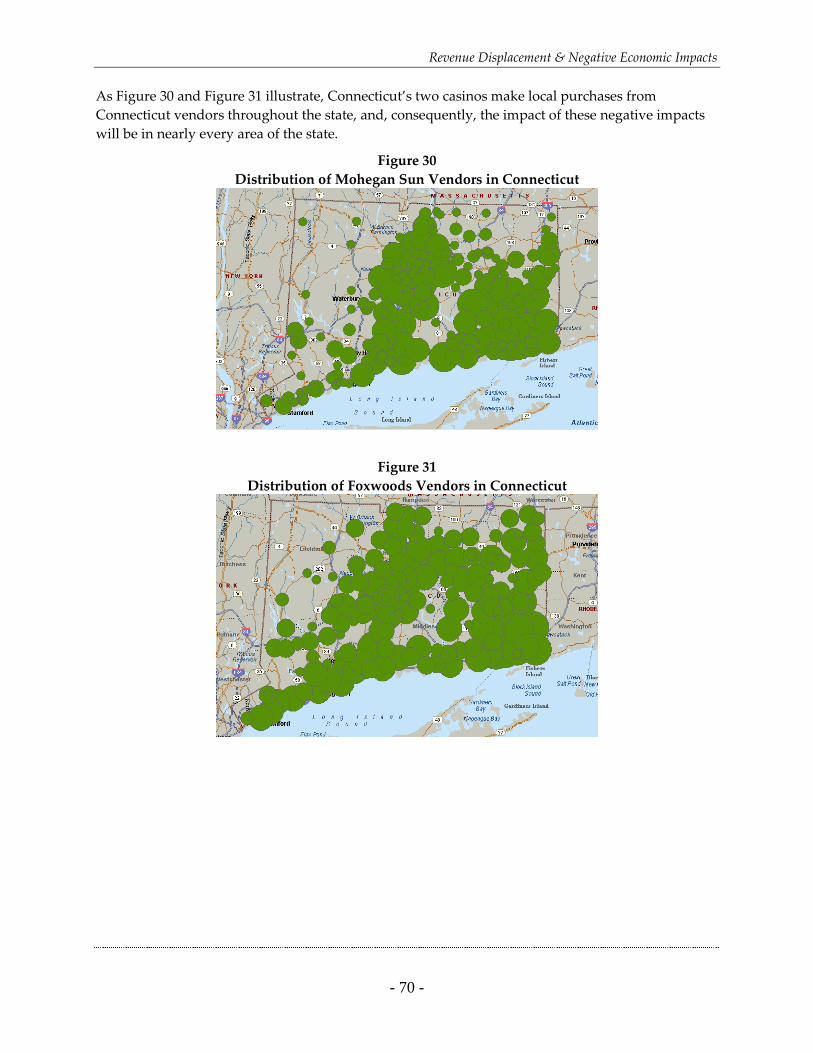
Revenue Displacement & Negative Economic Impacts
- 70 -
As Figure 30 and Figure 31 illustrate, Connecticut’s two casinos make local purchases from
Connecticut vendors throughout the state, and, consequently, the impact of these negative impacts
will be in nearly every area of the state.
Figure 30
Distribution of Mohegan Sun Vendors in Connecticut
Figure 31
Distribution of Foxwoods Vendors in Connecticut

Revenue Displacement & Negative Economic Impacts
- 71 -
[This page left blank intentionally]
Revenue Displacement & Negative Economic Impacts
- 72 -
7. References
Ali, Mukhtar M. and Stuart I. Greenbaum. 1977. “A Spatial Model of the Banking Industry.”
Journal of Finance, Vol. 32, No. 4 (September): 1283-1303.
American Gaming Association. 2013. State of the States: The AGA Survey of Casino Entertainment,
2012. Washington, D.C. Available at http://www.americangaming.org/industry-
resources/research/state-states
Anas, Alex. 1987. Modeling in Urban and Regional Economics. Amsterdam: Harwood Academic
Publishers.
Applebaum, William. 1965. “Can Store Location Research Be a Science?” Economic Geography, Vol.
41, No. 3 (July): 234-37.
Arsenault, Mark. 2014a. “Wynn, Mohegan Sun Joust for Boston Casino License.” Boston Globe, January 22.
Available at http://www.bostonglobe.com/metro/2014/01/22/gambling/BPDXsyJbJri8sXqs0l47yI/
story.html.
Arsenault, Mark. 2014b. “Some See Implications for Mass. In N.J. Casino Woes.” Boston Globe,
September 1, 2014.
Arthur W. Wright & Associates. 1993. The Economic Impacts of the Foxwoods High Stakes
Bingo & Casino on New London County and Surrounding Areas. Ledyard, CT:
Foxwoods Resort.
Associated Press. 2007. “Expansion at Casino in R.I. is Set to Open,” Boston Globe,
March 19, 2007, p. B-2.
Barrow, Clyde W. and David R. Borges. 2007. New England Casino Gaming Update, 2007.
North Dartmouth, MA: Center for Policy Analysis.
Barrow, Clyde W. and David R. Borges. 2010. “New England Casino Gaming Update: Patron
Origin Analysis and a Critique of its Critics.” Gaming Law Review and Economics, Vol. 14,
No. 3 (March): 175-86.
Barrow, Clyde W. and David R. Borges. 2013a. New England Casino Gaming Update, 2013.
North Dartmouth, MA: Center for Policy Analysis.
Barrow, Clyde W. and David R. Borges. 2013b. Bring It on Home: An Overview of Gaming
Behavior in New England; Results of the 4th Biennial New England Gaming Behavior
Survey. North Dartmouth, MA: Center for Policy Analysis.
Barrow, Clyde W. and David R. Borges. 2014. “Gravity Models and Casino Gaming: A Review, Critique, and Modification,” Gaming Research and Review Journal, Vol. 18, No. 1 (Spring): 49-82.
Revenue Displacement & Negative Economic Impacts
- 73 -
Bennett, Victor W. 1944. “Consumer Buying Habits in a Small Town Located Between Two Large
Cities.” The Journal of Marketing, Vol. 8, No. 4 (April): 405-16.
Berry, Brian J.L. 1967. Geography of Market Centers and Retail Distribution. Englewood Cliffs, N.J.:
Prentice-Hall, Inc.
Black, William. 1983. “A Generalization of Destination Effects in Spatial Interaction Modeling.”
Economic Geography, Vol. 59, No. 1 (January): 16-34.
Brunner, James A. and John L. Mason. 1968. “The Influence of Driving Time Upon Shopping Center
Preferences.” Journal of Marketing, Vol. 32 (April): 57-61.
Bucklin, Louis P. 1967a. Shopping Patterns in an Urban Area. Berkeley, California: Institute of
Business and Economic Research, University of California.
Bucklin, Louis P. 1967b. “The Concept of Mass in Intra-Urban Shopping.” Journal of Marketing, Vol.
31, No. 4 (October): 37-42.
Bucklin, Louis P. 1971. “Retail Gravity Models and Consumer Choice: A Theoretical and Empirical
Critique.” Economic Geography, Vol. 47, No. 4 (October): 489-497.
Burchell, Robert W., David Listokin, and William R. Dolphin. 1985. The New Practitioner’s Guide
to Fiscal Impact Analysis (New Brunswick, N.J.: Center for Urban Policy Research.
Canfield, Clarke. 2005. “Maine’s First Slots Parlor Opens to Waiting Crowds,” Associated Press,
November 4.
Carstensen, Fred, William Lott, Stan McMillen, Bobur Alimov, Na Li Dawson, Tapas
Ray. 2000. The Economic Impact of the Mashantucket Pequot Tribal Nation Operations
in Connecticut. Storrs, CT: University of Connecticut Center for Economic Analysis.
“Casino Gambling: Any Hope Has Faded.” 2014. Foster’s Daily Democrat, August 19.
“Casino Revenues Won’t Hold Up.” 2014. Keene Sentinel, July 21.
Cassidy, Chris. 2014. “Bay State May Not Hit Promised Jackpot with Casinos.” Boston Herald,
September 12, 2014.
Christiansen, Eugene M. 2006. “Gross Annual Wager, 2006.” International Gaming & Wagering
Business (November).
Christiansen Capital Advisors. 2009. “Gross Annual Wager, 2009.”
Connecticut Division of Special Revenue, “Statistics for Tribal Casinos,”
http://dosr.state.ct.us/WAGERING.htm
Revenue Displacement & Negative Economic Impacts
- 74 -
Converse, P.D. 1943. A Study of Retail Trade Areas in East Central Illinois. Urbana: University of
Illinois, Bureau of Economic and Business Research, Business Studies, No. 2.
Converse, P.D. 1946. Retail Trade Areas in Illinois. Urbana: University of Illinois Bulletin, Business
Studies No. 4.
Converse, P.D. 1948. Consumer Buying Habits in Selected South Central Illinois Communities. Urbana:
University of Illinois, Bureau of Economic and Business Research, Business Studies, No. 6.
Cox, Eli P. and Leo G. Erickson. 1967. Retail Decentralization. East Lansing, Michigan: Bureau of
Business and Economic Research, Michigan State University.
Cox, William E., Jr. and Ernest F. Cooke. 1970. “Other Dimensions Involved in Shopping Center
Preference.” The Journal of Marketing, Vol. 34, No. 4 (October): 12-17.
“CT’s Mohegan Sun Owners Refi $1.6 billion in Debt,” Hartford Courant, March 7, 2012.
Darrow, Chuck. 2007. “Proximity Pays for New ‘Racinos’.” Camden (NJ) Courier-Post,
March 19, 2007.
Darrow, Chuck. 2008. “Delaware Likely to OK Sports Betting (December 11).” Philadelphia
Daily News, see, http://www.philly.com/dailynews/sports/
20081211_Delaware_likely_to_OK_sports_betting.html
Davis, Peter. 2006. “Spatial Competition in Retail Markets: Movie Theaters.” RAND Journal of
Economics, Vol. 37, No. 4 (Winter): 964-982.
Dense, Jeffrey and Clyde W. Barrow. 2003. “Estimating Casino Expenditures by Out of State
Patrons: Native American Gaming in Connecticut.” Journal of Travel Research (May): 410-15.
Dolloff, Aimee. 2007. “Slots Linked to $20M in Hospitality Income.” Bangor Daily News, July 31.
Donoghue, Kimberly. 2010. “Twin River Leaves Bankruptcy Protection.” Providence
Business News, November 9.
Douglas, Edna. 1949a. “Measuring the General Retail Trading Area: A Case Study I.” The Journal of
Marketing, Vol. 14, No. 1 (April): 481-97.
Douglas, Edna. 1949b. “Measuring the General Retail Trading Area: A Case Study II.” The Journal
of Marketing, Vol. 14, No. 1 (July): 46-60.
Drezner, Tammy, Zvi Drezner, and H. A. Eiselt. 1996. “Consistent and Inconsistent Rules in
Competitive Facility Choice.” Journal of the Operational Research Society, Vol. 47, No. 12
(December): 1494-1503.
Revenue Displacement & Negative Economic Impacts
- 75 -
Eadington, William. 1995. “Economic Development and the Introduction of Casinos.” Economic
Development Review, (13): 51-54.
Eadington, William. 1998. “Contributions of Casino-Style Gambling to Local Economies.” Annals of
the American Academy of Political and Social Science, (556): 53-65.
Ellwood, L.W. 1954. “Estimating Potential Volume of Proposed Shopping Centers.” The Appraisal
Journal (October): 581-589.
Executive Office of the President, Office of Management and Budget. 1997. North American
Industry Classification System. Lanham, MD: Bernan Press.
Executive Office of the President, Office of Management and Budget. 2012. North American
Industry Classification System. Lanham, MD: Bernan Press.
Ferber, Robert. 1958. “Variations in Retail Sales Between Cities.” The Journal of Marketing, Vol. 22,
No. 3 (January): 295-303.
Florin, Karen. 2004a. “Slots So-So For March at Local Casinos,” New London Day
(New London, Connecticut), April 16.
Florin, Karen. 2004b. “Bean Count Gets More Elaborate at Mohegan Sun” New London
Day (New London, Connecticut), April 25.
Freiss, Steve. 2008. “Down on Its Luck Las Vegas Used to Be a Recession-Proof Oasis. Not
Anymore.” Newsweek Web Exclusive, see, http://www.newsweek.com/id/135638
Gautschi, David A. 1981. “Specification of Patronage Models for Retail Center Choice.” Journal of
Marketing Research, Vol. 18, No. 2 (May): 162-74.
Gilbert, G.C., G.L. Peterson, and D.W. Line. 1972. “Toward a Model of Travel Behavior in the
Boundary Waters Canoe Area.” Environment and Behavior, (4): 131-47.
Golledge, R.G., W.A.V. Clark, and G. Rushton. 1966. “The Implications of the Consumer Behavior
of a Dispersed Farm Population in Iowa.” Economic Geography, 42: 261-272.
Golledge, R.G. & H. Timmermans (Eds.). 1988. Behavioral Modelling in Geography and Planning.
London: Croom Helm.
Gregg, Katherine. 2009a. “Update: Twin River Defaulted on Loan-Forbearance Pact.”
Providence Journal (January 30). See, http://newsblog.projo.com/2009/01/
providence-an-a-2.html.
Gregg, Katherine. 2009b. “Owners of R.I.’s Twin River Slot Parlor File for Bankruptcy.”
Providence Journal (June 24).
Revenue Displacement & Negative Economic Impacts
- 76 -
Gregg, Katherine. 2010. “Twin River Freed From Business of Dog Racing; Gambling.”
Providence Journal, May 15, p. A-3.
Gregg, Katherine. 2011. “Caesar’s Reaffirms Interest in R.I. Casino; Gambling.” Providence
Journal, March 4, p. A-3.
Grimaldi, Paul. 2010a. “Judge Approves Reorganization for Twin River; Courts.”
Providence Journal, November 10, p. A-3.
Grimaldi, Paul. 2010b. “Twin River Wins License Transfer; Gambling.” Providence Journal,
June 24, p. A-11.
Grimaldi, Paul. 2010c. “Twin River Stake Purchased; Gambling.” Providence Journal, December 21,
p. A-3.
Hallenbeck, Brian. 2010. “Mohegan Sun Credit Ratings Lowered Over Financial Woes.” New
London Day, December 1.
Harrah’s Entertainment, Inc. 2003. Profile of the American Casino Gambler, 2003. Las Vegas, NV.
Harrah’s Entertainment, Inc. 2006. Profile of the American Casino Gambler, 2006. Las Vegas, NV.
Hoa, Nguyen. 2014. “Death of Atlantic City Casinos Could be Omen for N.Y.” Lower Hudson
Valley Journal News, August 29.
Hsu, Cathy H.C. (Ed.). 1999. Legalized Casino Gaming in the United States: The Economic and Social
Impact. New York: Haworth Hospitality Press.
Hubbard, Raymond. 1978. “A Review of Selected Factors Conditioning Travel Behavior.” Journal of
Consumer Research, Vol. 5, No. 1 (June): 1-21.
Huff, David L. 1961. “A Note on the Limitations of Intra-Urban Gravity Models.” Land Economics,
(February): 64-66.
Huff, David L. 1962. Determination of Intra-Urban Retail Trade Areas. Los Angeles, CA: University of
California Los Angeles Real Estate Research Program.
Huff, David L. 1963. “A Probabilistic Analysis of Shopping Center Trade Areas.” Land Economics,
Vol. 39, No. 1 (February): 81-90.
Huff, David L. 1964. “Defining and Estimating a Trading Area.” Journal of Marketing, Vol. 28, No. 3
(July): 34-38.
Huff, D.L. and G. Jencks. 1968. “A Graphic Interpretation of the Friction of Distance in Gravity
Models.” Annals of the Association of American Geographers 58 (December): 814-824.
Hurdle, Jon. 2014. “Showboat Casino Closes Amid Tears and Questions About Atlantic City’s
Revenue Displacement & Negative Economic Impacts
- 77 -
Direction.” New York Times, August 31.
Jacobson, Erica. 2007. “Tourism: Casinos.” Norwich Bulletin, July 1.
Jacobson, Erica. 2008. “MGM Grand Seeks ‘Terrific Employees.” Norwich Bulletin, February 9.
Jinks, Beth. 2009. “Foxwoods Seeks ‘Mutually Beneficial’ Restructuring (Update 1).” Available at
http://www.bloomberg.com/apps/news?pid=newsarchive&sid=aROEQxmJsBSQ
Journal Wire Services. 2014. “Slow Recovery, More Competition Hurting Foxwoods.” Providence
Journal, August 14.
Jung, Allen F. 1959. “Is Reilly’s Law of Retail Gravitation Always True?” The Journal of Marketing,
Vol. 24, No. 2 (October): 62-63.
Kane, Brad. 2010. “Mohegan Sun Better Positioned for Coming Casino Revolution.”
Hartford Business Journal, September 13.
Kane, Brad. 2012. “Foxwoods Rebrands as ‘Anything But Ordinary’,” Hartford Business Journal,
February 15.
Kelley, Eugene J. 1958. “The Importance of Convenience in Consumer Purchasing.” The Journal of
Marketing, Vol. 23, No. 1 (July): 32-38.
Klopott, Freeman. 2014. “N.Y. Casino Bidders Quizzed on Revenue in Saturated Market.”
Available at http://www.bloomberg.com/news/2014-09-08/n-y-casino-bidders-quizzed-on-
revenue-in-saturated-market.html
Knapp, John L. and Catherine E. Barchers. 2001. The Virginia Horse Center’s Economic Impact.
Charlottesville, VA: University of Virginia, Weldon Cooper Center for Public Service.
Kostrzewa, John. 2014. “Kostrzewa: More Financial Trouble at Foxwoods.” Providence Journal,
August 17.
Kramer, Reuben. 2014. “Revel’s Closing Leaves Atlantic City with Only Nine Casinos.”
Press of Atlantic City, September 1.
Kramer, Reuben and Brian Ianieri. 2014. “In Struggling Casinos, Nongaming Businesses
Thrive.” Press of Atlantic City, July 19. Las Vegas Convention and Visitors Authority.
2001. Visitor Profile. Accessed February 9, 2003, from http://www.lvcva.com/press/
lv_profile.html.
Lakshmanan, T. R. 1964. “Approach to the Analysis of Intra-urban Location Applied to the
Baltimore Region.” Economic Geography 4 (1964): 348-370.
Revenue Displacement & Negative Economic Impacts
- 78 -
MacKay, David B. 1973. “Spatial Measurement of Retail Store Demand.” Journal of Marketing
Research, Vol. 10, No. 4 (November): 447-453.
Maine Department of Public Safety, Gambling Control Board. “Monthly Revenues from
Hollywood Slots.” http://www.maine.gov/dps/GambBoard/FinancialInformation.htm
Marsden, Jessica. 2007. “Tribes’ Ripple Effect Muted: Report: Two Casinos Bring State
One Job For Every Three of Theirs,” Hartford Courant, June 14.
Maurer, Mark. 2014. “Trump: NY Casino Projects Will ‘All Go down the Tubes’.” The Real Deal:
New York City Real Estate News, October 20. Available at http://therealdeal.com/
blog/2014/10/20/trump-ny-casino-projects-will-all-go-down-the-tubes/
McAnnally, A.P. 1965. “Grocery Trade in Shopping Centers.” Journal of Industrial Economics 13: 193-
204.
McCarthy, E. Jerome. 1964. Basic Marketing, Revised Edition. Homewood, Illinois: Richard D.
Irwin, Inc.
McGowan, Richard. 2009. “The Competition for Gambling Revenue: Pennsylvania vs. New Jersey.”
Gaming Law Review and Economics, 13 (2): 145-55.
Mayerowitz, Scott. 2007. “New Lincoln Park is Pulling to Hit Jackpot,” Providence Journal,
March 18.
Meister, Alan. 2007-2014. Indian Gaming Industry Report. Newton, MA: Casino City Press.
Meister, Alan P., Kathryn R.L. Rand, and Steven Andrew Light. 2009. “Indian Gaming and Beyond:
Tribal Economic Development and Diversification.” South Dakota Law Review, 54 (3): 375-97.
Meyer-Arendt, K. 1998. “From the River to the Sea: Casino Gambling in Mississippi.”
Pp. 151-67 in K. Meyer-Arendt and R. Hartmann, eds., Casino Gambling in
America: Origins, Trends, Impacts. New York: Cognizant Communications.
Mohegan Tribal Gaming Authority. 2008. Annual Report (Form 10-K) for the Fiscal Year
Ended September 30, 2008. Washington, D.C.: Securities & Exchange Commission.
Mohegan Tribal Gaming Authority. 2012. Annual Report (Form 10-K) for the Fiscal Year
Ended September 30, 2012. Washington, D.C.: Securities & Exchange Commission.
Mohegan Tribal Gaming Authority. 2014. Annual Report (Form 10-K) for the Fiscal Year
Ended September 30, 2014. Washington, D.C.: Securities & Exchange Commission.
Moore, Galen. 2012. “Proposed Everett Casino Site Could Be a Gamble for Developer Steve
Wynn.” Boston Business Journal, December 23. Available at http://www.masslive.com/
business-news/index.ssf/2012/12/everett_casino_site_could_be_a_gamble_fo.html
Revenue Displacement & Negative Economic Impacts
- 79 -
Mosher, James. 2010. “Mohegan Sun Cuts 355 Jobs.” Norwich Bulletin, September 14.
MPBN News. 2014. “Study: Maine Could Support More Casinos.” September 3. Available at
http://news.mpbn.net/post/study-maine-could-support-more-casinos
MTR Gaming Group, Inc. 2014. Annual Report (Form 10-K) for the Fiscal Year
Ended December 31, 2014. Washington, D.C.: Securities & Exchange Commission.
National Bureau of Economic Research, Business Cycle Dating Committee. 2008. NBER Business
Cycle Memo (November 28 and December 11 versions). see http://www.nber.org/cycles/
dec2008.html
National Bureau of Economic Research, Business Cycle Dating Committee. 2011. NBER Business
Cycle Memo (September 20), see, http://www.nber.org/cycles/sept2010.html
National Indian Gaming Commission. 2008a. Laws and Regulations.
http://www.nigc.gov/LawsRegulations/tabid/65/Default.aspx
National Indian Gaming Commission. 2008b. Tribal-State Compact Between the
Mashantucket Pequot Tribe and the State of Connecticut, April 10, 1991, see,
http://www.nigc.gov/Portals/0/NIGC%20Uploads/readingroom/compacts/
Mashantucket%20Pequot%20Indian%20Tribe/mashantucketcomp041091.pdf
National Indian Gaming Commission. 2008c. Mohegan Tribe-State of Connecticut Gaming
Compact, December 5, 1994, see
ttp://www.nigc.gov/Portals/0/NIGC%20Uploads/readingroom/
compacts/Mohegan%20Indian%20Tribe/mohegancomp120594.pdf
Neff, Andrew. 2011. “Penobscot County Oks Hollywood Slots Table Games,” Bangor Daily News,
November 9, 2011.
Neff, Andrew. 2012. “Gambling Board Approves Maine’s First Casino: Hollywood Slots Becomes
Hollywood Casino Bangor,” Bangor Daily News, February 21, 2012.
Nelson, Richard L. 1958. The Selection of Retail Locations. New York: F.W. Dodge Corporation.
“New York Wins Big with Yonkers Empire City Casino.” 2013. Yonkers Daily Voice, April 30.
Available at http://www.newyorkgaming.org/press-news/new-york-wins-big-yonkers-
empire-city-casino
Newton, Isaac. 1969 [1687]. Mathematical Principles of Natural Philosophy; translated into English by
Robert Thorp. London: Dawsons.
Nguyen, Hoa. 2014. “Death of Atlantic City Casinos Could Be Omen for N.Y.” Journal News
Revenue Displacement & Negative Economic Impacts
- 80 -
Media Group, August 29. Available at http://www.lohud.com/story/news/local/westchester/
2014/08/29/atlantic-city-casinos-closing-new-york-casinos-opening-catskills-hudson-
valley/14840079/
“Odds Are, the Casino Market is Reaching Saturation Point.” 2014. Nashua Telegraph, August 16.
Oregon State University. Community Tourism Assessment Handbook. Corvallis, OR:
Western Rural Development Center.
Office of Management and Budget, Executive Office of the President. 1997. “1997 North American
Industry Classification System-Completion Activities for 2002.”
Parry, Wayne. 2007. “Atlantic City Plans Huge New Casinos: Gambling Mecca
Challenging Vegas.” Associated Press, December 16.
Penn National Gaming, Inc. 2014. Annual Report (Form 10-K) for the Fiscal Year
Ended December 31, 2014. Washington, D.C.: Securities & Exchange Commission.
Peters, Mark. “Lights, Money, Action as Slots Open in Bangor,” Portland Press Herald,
November 4, 2005.
Public Gaming International. 2008. “In Financial Straits, Twin River Seeks a New Deal with State
of Rhode Island.” Morning Report, (June 13). See, http://morningreport.
publicgaminginternational.com/modules.php?name=News&file=article&sid=2434
“Racino Clientele Mostly Mainers,” Bangor Daily News, November 21, 2005.
Rand, Kathryn R.L. and Steven Andrew Light. 2006. Indian Gaming Law and Policy. Durham, N.C.:
Carolina Academic Press.
Reilly, William J. 1929. Methods for the Study of Retail Relationships. Austin, Texas: Bureau of
Business Research Studies in Marketing, No. 4.
Reilly, William J. 1931. The Law of Retail Gravitation. New York: G.P. Putnam’s Sons.
“Resorts World Casino Celebrates Second Anniversary.” 2013. Western Queens Gazette, October 23.
Available at http://www.qgazette.com/news/2013-10-
23/Front_Page/Resorts_World_Casino_Celebrates_Second_Anniversary.html
Rife, Judy. 2011. “Frequent Fliers: Foreign Tourists a Mainstay at Woodbury Commons.” Times
Herald-Record (Hudson Valley), January 26.
Rushton, G., R.G. Golledge, and W.A.V. Clark. 1967. “Formulation and Test of a Normative Model
for the Spatial Allocation of Grocery Expenditures by a Dispersed Population.”Annals of the
Association of American Geographers 57: 389-400.
Revenue Displacement & Negative Economic Impacts
- 81 -
Rutherford, Larry. 2008. “Hollywood Slots Has Record Day at Grand Opening in Maine (July 5).”
See,http://www.casinogamblingweb.com/gamblingnews/casinogambling/
hollywood_slots_casino_has_record_day_at_grand_opening_in_maine_48842.html
Ryan, Timothy P. and Janet F. Speyrer. 1999. Gambling in Louisiana: A Benefit/Cost Analysis.
Baton Rouge: Louisiana Gaming Control Board.
Satow, Julie. 2013. “A Magnet for Shoppers is Getting a Makeover.” New York Times, May 22.
Schiller, R.K. 1972. “The Measurement of the Attractiveness of Shopping Centers to Middle Class
Luxury Consumers.” Regional Studies 6: 291-297.
Schwartz, George. 1962. “Laws of Retail Gravitation: An Appraisal.” University of Washington
Business Review, Vol. 22 (October): 56-58.
Sharrow, Ryan. 2011. “Maryland Slot Parlors Rake in $12.2M in February.” Baltimore
Business Journal, March 7. See,
http://www.bizjournals.com/baltimore/news/2011/03/07/maryland-slot-parlors-rake-in-
122m.html
Shim, Jae K. and Joel G. Siegel. 1995. Dictionary of Economics. New York: John Wiley & Sons.
Skelton, Kathryn and Leslie Dixon. 2012. “Oxford Casino Sold to Churchill Downs for $160
Million in Cash.” Lewiston Sun Journal, March 29.
Spector, Mike and Alexandra Berzon. 2010. “Tribe’s Roll of Dice Rattles Lenders.” Wall Street
Journal, September 17, pp. A-1, A-16.
Strohkarck, Frank and Katherine Phelps. 1948. “The Mechanics of Constructing a Market Area
Map.” The Journal of Marketing (April): 493-496.
Sturdevant, Matthew. 2014. “MGM Grand at Foxwoods Renamed The Fox Tower.” Hartford Courant,
April 3.
Stutz, F.P. 1973. “Distance and Network Effects on Urban Social Travel Fields.” Economic
Geography, (49): 134-44.
Taylor, Jonathan B., Joseph P. Kalt, and Kenneth W. Grant II. 2002. Public Policy Analysis
of Indian Gaming in Massachusetts. Cambridge, MA: John F. Kennedy School of Government.
Taylor, Kate. 2012. “A Record Year for New York Tourism.” New York Times, December 31.
UHY Advisors, Casino Gaming in Massachusetts: An Economic, Fiscal, and Social Analysis
Boston: Greater Boston Chamber of Commerce, 2008.
U.S. Bureau of Economic Analysis. 2014. “Regional Economic Accounts.” See,
Revenue Displacement & Negative Economic Impacts
- 82 -
http://www.bea.gov/regional/index.htm#state
U.S. Bureau of the Census. 2010. 2010 Census Summary Files. Available at:
http:www.census.gov/data/.
U.S. Bureau of the Census. 2007-2012. American Community Survey. Available at:
http://www.census.gov/acs/www.
U.S. Department of Commerce, Bureau of Economic Analysis. 2009-2012. Local Area Personal Income.
Available at: http://bea.gov.
U.S. Bureau of Economic Analysis. 2009. Concepts and Methods of the U.S. Input-Output Accounts:
Measuring the Nation’s Economy. Washington, D.C.: U.S. Department of Commerce.
Vickerman, R.W. 1974. “A Demand Model for Leisure Travel.” Environment and Planning A (6): 65-
78.
Wagner, John and Rosalind S. Helderman. 2009. “Bidding for Slots Licenses Falls Short of Md. Plan:
6 Proposals Filed for 5 Sites; Approval Sought for 10,550 of 15,000 Machines Authorized by
Law.” Washington Post, February 3, p. B-01.
Walker, Douglas. 2007. The Economics of Casino Gambling. New York: Springer.
Wharton Econometric Forecasting Associates (WEFA) Group. 1997. A Study Concerning
the Effects of Legalized Gambling on the Citizens of the State of Connecticut. Eddystone, PA:
WEFA Group.
Wittkowski, Donald. 2013. “New Casinos Divide Smaller Revenue in Saturated Market.” Press of
Atlantic City, July 27.
Wolfson, John. 2014. “America’s Casino-Saturation Problem,” The New Yorker, November 18.
Wright, Arthur W. 2006. “As the Wheel of Fortune Turns: Casinos Revisited.” The Connecticut
Economy: A University of Connecticut Quarterly Review (September): 8-11.

Revenue Displacement & Negative Economic Impacts
- 83 -
Revenue Displacement & Negative Economic Impacts
- 84 -
Appendix A: About the Author
Clyde W. Barrow, Ph.D.
Dr. Barrow is Professor of Public Policy and Chair of the Department of Political Science at the
University of Texas – Rio Grande Valley (2014 – present) and formerly Chancellor Professor of
Public Policy and Director of the Center for Policy Analysis at the University of Massachusetts,
Dartmouth (1987-2014). In addition to teaching and conducting research at the University of Texas,
he has served as a consultant to state, federal, and local government agencies, private companies,
business and trade associations, non-profit organizations, and educational institutions across the
United States.
Dr. Barrow specializes in public policy research and analysis. His areas of expertise include
feasibility analysis, economic impact analysis, industry analysis, regional economic development,
survey development and implementation, and policy analysis. His work has involved a wide variety
of industries, including casino gaming, retail trade, science and technology, textiles and apparel,
health care, national defense, education, health care, arts and crafts, cultural economic development,
tourism, leisure and hospitality, and public infrastructure development.
For two decades, Dr. Barrow has been studying the economic, fiscal, and social impacts of casino
gaming, including commercial casinos, race track casinos, and Indian gaming. He has studied
existing and proposed gaming throughout the United States, including California, Connecticut,
Illinois, Maine, Massachusetts, New Hampshire, Nevada, New York, Oregon, Pennsylvania, Rhode
Island, Texas, Washington, and Wisconsin. He is project manager for the Northeastern Gaming
Research Project, which annually conducts research and analysis of the New England and Mid-
Atlantic casino gaming industry.
Dr. Barrow’s research has been published in various scholarly journals, including Gaming Law
Review and Economics, Gaming Research & Review Journal, Casino Enterprise Management,
Journal of Travel Research, Massachusetts Benchmarks, and Journal of Economic Issues. He has also
authored more than 300 applied policy monographs and consultant reports, as well as dozens of
articles in trade publications, magazines, and newspapers. He has delivered invited talks to more
than 100 business and community groups and delivered expert testimony to numerous state
legislatures, as well as other state and federal agencies. His research and expert commentary have
been cited in more than 3,000 newspaper and magazine articles, including the Wall Street Journal,
New York Times, Financial Times, Washington Post, Christian Science Monitor, USA Today, Forbes, and
Time.
Dr. Barrow holds a B.A. in Political Science from Texas A&M University, and an M.A. and Ph.D. in
Political Science from the University of California, Los Angeles.
Revenue Displacement & Negative Economic Impacts
- 85 -
Appendix B: About Pyramid Associates, LLC
Pyramid Associates, LLC is a registered Massachusetts company (est. 2006) with offices in Fall River,
Massachusetts and Edinburg, Texas. The company specializes in providing custom designed applied
policy and economic research for clients in the public, private, and non-profit sectors, including
many Fortune 500 companies. The company’s areas of expertise include:
Gaming market analysis (gravity modeling);
Economic impact and economic base analysis;
Industry analysis;
Workforce development planning;
Public opinion polling and behavioral survey research.
The partners and employees at Pyramid Associates, LLC have conducted research on a wide variety
of industries, including:
Casino gaming,
Leisure, hospitality, and tourism,
Retail trade,
Marine science and technology,
Technology assessment,
Textiles and apparel,
Health care,
Education,
Arts and crafts,
Cultural economic development, and
Public infrastructure development.
Revenue Displacement & Negative Economic Impacts
- 86 -
Appendix C: Retail Gravity Modeling
The gravity model is a tool first developed by economists in the late 1920s and early 1930s for the
purpose of estimating retail trade flows between various geographic areas, although private retail
companies quickly recognized their utility for estimating the potential customer base and future
annual sales of new stores. Gravity models are actually derived from Sir Isaac Newton’s Law of
Gravitation, which was first used to predict the movement of people, commodities, and sales by
William J. Reilly, a professor of business at the University of Texas. Reilly published The Law of
Retail Gravitation in 1931 after he realized that Newton’s Law of Gravitation seemed to loosely
express the empirical regularities he observed while conducting several trading area investigations
for chain grocery stores in Texas during the late 1920s (Reilly 1929).
Newton’s Law of Gravitation, which was first articulated in his Philosophiæ Naturalis Principia
Mathematica (1687) states that the gravitational force between two masses is proportional to the
product of the two masses and inversely proportional to the square of the distance between them.
Reilly argued that Newton’s Law of Gravitation seemed to provide a good working hypothesis for
defining the boundaries of competing retail trade areas if one translated the law into two behavioral
concepts: (a) that the ability of a city to attract non-resident trade is a function of its population
(mass) and (b) that the flow of nonresident trade to a city is an inverse function of distance (force)
(Thompson 1967, 37). If one adopted this hypothesis, then the law of retail gravitation could be used
to calculate the “breaking point” between two places, where customers will be drawn to one or
another of two competing commercial centers (Anas 1987, 45-54; Golledge and Timmermans 1988).
In this sense, Reilly argued that “two cities attract retail trade from an intermediate city or town in
the vicinity of the breaking point approximately in direct proportion to the populations of the two
cities and in inverse proportion to the square of the distances from the two cities to the intermediate
town” (Huff 1963, 81-82), although notably, Reilly’s formulation of the law presumes that the
geography of an area is flat without any rivers, roads, or mountains to alter a consumer’s decision
about where to travel to purchase a particular good or service.
Reilly’s Law remained an interesting hypothesis for more than a decade and, as late as 1944, the
editor of The Journal of Marketing, which became a key academic testing ground for Reilly’s Law,
wrote that “there is a real need for inductive studies of consumer buying habits” (quoted in Bennett
1944, 405). Professor Victor W. Bennett published one of the first studies of this type based on a
survey of 240 families living in Laurel, Maryland. The families were questioned on their choice of
shopping venues in Baltimore, Maryland and Washington, D.C. and, in one of the first empirical
tests of Reilly’s Law, Bennett (1944, 413) found that “there is more out-of-town buying by Laurel
consumers in Baltimore than in Washington, [which] conforms roughly to the application of Reilly’s
Law.”
Bennett’s study was followed by the noteworthy work of P.D. Converse (1943, 1946, 1948), a
professor of business at the University of Illinois, who examined retail customer movement between
several communities in Illinois and established the usefulness of Reilly’s Law for defining retail
trade areas across a much larger geographic area. However, Converse made a significant addition
to Reilly’s Law that more precisely determined the breaking point between competing trading areas
centered in two different cities. Converse defined the breaking point between two trading areas as
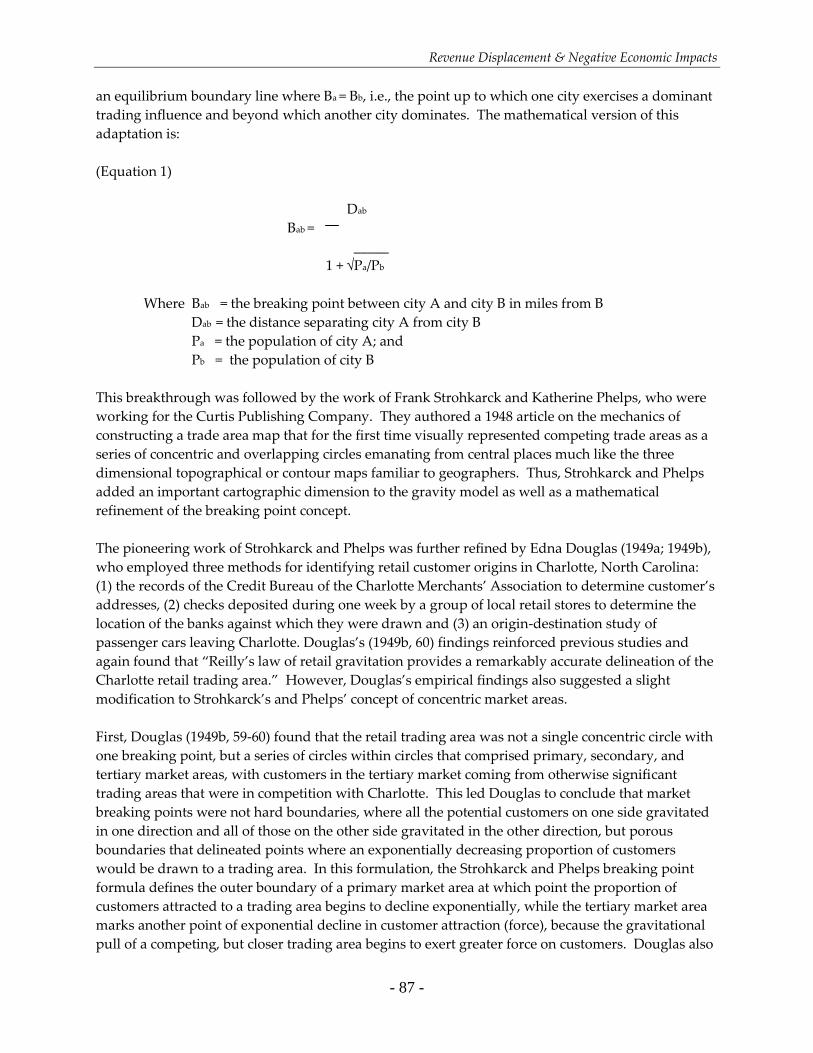
Revenue Displacement & Negative Economic Impacts
- 87 -
an equilibrium boundary line where Ba = Bb, i.e., the point up to which one city exercises a dominant
trading influence and beyond which another city dominates. The mathematical version of this
adaptation is:
(Equation 1)
Dab
Bab =
_____
1 + √Pa/Pb
Where Bab = the breaking point between city A and city B in miles from B
Dab = the distance separating city A from city B
Pa = the population of city A; and
Pb = the population of city B
This breakthrough was followed by the work of Frank Strohkarck and Katherine Phelps, who were
working for the Curtis Publishing Company. They authored a 1948 article on the mechanics of
constructing a trade area map that for the first time visually represented competing trade areas as a
series of concentric and overlapping circles emanating from central places much like the three
dimensional topographical or contour maps familiar to geographers. Thus, Strohkarck and Phelps
added an important cartographic dimension to the gravity model as well as a mathematical
refinement of the breaking point concept.
The pioneering work of Strohkarck and Phelps was further refined by Edna Douglas (1949a; 1949b),
who employed three methods for identifying retail customer origins in Charlotte, North Carolina:
(1) the records of the Credit Bureau of the Charlotte Merchants’ Association to determine customer’s
addresses, (2) checks deposited during one week by a group of local retail stores to determine the
location of the banks against which they were drawn and (3) an origin-destination study of
passenger cars leaving Charlotte. Douglas’s (1949b, 60) findings reinforced previous studies and
again found that “Reilly’s law of retail gravitation provides a remarkably accurate delineation of the
Charlotte retail trading area.” However, Douglas’s empirical findings also suggested a slight
modification to Strohkarck’s and Phelps’ concept of concentric market areas.
First, Douglas (1949b, 59-60) found that the retail trading area was not a single concentric circle with
one breaking point, but a series of circles within circles that comprised primary, secondary, and
tertiary market areas, with customers in the tertiary market coming from otherwise significant
trading areas that were in competition with Charlotte. This led Douglas to conclude that market
breaking points were not hard boundaries, where all the potential customers on one side gravitated
in one direction and all of those on the other side gravitated in the other direction, but porous
boundaries that delineated points where an exponentially decreasing proportion of customers
would be drawn to a trading area. In this formulation, the Strohkarck and Phelps breaking point
formula defines the outer boundary of a primary market area at which point the proportion of
customers attracted to a trading area begins to decline exponentially, while the tertiary market area
marks another point of exponential decline in customer attraction (force), because the gravitational
pull of a competing, but closer trading area begins to exert greater force on customers. Douglas also
Revenue Displacement & Negative Economic Impacts
- 88 -
found that the primary market area was indeed nearly circular as hypothesized by Strohkarck and
Phelps, but the secondary market area became somewhat elliptical, while the boundaries of the
tertiary market area were quite erratic depending upon the level of competition from outlying areas
with significant trading centers.
The next major advance in gravity modeling was stimulated by the emergence of regional shopping
centers (i.e., malls). By the 1950s, the investors in costly real estate projects, such as banks, insurance
companies, and other financial institutions, were no longer willing to rely on the intuition of
business entrepreneurs for making decisions, but increasingly sought to base investment decisions
on solid factual information as to the profitability of a proposed real estate investment. Similarly,
prospective store tenants, often the large retail chains that were being asked to anchor the new
shopping centers, conducted their own studies to evaluate proposed shopping center locations. This
second generation of trade area studies incorporated concepts and research techniques from
marketing, geography, statistics, economics and the behavioral science disciplines (e.g., psychology
and sociology) (Applebaum 1965, 234). By the mid-1950s, this type of gravity model was being
applied to both inter-urban and intra-urban market areas for the purpose of determining the market
feasibility of local malls, large chain stores, and regional shopping centers (Ellwood 1954) and by the
1960s gravity models were being used to assist government officials with economic development
and urban planning (Huff 1963; Lakshmanan 1964). Subsequently, gravity models were used to
predict consumer preferences for a wide variety of competing retail and service industry outlets,
such as hospitals (Bucklin 1971), large chain stores (MacKay 1973), banks (Ali and Greenbaum 1977),
and movie theatres (Davis 2006). By the 1970s, gravity models were being extended to the leisure
and social travel industries (Gilbert, Peterson, and Line 1972; Stutz 1973; Vickerman 1974).
However, during this period (1950-1970), there were two additional developments in the science of
gravity modeling. First, as Louis P. Bucklin (1971, 489) observes: “In its original formulation, the
retail gravity model was used to predict the point between two cities where trade between them
would be divided. This ‘breaking point’ defined the geographical size of the market which each city
controlled I the other.” However, Bucklin (1967a; 1967b) was among the first scholars to test the
gravity model’s ability to predict intra-urban shopping patterns as opposed to inter-urban shopping
patterns. For example, in one study, Bucklin conducted a survey of 500 female heads of household
in Oakland, California. In this study, he (1967b, 42) concluded “that mass retains much influence in
the selection of an intra-urban shopping center,” but this innovation also shifted the concept of mass
from the size of an area’s population to the size and composition of the facility. This subtle shift
built on the work of Professor George Schwartz’s (1962) University of Illinois marketing group,
which had generated impressive statistical evidence to validate Reilly’s original hypothesis that one
could use population or retail square footage as the sole proxy for measuring retail mass in gravity
models.
The results of these studies were so consistent and so reliable that nearly three decades after the
publication of Reilly’s Law of Retail Gravity (1931), Robert Ferber (1958, 302) was able to declare that:
“The two variables included in Reilly’s Law and in subsequent formulations – population and distance
– account for almost all the variations in sales between cities.” Indeed, after three decades of testing
Reilly’s Law, Allen F. Jung (1959, 62), a research associate at the University of Chicago suggested
that “through the years little, if any, evidence has been presented which conflicts with this [Reilly’s]
law.” These claims were reaffirmed by David L. Huff (1963, 81), who observed that “empirical
Revenue Displacement & Negative Economic Impacts
- 89 -
evidence is available to indicate that in many cases the use of such [gravity] models has provided
fairly good approximations of the limits of a number of retail trade areas.”
The Huff Model:
Variety, Time, Income, and Probability
Scholars, retail executives, real estate investors, and urban planners enthusiastically embraced
Reilly’s Law of Retail Gravitation as an iron law of retail trade distribution, but at the same time a
number of methodological amplifications were introduced in the 1960s and 1970s which culminated
in the introduction of the “Huff model” (Applebaum 1965, 234). It is actually David L. Huff, a
former professor of business at the University of California, Los Angeles (UCLA), who pioneered
the type of gravity model utilized most frequently by the casino industry and casino industry
consultants. Huff (1963, 85) proposed four modifications to Reilly’s Law that were critical to the
development of the Huff model: (1) Merchandise Offerings (or the number of items of the kind a
consumer desires that are carried by the retail outlet), (2) the travel time that is involved in getting
from a consumer’s travel base to alternative retail facilities, (3) the average household income of
people living in the trading area, (4) probability contours as opposed to breaking points. We might
suggest by way of analogy that just as Newtonian mechanics was superseded – though not
displaced – by Niels Bohrs’ quantum mechanics a similar phenomenon occurred in the business and
social sciences as the focus shifted from aggregate populations to individual consumer behavior – or
from planetary bodies to sub-atomic particles.
First, Huff suggested that it is not just the square footage that measures the mass of a retail facility,
but rather square footage is really a proxy indicator for the number of stores, types of stores, and
range of merchandise offerings at a particular location, because it is this variety that justifies
traveling longer distances by making more purchasing options available at a single location. In the
gravity models used by the casino industry and its consultants, this concept of mass has typically
been operationalized exclusively in terms of gaming positions, where one slot machine equals one
gaming position and one table game equals five or six positions, because a table can accommodate
multiple players. These accumulated modifications to the concept of mass are often referred to
today as “destination effects” (Black 1983).
Second, and despite widespread recognition of this shortcoming, most gravity models, including
those used in the casino industry are based on the assumption that customers patronize a facility
according to some rule involving the comparative distance between two facilities, all other things
being equal. A customer prefers facility A over facility B if the distance to facility A is shorter than
some function of the distance to facility B (Drezner, Drezner, and Eiselt 1996). However, Richard
Nelson (1958, 149) was one of the first scholars to suggest that driving time, rather than distance was
a more important determinant of customer preference for alternative shopping facilities (Nelson
1958, 149). Similarly, by the late 1950s, Eugene J. Kelley (1958, 32) had commented that
“convenience costs are assuming more importance as patronage determinants” compared to
distance. Kelley observes by this time that marketers had actually identified “ten convenience
forms” with “place convenience” being only one of the ten forms. Nevertheless, Kelley’s work
continued to emphasize the importance of place, or geographic area, as defined by the concentration
or dispersion of population as did Reilly.
Revenue Displacement & Negative Economic Impacts
- 90 -
Yet, Kelley did introduce two new elements into the concept of place convenience. Kelley (1958, 35)
challenged the equivalence of “the distance concept” with “convenience” by noting that distance
involves “time-cost elements rather than a purely spatial one.” Higher road speeds and the
emergence of large planned retail centers were actually changing consumers’ perceptions of
distance, because one could travel further faster and obtain more goods and services at a single
location. Kelley (1958, 35) also noted the importance of parking to retail structures as an element of
time convenience, observing that “it is generally agreed that shoppers resist walking more than 600
feet from their parked cars to the nearest center store ... this suggests a limit to the maximum
parking distance” that can be used before a retail center loses its other advantages over competing
centers and certainly anyone who operates, manages, or visits a casino will recognize the importance
of parking, i.e., finding a space quickly, getting into the facility quickly, and avoiding inclement
weather.
Kelley’s observations was validated in subsequent research, including a study Professors James A.
Brunner and John L. Mason (1968), who studied consumer preferences for various shopping centers
in Toledo, Ohio based on drive times as opposed to distance. The findings confirmed the drive-time
hypothesis as superior to the simple distance concept proposed by Reilly, but given the limited
geographic sample, Brunner and Mason (1968, 61) called on other researchers “to ascertain the
degree to which these observations are generally true for other shopping centers in other
communities.” A license plate survey of 93,500 passenger cars in 18 Greater Cleveland shopping
centers by Cox and Cooke (1970, 13) in fact confirmed that “the driving time required to reach a
center is highly influential in determining consumer shopping center preferences” (also see,
McCarthy 1964, 577; Cox and Erickson 1967, 52; Berry 1967).
However, Cox and Cooke also found that the “drawing power” (i.e., gravity factor) of a shopping
center still had to be incorporated into the gravity model, because consumers were willing to drive
farther to reach a shopping center depending upon “relative attractiveness” compared to other
shopping centers. Cox and Cooke (1970, 14) suggested that a number of factors could be used to
measure the attractiveness of a facility, such as the number of parking spaces, the size of the center,
and the types of stores in the center,” since these factors could partially overcome the “friction” or
“inertia” of drive time and distance. Furthermore, Gautschi (1981) points out that the first gravity
models constructed to evaluate the potential trade areas of planned shopping centers assumed the
automobile of the 1950s and the 1960s, as well as the transportation network in place at the time.
Consequently, Gautschi (1981, 172) argues that the development of better, faster, and more
comfortable automobiles, the construction of superior road systems (parkways, interstate highways),
and urban mass transit means (at least theoretically) that “the travel time parameter has an inflated
absolute value,” which “serves to underestimate the expanse of a center’s trading area.”
However, even as late as 1978, Raymond Hubbard found that “the vast majority of the literature” on
gravity modeling and retail trade areas still utilized “objective distance data,” rather than drive
times partly because distance data was easily available, but drive times were not available in any
readily useable format. The use of distance, rather than drive time, has been almost universal in the
casino industry’s gravity models, but the difference between distance and drive time can be
significant in various geographies that are not flat, where the width and quality of roads is not
consistent, where weather can be a factor, and where urban congestion or other choke points can
significantly alter the relationship between distance and drive time. However, the lack of available
Revenue Displacement & Negative Economic Impacts
- 91 -
data on drive times is a technical problem that should largely have been eliminated by the
introduction of computer and internet programs, such as MapPoint, Google Maps, Yahoo Maps,
Map Quest, Free Mileage Calculator, and other programs that have made drive-time data easily
accessible for incorporation into gravity models.
Third, while Reilly accounted for differences of population, he did not account for differences of
income. Yet, as early as 1958, Ferber’s (1958, 303) consumer behavior research, which was based on
Reilly’s Law had found that “income is a major factor influencing variations in per capita retail sales
between cities for most categories of sales.” Similarly, Bucklin (1967b, 42) found but that consumer
perceptions about the value mass imparts vary considerably” among consumers depending on the
motivation of consumers. In particular, he found that mass had a higher attraction (force) for those
with higher incomes, since these consumer cohorts were willing to travel farther to a primary retail
center to obtain the benefits of retail mass, while secondary centers held a greater attraction for those
seeking convenience, and tertiary centers (i.e., small out of the way stores) were more likely to
attract price conscious consumers. Thus, subsequent research has found that mass and income are
two factors that will interact to promote “excess travel behavior” (Hubbard 1978, 8-10). This is not
only because a larger mass exerts more gravitational force on consumers, but because “those
individuals showing evidence of higher income levels are more readily able to bear the costs
involved in shopping around, and therefore tend to travel greater distances in the journey to
consume” (Hubbard 1978, 9; for example, McAnnally 1965; Schiller 1972). Thus, a larger and more
attractive retail facility increases the likelihood that higher income consumers will travel distances in
excess of those that are theoretically justified (Hubbard 1978, 9). By the late 1960s, consumer
behavior surveys were documenting that the nearest center postulate “provided an inadequate
description of consumer movements” and that large numbers of consumers deviated from what was
defined as “spatially lawful behavior” (Golledge et al 1966; Rushton et al. 1967; Hubbard 1978, 3-4).
This is particularly important to gravity modeling in the casino industry, where surveys have
documented that the individuals who patronize destination resort casinos, in particular, have
incomes higher than the median income of its host jurisdiction (AGA, 2013; Barrow and Borges
2013b).
Finally, David L. Huff (1961, 84) identified another significant limitation to the application of Reilly’s
Law, which is that “the calculation of breaking points to delimit a retail trade area conveys an
impression that a trading area is a fixed boundary circumscribing the market potential of a retail
facility, when in fact there is an exponential distance decay factor of declining retail attraction within
the trade area, as well as interpenetration and overlap between designated market areas.” This
problem had been identified earlier in the development of gravity modeling by scholars, such as
Edna Douglas, who had mapped trade areas based on actual consumer origins, rather than distance
postulates. Huff (1961, 490) built on this work, but was more emphatic in stating that trading areas
do not have hard boundaries, but shade off into another and, therefore, “probabilistic models are
appropriate measures of this process.” Thus, Huff proposed that breaking points be replaced by
“exponents,” which are the statistical units that capture and measure the distance decay factor in
terms of the probability that an individual consumer will choose to patronize a specified facility.
This does not mean that the breaking point formula is irrelevant, but that it defines the 0.50
probabilistic contour or the point up to which a customer has a greater or less than fifty percent
(50%) probability of selecting one facility over another. The lines demarcating or connecting the
geographical units with comparable decay factors on a map are called “probability contours”
Revenue Displacement & Negative Economic Impacts
- 92 -
instead of market boundaries, because they delimit the statistical probability that individuals will
select a particular trading area or facility.
The “most obvious deficiency” in the application of this principle at the time was “the lack of direct
information on the actual spatial movements and expenditures of individuals” (Golledge et al., 1966,
261). This difficult has largely been removed in the casino industry where the annual Harrah’s
(2006) surveys of “propensity to gamble” – now conducted by the American Gaming Association
(2007-2013) – has provided reliable data at the state level. The development of sophisticated players’
club databases, hotel guest databases, and daily headcounts by casinos have perhaps made the
industry a leader in this area, particularly as this proprietary information is often provided to
consultants, who can then develop more elaborate models based on actual player origins and
gaming behavior (e.g., spend per visit).
The Huff model, which was first articulated in two articles published in 1963 and 1964, incorporated
these four modifications to Reilly’s Law to construct an alternative model of retail gravitation based
on consumer behavior theory and goods theory, rather than central place theory. In Huff’s 1963 (87-
88) article, he walks the reader through a seven step process for constructing a gravity model that
incorporates drive times and that maps trade areas based on exponential decay factors, the actual
population residing within these probabilistic contours, and the average household income of the
households residing within each contour of the map.
The seven-step process for constructing a Huff models is as follows:
1. “Divide the area surrounding any existing or proposed shopping center into small statistical
units. These units could be Census enumeration districts.
2. Determine the square footage of retail selling space of all shopping centers included within
the area of analysis.
3. Ascertain the travel time involved in getting from a particular statistical unit to each of the
specified shopping centers.
4. Calculate the probability of consumers in each of the statistical units going to the particular
shopping center under investigation for a given product purchase.
5. Map the trading area of the shopping center in question by drawing lines connecting all
statistical units having like probabilities.
6. Calculate the number of households within each of the statistical units. Then, multiply each
of these figures by their appropriate probability values to determine the expected number of
consumers (expressed in households) who will patronize the shopping center in question for
a particular product purchase.
7. Determine the annual average per household incomes of each of the statistic units. Compare
such figures to corresponding annual household budget expenditures in order to determine
the average expected amounts spent by such families on various classes of products, e.g.,
clothing and furniture. Estimate annual sales for the shopping center under investigation by
multiplying each of the product budget figures by expected number of consumers from each
statistical unit who are expected to patronize the shopping center in question. Then, sum
these individual estimates to arrive at a total annual sales potential by product class for the
selected shopping center” (Huff 1963, 87-88).
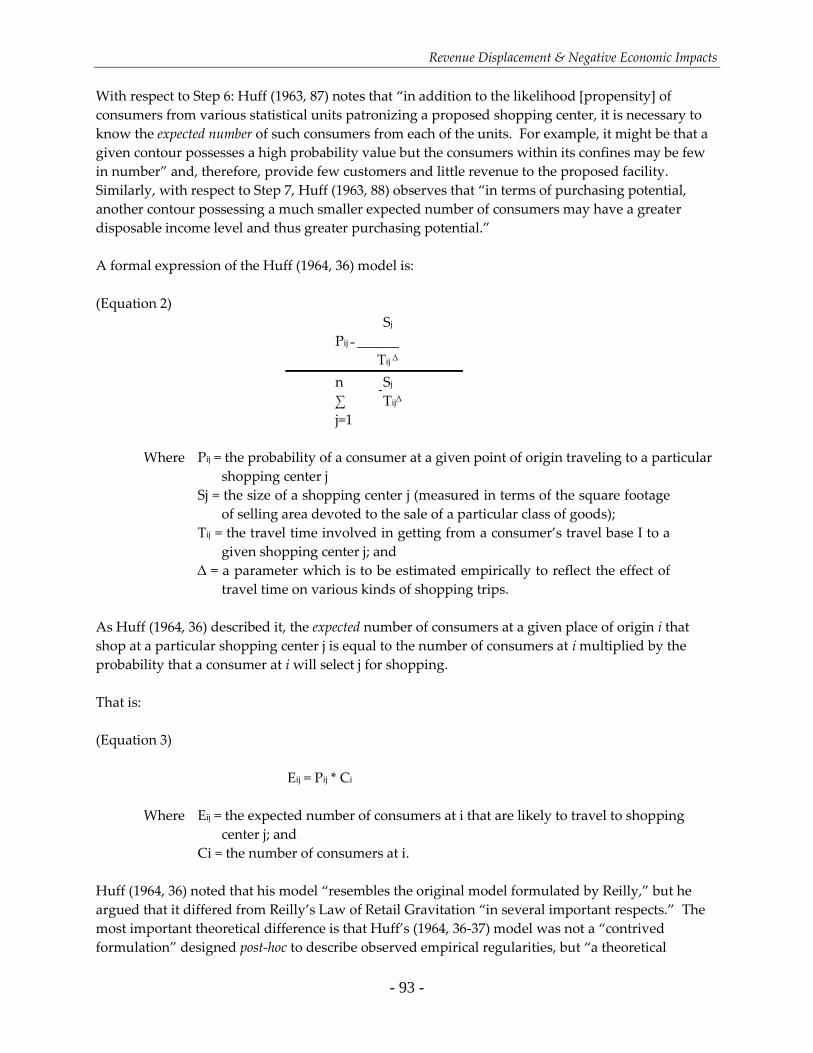
Revenue Displacement & Negative Economic Impacts
- 93 -
With respect to Step 6: Huff (1963, 87) notes that “in addition to the likelihood [propensity] of
consumers from various statistical units patronizing a proposed shopping center, it is necessary to
know the expected number of such consumers from each of the units. For example, it might be that a
given contour possesses a high probability value but the consumers within its confines may be few
in number” and, therefore, provide few customers and little revenue to the proposed facility.
Similarly, with respect to Step 7, Huff (1963, 88) observes that “in terms of purchasing potential,
another contour possessing a much smaller expected number of consumers may have a greater
disposable income level and thus greater purchasing potential.”
A formal expression of the Huff (1964, 36) model is:
(Equation 2)
Sj
Pij = ______
Tij ∆
n Sj
∑ Tij∆
j=1
Where Pij = the probability of a consumer at a given point of origin traveling to a particular
shopping center j
Sj = the size of a shopping center j (measured in terms of the square footage
of selling area devoted to the sale of a particular class of goods);
Tij = the travel time involved in getting from a consumer’s travel base I to a
given shopping center j; and
∆ = a parameter which is to be estimated empirically to reflect the effect of
travel time on various kinds of shopping trips.
As Huff (1964, 36) described it, the expected number of consumers at a given place of origin i that
shop at a particular shopping center j is equal to the number of consumers at i multiplied by the
probability that a consumer at i will select j for shopping.
That is:
(Equation 3)
Eij = Pij * Ci
Where Eij = the expected number of consumers at i that are likely to travel to shopping
center j; and
Ci = the number of consumers at i.
Huff (1964, 36) noted that his model “resembles the original model formulated by Reilly,” but he
argued that it differed from Reilly’s Law of Retail Gravitation “in several important respects.” The
most important theoretical difference is that Huff’s (1964, 36-37) model was not a “contrived
formulation” designed post-hoc to describe observed empirical regularities, but “a theoretical
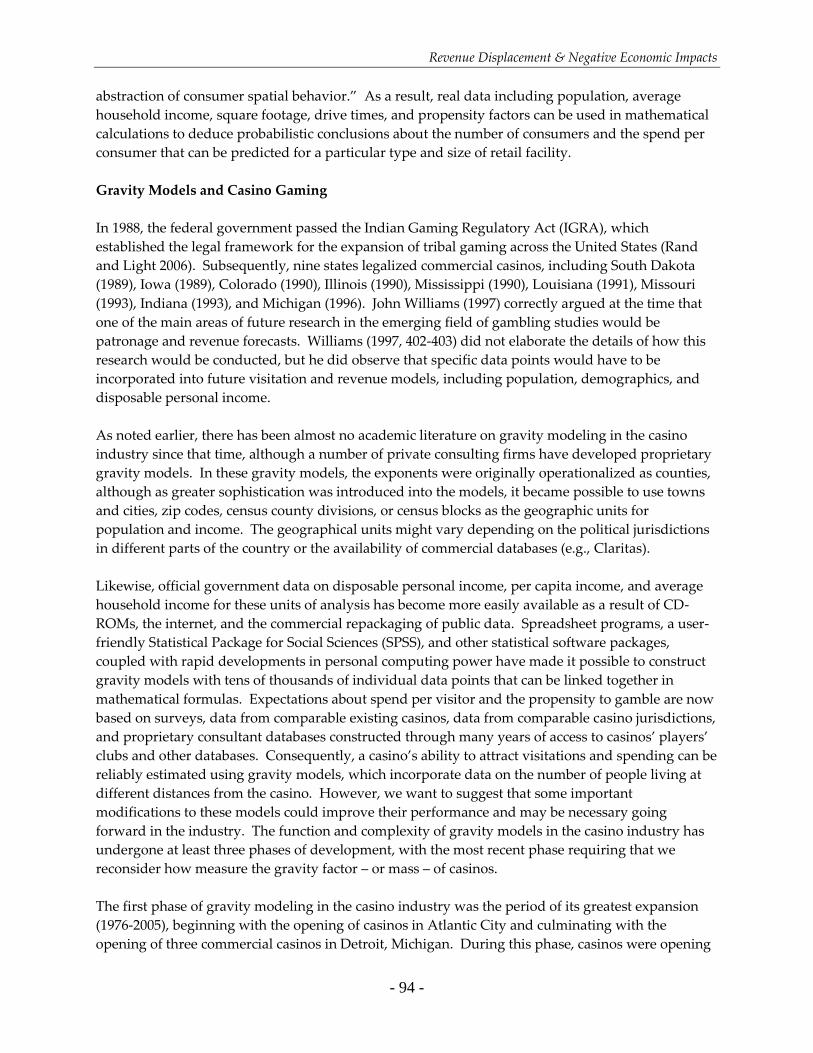
Revenue Displacement & Negative Economic Impacts
- 94 -
abstraction of consumer spatial behavior.” As a result, real data including population, average
household income, square footage, drive times, and propensity factors can be used in mathematical
calculations to deduce probabilistic conclusions about the number of consumers and the spend per
consumer that can be predicted for a particular type and size of retail facility.
Gravity Models and Casino Gaming
In 1988, the federal government passed the Indian Gaming Regulatory Act (IGRA), which
established the legal framework for the expansion of tribal gaming across the United States (Rand
and Light 2006). Subsequently, nine states legalized commercial casinos, including South Dakota
(1989), Iowa (1989), Colorado (1990), Illinois (1990), Mississippi (1990), Louisiana (1991), Missouri
(1993), Indiana (1993), and Michigan (1996). John Williams (1997) correctly argued at the time that
one of the main areas of future research in the emerging field of gambling studies would be
patronage and revenue forecasts. Williams (1997, 402-403) did not elaborate the details of how this
research would be conducted, but he did observe that specific data points would have to be
incorporated into future visitation and revenue models, including population, demographics, and
disposable personal income.
As noted earlier, there has been almost no academic literature on gravity modeling in the casino
industry since that time, although a number of private consulting firms have developed proprietary
gravity models. In these gravity models, the exponents were originally operationalized as counties,
although as greater sophistication was introduced into the models, it became possible to use towns
and cities, zip codes, census county divisions, or census blocks as the geographic units for
population and income. The geographical units might vary depending on the political jurisdictions
in different parts of the country or the availability of commercial databases (e.g., Claritas).
Likewise, official government data on disposable personal income, per capita income, and average
household income for these units of analysis has become more easily available as a result of CD-
ROMs, the internet, and the commercial repackaging of public data. Spreadsheet programs, a user-
friendly Statistical Package for Social Sciences (SPSS), and other statistical software packages,
coupled with rapid developments in personal computing power have made it possible to construct
gravity models with tens of thousands of individual data points that can be linked together in
mathematical formulas. Expectations about spend per visitor and the propensity to gamble are now
based on surveys, data from comparable existing casinos, data from comparable casino jurisdictions,
and proprietary consultant databases constructed through many years of access to casinos’ players’
clubs and other databases. Consequently, a casino’s ability to attract visitations and spending can be
reliably estimated using gravity models, which incorporate data on the number of people living at
different distances from the casino. However, we want to suggest that some important
modifications to these models could improve their performance and may be necessary going
forward in the industry. The function and complexity of gravity models in the casino industry has
undergone at least three phases of development, with the most recent phase requiring that we
reconsider how measure the gravity factor – or mass – of casinos.
The first phase of gravity modeling in the casino industry was the period of its greatest expansion
(1976-2005), beginning with the opening of casinos in Atlantic City and culminating with the
opening of three commercial casinos in Detroit, Michigan. During this phase, casinos were opening
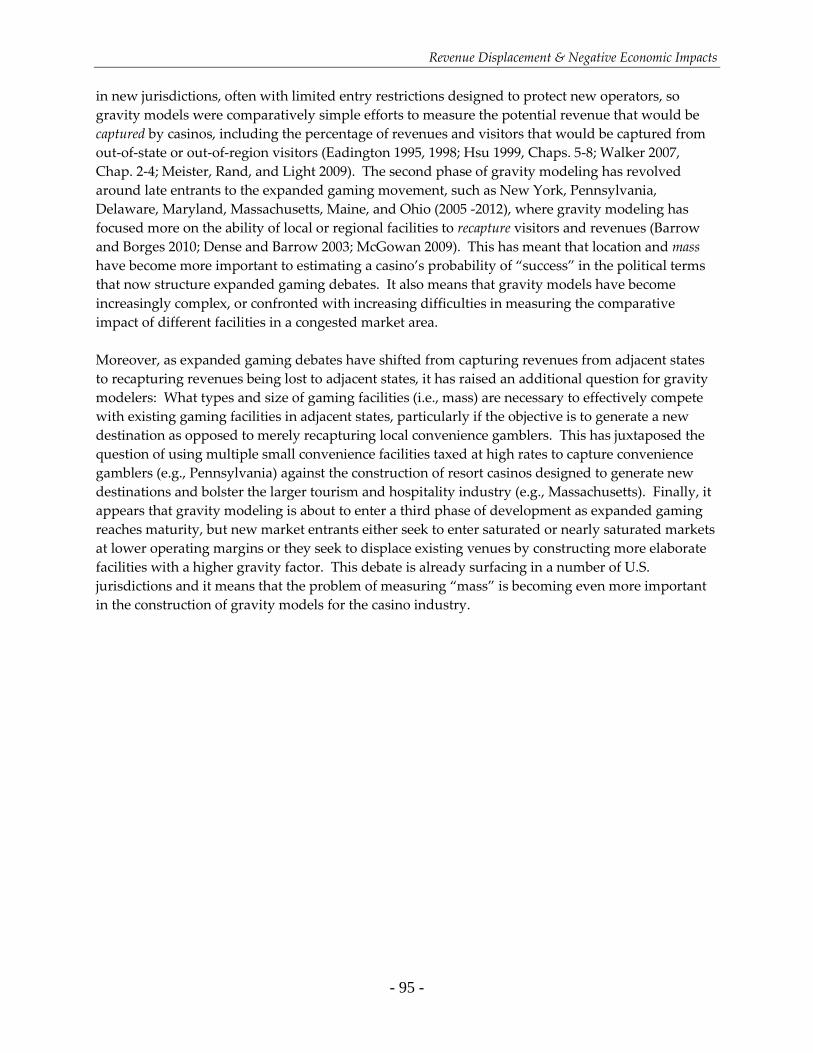
Revenue Displacement & Negative Economic Impacts
- 95 -
in new jurisdictions, often with limited entry restrictions designed to protect new operators, so
gravity models were comparatively simple efforts to measure the potential revenue that would be
captured by casinos, including the percentage of revenues and visitors that would be captured from
out-of-state or out-of-region visitors (Eadington 1995, 1998; Hsu 1999, Chaps. 5-8; Walker 2007,
Chap. 2-4; Meister, Rand, and Light 2009). The second phase of gravity modeling has revolved
around late entrants to the expanded gaming movement, such as New York, Pennsylvania,
Delaware, Maryland, Massachusetts, Maine, and Ohio (2005 -2012), where gravity modeling has
focused more on the ability of local or regional facilities to recapture visitors and revenues (Barrow
and Borges 2010; Dense and Barrow 2003; McGowan 2009). This has meant that location and mass
have become more important to estimating a casino’s probability of “success” in the political terms
that now structure expanded gaming debates. It also means that gravity models have become
increasingly complex, or confronted with increasing difficulties in measuring the comparative
impact of different facilities in a congested market area.
Moreover, as expanded gaming debates have shifted from capturing revenues from adjacent states
to recapturing revenues being lost to adjacent states, it has raised an additional question for gravity
modelers: What types and size of gaming facilities (i.e., mass) are necessary to effectively compete
with existing gaming facilities in adjacent states, particularly if the objective is to generate a new
destination as opposed to merely recapturing local convenience gamblers. This has juxtaposed the
question of using multiple small convenience facilities taxed at high rates to capture convenience
gamblers (e.g., Pennsylvania) against the construction of resort casinos designed to generate new
destinations and bolster the larger tourism and hospitality industry (e.g., Massachusetts). Finally, it
appears that gravity modeling is about to enter a third phase of development as expanded gaming
reaches maturity, but new market entrants either seek to enter saturated or nearly saturated markets
at lower operating margins or they seek to displace existing venues by constructing more elaborate
facilities with a higher gravity factor. This debate is already surfacing in a number of U.S.
jurisdictions and it means that the problem of measuring “mass” is becoming even more important
in the construction of gravity models for the casino industry.


![Tribal State Compact Mohegan[1]](https://img.pdfslide.net/doc/110x75/577d22ec1a28ab4e1e98883c/tribal-state-compact-mohegan1.jpg)