Embed Size (px)
Citation preview
FINAL REPORT
MOHICAN YOUTH CENTER
RSAT OUTCOME EVALUATION
Submitted to the National Institute of Justice
September 2002
By
Jennifer A. Pealer, M.A.
Project Director
Edward J. Latessa, Ph.D Principal Investigator
Melissa Winesburg, M.S.
Research Associate
Center for Criminal Justice Research University of Cincinnati
Division of Criminal Justice P.O. Box 210389
Cincinnati, OH 45221-0389
This study was funded by a grant (#99-RT-VX-K025) from the National Institute of Justice. The report reflects conclusions drawn by the authors and not the National Institute of Justice or the Ohio Office of Criminal Justice.
ii
TABLE OF CONTENTS ACKNOWLEDGEMENTS ………………………………………………………….. iv EXECUTIVE SUMMARY …………………………………………………………... v RSAT OUTCOME EVALUATION …………………………………………………. 1 STATEMENT OF THE PROBLEM ………………………………………………… 1 SITE DESCRIPTION ………………………………………………………………... 3 METHODS …………………………………………………………………………... 3 Research Design …………………………………………………………………… 3 Treatment Group …………………………………………………………………… 4 Comparison Groups………………………………………………………………. 5 Data Collection …………………………………………………………………….. 6 Process Variables Examined ……………………………………………………….. 7 Outcome Variables Examined ……………………………………………………... 8 Analysis ……………………………………………………………………………. 9 RESULTS ……………………………………………………………………………. 10 Social Demographic Information ………………………………………………….. 10 Current Offense and Criminal History …………………………………………….. 14 Drug & Alcohol History …………………………………………………………… 16 Risk Level ………………………………………………………………………….. 21 Psychological & Social Functioning ……………………………………………….. 27 Cognitive Functioning ……………………………………………………………… 28 Treatment Considerations ………………………………………………………….. 30 Intermedia te Outcomes …………………………………………………………….. 39 Termination Information …………………………………………………………… 45 Post Release Information ………………………………………………………….. 49 Performance After Termination From Treatment ………………………………….. 53 Model Predicting Successful Completion ………………………………………….. 54 Models Predicting Outcomes ………………………………………………………. 55 DISCUSSION ………………………………………………………………………... 62 Limitations of the Study…………………………………………………………….. 62 Conclusions ………………………………………………………………………… 63 Recommendations ………………………………………………………………….. 65 REFERENCES ………………………………………………………………………. 67
iii
LIST OF TABLES
Table 1: Demographic Characteristics …………………………………….…………. 11 Table 2: Social History ………………………………………………………………. 13 Table 3: Current Offense and Criminal History ……………………………………… 15 Table 4: Drug History ………………………………………………………………... 19 Table 5: Youthful Level of Service Inventory (YO-LSI) Risk Categories …...……… 24 Table 6: Descriptive Statistics for Client Self Rating – Time 1 ……………………… 28 Table 7: Rates of Phase Advancement ……………………………………………….. 38 Table 8: Program Violations …………………………………………………………. 39 Table 9: Paired Sample t-tests on Client Self Rating Time 1 – Time 2 ……………… 41 Table 10: Paired Sample t-tests on How I Think Questionnaire Time 1 – Time 2 (Includes Suspect Cases) ………………………………...
44
Table 11: Paired Sample t-tests on How I Think Questionnaire Time 1 – Time 2 (Does Not Include Suspect Cases) ………………………
46
Table 12: Termination Information …………………………………………………... 47 Table 13: Participation in Services During Post-Release Supervision ………………. 51 Table 14: Drug/Alcohol Use During Probation ……………………………………… 52 Table 15: Treatment Group Status at Termination from Probation …………………. 53 Table 16: Outcome Information for Terminated Participants ………………………. 54 Table 17: Factors Predicting Incarceration ………………………………………….. 65
LIST OF FIGURES
Figure 1: JASAE Scores ……………………………………………………………... 17 Figure 2: YO-LSI Risk Categories by Group ……………………………………….. 23 Figure 3: Cognitive Distortion Scales for the Treatment Group …………………….. 31 Figure 4: Behavioral Referent Scales for the Treatment Group ……………………... 32 Figure 5: Summary Score for the How I Think for the Treatment Group …………… 33 Figure 6: Mohican Youth Center CPAI Scores Compared to Average Scores ……… 35 Figure 7: Significant Predictors and Probabilities of Incarceration (All Groups)……………………………………………...………………...
57
Figure 8: Significant Predictors and Probabilities of Incarceration (Treatment and Pre-TC Groups) ……………………….…………………..
59
Figure 9: Significant Predictors and Probabilities of Incarceration (Treatment and DYS Groups)………………………………………………
61
APPENDICES Appendix A: Data Collection Instruments Appendix B: Descriptive Statistics
iv
ACKNOWLEDGMENTS
The University of Cincinnati recognizes that this and other research reports would not be
possible without the cooperation and support of program staff. Special thanks and
acknowledgements go to case managers at Mohican, and to Jeanette Britton for
coordinating the data collection process, and to Elaine Surber for her leadership and
ongoing support throughout this project. We also want to thank Candace Peters at the
Ohio Office of Criminal Justice for her help and support. Andy Popel, Jim Schnaible,
Bruce Sowards, and Mark Thompson from the Department of Youth Services assisted
with the outcome information for youth and we greatly appreciate their contribution to
the report. Finally, we wish to thank all the probation officers across the state that took
the time to complete the probation officer questionnaire.
v
EXECUTIVE SUMMARY
The Mohican Youth Center, located in Loudenville, Ohio, has been in operation
for 30 years and is operated by the Ohio Department of Youth Service (DYS). Since
1998, the facility has been a residential substance abuse treatment facility for felony
adjudicated males in the last six months of their sentence. This evaluation compared
those who participated in the Mohican therapeutic community residential substance abuse
treatment program (RSAT) to the youth who participated in (RSAT) at Mohican before it
was a therapeutic community (participants from January 1998 to August 1999), and a
sample of males from the Department of Youth Services to determine whether
participation in Mohican’s TC was associated with differences in outcome.
A non-equivalent comparison group design was used to conduct the outcome
evaluation. The specific research questions that were addressed included:
What are the characteristics of the youth being served by Mohican’s therapeutic community RSAT program? What, if any differences, exist between the treatment and comparison groups with regards to background characteristics?
• The treatment and comparison groups were very similar with regards to race, age at intake, highest grade completed, and enrollment in school prior to arrest. The typical youth in each group was white, 16 years of age, had completed the 8th grade, and had been enrolled in school.
• Members in the treatment and pre-TC group differed only in terms of employment
status and living arrangement prior to commitment to Mohican (data was not available for the DYS group). Youth in the pre-TC group was more likely to be unemployed and living in a secure environment prior to admission.
• Concerning criminal history, the typical offender was a property offender with a
felony level 2 offense (except for DYS where the level of offense was a misdemeanor). There were significant differences between the groups in regards to the criminal history. For example, the pre-TC was more likely to have committed a personal offense whereas the treatment group was more likely to have committed a property offense. The DYS group was the least serious group when examining the level of adjudication. The majority of DYS youth had a
vi
misdemeanor or felony 5 adjudication. The age at first arrest was approximately 12 years of age for the treatment and pre-TC group.
• The age of first drug and alcohol use was approximately 12 years of age for both
the treatment and pre-TC group (data was not available for the DYS group). In addition, the drug of choice for these two groups was marijuana.
• Results of the Juvenile Automated Substance Abuse Evaluation (JASAE)
instrument indicated that the youth in all three groups have significant substance abuse problems along with ingrained patterns and attitudes supporting this problem. The majority of youth in all groups had a score of 21 indicating a need for intensive substance abuse treatment.
• The results of the Youthful Level of Service Inventory (Y-LSI) report that the
majority of youth in the treatment group (66.6%) and the pre-TC group (69.5 %) were assessed as a high or very high risk of recidivating whereas the majority of the DYS group (56.9%) were assessed as a moderate risk of recidivating.
• Data pertaining to psychological and social factors as measured by the Client
Self-Rating are available for the treatment group and the pre-TC group. T-tests showed that the pre-TC group was a higher risk than the treatment group on the following scales: anxiety, depression, risk-taking, and hostility. However, the treatment group had higher levels of self-esteem than the pre-TC group.
• The treatment group’s cognitive distortions were measured using the How I Think
Questionnaire. The results indicate the majority of youth were classified as borderline clinical or clinical in the following scales: self-centeredness, blaming others, minimizing, opposition, physical aggression, lying, and stealing; thus, indicating high levels of cognitive distortions.
What were the specific groups that youth participated in while at Mohican? What were the rates of phase advancement and individual counseling? How many youth tested positive for drugs while in the program? How many program violations did youth experience while in the program?
• Once placed into Mohican, youth receive the same services regardless of risk
level or need level. Some specific groups included: orientation of the therapeutic community model, identifying thinking errors, personal recovery, chemical dependency, and relapse prevention. In addition, youth attend school throughout the day.
• Mohican has four different treatment phases for youth to advance through. The
orientation phase is for eight sessions. Phase one and phase two lasts for seven weeks and phase three is eight weeks. The average amount of days spent in each phase varied. On average, there were 36 days spent in orientation, 59 days spent in phase one, 56 days spent in phase two, and 54 days spent in phase three. In

vii
addition, not all participants successfully completed phase three before being terminated from Mohican.
• The average amount of time spent in individual counseling for 173 youth across
34 different sessions was 318 minutes (5.3 hours).
• There were 269 different drug tests administered to 198 youth while at Mohican. There were no positive drug tests reported.
• Mohican incorporates three types of program violations. The house violation is
the least serious followed by a major violation and then the cardinal violation is the most serious. The average number of house violations was 42 for 289 youth. The average number of cardinal violations was 1.87 and the average number of major violations was 7.03.
What are the changes in the youths’ level of psychological and social functioning? What are the changes in the youths’ cognitive distortions? What are the completion rates among RSAT participants?
• Paired sample t-tests revealed a significant difference between the time 1 and time 2 score for the following Client Self-Rating scales: depression, self-esteem, decision-making, and hostility. Participation in Mohican’s therapeutic community RSAT program resulted in a significant increase in youths’ levels of self-esteem, decision-making ability and hostility and a reduction in their depression. In addition, regression analyses revealed that the longer the youth spent in treatment, the more likely he was to be hostile.
• Paired sample t-tests revealed no significant differences between the time 1 and
time 2 measures of cognitive distortions when examining cases that may be considered suspect.1 However, when looking at the cases that were not considered suspect, participation in treatment resulted in a significant decrease in the youths’ self-centeredness, lying, covert and overt behaviors, and the overall How I Think scale.
• The majority of youth in all groups were discharged at the time of termination. In
addition, the majority of youth in the treatment group (82.1%) and the pre-TC group (100%) were successfully discharged. Forty-seven percent of the DYS group was successfully discharged. However, there were some significant differences in discharge types. The DYS group was more likely to be unsuccessfully discharged.
1 A case is considered suspect when the anomalous response scale (scale used to determine if the youth was lying or randomly marking answers) was 4.0 to 4.25.
viii
• The average length of time spent in treatment was 188 days for the treatment group and 181 days for the pre-TC group.
• A logistic regression model was calculated to determine which factors predict
successful completion of treatment for Mohican’s therapeutic community RSAT program. There were no significant predictors of successful completion, which is not surprising given that completion is largely based on the sentence length of the youth and not on the acquisition of prosocial skills.
What are the rates of new arrests and incarcerations after termination? What factors are associated with post-release performance?
• Approximately 17 percent of the treatment group was incarcerated after
termination whereas 37.5 percent of the pre-TC and 37 percent of the DYS group obtained a new period of incarceration.
• When all youth were included in the model predicting incarceration, younger
youth, youth who had completed a higher grade level, youth with a less serious offense, youth with a more serious substance abuse problem, and youth in the comparison groups were more likely to be incarcerated. After controlling for differences between the groups, the probability of incarceration for the treatment group was 16 percent versus 34 percent for the comparison group.
• When only the treatment group and the pre-TC group are included in the
model, younger youth and youth in the pre-TC group were more likely to be incarcerated. Accordingly, there was a 19-point reduction in the probability of incarceration when youth participated in the treatment group.
• Finally, when youth in the treatment group and DYS group are included to the
model, younger youth, youth with a less serious offense, youth with a more serious substance abuse problem, and youth in the comparison group were more likely to be incarcerated. Thus, the probability of incarceration for the treatment group was 18 percent versus 33 percent for the DYS group.
Overall, the outcome evaluation results are promising. The findings consistently
reveal that participation in Mohican’s therapeutic community resulted in a significant
decrease in the probability of incarceration after termination. In addition, the significant
effect was found when controlling for other factors such as race, age, grade level, and risk
level. Thus, it can be argued that participation in the therapeutic community RSAT
program greatly reduced the probability of incarceration for high-risk youth.
ix
We must offer a word of caution when interpreting these results because little was
known about the types of services these youth received once they left the institution.
Research has shown that aftercare is an integral part of treating offenders. Thus, the youth
that did not recidivate may have taken part in other services upon termination from
Mohican or DYS. In addition, there was a limited follow-up period for the youth. The
current study only tracked the youth for a period up to 21 months. Therefore, a longer
follow-up period is needed to determine if the long-term effects of treatment.
Another limitation of the study was that random assignment was not possible.
Random assignment would have allowed to the groups to be very similar with regard to
characteristics that may influence outcome and would have strengthened any findings of
a treatment effect.
Lastly, there were large amounts of missing data2 for the pre-TC and the DYS
groups. For example, we were not able to examine the type of services participated in by
the pre-TC or the DYS groups because the data was not available. In addition,
information on the number of prior arrests was not available for the pre-TC and the DYS
group. Thus, we were not able to control for these differences when predicting the
outcome.
Based on these findings, and in order to further increase the effectiveness of
Mohican’s therapeutic community RSAT program, the following recommendations are
offered:
1. Mohican should continue the therapeutic community approach. The significant findings for treatment indicated that Mohican’s TC treatment substantially reduced the probability of being incarcerated. In addition, it appears that the treatment modality is appropriate for the high-risk juvenile population.
2 In some instances, the data was simply not available to collect.
x
2. Research has shown that aftercare is an important component of therapeutic communities (Knight, Simpson, and Hiller, 1999; Wexler, Melnick, Lowe, and Peters, 1999). Accordingly, Mohican should strengthen the aftercare component. It is important that youth released from Mohican receive quality aftercare services that address their needs.
3. Mohican should continue to collect data that would enable the outcome study to
continue. The current study was limited in the amount of follow-up time to track the youth. However, if Mohican continues the study, research can further examine the long-term effects of the therapeutic community RSAT program.
1
OHIO RSAT OUTCOME EVALUATION
STATEMENT OF THE PROBLEM
The prevalence of drug and alcohol use among juvenile offenders creates many
challenges for the already overburdened juvenile justice system. Drug testing conducted in
twelve cities during 1997 revealed that 42 to 66 percent of male youths tested positive for at
least one drug at the time of arrest (National Institute of Justice, 1998). Additionally,
juvenile arrests for drug abuse violations increased 86 percent over the past decade (Snyder,
1999). Recognizing the link between continued drug use and recidivism, state and local
agencies are searching for the most effective way of treating this challenging correctional
population. The Residential Substance Abuse Treatment programs funded by Subtitle U of
the Violent Crime Control and Law Enforcement Act of 1994 offers a promising avenue for
treating drug offenders.
Residential substance abuse treatment has its roots in the therapeutic community
movement of the 1950s. Synanon, the first therapeutic community, was established by
Dederich in 1958 and emerged out of the self-help movement (Brook and Whitehead, 1980).
It is estimated that nearly one-third of all therapeutic communities today are based upon the
traditional Synanon programs (DeLeon, 1990a). These traditional programs are highly
structured and organized, and treatment lasts from one to three years (Sandhu, 1981).
Because drug use is seen as a symptom of a larger personality disorder, traditional TCs are
designed to restructure the personality of the offender through encounter group therapy and
a focus on occupational improvements. The “community” of drug offenders is seen as the
primary agent of change (DeLeon and Ziegenfuss, 1986). Recently modified versions of the
traditional TC have emerged which combine the self-help approach and cognitive-
2
behavioral approaches (e.g., relapse prevention) commonly used by mental health
professionals.
Research has been mixed concerning the effectiveness of community-based and
prison-based TCs. Several studies of community-based TCs have demonstrated a reduction
in criminal behavior and substance abuse and an improvement in employment and other
prosocial behaviors (Knight, Simpson, and Hiller, 1999; Wexler, Melnick, Lowe, and Peters,
1999; and Wexler, 1995). Overall, the research on therapeutic communities suggests that
program completion and length of stay in treatment are the most significant factors in
predicting success (usually measured as no involvement in criminal activity and abstinence
from drugs) (Simpson, 1984; DeLeon and Rosenthal, 1979; Faupel, 1981; DeLeon, 1990b).
The research on TCs is not without criticisms. Inciardi, Martin, Butzin, Hooper, and
Harrison (1997) identified four criticisms of TC research. First, a lack of multivariate
designs makes it difficult to disentangle the effects of individual characteristic and the
effects of treatment, leaving us with little information about factors that are predictors of
relapse or recidivism. Second, most studies have not incorporated multiple outcome criteria
to measure program success. Third, as with most correctional research, the follow-up time
frames have been inadequate. Fourth, the comparison groups used often fail to account for
important differences between groups that are likely to influence program outcome.
Relatedly, the use of treatment comparison groups is often misleading since members of
these groups are likely to have received some kind of treatment. Another common
shortcoming in TC research is the insufficient attention that is given to the measurement of
program quality (Faupel, 1981; Moon and Latessa, 1994). In addition most of the research
3
on the effectiveness of the TC has examined adults, research on the effectiveness of the
therapeutic community for juveniles has been scarce.
In addition, this study attempted to explore the “black box” of treatment in order to
identify those factors that are most associated with success and to facilitate the replication of
effective residential substance abuse treatment programs.
SITE DESCRIPTION
This report contains data from an outcome evaluation conducted on the Mohican
Youth Center. The Mohican Youth Center, located in Loudenville, Ohio, has been in
operation for 30 years. Since 1998, the facility has been a residential substance abuse
treatment facility for felony adjudicated males in the last six months of their sentence. This
evaluation compared those who participated in the Mohican therapeutic community to the
youth who participated in Mohican before it was a TC, and a sample of males from the
Department of Youth Services to determine whether participation in Mohican’s TC was
associated with differences in outcome.
METHODS
Research Design
This project used a non-equivalent comparison group design in order to estimate the
impact of Mohican’s Residential Substance Abuse Treatment (RSAT) program on future
criminal involvement. Random assignment to groups was not possible; however,
comparison group cases were matched by race, age, sex, risk level, and severity of substance
abuse problems. Because of programmatic changes that occurred at Mohican, two
comparison groups were used in this study. The first comparison group was those who
4
participated in Mohican Youth Center from March 1998 to March 1999. During this time,
the treatment modalities at Mohican included a combined 12-step and cognitive model of
treatment. The second comparison group used for this project was a group of youth from the
Department of Youth Services. A total of 448 participants were in the treatment group and
793 cases were in the comparison groups. The Mohican pre-TC group was comprised of 343
participants and the DYS group was comprised of 450 participants3.
Treatment Group
In March 1999, Mohican shifted treatment from a residential-based substance abuse
program to a therapeutic community model. Mohican has also adopted much of the language
of a therapeutic community. With the TC model the youth have a greater role in conducting
groups and confronting behavior. For example, youth participate in encounter groups in
which youth are confronted about behavior in front of his peers. The encounter group is
designed to make the youth see how his behavior affects the community and how his
attitudes, thoughts, and value systems affect his behavior. Youth also participate in groups
based on the phase they are in. Mohican has four phases in which youth learn about the
therapeutic community, identify thinking errors, focus on personal recovery, and practice
relapse prevention. These groups utilize some cognitive behavioral techniques such as
identifying thinking error and teaching prosocial alternatives to behavior. In addition to
group therapy, youth attend school during the year and participate in morning and evening
meetings.
3 Participation in Mohican’s treatment (either the therapeutic community or the residential treatment) was not voluntary. The entire institution was a therapeutic community (treatment group) or a residential treatment facility (pre-TC group) and youth were sent to this institution by the Department of Youth Services. However, participation in the evaluation of Mohican was voluntary. There were no consequences if the youth decided not to participate.
5
Comparison Groups
Mohican Youth Center Pre-TC. The first comparison group included in the present
study consisted of youth who were sent to Mohican from March 30, 1998 to March 31,
1999. During this time, Mohican operated a combined 12-step and cognitive-behavioral
model of treating substance abuse. The 12-step model views alcoholism as a physical,
mental, and spiritual disease (Van Voorhis and Hurst, 2000). The cognitive-behavioral
approach used by Mohican included the Normative Culture group whereby youth identified
and resolved problem behaviors and thinking errors. Thus, this cognitive component of the
program sought to reduce alcohol and drug abuse by changing the thinking that supports
substance abuse and by manipulating the stimuli and consequences that prompt and maintain
behavior. This comparison group was chosen in order to compare treatment modalities.
The pre-TC treatment was an eclectic approach which used cognitive-behavioral
techniques. The overall program was not based on an effective model of treatment as was
the TC that was operated by the Mohican treatment group. In addition, the family members
in the TC were more responsible for confronting anti-social thinking and behavior. In
essence, the study is comparing an eclectic model (12-step with cognitive-behavioral
components) with a social- learning model (therapeutic community).
DYS Participants. The other comparison group included youth in other institutions
within the Department of Youth Services who received minimal or no specialized drug and
alcohol services. The youth were randomly selected from an automated database maintained
by DYS. Females and those youth who did not have a risk assessment score were removed
from the database prior to the selection. 4
4 Ohio Department of Youth Services uses the Youthful Level of Service Inventory (YO -LSI) to determine risk level.
6
Data Collection
As part of the RSAT project, the University of Cincinnati created an automated
database to assist programs with data collection and provide a mechanism for reporting
results. The RSAT database was installed at Mohican Youth Center. Personnel collected and
entered the data into the automated database. The data consisted of: demographics, offense
and disposition, prior criminal history, drug use and history, risk level, program phases and
advancement, type of treatment, program violations, drug screens, treatment outcome, and
pre and post assessments. The site also provided agency-specific assessment information on
each youth (e.g., Youthful Level of Service Inventory). Data forms were checked
periodically to ensure the quality of the data. Recidivism data were collected by UC staff
through written surveys of parole officers and youth during December 2001 and January
2002.
In addition to quantitative data for measuring program processes, the Correctional
Program Assessment Inventory (CPAI) was used as a measure of program integrity. The
CPAI provides a standardized, objective way for assessing the quality of correctional
programming against empirically based standards. The CPAI is designed to ascertain how
well the program is meeting the principles of effective intervention. There are six primary
sections of the CPAI: program implementation, client pre-service assessment, program
characteristics, staff characteristics, evaluation, and other. Each section of the CPAI consists
of 6 to 26 items with a total of 77 items. Each of these items is scored as “0” or “1.” For an
item to be scored “1”, the program must demonstrate that it has meet the specified criteria.
Each section is scored as either “very satisfactory” (70% to 100%); “satisfactory” (69% to
60%); “needs improvement” (59% to 50%); or “unsatisfactory” (less than 50%). The overall
7
total and score is summed across the six sections and the same scale is used in determining
the overall assessment. Data for the CPAI are gathered through structured interviews with
program staff. Other sources of information include examination of program documentation,
review of case files, and observation of program activities. Upon conclusion of the
assessment, a report is written which details the program strengths and areas that need
improvement.
Research using the CPAI has shown it to be a significant predictor of arrest and
incarceration (Holsinger, 1999). Offenders who participate in programs where there is low
program integrity (as measured by the CPAI) are significantly more likely to recidivate (e.g.,
be arrested and/or incarcerated). Furthermore, other researchers have found support for the
concepts that comprise the CPAI (Antonowicz & Ross, 1994).
Process Variables Examined
There were four main categories of process variables examined including offender
characteristics, nature of services provided, termination data, and post-release treatment and
supervision.
Offender characteristics. The standardized intake form (see Appendix B) was used
to collect basic demographic information such as age, gender, race, marital status, number of
dependents, years of education, and employment status prior to arrest. Additional
information was also collected which included: school problems experienced by the youth,
criminal history and substance abuse history.
Supplemental information that was collected on youth characteristics included: the
youths’ level of psychological and social functioning as measured by the Client Self-Rating
Form (see Appendix A); their level of cognitive distortions as measured by the How I Think
8
questionnaire (see Appendix A); their risk of recidivism and major problem areas as
measured by the Youthful Level of Service Inventory; and their severity of substance abuse
problem as measured by the Juvenile Automated Substance Abuse Evaluation (JASAE).
Nature of services provided. The service tracking form (see Appendix A) was used
to collect information on the nature of services available at Mohican. The information
collected included: length of time in each phase, number of encounters, length of individual
counseling sessions, and number and type of program violations. Additional information
from the CPAI5 and the schedule of activities were used as indicators of the services
provided. Termination data. The information collected regarding the youths’
termination from Mohican included type of termination (successful or unsuccessful) and
criminal justice placement and residency upon termination (See Appendix A).
Post release treatment and supervision. Data collection instruments were
developed to gather general information from parole officers regarding each youth’s
treatment and supervision activities during the period of supervision after release from the
program. 6 The Department of Youth Services gathered additional information such as length
of time spent on parole, type of termination from parole, and new charges while on parole.
Outcome Variables Examined
There were two main categories of outcome variables examined including
intermediate outcomes and longer-term outcomes.
Intermediate outcomes. Intermediate outcomes that were examined included
changes in youth psychological and social functioning as measured by the re-administration
5 Information from the CPAI included the specific groups and interventions that were being offered to everyone. 6 A data collection instrument was sent to youth to gather information on educational progress, employment, and family situation, peer groups, and criminal involvement and drug usage after release from the program. These data were not used since only 10 questionnaires were returned.
9
of the Client Self-Rating form and changes in the youths’ level of cognitive distortions as
measured by the re-administration of the How I Think questionnaire.
Long-term outcomes. The current evaluation tracked the youth for 21 months (636
days) after they were released from Mohican. The outcome variables that were examined
included several measures of substance abuse relapse and recidivism. Relapse was measured
as new substance use (yes or no), and as the type and frequency of use throughout the
follow-up period.7 Recidivism was defined as a new incarceration in the Ohio Department of
Youth Services (DYS) or the Ohio Department of Rehabilitation and Corrections (DRC).
Information regarding the case status at the end of the follow-up period and status in
employment/school for the treatment group was also collected by the probation officers.
Analysis
This study examines the differences among the RSAT participants and comparison
group members along a variety of measures. In some instances, data for the comparison
groups were not available. When this was the case, only the treatment data was presented.
This study will examine multiple outcome measures for the RSAT participants and
comparison cases. Chi-square, t-tests, and analysis of variance tests were conducted to
examine the differences between groups.
Logistic regression was used to estimate the probability of arrest and new
incarceration after incarceration. The purpose of the logistic regression is two-fold. First, a
logistic regression model identifies the significant predictors of the outcome – new
incarceration. Second, logistic regression controls for differences between the groups.
Accordingly, variables that are significantly different will be included into the model in
order to control for these differences. The variables chosen for the logistic regression 7 Information reported by the probation officer and available for the treatment group only.
10
included: race, age, highest grade completed, felony degree, Y-LSI total, JASAE score, and
the group variable. These variables were chosen for three reasons: 1) they were correlated at
the bivariate level with the outcomes; 2) they were included as control variables because
there were significant differences between the groups; or 3) previous research has shown
that the variable was a significant predictor of outcome.
RESULTS
Social demographic data were collected in order to describe the RSAT participants
and comparison groups and to investigate whether differences in outcome were related to
differences within the three samples. By knowing the types of offender Mohican serves, we
can determine whether outcome was influenced by any of these demographic factors. This
section profiles the groups based on demographic characteristics such as age, race,
educational level and performance, employment and criminal history. Specifically, this
section will address the following questions:
• What are the characteristics of the offenders served by the Mohican Youth Center TC?
• What differences exist between the treatment and comparison groups with
regards to background characteristics?
Social Demographic Information
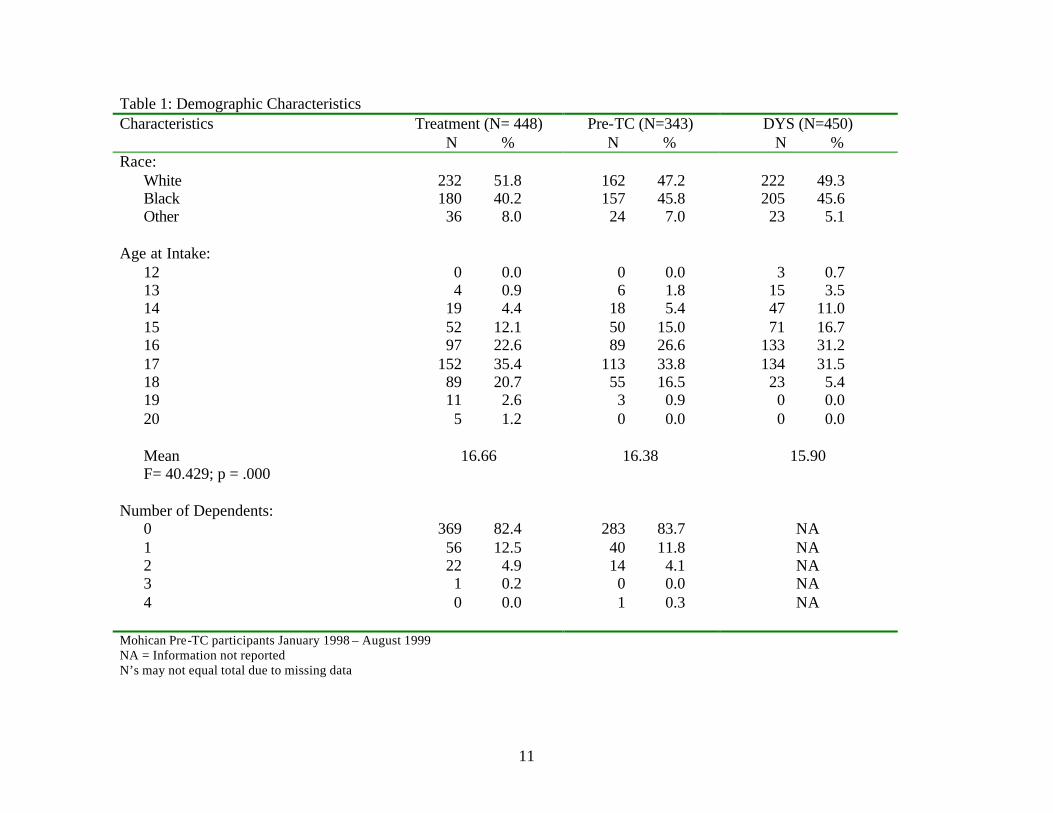
Table 1 compares the three groups on race, age, and number of dependents. With
regard to race, the majority of youth in all groups were white. Analysis of variance test
reveal
11
Table 1: Demographic Characteristics Characteristics
Treatment (N= 448) N %
Pre-TC (N=343) N %
DYS (N=450) N %
Race: White 232 51.8 162 47.2 222 49.3
Black 180 40.2 157 45.8 205 45.6 Other 36 8.0 24 7.0 23 5.1 Age at Intake: 12 0 0.0 0 0.0 3 0.7 13 4 0.9 6 1.8 15 3.5 14 19 4.4 18 5.4 47 11.0 15 52 12.1 50 15.0 71 16.7 16 97 22.6 89 26.6 133 31.2 17 152 35.4 113 33.8 134 31.5 18 89 20.7 55 16.5 23 5.4 19 11 2.6 3 0.9 0 0.0 20 5 1.2 0 0.0 0 0.0 Mean 16.66 16.38 15.90 F= 40.429; p = .000 Number of Dependents: 0 369 82.4 283 83.7 NA 1 56 12.5 40 11.8 NA 2 22 4.9 14 4.1 NA 3 1 0.2 0 0.0 NA 4 0 0.0 1 0.3 NA Mohican Pre-TC participants January 1998 – August 1999 NA = Information not reported N’s may not equal total due to missing data
12
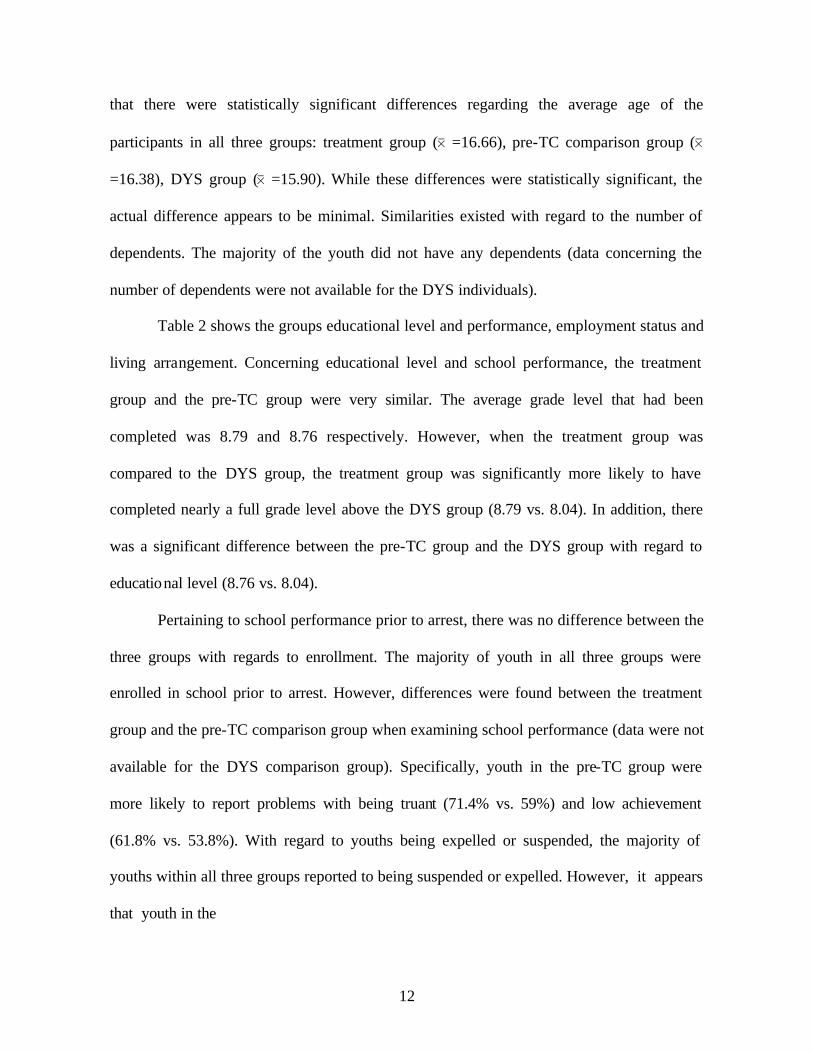
that there were statistically significant differences regarding the average age of the
participants in all three groups: treatment group (0 =16.66), pre-TC comparison group (0
=16.38), DYS group (0 =15.90). While these differences were statistically significant, the
actual difference appears to be minimal. Similarities existed with regard to the number of
dependents. The majority of the youth did not have any dependents (data concerning the
number of dependents were not available for the DYS individuals).
Table 2 shows the groups educational level and performance, employment status and
living arrangement. Concerning educational level and school performance, the treatment
group and the pre-TC group were very similar. The average grade level that had been
completed was 8.79 and 8.76 respectively. However, when the treatment group was
compared to the DYS group, the treatment group was significantly more likely to have
completed nearly a full grade level above the DYS group (8.79 vs. 8.04). In addition, there
was a significant difference between the pre-TC group and the DYS group with regard to
educational level (8.76 vs. 8.04).
Pertaining to school performance prior to arrest, there was no difference between the
three groups with regards to enrollment. The majority of youth in all three groups were
enrolled in school prior to arrest. However, differences were found between the treatment
group and the pre-TC comparison group when examining school performance (data were not
available for the DYS comparison group). Specifically, youth in the pre-TC group were
more likely to report problems with being truant (71.4% vs. 59%) and low achievement
(61.8% vs. 53.8%). With regard to youths being expelled or suspended, the majority of
youths within all three groups reported to being suspended or expelled. However, it appears
that youth in the
13
Table 2: Social History Characteristics
Treatment (N= 448) N %
Pre-TC (N=343) N %
DYS (N = 450) N %
Highest Grade Completed: 6th grade or less 10 2.3 13 3.9 38 9.8 7th - 9th grade 322 72.7 236 70.0 309 80.1 10th grade 86 19.4 57 16.9 29 7.5 11th grade 16 3.6 22 6.5 11 2.8 12th grade or higher 9 2.0 9 2.7 0 0.0 Mean 8.79 8.76 8.04 F= 45.907; p = .000 School Performance Prior to Commitment: Enrolled 319 71.4 254 74.1 320 71.1 Truant ?2 = 23.815; p = .000 263 59.0 245 71.4 NA Low achievement ?2 = 12.303; p = .000 240 53.8 212 61.8 NA Disruptive behavior ?2 = 52.046; p = .000 390 87.4 213 62.1 NA Suspensions/expulsions ?2 = 22.184; p = .000 397 89.4 267 77.8 248 76.8 Employment Status Prior to Arrest: Employed full- time 68 15.2 20 6.0 NA Employed part-time 159 35.5 67 20.1 NA Unemployed 221 49.3 246 73.9 NA ?2 = 49.103; p = .000 Living Arrangements: With parents/guardians 405 94.4 295 87.2 NA Foster care 13 3.0 5 1.5 NA Group home 9 2.1 5 1.5 NA Secure placement 2 0.5 33 9.8 NA ?2 = 39.196; p = .000 Number with History of Runaway: 109 25.4 114 33.2 NA ?2 = 6.624; p = .010
14
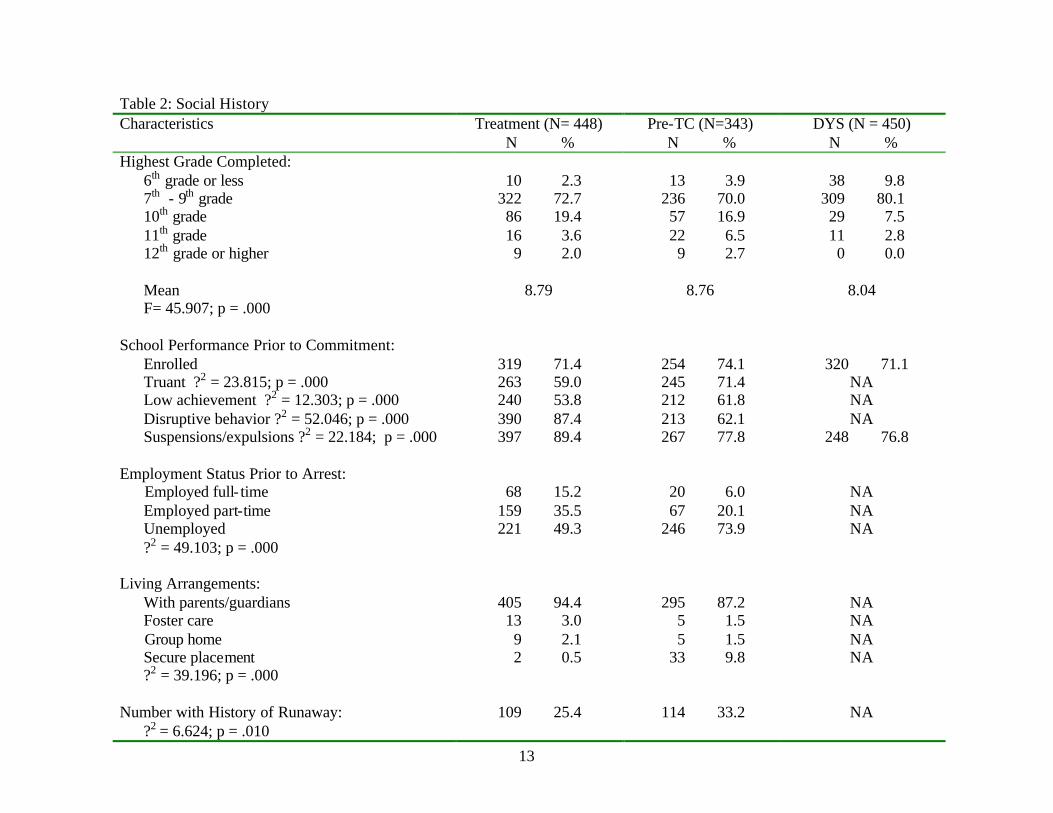
treatment group were more likely to report a history of being suspended or expelled when
compared to the pre-TC and the DYS group (89.4% vs. 77.8% and 76.8%).
The majority of youth in both the treatment group and the pre-TC group were
unemployed prior to being arrested. However, individuals in the treatment group were more
likely to be employed either part-time or full-time prior to arrest (50.7% vs. 26.1%) whereas
individuals in the pre-TC were more likely to be unemployed prior to arrest (73.9% vs.
49.3%). Even though the majority of youth in both the treatment and the pre-TC groups
were living with a parent or guardian, participants in the treatment group were significantly
more likely to be living in a parent’s or guardian’s home (94.4% vs. 87.2%), whereas the
youth from the pre-TC group were more likely to be living in a secure placement prior to
arrest (9.8% vs. 0.5%). Employment and living arrangement data were not available for the
DYS group.
Finally, the majority of youth in the treatment and pre-TC groups did not have a
history of running away. However, the treatment group was significantly less likely to have
a history of running when compared to the pre-TC group.
Current Offense and Criminal History
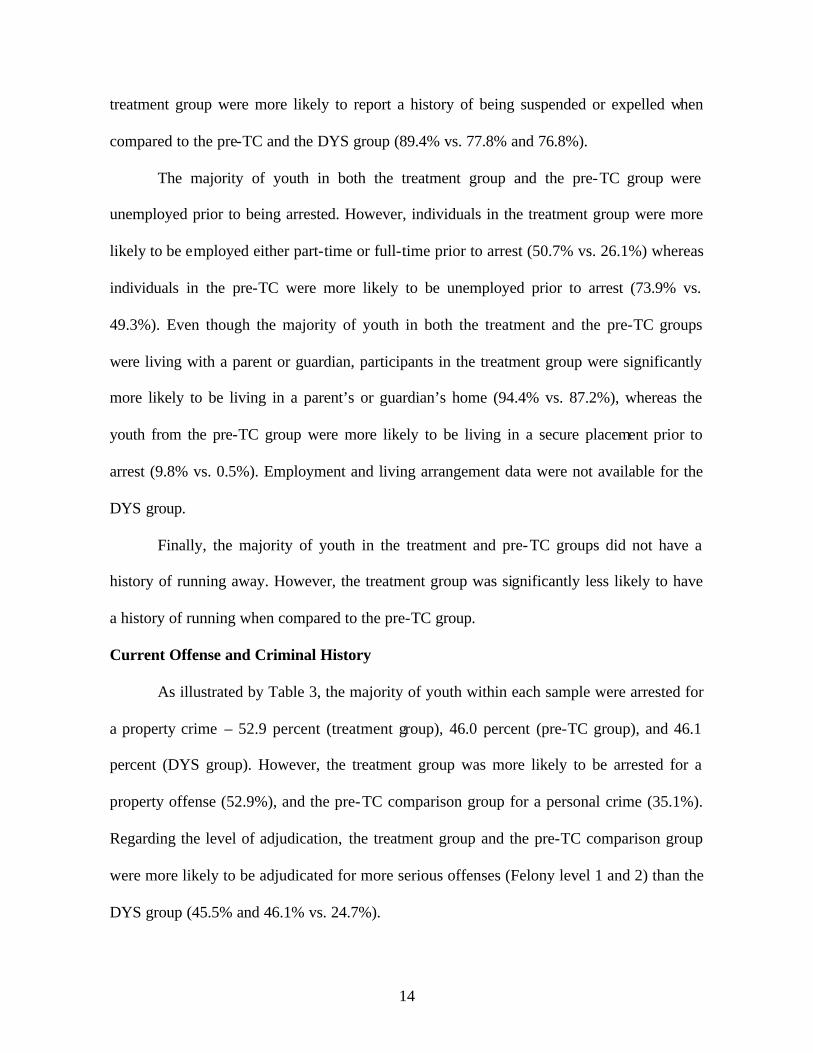
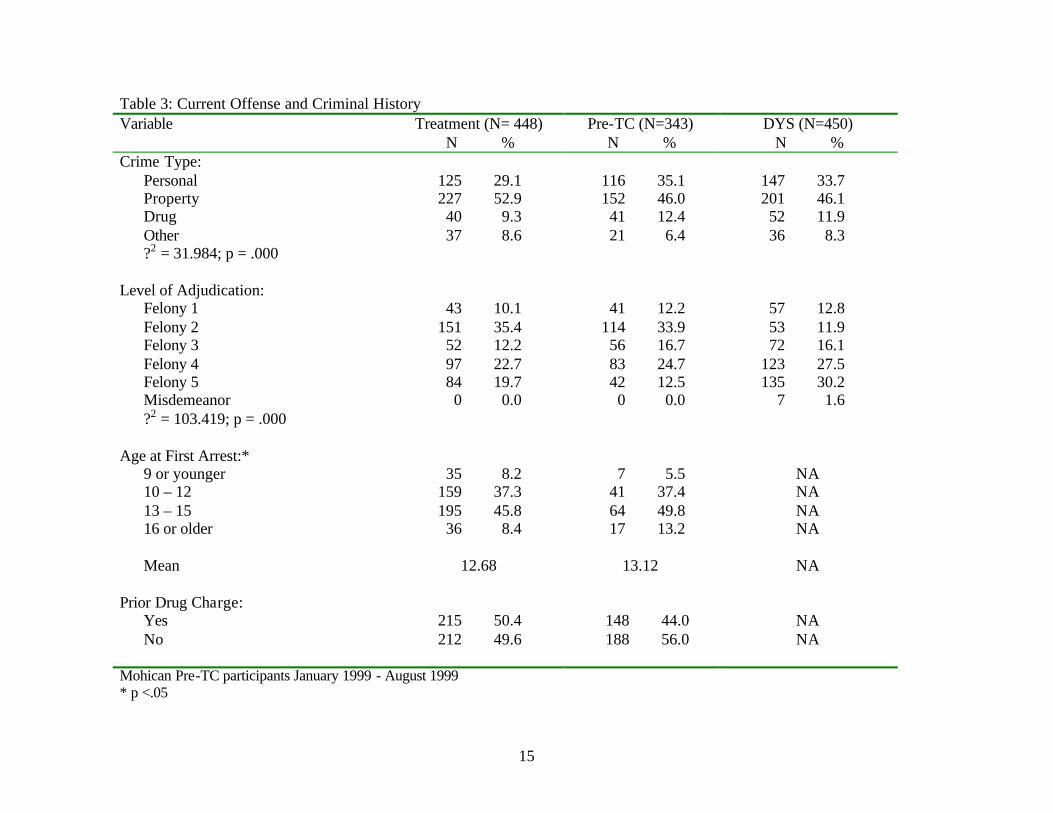
As illustrated by Table 3, the majority of youth within each sample were arrested for
a property crime – 52.9 percent (treatment group), 46.0 percent (pre-TC group), and 46.1
percent (DYS group). However, the treatment group was more likely to be arrested for a
property offense (52.9%), and the pre-TC comparison group for a personal crime (35.1%).
Regarding the level of adjudication, the treatment group and the pre-TC comparison group
were more likely to be adjudicated for more serious offenses (Felony level 1 and 2) than the
DYS group (45.5% and 46.1% vs. 24.7%).
15
Table 3: Current Offense and Criminal History Variable
Treatment (N= 448) N %
Pre-TC (N=343) N %
DYS (N=450) N %
Crime Type: Personal 125 29.1 116 35.1 147 33.7
Property 227 52.9 152 46.0 201 46.1 Drug 40 9.3 41 12.4 52 11.9 Other 37 8.6 21 6.4 36 8.3 ?2 = 31.984; p = .000 Level of Adjudication: Felony 1 43 10.1 41 12.2 57 12.8 Felony 2 151 35.4 114 33.9 53 11.9 Felony 3 52 12.2 56 16.7 72 16.1 Felony 4 97 22.7 83 24.7 123 27.5 Felony 5 84 19.7 42 12.5 135 30.2 Misdemeanor 0 0.0 0 0.0 7 1.6 ?2 = 103.419; p = .000 Age at First Arrest:* 9 or younger 35 8.2 7 5.5 NA 10 – 12 159 37.3 41 37.4 NA 13 – 15 195 45.8 64 49.8 NA 16 or older 36 8.4 17 13.2 NA Mean 12.68 13.12 NA Prior Drug Charge: Yes 215 50.4 148 44.0 NA No 212 49.6 188 56.0 NA Mohican Pre-TC participants January 1999 - August 1999 * p <.05
16
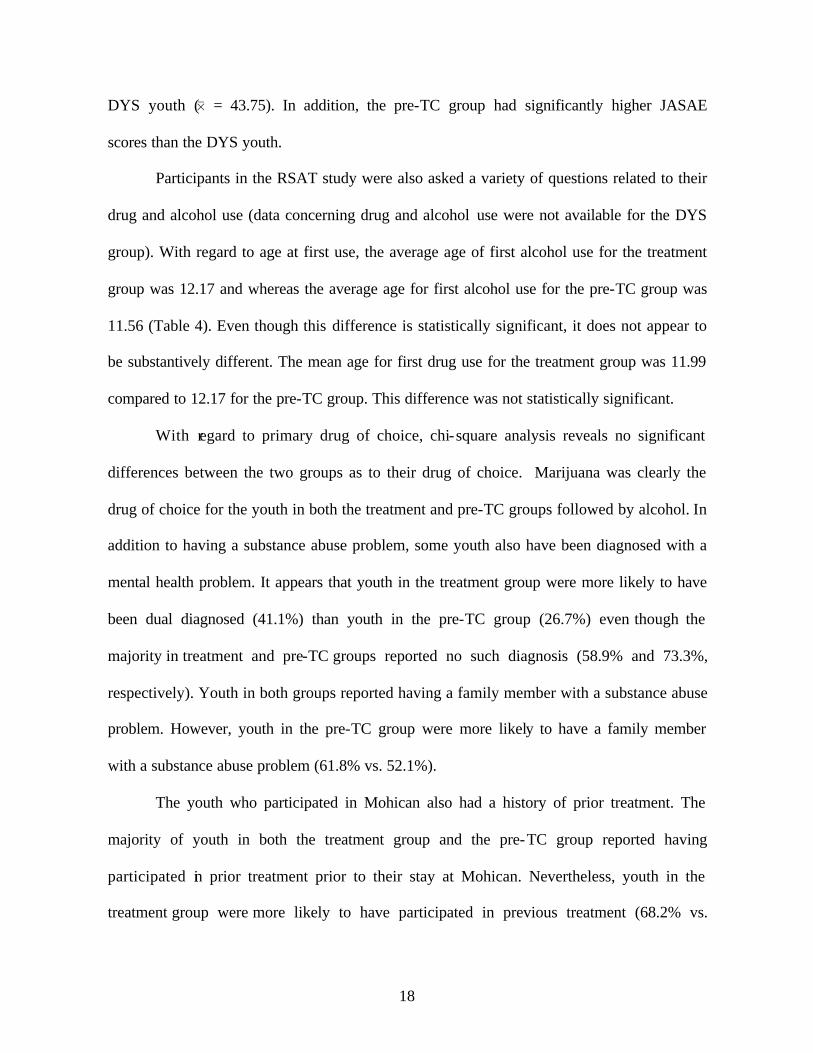
Additionally, the majority of the youth in both the treatment group and the pre-TC
comparison group had their first arrest before the age of fifteen. The pre-TC group was older
than the treatment group at the time of their first arrest (p < .05). Concerning prior drug
charges, a slight majority of the treatment group had a prior drug charge while the majority
of the pre-TC group did not have a prior drug charge. These differences were not
statistically significant (data for age of first arrest and prior drug charge were not available
for the DYS comparison group.)
Drug & Alcohol History
Youth entering the Department of Youth Services are assessed using the Juvenile
Automated Substance Abuse Evaluation (JASAE) (ADE Incorporated, 1997). The JASAE
provides a summary score indicating the level of care required. As the summary score
increases, the need for more intensive intervention increases. A score of 21 or above
indicated the need for intensive treatment and possibly residential care because youth at this
level “indicate a severe substance abuse problem along with ingrained patterns and attitudes
supporting this problem.” (ADE Incorporated, 1997, p.6). Thus, Mohican’s target
population was youth with a JASAE score of 21 or above. Scores were available for 437
youth in the treatment group, 197 youth in the pre-TC group, and 341 youth in the DYS
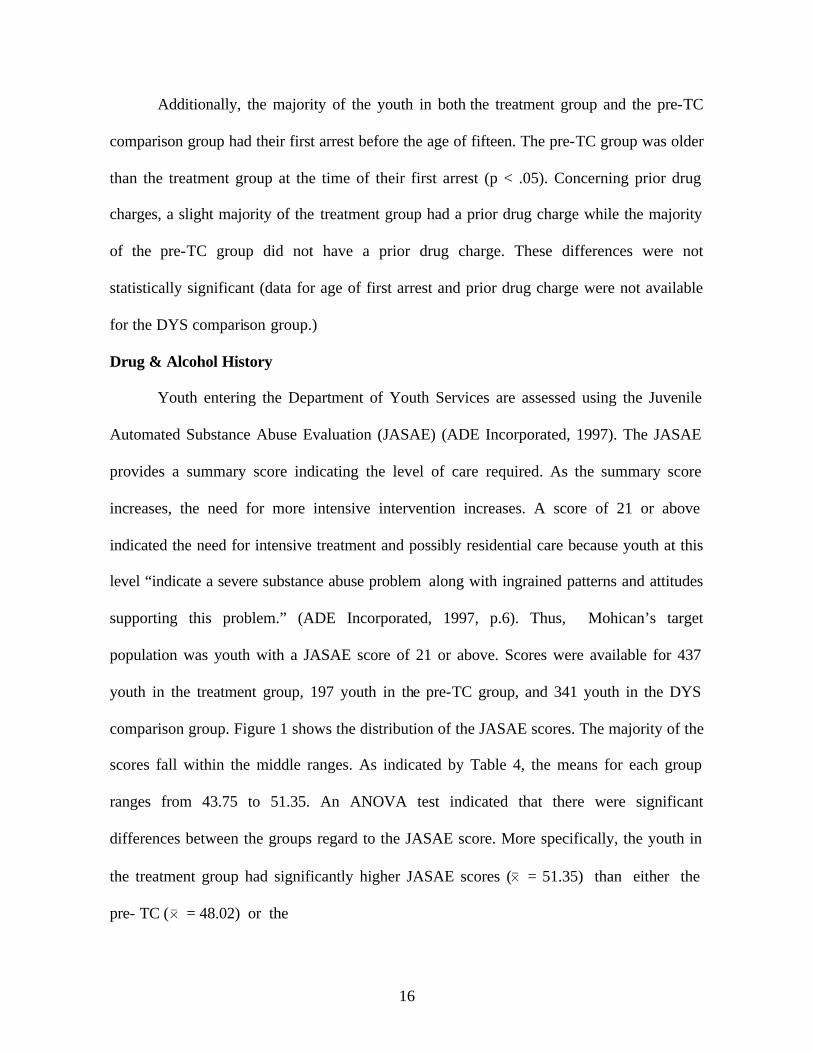
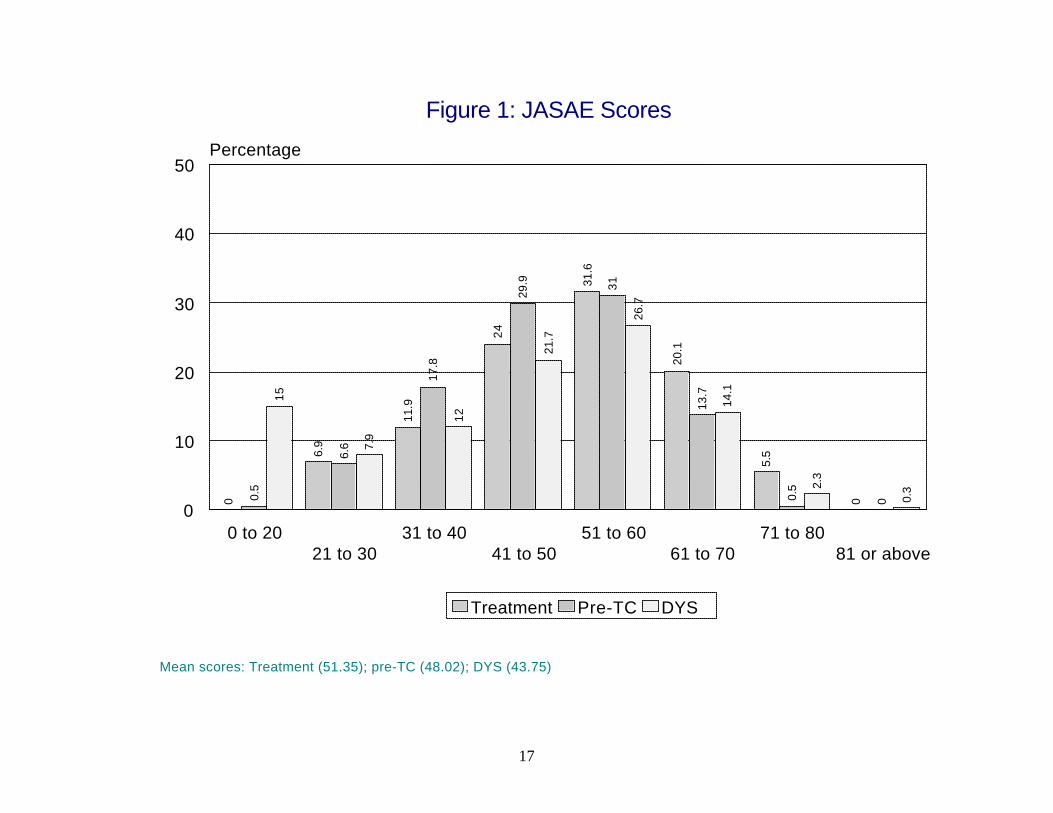
comparison group. Figure 1 shows the distribution of the JASAE scores. The majority of the
scores fall within the middle ranges. As indicated by Table 4, the means for each group
ranges from 43.75 to 51.35. An ANOVA test indicated that there were significant
differences between the groups regard to the JASAE score. More specifically, the youth in
the treatment group had significantly higher JASAE scores (0 = 51.35) than either the
pre- TC (0 = 48.02) or the
17
Figure 1: JASAE Scores
Mean scores: Treatment (51.35); pre-TC (48.02); DYS (43.75)
0
6.9
11.9
24
31.6
20.1
5.5
00.5
6.6
17.8
29.9 31
13.7
0.5
0
15
7.9
12
21.7
26.7
14.1
2.3
0.3
0 to 2021 to 30
31 to 4041 to 50
51 to 6061 to 70
71 to 8081 or above
0
10
20
30
40
50Percentage
Treatment Pre-TC DYS
18
DYS youth (0 = 43.75). In addition, the pre-TC group had significantly higher JASAE
scores than the DYS youth.
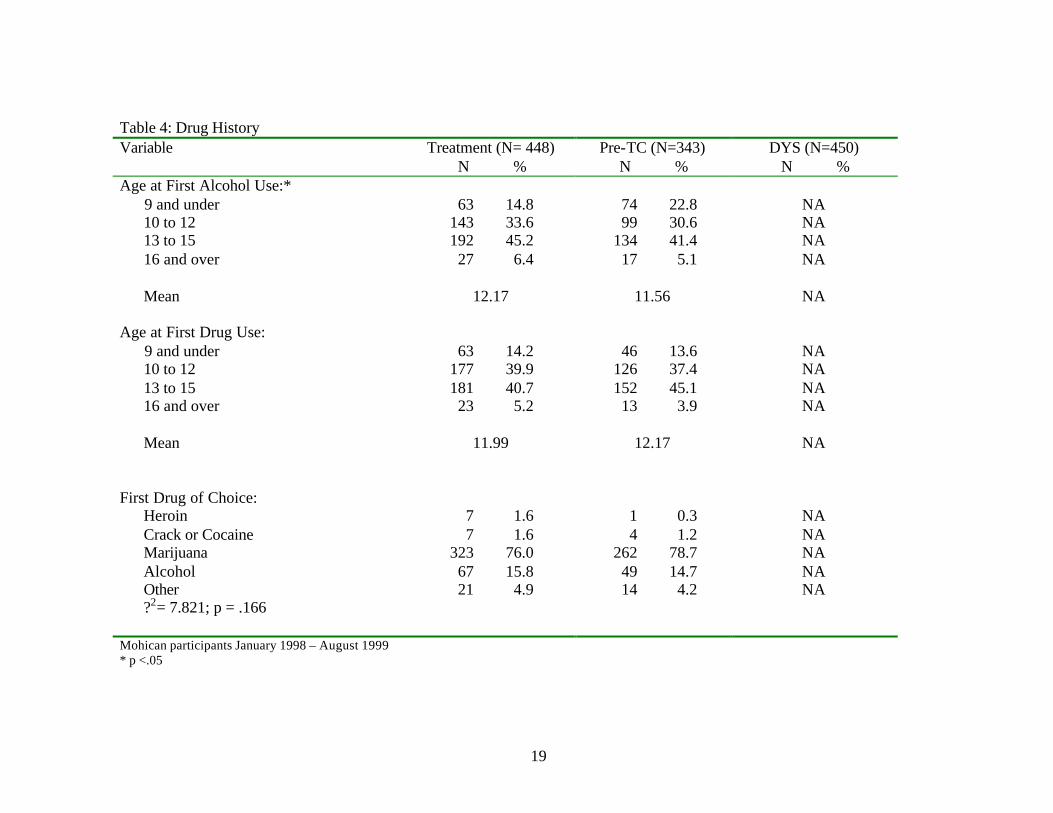
Participants in the RSAT study were also asked a variety of questions related to their
drug and alcohol use (data concerning drug and alcohol use were not available for the DYS
group). With regard to age at first use, the average age of first alcohol use for the treatment
group was 12.17 and whereas the average age for first alcohol use for the pre-TC group was
11.56 (Table 4). Even though this difference is statistically significant, it does not appear to
be substantively different. The mean age for first drug use for the treatment group was 11.99
compared to 12.17 for the pre-TC group. This difference was not statistically significant.
With regard to primary drug of choice, chi-square analysis reveals no significant
differences between the two groups as to their drug of choice. Marijuana was clearly the
drug of choice for the youth in both the treatment and pre-TC groups followed by alcohol. In
addition to having a substance abuse problem, some youth also have been diagnosed with a
mental health problem. It appears that youth in the treatment group were more likely to have
been dual diagnosed (41.1%) than youth in the pre-TC group (26.7%) even though the
majority in treatment and pre-TC groups reported no such diagnosis (58.9% and 73.3%,
respectively). Youth in both groups reported having a family member with a substance abuse
problem. However, youth in the pre-TC group were more likely to have a family member
with a substance abuse problem (61.8% vs. 52.1%).
The youth who participated in Mohican also had a history of prior treatment. The
majority of youth in both the treatment group and the pre-TC group reported having
participated in prior treatment prior to their stay at Mohican. Nevertheless, youth in the
treatment group were more likely to have participated in previous treatment (68.2% vs.
19
Table 4: Drug History Variable
Treatment (N= 448) N %
Pre-TC (N=343) N %
DYS (N=450) N %
Age at First Alcohol Use:* 9 and under 63 14.8 74 22.8 NA 10 to 12 143 33.6 99 30.6 NA 13 to 15 192 45.2 134 41.4 NA 16 and over 27 6.4 17 5.1 NA Mean 12.17 11.56 NA Age at First Drug Use: 9 and under 63 14.2 46 13.6 NA 10 to 12 177 39.9 126 37.4 NA 13 to 15 181 40.7 152 45.1 NA 16 and over 23 5.2 13 3.9 NA Mean 11.99 12.17 NA First Drug of Choice: Heroin 7 1.6 1 0.3 NA Crack or Cocaine 7 1.6 4 1.2 NA Marijuana 323 76.0 262 78.7 NA Alcohol 67 15.8 49 14.7 NA Other 21 4.9 14 4.2 NA ?2= 7.821; p = .166 Mohican participants January 1998 – August 1999 * p <.05
20
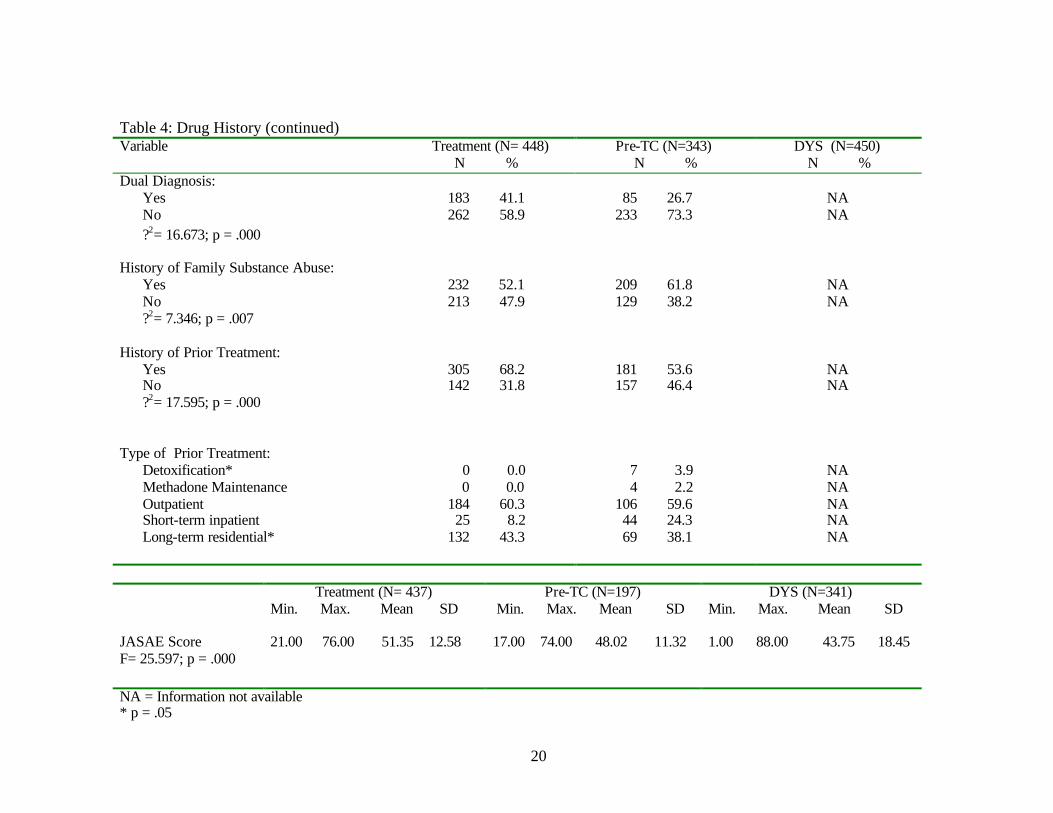
Table 4: Drug History (continued) Variable
Treatment (N= 448) N %
Pre-TC (N=343) N %
DYS (N=450) N %
Dual Diagnosis: Yes 183 41.1 85 26.7 NA No 262 58.9 233 73.3 NA ?2= 16.673; p = .000 History of Family Substance Abuse: Yes 232 52.1 209 61.8 NA No 213 47.9 129 38.2 NA ?2= 7.346; p = .007 History of Prior Treatment: Yes 305 68.2 181 53.6 NA No 142 31.8 157 46.4 NA ?2= 17.595; p = .000 Type of Prior Treatment: Detoxification* 0 0.0 7 3.9 NA Methadone Maintenance 0 0.0 4 2.2 NA Outpatient 184 60.3 106 59.6 NA Short-term inpatient 25 8.2 44 24.3 NA Long-term residential* 132 43.3 69 38.1 NA Treatment (N= 437)
Min. Max. Mean SD Pre-TC (N=197)
Min. Max. Mean SD DYS (N=341)
Min. Max. Mean SD JASAE Score 21.00 76.00 51.35 12.58 17.00 74.00 48.02 11.32 1.00 88.00 43.75 18.45 F= 25.597; p = .000 NA = Information not available * p = .05
21
53.6%). When examining what types of treatment the youth have participated in, it is clear
that the majority in both groups have participated in outpatient treatment followed by long-
term (more than 30 days) residential treatment. Based on t-tests, the only significant
differences between the groups were found in the number of times the youth went to detox
and long-term residential treatment. More youth in the pre-TC participated in detox treatment
(3.9% vs. 0%) whereas more youth in the treatment group participated in long-term
residential treatment (43.3% vs. 38.1%).
Risk Level
Upon admission to the Department of Youth Services, a youth’s risk level is assessed
with the Youthful Level of Service Inventory (YO-LSI). The YO-LSI is an objective and
quantifiable assessment instrument that examines both static and dynamic risk factors that are
associated with recidivism. These factors include: criminal history, family circumstance,
employment/education achievements, peer relationships, substance abuse, leisure/recreation,
personality characteristics, and antisocial attitudes. Depending on their scores, youth are
classified as “low”, “moderate”, or “high” risk for each of the subcomponents. A total score
is also provided that indicates the overall level of risk of recidivism.
YO-LSI data were available for all three groups. However, due to the implementation
of the instrument by the Department of Youth Services in 1998, there were only 72 cases for
the pre-TC group. Data were available for 425 youth in the treatment group and 450 youth in
DYS comparison group. Total YO-LSI scores of 35-42 are considered very high for
recidivism; scores of 23-34 are considered high risk for recidivism; scores of 9-22 are
considered moderate risk of recidivism; and scores of 0-8 are considered low risk of
22
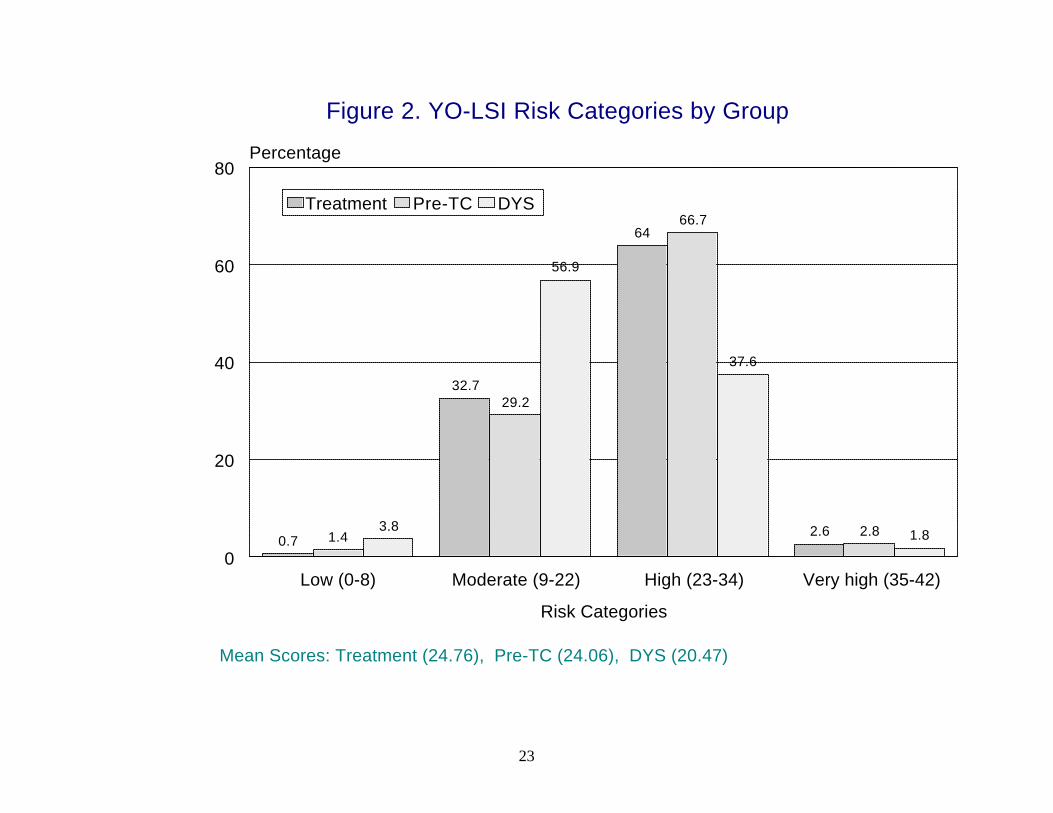
recidivism. When examining the overall score, the majority of the youth in all groups scored
as either “moderate” or “high” risk for recidivism (Figure 2).
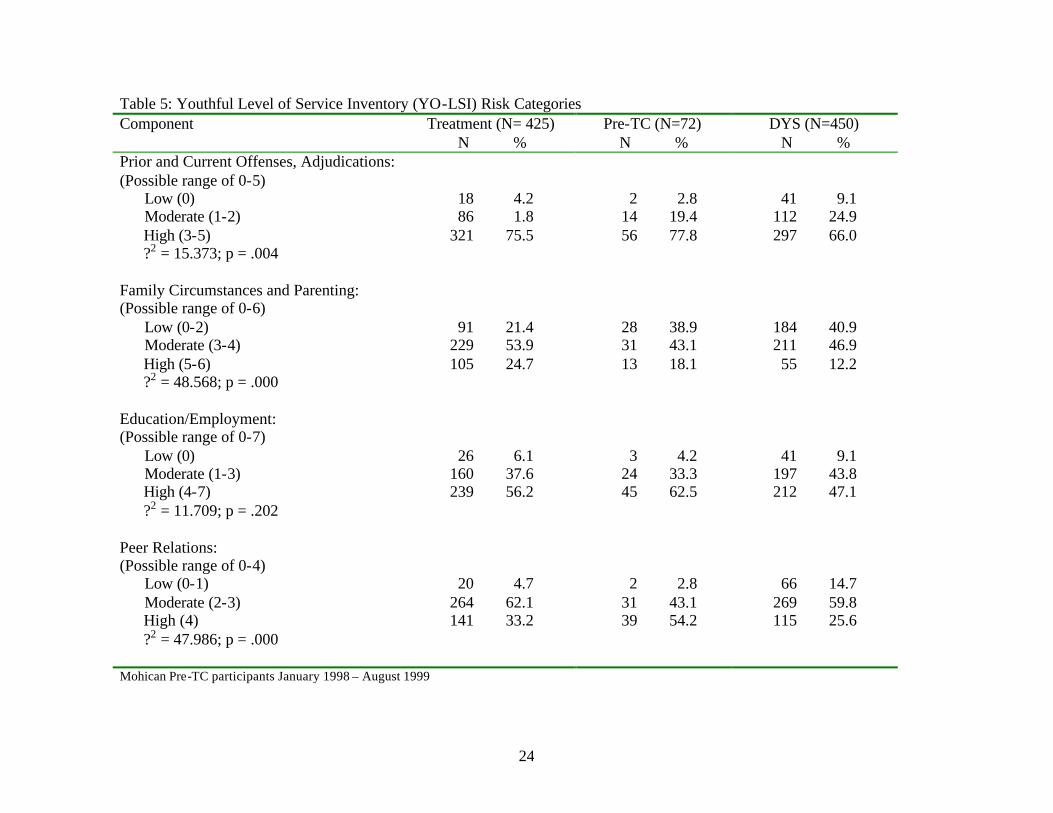
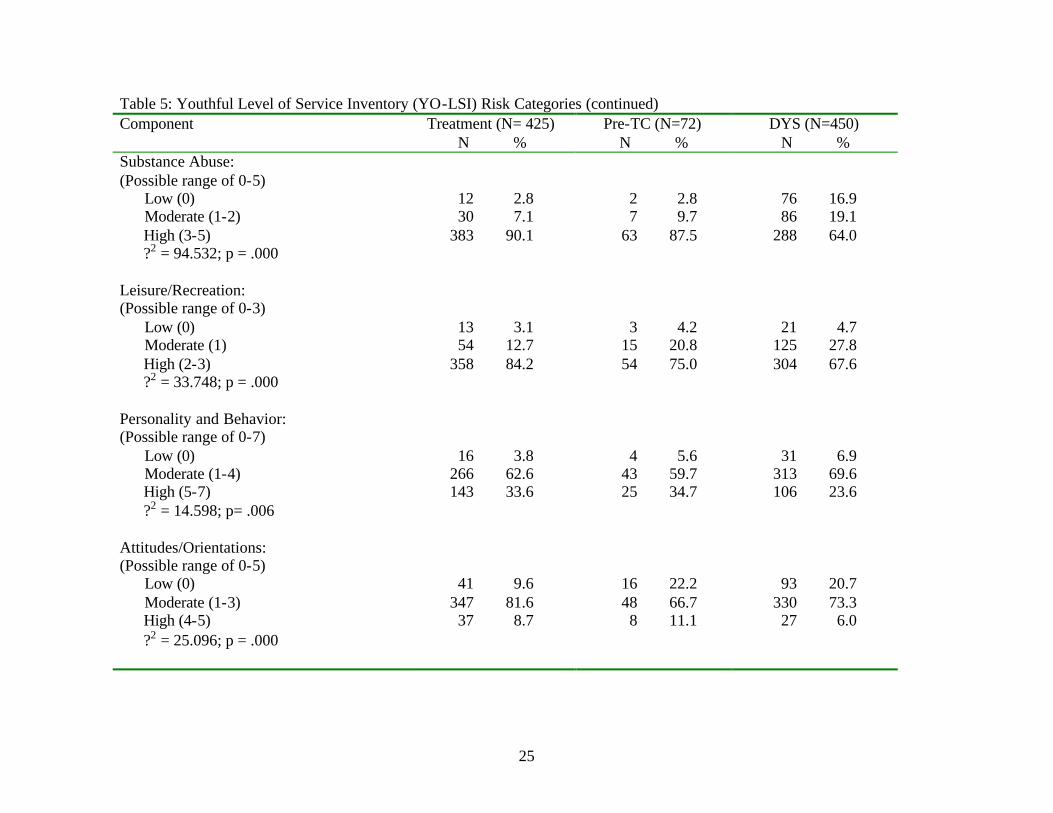
Youth in all three groups scored as “high risk” in prior and current offenses,
education/employment, substance abuse, leisure and recreation, and “moderate risk” in
family circumstance, peer relations, personality and behavior, and attitudes and orientations
(Table 5). Table 5 also indicates the differences between the groups based on chi-square
analyses of the YO-LSI categories. As evident by the chi-square values, all categories
experienced significant differences between the groups; however, the differences between the
groups were not the same for each category. For example, the treatment group was more
likely to score as “high” risk in the following categories: offense, family, substance abuse,
leisure, personality, and attitudes, whereas the DYS comparison group was more likely to
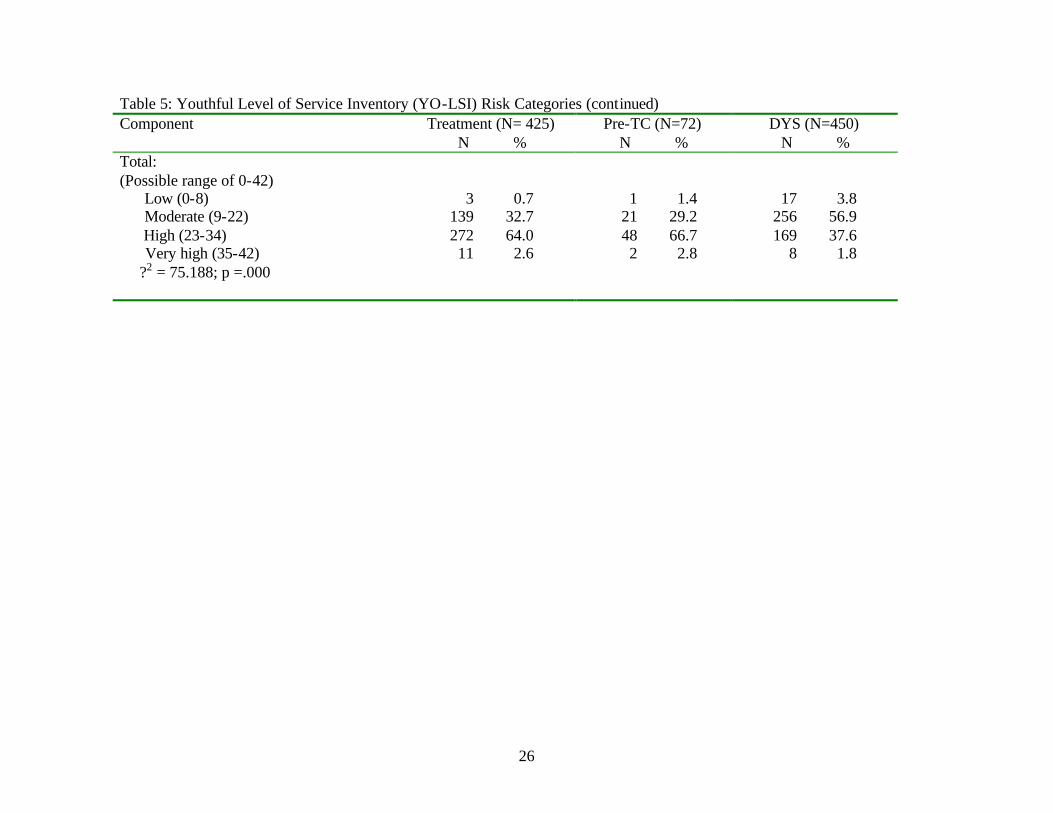
score as “high” risk in the education and peers categories. Concerning the overall risk score,
youth in the pre-TC group were more likely to score as “low” to “moderate” risk whereas
youth in the DYS comparison group were more likely to score in the “high” to “very high”
category.
An analysis of variance test was conducted to compare the means of the groups. The
treatment group had the highest mean (0= 24.76), followed by the pre-TC group (0= 24.06)
and the DYS group (0= 20.47). There were no difference between the risk level for the
treatment group and the pre-TC group. However, the treatment group and the pre-TC group
had a statistically higher YO-LSI risk score than the DYS group (see Table B1 in Appendix
B for details).
23
Figure 2. YO-LSI Risk Categories by Group
Mean Scores: Treatment (24.76), Pre-TC (24.06), DYS (20.47)
0.7
32.7
64
2.61.4
29.2
66.7
2.83.8
56.9
37.6
1.8
Low (0-8) Moderate (9-22) High (23-34) Very high (35-42)
Risk Categories
0
20
40
60
80Percentage
Treatment Pre-TC DYS
24
Table 5: Youthful Level of Service Inventory (YO-LSI) Risk Categories Component
Treatment (N= 425) N %
Pre-TC (N=72) N %
DYS (N=450) N %
Prior and Current Offenses, Adjudications: (Possible range of 0-5) Low (0) 18 4.2 2 2.8 41 9.1 Moderate (1-2) 86 1.8 14 19.4 112 24.9 High (3-5) 321 75.5 56 77.8 297 66.0 ?2 = 15.373; p = .004 Family Circumstances and Parenting: (Possible range of 0-6) Low (0-2) 91 21.4 28 38.9 184 40.9 Moderate (3-4) 229 53.9 31 43.1 211 46.9 High (5-6) 105 24.7 13 18.1 55 12.2 ?2 = 48.568; p = .000 Education/Employment: (Possible range of 0-7) Low (0) 26 6.1 3 4.2 41 9.1 Moderate (1-3) 160 37.6 24 33.3 197 43.8 High (4-7) 239 56.2 45 62.5 212 47.1 ?2 = 11.709; p = .202 Peer Relations: (Possible range of 0-4) Low (0-1) 20 4.7 2 2.8 66 14.7 Moderate (2-3) 264 62.1 31 43.1 269 59.8 High (4) 141 33.2 39 54.2 115 25.6 ?2 = 47.986; p = .000 Mohican Pre-TC participants January 1998 – August 1999
25
Table 5: Youthful Level of Service Inventory (YO-LSI) Risk Categories (continued) Component
Treatment (N= 425) N %
Pre-TC (N=72) N %
DYS (N=450) N %
Substance Abuse: (Possible range of 0-5) Low (0) 12 2.8 2 2.8 76 16.9 Moderate (1-2) 30 7.1 7 9.7 86 19.1 High (3-5) 383 90.1 63 87.5 288 64.0 ?2 = 94.532; p = .000 Leisure/Recreation: (Possible range of 0-3) Low (0) 13 3.1 3 4.2 21 4.7 Moderate (1) 54 12.7 15 20.8 125 27.8 High (2-3) 358 84.2 54 75.0 304 67.6 ?2 = 33.748; p = .000 Personality and Behavior: (Possible range of 0-7) Low (0) 16 3.8 4 5.6 31 6.9 Moderate (1-4) 266 62.6 43 59.7 313 69.6 High (5-7) 143 33.6 25 34.7 106 23.6 ?2 = 14.598; p= .006 Attitudes/Orientations: (Possible range of 0-5) Low (0) 41 9.6 16 22.2 93 20.7 Moderate (1-3) 347 81.6 48 66.7 330 73.3 High (4-5) 37 8.7 8 11.1 27 6.0 ?2 = 25.096; p = .000
26
Table 5: Youthful Level of Service Inventory (YO-LSI) Risk Categories (continued) Component
Treatment (N= 425) N %
Pre-TC (N=72) N %
DYS (N=450) N %
Total: (Possible range of 0-42) Low (0-8) 3 0.7 1 1.4 17 3.8 Moderate (9-22) 139 32.7 21 29.2 256 56.9 High (23-34) 272 64.0 48 66.7 169 37.6 Very high (35-42) 11 2.6 2 2.8 8 1.8 ?2 = 75.188; p =.000
27
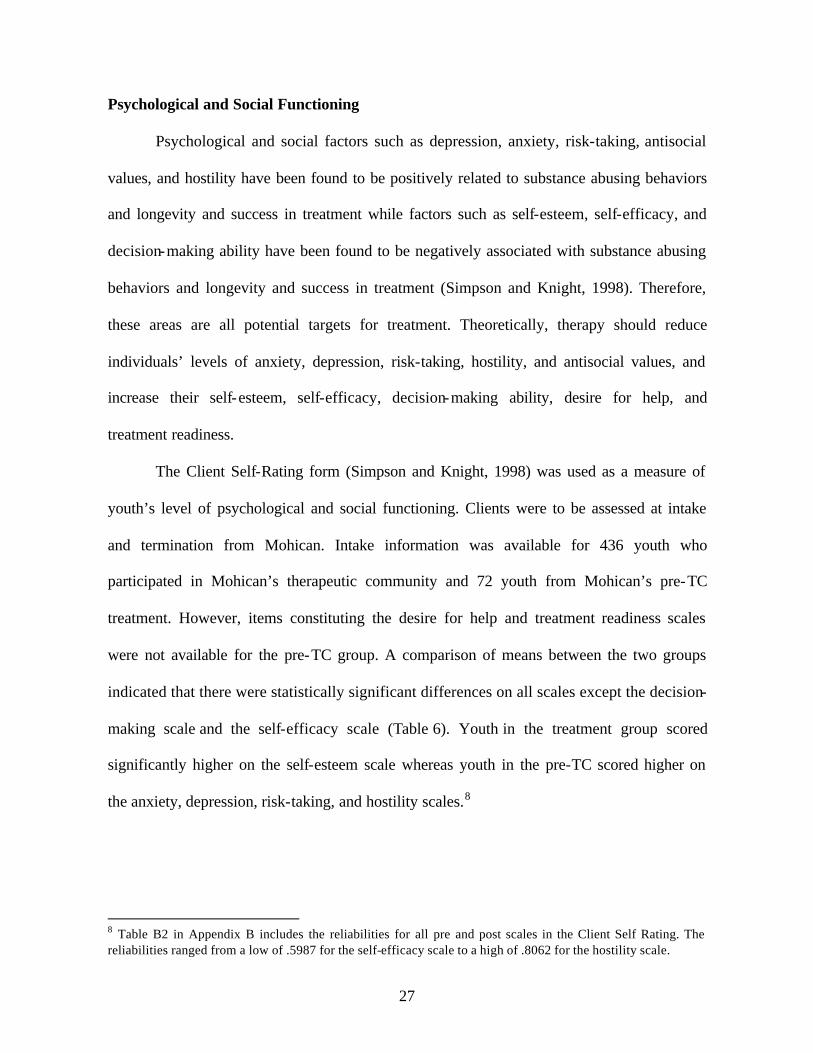
Psychological and Social Functioning
Psychological and social factors such as depression, anxiety, risk-taking, antisocial
values, and hostility have been found to be positively related to substance abusing behaviors
and longevity and success in treatment while factors such as self-esteem, self-efficacy, and
decision-making ability have been found to be negatively associated with substance abusing
behaviors and longevity and success in treatment (Simpson and Knight, 1998). Therefore,
these areas are all potential targets for treatment. Theoretically, therapy should reduce
individuals’ levels of anxiety, depression, risk-taking, hostility, and antisocial values, and
increase their self-esteem, self-efficacy, decision-making ability, desire for help, and
treatment readiness.
The Client Self-Rating form (Simpson and Knight, 1998) was used as a measure of
youth’s level of psychological and social functioning. Clients were to be assessed at intake
and termination from Mohican. Intake information was available for 436 youth who
participated in Mohican’s therapeutic community and 72 youth from Mohican’s pre-TC
treatment. However, items constituting the desire for help and treatment readiness scales
were not available for the pre-TC group. A comparison of means between the two groups
indicated that there were statistically significant differences on all scales except the decision-
making scale and the self-efficacy scale (Table 6). Youth in the treatment group scored
significantly higher on the self-esteem scale whereas youth in the pre-TC scored higher on
the anxiety, depression, risk-taking, and hostility scales.8
8 Table B2 in Appendix B includes the reliabilities for all pre and post scales in the Client Self Rating. The reliabilities ranged from a low of .5987 for the self-efficacy scale to a high of .8062 for the hostility scale.
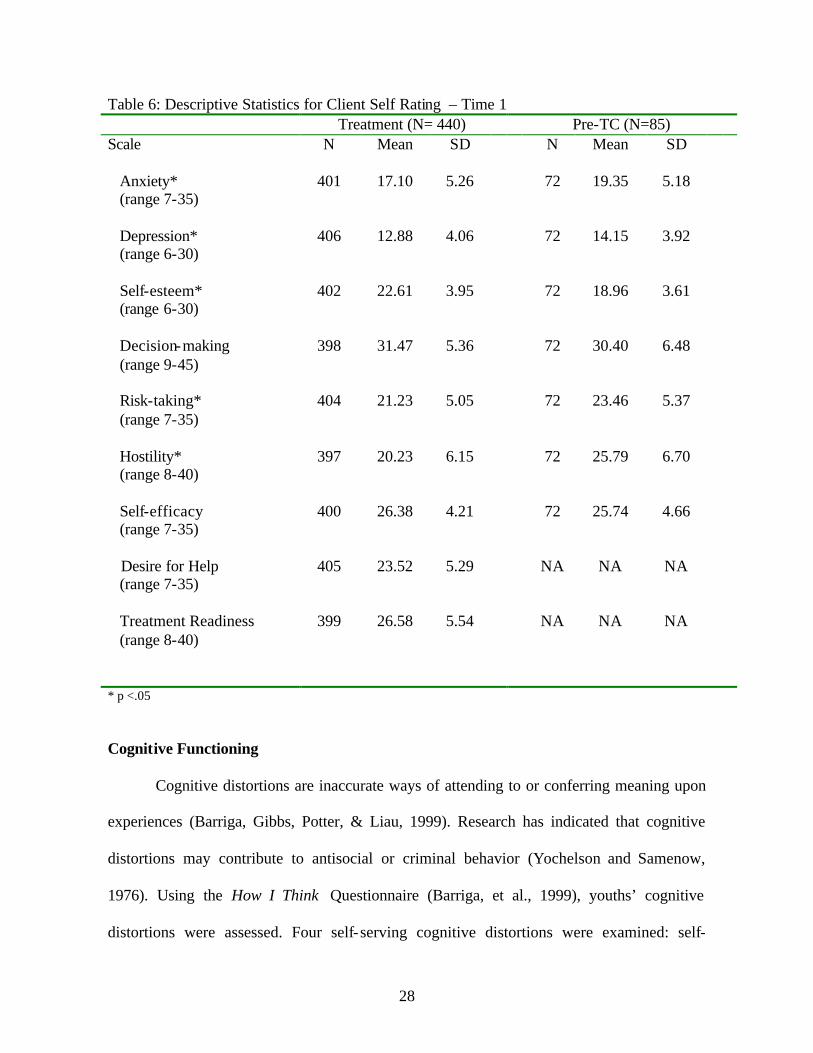
28
Table 6: Descriptive Statistics for Client Self Rating – Time 1 Treatment (N= 440) Pre-TC (N=85) Scale N Mean SD N Mean SD Anxiety* (range 7-35)
401 17.10 5.26 72 19.35 5.18
Depression* (range 6-30)
406 12.88 4.06 72 14.15 3.92
Self-esteem* (range 6-30)
402 22.61 3.95 72 18.96 3.61
Decision-making (range 9-45)
398 31.47 5.36 72 30.40 6.48
Risk-taking* (range 7-35)
404 21.23 5.05 72 23.46 5.37
Hostility* (range 8-40)
397 20.23 6.15 72 25.79 6.70
Self-efficacy (range 7-35)
400 26.38 4.21 72 25.74 4.66
Desire for Help (range 7-35)
405 23.52 5.29 NA NA NA
Treatment Readiness (range 8-40)
399 26.58 5.54 NA NA NA
* p <.05 Cognitive Functioning
Cognitive distortions are inaccurate ways of attending to or conferring meaning upon
experiences (Barriga, Gibbs, Potter, & Liau, 1999). Research has indicated that cognitive
distortions may contribute to antisocial or criminal behavior (Yochelson and Samenow,
1976). Using the How I Think Questionnaire (Barriga, et al., 1999), youths’ cognitive
distortions were assessed. Four self-serving cognitive distortions were examined: self-
29
centered (according such status to one’s own views that the opinions of others are not
considered), blaming others (misattributing blame to outside sources),
minimizing/mislabeling (believing that antisocial behavior is acceptable, admirable, or causes
no real harm), and assuming the worst (assuming that improvement is impossible, or
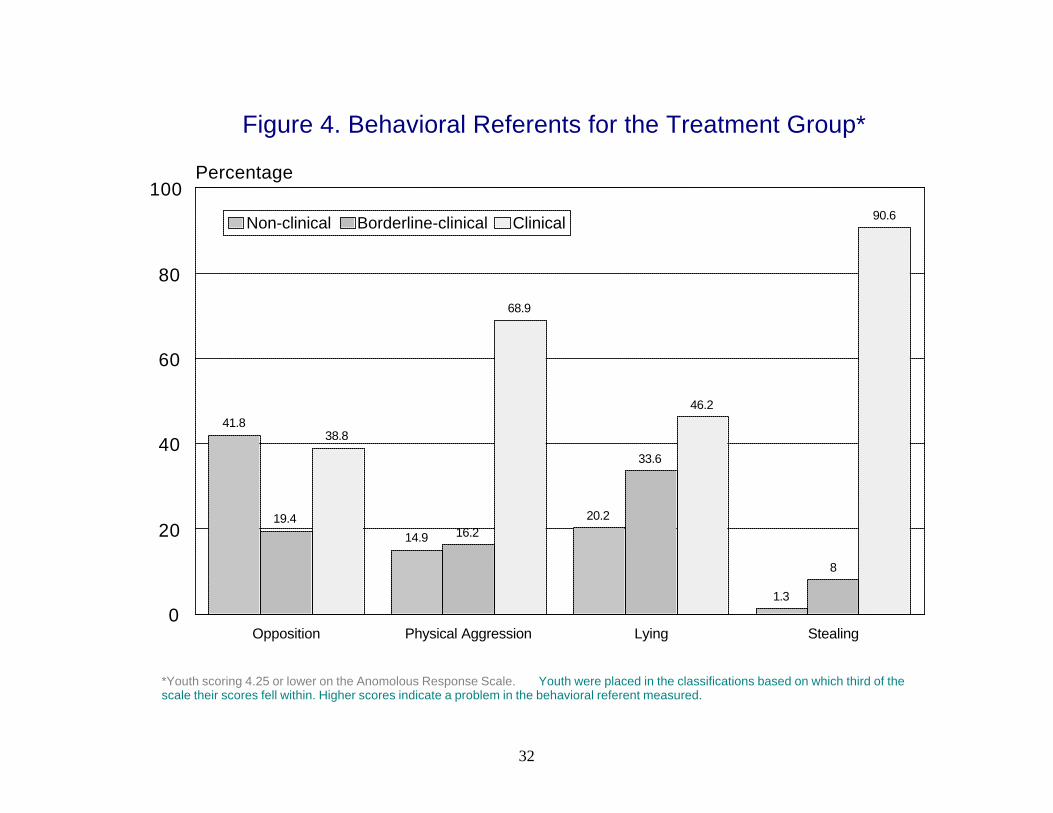
considering a worst case scenario). The How I Think Questionnaire also depicts four
behavioral referents scales that are manifested from the cognitive distortions:
opposition/defiance, physical aggression, lying, and stealing. From these subscales, three
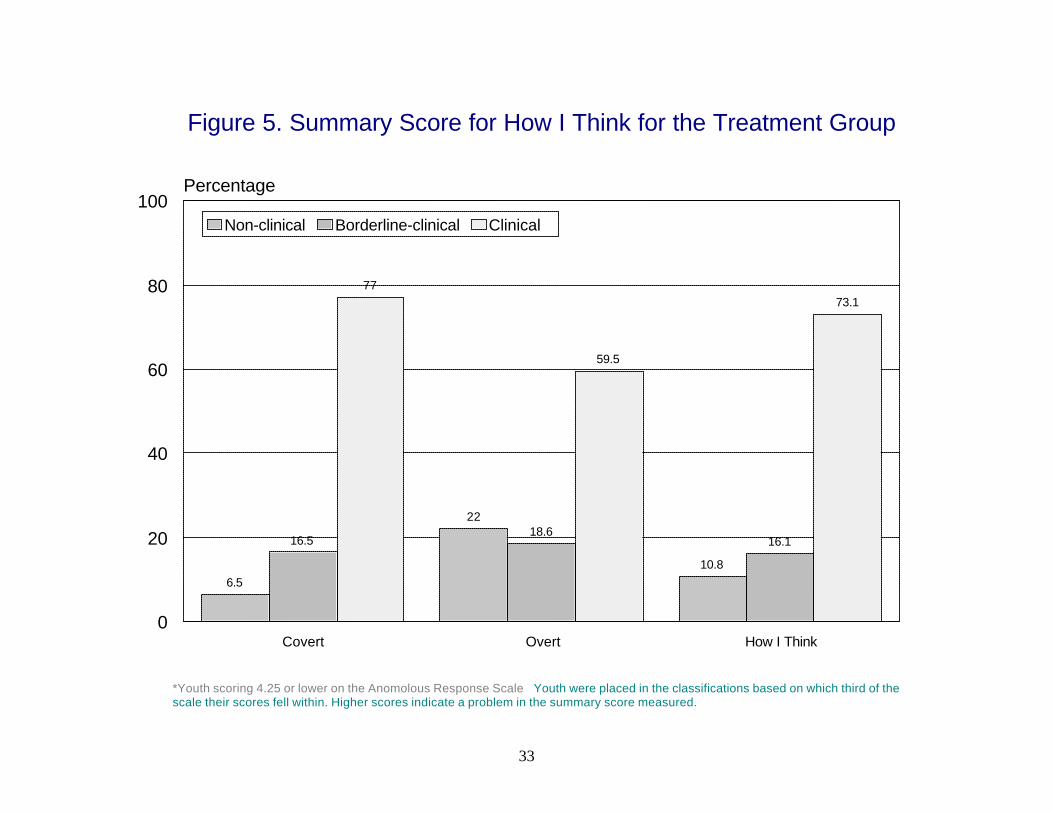
summary scores can be computed. The overt scale is computed by averaging the
opposition/defiance and physical aggression means. The covert scale is computed by
averaging the lying and stealing means. The overall How I Think score is computed by
averaging the means of all eight subscales. Higher scores indicate higher levels of cognitive
distortions.9
The How I Think Questionnaire was administered at intake and termination for the
treatment group only. Data from the How I Think Questionnaire were available for 434
youth in the treatment group. The questionnaire has an anomalous responding scale that
determines the truthfulness of the answers. Scores higher than 4.25 are considered invalid
and should not be used in data analyses. Scores greater than 4.0 but less than or equal to 4.25
are considered “suspect” and interpreted with caution. Thus, intake data were available for
301 cases of which 79 cases were considered “suspect.”
One way to analyze the scales of the How I Think Questionnaire is to determine
which of the three ranges (non-clinical, borderline-clinical, clinical) the score falls into. The
ranges on the eight subscales can be used to provide a fine-grained analysis of the youth. As
9 Table B3 in Appendix B includes the reliabilities for all pre and post scales for the How I Think Questionnaire. The reliabilities ranged from a low of .5784 for the lying scale to a high of .9563 for the How I Think overall scale.
30
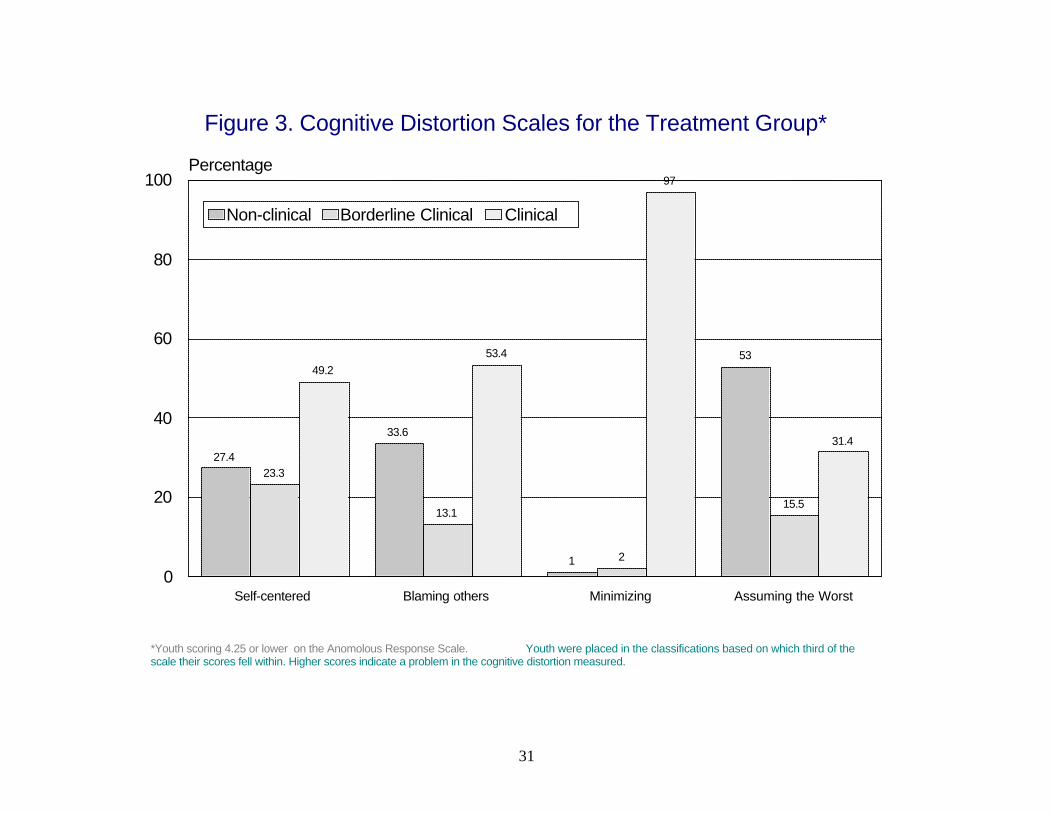
Figure 3 reveals, the majority of youth fell into the “clinical” range on the self-centered,
blaming others, and minimizing/mislabeling scales, whereas the majority of youth fell into
the “non-clinical” range on the assuming the worst scale. Thus, these youth can be described
as having a strong egocentric bias and a need for treatment that addresses their
externalization and minimizing the consequences of their actions. Figure 4 shows the
behavioral referent scales. The majority of youth fell into the “clinical” range for the physical
aggression, lying, and stealing behavioral referents, whereas the majority of youth scored in
the “non-clinical” range for the oppositional defiance scale.
Concerning the summary scores for the covert, overt and overall How I Think, the
majority of youth fell into the “clinical” range (Figure 5). According to Barriga et al. (1999),
youth falling into the borderline-clinical and clinical range for the How I Think scale may
exhibit externalizing psychopathology. Youth in the “borderline clinical” and “clinical”
ranges in the overt scale may exhibit antisocial behavior that typically involves
confrontation with the victims, whereas these ranges for the covert scale indicate non-
confrontational antisocial behavior (see Table B4 in Appendix B).
Treatment Considerations
Outcome evaluations are enhanced when the researcher is able to determine what
happened to the client while under supervision. This may include documenting whether a
participant moved to different phases based on progress and the outcome of treatment. The
purpose of this section is to identify the general services provided by Mohican and the rates
of phase advancement. In addition, this section will address behavior while in the RSAT
program. In-program behavior, as measured by violations and drug testing, can have a
significant impact on behavioral change. The specific research questions addressed where:
31
Figure 3. Cognitive Distortion Scales for the Treatment Group*
*Youth scoring 4.25 or lower on the Anomolous Response Scale. Youth were placed in the classifications based on which third of the scale their scores fell within. Higher scores indicate a problem in the cognitive distortion measured.
27.4
33.6
1
53
23.3
13.1
2
15.5
49.253.4
97
31.4
Self-centered Blaming others Minimizing Assuming the Worst0
20
40
60
80
100Percentage
Non-clinical Borderline Clinical Clinical
32
Figure 4. Behavioral Referents for the Treatment Group*
*Youth scoring 4.25 or lower on the Anomolous Response Scale. Youth were placed in the classifications based on which third of the scale their scores fell within. Higher scores indicate a problem in the behavioral referent measured.
41.8
14.9
20.2
1.3
19.416.2
33.6
8
38.8
68.9
46.2
90.6
Opposition Physical Aggression Lying Stealing0
20
40
60
80
100Percentage
Non-clinical Borderline-clinical Clinical
33
Figure 5. Summary Score for How I Think for the Treatment Group
*Youth scoring 4.25 or lower on the Anomolous Response Scale Youth were placed in the classifications based on which third of the scale their scores fell within. Higher scores indicate a problem in the summary score measured.
6.5
22
10.8
16.518.6
16.1
77
59.5
73.1
Covert Overt How I Think0
20
40
60
80
100Percentage
Non-clinical Borderline-clinical Clinical
34
• What were the specific groups that youth participated in while at Mohican?
• What were the rates of phase advancements?
• What were the rates of individual counseling?
• How many youth tested positive for drugs while in the program?
• How many program violations did youth experience while in the program?
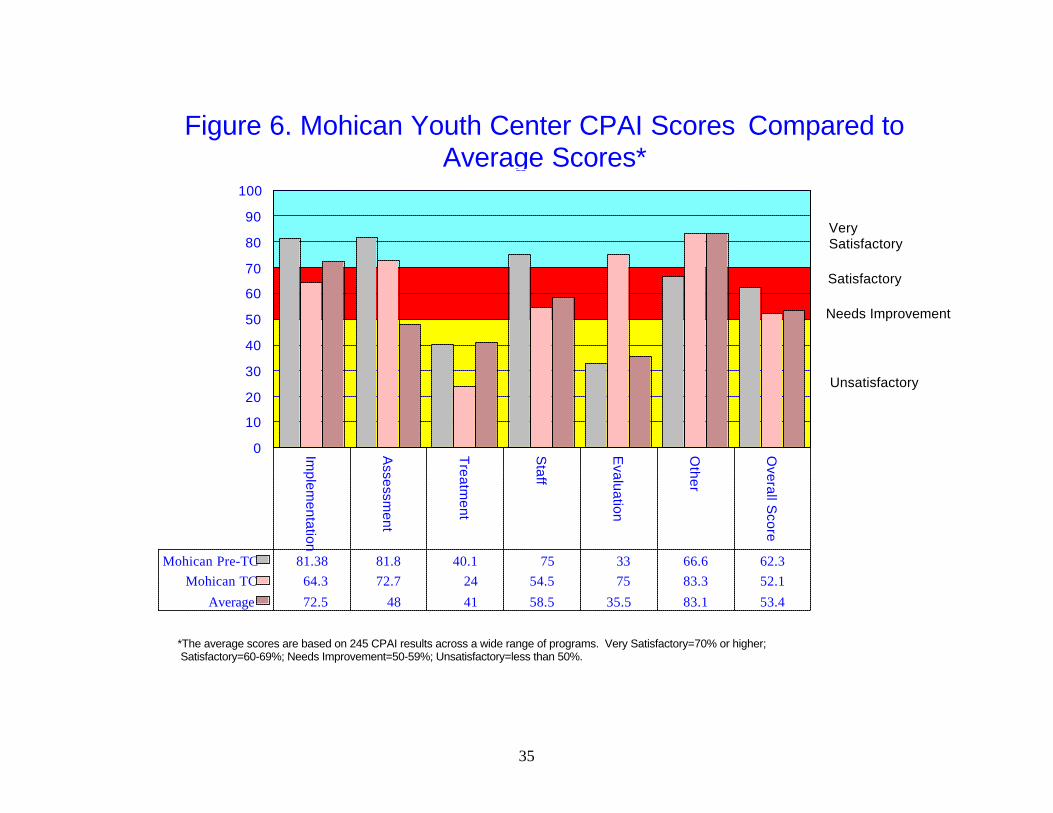
General Services Provided. Mohican Youth Center changed curriculums from a
combined 12-step and cognitive model of treatment to a therapeutic community during the
course of this evaluation. The Correctional Program Assessment Inventory (CPAI) was
conducted on Mohican during both modalities of treatment. As indicated in the first section
of this report, the CPAI is a tool designed to ascertain how well a program is meeting certain
principles of effective intervention. Programs receive an overall score and a score for each of
the six sections of the CPAI with less than 50 percent considered “unsatisfactory, ” 50 to 59
percent considered “needs improvement,” 60 to 69 percent considered “satisfactory,” and 70
to 100 percent considered “very satisfactory.” The average overall CPAI score for over 245
programs across the United States is 53.4 percent. Mohican’s combined 12-step and
cognitive model (pre-TC) scored 62.3 percent, whereas Mohican’s therapeutic community
program scored 52.1 percent (Figure 6).
The most recent CPAI score for Mohican reveals that the there were changes within
the six components of the assessment. Mohican’s score decreased in four areas:
implementation, assessment, treatment, and staff. However, the scores increased in the
evaluation and other section partly because of participation in the process and outcome
evaluation currently taking place. In addition, the overall score for Mohican decreased from
62.3 percent (pre-TC model) to 52.1 percent (TC) model. The change in the score is partly
35
Figure 6. Mohican Youth Center CPAI Scores Compared to Average Scores*
*The average scores are based on 245 CPAI results across a wide range of programs. Very Satisfactory=70% or higher; Satisfactory=60-69%; Needs Improvement=50-59%; Unsatisfactory=less than 50%.
Implem
entation
Assessm
ent
Treatm
ent
Staff
Evaluation
Other
Overall S
core
0
10
20
30
40
50
60
70
80
90
100
Mohican Pre-TC 81.38 81.8 40.1 75 33 66.6 62.3Mohican TC 64.3 72.7 24 54.5 75 83.3 52.1
Average 72.5 48 41 58.5 35.5 83.1 53.4
Very Satisfactory
Satisfactory
Unsatisfactory
Needs Improvement
36
the result of changes to the scoring criteria of the CPAI. The previous version was based on
65 items, whereas the current version has 77 items.
The following are areas in which improvement was made from the first CPAI to the second CPAI:
• Punishers are used to stop behavior in the present and to change behavior in the future.
• The hiring of new staff is based on personal qualities relevant to treatment.
• The staff at Mohican have been on the job for a period of at least 2 years.
• Quality assurance mechanisms are in place to monitor the treatment process.
• Treatment counselors are provided with clinical supervision.
• Mohican has developed a client satisfaction survey that is administered to youth upon
their termination.
• The Department of Youth Services collects recidivism data for all Mohican participants.
• The filing system has improved in which the client records are kept in a confidential
file and include assessment information, treatment plans, and progress notes. The following are items in which there needed to be improvement after the second CPAI:
• The program director changed since the first CPAI was conducted. The current program director was not involved with designing the program and does not train the treatment staff.
• Not all youth are assessed on personal characteristics that may affect amenability for
treatment.
• The combined model incorporated a social learning and cognitive model of treatment more consistently than the TC model. Even though Mohican currently utilize some cognitive behavioral strategies, many of the techniques and groups used by the program have not demonstrated effectiveness in reducing criminal behavior. The groups are eclectic, education-based, and/or processing.
• Youth are not consistently trained to identify and monitor problem situations
throughout the program. Furthermore, youth are not taught to rehearse alternative, prosocial ways of coping with these situations.

37
• Punishers are more commonly used than rewards. In addition, some of the punishers used are “shaming” techniques in which the effectiveness of these types of punishers is questionable. Furthermore, staff are not trained in the administration of rewards and punishers.
• When referrals to other agencies are made, the referrals are not followed up.
• Mohican does not have an aftercare component in place.
Rates of Phase Advancement. There are four phases that youth can advance through
while at Mohican. Orientation last four weeks and is designed to familiarize the youth with
the TC environment. More specifically, eight sessions focus on TC perspective, concepts,
philosophy, and privilege system. Youth then move into the first phase, which lasts seven
weeks. Youth in this phase focus on identifying and overcoming thinking errors. The second
phase is centered on personal recovery. Youth in this phase will be introduced to chemical
dependency, concentrate on family issues, evaluate their criminal values and self worth, and
learn how to express their feelings in a prosocial manner. The youth are in phase two for a
period of seven weeks. Phase three’s curriculum focuses on relapse prevention. In this phase,
which lasts for eight weeks, youth are introduced to techniques to avoid relapse such as how
to avoid “easy money” and the “old life.” Youth must also complete a relapse prevention
plan.
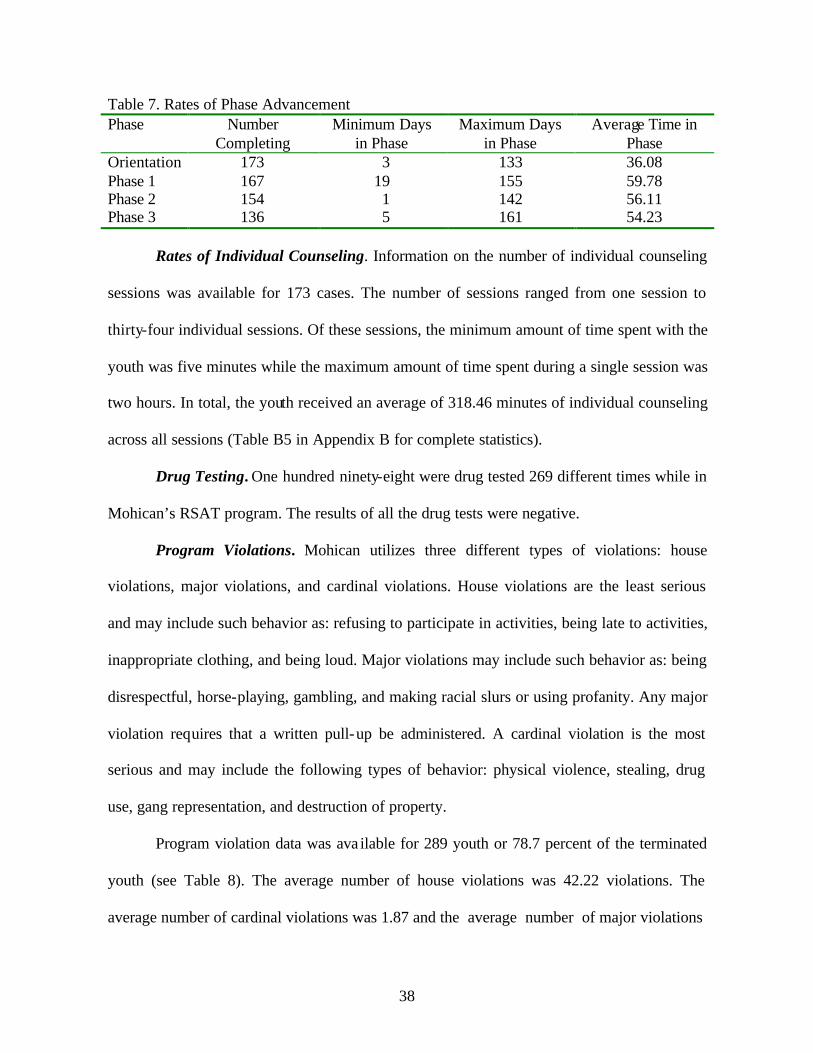
Due to missing information, rates of phase advancement were ava ilable for only 173
youth (47% of the youth that were discharged). As Table 7 reveals, only 136 youth finished
all four phases of treatment.10 The average length of time spent in the orientation phase was
36.08 days whereas the average length of days spent in phase one was 59.78. For phase two,
the average number of days spent was 56.11, and the youth spent an average of 54.23 days in
phase three. 10 Youth may not have finished treatment due to early release or their sentence was finished before they had completed all four phases of treatment.
38
Table 7. Rates of Phase Advancement Phase Number
Completing Minimum Days
in Phase Maximum Days
in Phase Average Time in
Phase Orientation 173 3 133 36.08 Phase 1 167 19 155 59.78 Phase 2 154 1 142 56.11 Phase 3 136 5 161 54.23
Rates of Individual Counseling. Information on the number of individual counseling
sessions was available for 173 cases. The number of sessions ranged from one session to
thirty-four individual sessions. Of these sessions, the minimum amount of time spent with the
youth was five minutes while the maximum amount of time spent during a single session was
two hours. In total, the youth received an average of 318.46 minutes of individual counseling
across all sessions (Table B5 in Appendix B for complete statistics).
Drug Testing. One hundred ninety-eight were drug tested 269 different times while in
Mohican’s RSAT program. The results of all the drug tests were negative.
Program Violations. Mohican utilizes three different types of violations: house
violations, major violations, and cardinal violations. House violations are the least serious
and may include such behavior as: refusing to participate in activities, being late to activities,
inappropriate clothing, and being loud. Major violations may include such behavior as: being
disrespectful, horse-playing, gambling, and making racial slurs or using profanity. Any major
violation requires that a written pull-up be administered. A cardinal violation is the most
serious and may include the following types of behavior: physical violence, stealing, drug
use, gang representation, and destruction of property.
Program violation data was ava ilable for 289 youth or 78.7 percent of the terminated
youth (see Table 8). The average number of house violations was 42.22 violations. The
average number of cardinal violations was 1.87 and the average number of major violations
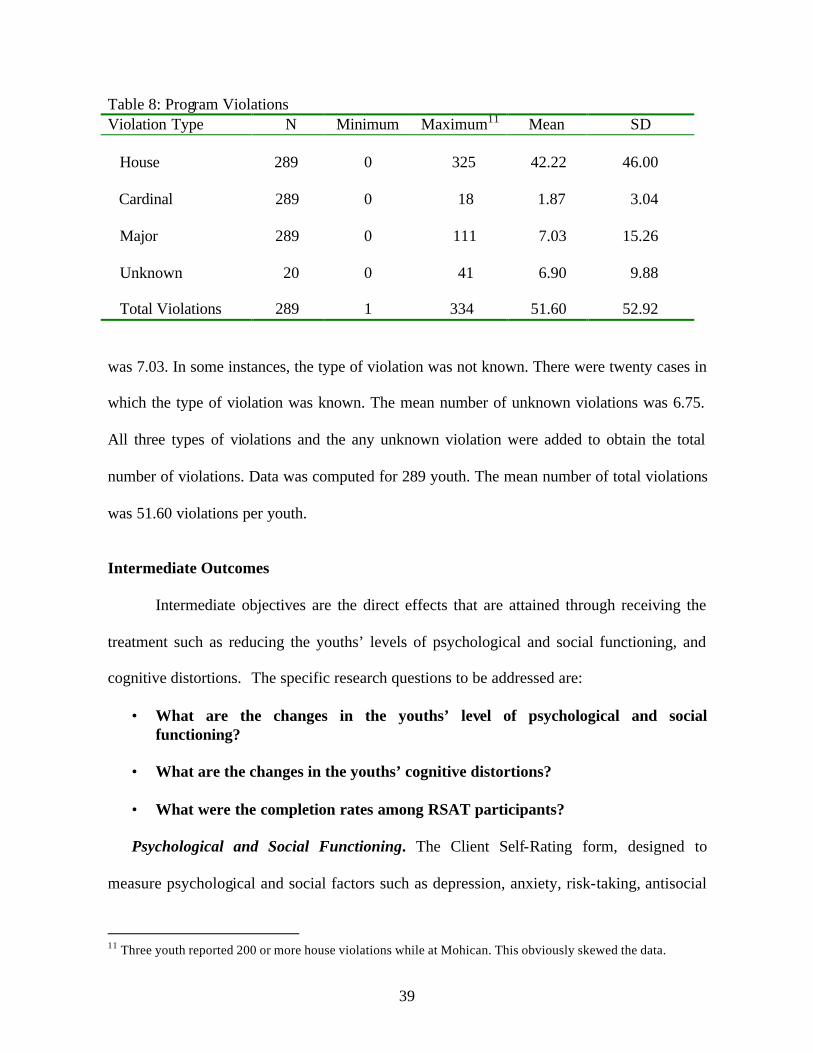
39
Table 8: Program Violations Violation Type N Minimum Maximum11 Mean SD House 289 0 325 42.22 46.00 Cardinal 289 0 18 1.87 3.04 Major 289 0 111 7.03 15.26 Unknown 20 0 41 6.90 9.88 Total Violations 289 1 334 51.60 52.92
was 7.03. In some instances, the type of violation was not known. There were twenty cases in
which the type of violation was known. The mean number of unknown violations was 6.75.
All three types of violations and the any unknown violation were added to obtain the total
number of violations. Data was computed for 289 youth. The mean number of total violations
was 51.60 violations per youth.
Intermediate Outcomes
Intermediate objectives are the direct effects that are attained through receiving the
treatment such as reducing the youths’ levels of psychological and social functioning, and
cognitive distortions. The specific research questions to be addressed are:
• What are the changes in the youths’ level of psychological and social functioning?
• What are the changes in the youths’ cognitive distortions?
• What were the completion rates among RSAT participants?
Psychological and Social Functioning. The Client Self-Rating form, designed to
measure psychological and social factors such as depression, anxiety, risk-taking, antisocial
11 Three youth reported 200 or more house violations while at Mohican. This obviously skewed the data.
40
values, and hostility, was administered at intake and termination. The instrument was
administered at intake on 444 cases and administered at termination on 212 cases.
Termination data is not available on the cases that are still active in Mohican. Also, some
termination assessments were not conducted depending on the time the youth left the
institution. For, example, it appears that one individual was responsible for administering the
assessments. If the youth left the institution when this individual was not available, then
termination assessments were not conducted. Due to implementation problems, reassessment
data were not available for the pre-TC group. The data presented is information from the
treatment group.
According to Simpson and Knight (1998), treatment should reduce anxiety,
depression, risk-taking and hostility and increase self-esteem, self-efficacy, decision-making,
desire for help, and treatment readiness. Paired sample t-tests between time 1 and time 2
scores on the Client Self-Rating reveal almost no changes in the anxiety, risk-taking, self-
efficacy, desire for help, and treatment readiness scales (Table 9). The change in time 1 and
time 2 scores on the depression, self-esteem, and decision-making scales were statistically
significant and in the hypothesized direction, indicating that on average youths’ levels of
depression, self-esteem, and decision-making abilities increased with participation in
treatment. In addition, the change in scores from time 1 to time 2 was statistically significant
for the hostility scale; however, the change was in the wrong direction indicating that
participation in treatment increased youths’ level of hostility.
One reason for the null findings for anxiety, risk-taking, self-efficacy, desire for help,
and treatment readiness scales may be the result that the instrument has not been validated on
the juvenile offender population. Thus, the instrument may not be appropriate for the juvenile
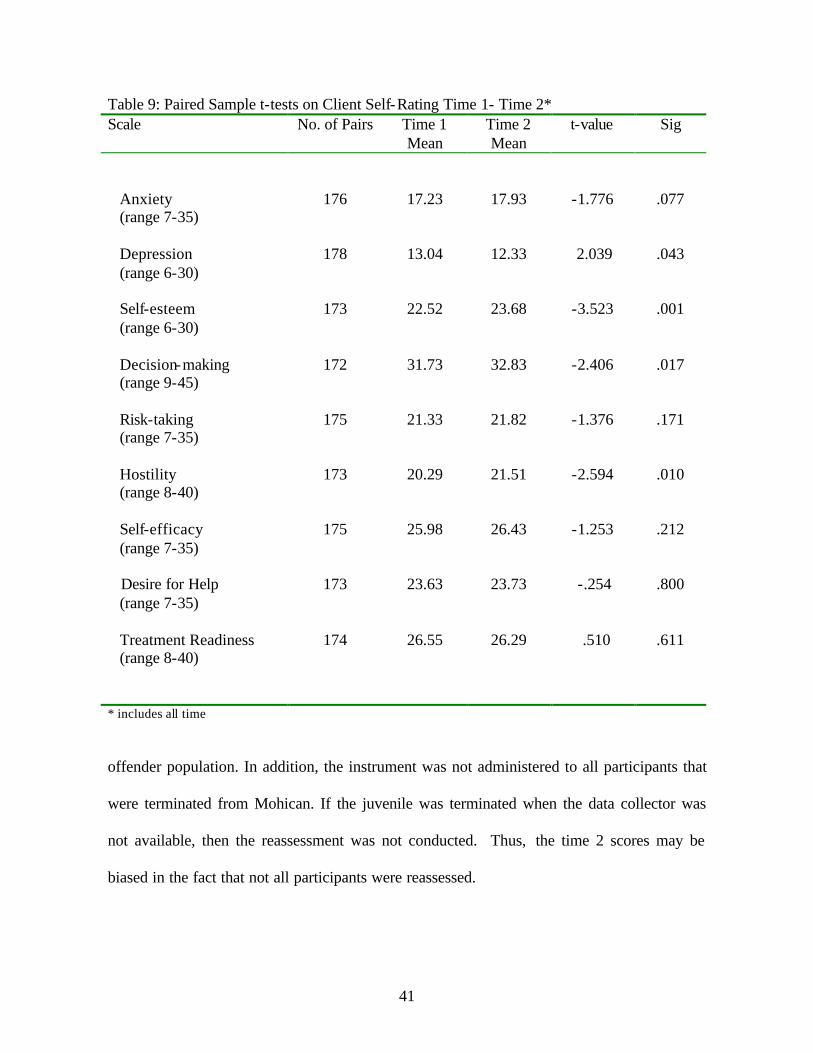
41
Table 9: Paired Sample t-tests on Client Self-Rating Time 1- Time 2* Scale No. of Pairs Time 1
Mean Time 2 Mean
t-value Sig
Anxiety (range 7-35)
176 17.23 17.93 -1.776 .077
Depression (range 6-30)
178 13.04 12.33 2.039 .043
Self-esteem (range 6-30)
173 22.52 23.68 -3.523 .001
Decision-making (range 9-45)
172 31.73 32.83 -2.406 .017
Risk-taking (range 7-35)
175 21.33 21.82 -1.376 .171
Hostility (range 8-40)
173 20.29 21.51 -2.594 .010
Self-efficacy (range 7-35)
175 25.98 26.43 -1.253 .212
Desire for Help (range 7-35)
173 23.63 23.73 -.254 .800
Treatment Readiness (range 8-40)
174 26.55 26.29 .510 .611
* includes all time
offender population. In addition, the instrument was not administered to all participants that
were terminated from Mohican. If the juvenile was terminated when the data collector was
not available, then the reassessment was not conducted. Thus, the time 2 scores may be
biased in the fact that not all participants were reassessed.

42
Mohican’s RSAT program is a six months program. Therefore, there should have
been six months or 180 days between the time 1 and time 2 measures on the client self-rating.
However, the length of time between the different measures varied with a minimum of 13
days to 544 days, with an average of 195.45 days between the administration of the
instrument. To determine if amount of time affected the outcome for the time 2 score,
regression analyses were conducted.12 Time was a significant predictor for only one of the
significant relationships —hostility (see Table B6 in Appendix B). As the amount of time
(measured in days) increased, the score on the time 2 measure of hostility increased
suggesting that longer stays in treatment contributed to more hostile feelings.
Time was also a significant predictor for the time 2 scores for risk-taking and
treatment readiness. Longer times spent in treatment generated higher levels of risk-taking
feelings and decreased youths’ readiness for treatment. However, the relationship between
time 1 and time 2 scores for these scales were not statistically significant.
Cognitive Distortions. Youths’ cognitive distortions such as self-centered, blaming
others, minimizing behavior, and assuming the worst were measured by the How I Think
questionnaire. The questionnaire was administered at intake and termination from the
program. The instrument was administered to 435 youths at intake and to 219 youth at
termination. Assessments were administered by a staff member at Mohican. If this individual
was not available when the youth left the institution, then termination assessments were not
conducted. The How I Think Questionnaire has an anomalous response scale that indicates
untruthful answering by the individual. Scores greater than 4.25 are not to be included in the
analysis and were removed. Therefore, the maximum number of cases available to compare
12 Correlations were conducted between amount of time and the differences between the time 1 and time 2 scores for all scales. There were no statistically significant correlations between time and the differences between scores.
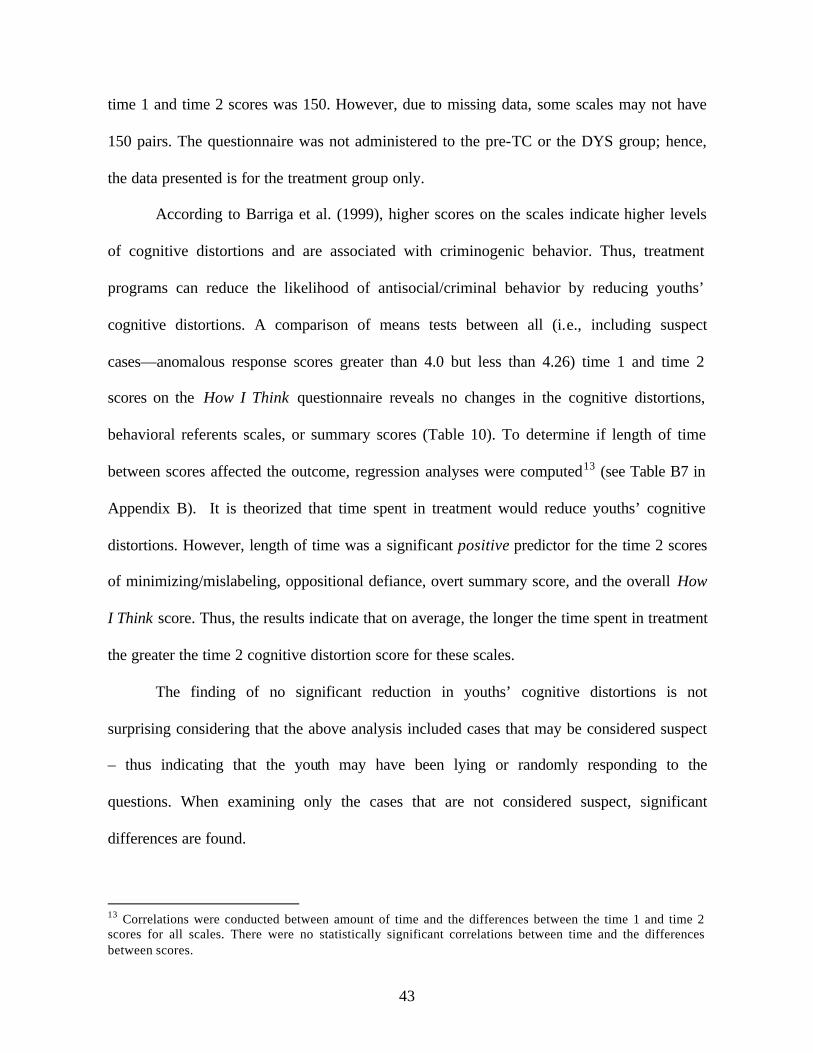
43
time 1 and time 2 scores was 150. However, due to missing data, some scales may not have
150 pairs. The questionnaire was not administered to the pre-TC or the DYS group; hence,
the data presented is for the treatment group only.
According to Barriga et al. (1999), higher scores on the scales indicate higher levels
of cognitive distortions and are associated with criminogenic behavior. Thus, treatment
programs can reduce the likelihood of antisocial/criminal behavior by reducing youths’
cognitive distortions. A comparison of means tests between all (i.e., including suspect
cases—anomalous response scores greater than 4.0 but less than 4.26) time 1 and time 2
scores on the How I Think questionnaire reveals no changes in the cognitive distortions,
behavioral referents scales, or summary scores (Table 10). To determine if length of time
between scores affected the outcome, regression analyses were computed13 (see Table B7 in
Appendix B). It is theorized that time spent in treatment would reduce youths’ cognitive
distortions. However, length of time was a significant positive predictor for the time 2 scores
of minimizing/mislabeling, oppositional defiance, overt summary score, and the overall How
I Think score. Thus, the results indicate that on average, the longer the time spent in treatment
the greater the time 2 cognitive distortion score for these scales.
The finding of no significant reduction in youths’ cognitive distortions is not
surprising considering that the above analysis included cases that may be considered suspect
– thus indicating that the youth may have been lying or randomly responding to the
questions. When examining only the cases that are not considered suspect, significant
differences are found.
13 Correlations were conducted between amount of time and the differences between the time 1 and time 2 scores for all scales. There were no statistically significant correlations between time and the differences between scores.
44
Table 10: Paired Sample t-tests on How I Think Questionnaire, Time 1- Time 2* Scale No. of Pairs Time 1
Mean Time 2 Mean
t-value Sig
Cognitive Distortions
Self-centered (range 0-6)
111 3.29 3.19 1.506 .135
Blaming Others (range 0-6)
114 3.22 3.23 -.063 .950
Minimizing/Mislabeling (range 0-6)
111 4.19 4.20 -.141 .888
Assuming the Worst (range 0-6)
109 2.82 2.70 1.423 .158
Behavioral Referents
Opposition-Defiance (range 0-6)
114 3.25 3.22 .374 .709
Physical Aggression (range 0-6)
113 3.40 3.34 1.052 .295
Lying (range 0-6)
104 3.51 3.44 1.035 .303
Stealing (range 0-6)
111 3.30 3.25 .944 .347
Summary Scores Covert (range 1-6)
104 3.41 3.34 1.190 .237
Overt (range 1-6)
112 3.33 3.27 .819 .415
How I Think (range 1-6)
101 3.38 3.31 1.166 .246
* Includes the scores that may be considered “suspect” because the AR scale is greater than 4.0 but less than 4.25.
45
Table 11 reports the results of the paired sample t-tests for cases that are not
considered “suspect.” When the suspect cases are removed from the analysis, significant
relationships are found. A statistically significant relationship was found between the one
cognitive distortion: self-centeredness. Participation in treatment reduced youths’ self-
centered thinking (p=.042). There was only one behavioral referent scale that produced a
statistically significant relationship. On average, youths’ lying was reduced by participating
in the therapeutic community (p=.006). All three summary scores produced a significant
relationship and in the expected direction. Youths’ overt behavioral referents, covert
cognitive distortions, and overall How I Think score were reduced by participation in
treatment. Again, the length of time between time 1 and time 2 scores varied with a minimum
of 37 days and a maximum of 316 days with an average of 192.18. To determine if amount
of time spent in treatment affected the How I Think outcome, regression analyses were
conducted on all pairs (Table B8 in Appendix B). Amount of time between scores was a
significant predictor for the overt score and the overall How I Think score (see Appendix B).
It is hypothesized that the time spent in treatment would decrease the cognitive distortion.
However, the results of the regression analyses reveal that the longer the time spent in
treatment the higher the score of the cognitive distortion. More specifically, on average,
youths spending longer amounts of time in treatment had higher levels of cognitive
distortions.
Termination Information
As indicated by Table 12, the majority of youth in all three samples had been
discharged from Mohican (78.6% and 100% for the treatment and pre-TC groups
respectively) or another DYS institution (93.6% for the DYS group) at the time of data
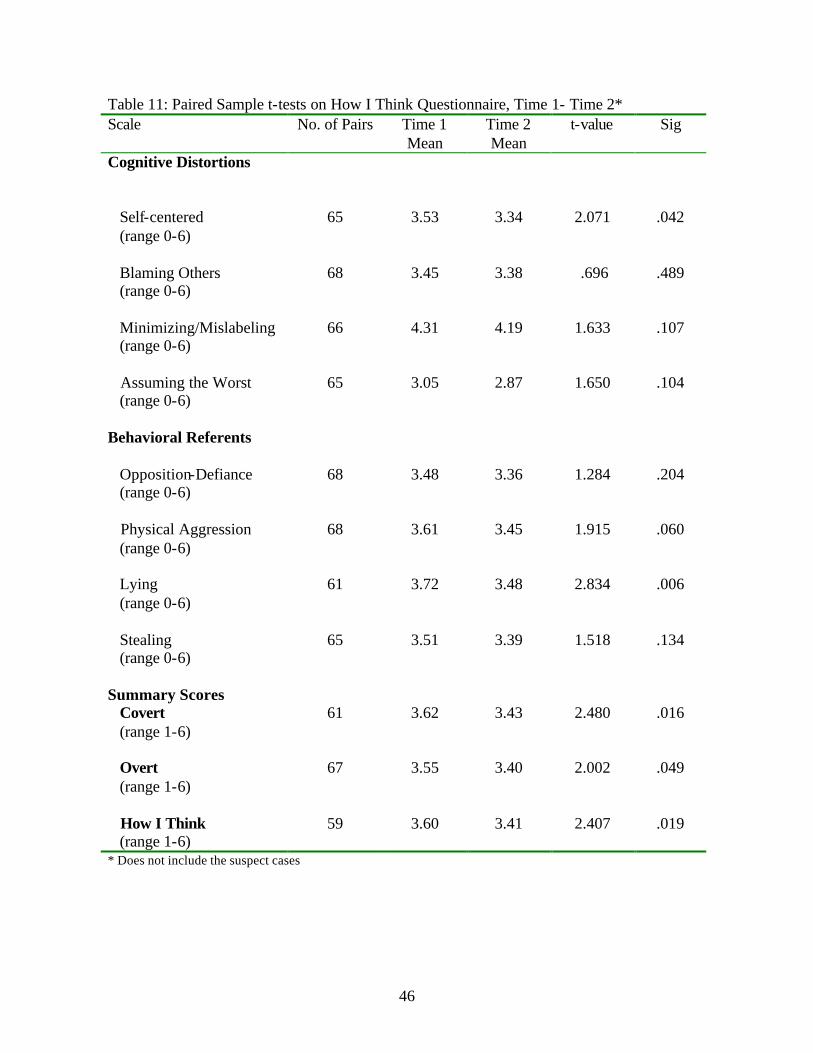
46
Table 11: Paired Sample t-tests on How I Think Questionnaire, Time 1- Time 2* Scale No. of Pairs Time 1
Mean Time 2 Mean
t-value Sig
Cognitive Distortions
Self-centered (range 0-6)
65 3.53 3.34 2.071 .042
Blaming Others (range 0-6)
68 3.45 3.38 .696 .489
Minimizing/Mislabeling (range 0-6)
66 4.31 4.19 1.633 .107
Assuming the Worst (range 0-6)
65 3.05 2.87 1.650 .104
Behavioral Referents
Opposition-Defiance (range 0-6)
68 3.48 3.36 1.284 .204
Physical Aggression (range 0-6)
68 3.61 3.45 1.915 .060
Lying (range 0-6)
61 3.72 3.48 2.834 .006
Stealing (range 0-6)
65 3.51 3.39 1.518 .134
Summary Scores Covert (range 1-6)
61 3.62 3.43 2.480 .016
Overt (range 1-6)
67 3.55 3.40 2.002 .049
How I Think (range 1-6)
59 3.60 3.41 2.407 .019
* Does not include the suspect cases
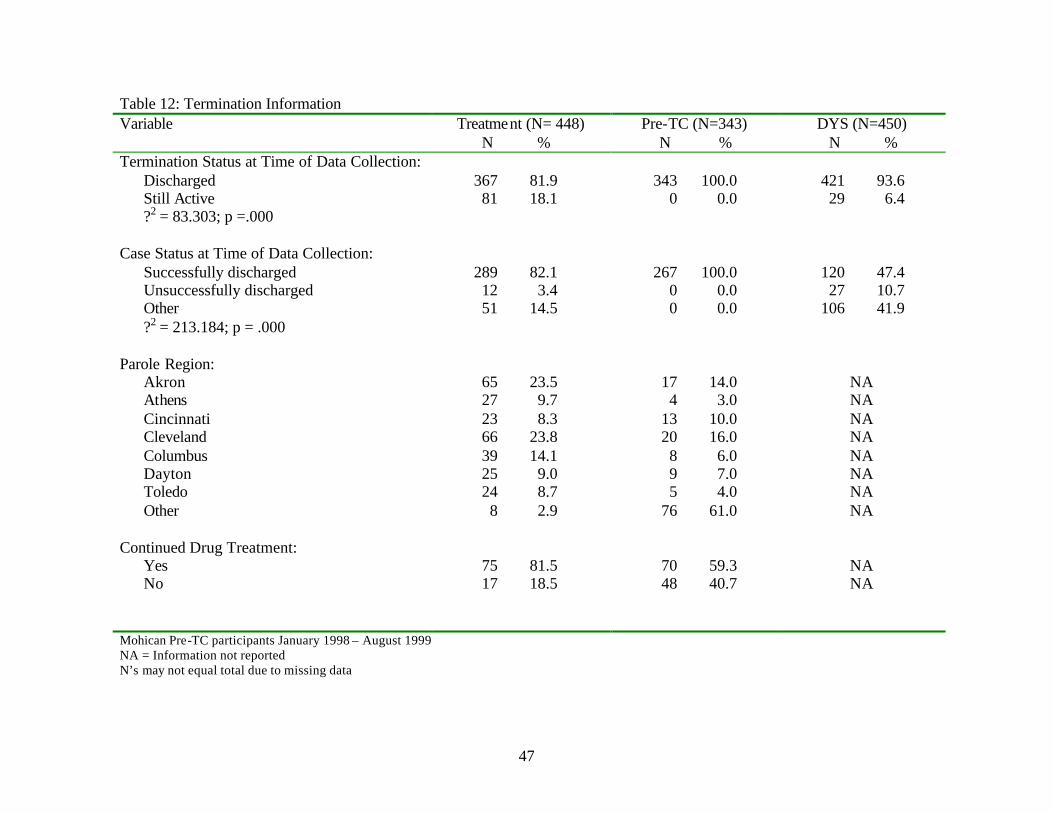
47
Table 12: Termination Information Variable
Treatment (N= 448) N %
Pre-TC (N=343) N %
DYS (N=450) N %
Termination Status at Time of Data Collection: Discharged 367 81.9 343 100.0 421 93.6 Still Active 81 18.1 0 0.0 29 6.4 ?2 = 83.303; p =.000 Case Status at Time of Data Collection:
Successfully discharged 289 82.1 267 100.0 120 47.4 Unsuccessfully discharged 12 3.4 0 0.0 27 10.7 Other 51 14.5 0 0.0 106 41.9 ?2 = 213.184; p = .000 Parole Region: Akron 65 23.5 17 14.0 NA Athens 27 9.7 4 3.0 NA Cincinnati 23 8.3 13 10.0 NA Cleveland 66 23.8 20 16.0 NA Columbus 39 14.1 8 6.0 NA Dayton 25 9.0 9 7.0 NA Toledo 24 8.7 5 4.0 NA Other 8 2.9 76 61.0 NA Continued Drug Treatment: Yes 75 81.5 70 59.3 NA No 17 18.5 48 40.7 NA Mohican Pre-TC participants January 1998 – August 1999 NA = Information not reported N’s may not equal total due to missing data
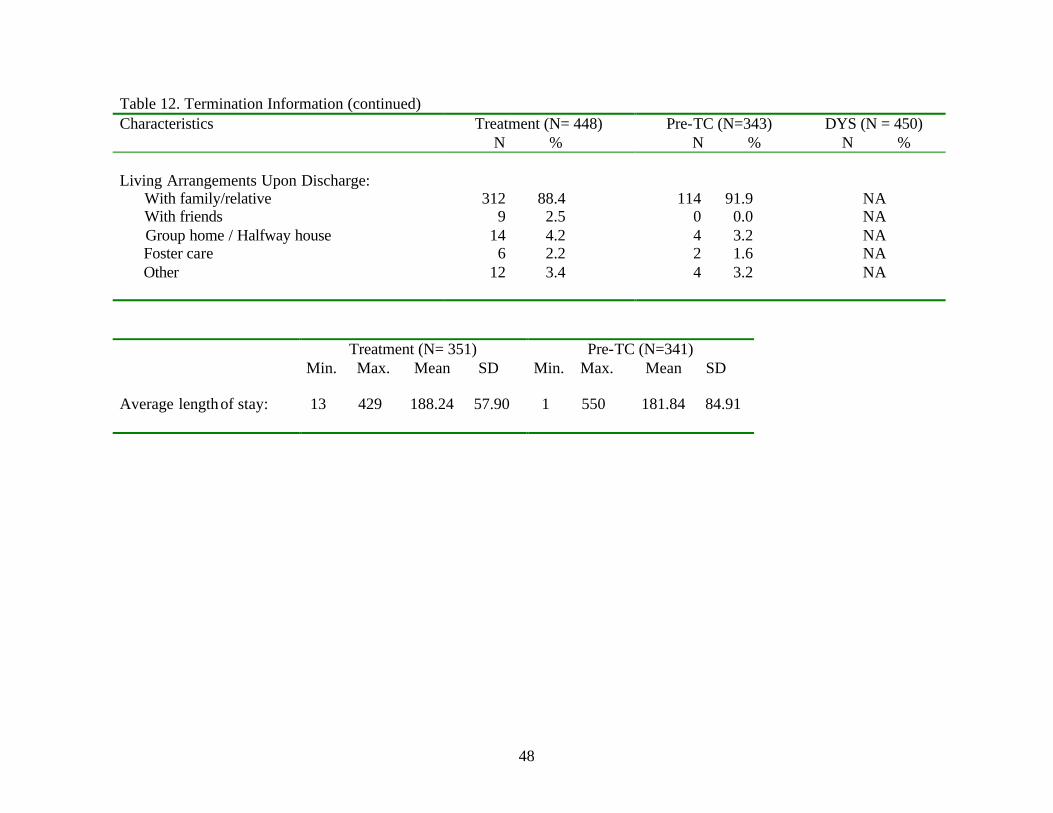
48
Table 12. Termination Information (continued) Characteristics
Treatment (N= 448) N %
Pre-TC (N=343) N %
DYS (N = 450) N %
Living Arrangements Upon Discharge: With family/relative 312 88.4 114 91.9 NA With friends 9 2.5 0 0.0 NA Group home / Halfway house 14 4.2 4 3.2 NA Foster care 6 2.2 2 1.6 NA Other 12 3.4 4 3.2 NA Treatment (N= 351)
Min. Max. Mean SD Pre-TC (N=341)
Min. Max. Mean SD Average length of stay: 13 429 188.24 57.90 1 550 181.84 84.91
49
collection. 14 Chi-square analysis revealed that there were significant differences in the
termination status of the three groups. It appears that the pre-TC group was more likely to be
discharged than either the treatment group or the DYS group.
Of those discharged from Mohican’s TC, 82 percent had been successfully
discharged, 3 percent were unsuccessfully terminated, and 14 percent were terminated either
due to early release, transfer to another institution, or discharged because of age. Termination
information is available for 267 youth in the pre-TC group; all of which were successfully
terminated. For the DYS group, 47.4 percent were successfully discharged, 10.7 percent were
unsuccessfully terminated, and 41.9 percent were discharged for other reasons. Chi-square
analysis revealed that there were significant differences between the groups. More
specifically, the treatment group was more likely to be successfully discharged, whereas the
DYS group was more likely to be unsuccessfully terminated. Of those youth who had been
discharged from Mohican, an overwhelming majority (87.8% for the treatment group and
91.9% for the pre-TC group) was living with a family member (data concerning living
arrangements upon discharge was not reported for the DYS group.)
There were no statistically significant differences between the treatment group and
the pre-TC on the amount of time spent in treatment. The treatment group spent an average of
188.24 days in Mohican while the pre-TC spent an average of 181.84 days in treatment.
Post Release Information
Reporting Status. To determine what kinds of treatment the youth received after they
left Mohican, surveys were sent to the agenc ies responsible for supervision of Mohican youth
14 Information on type of termination (successful or unsuccessful) was missing for 74 cases for the pre-TC group. This missing data could be due to the fact that data collection was halted during the time period in between the process evaluation and the outcome evaluation. Information on type of termination was missing for 139 cases for the DYS group.
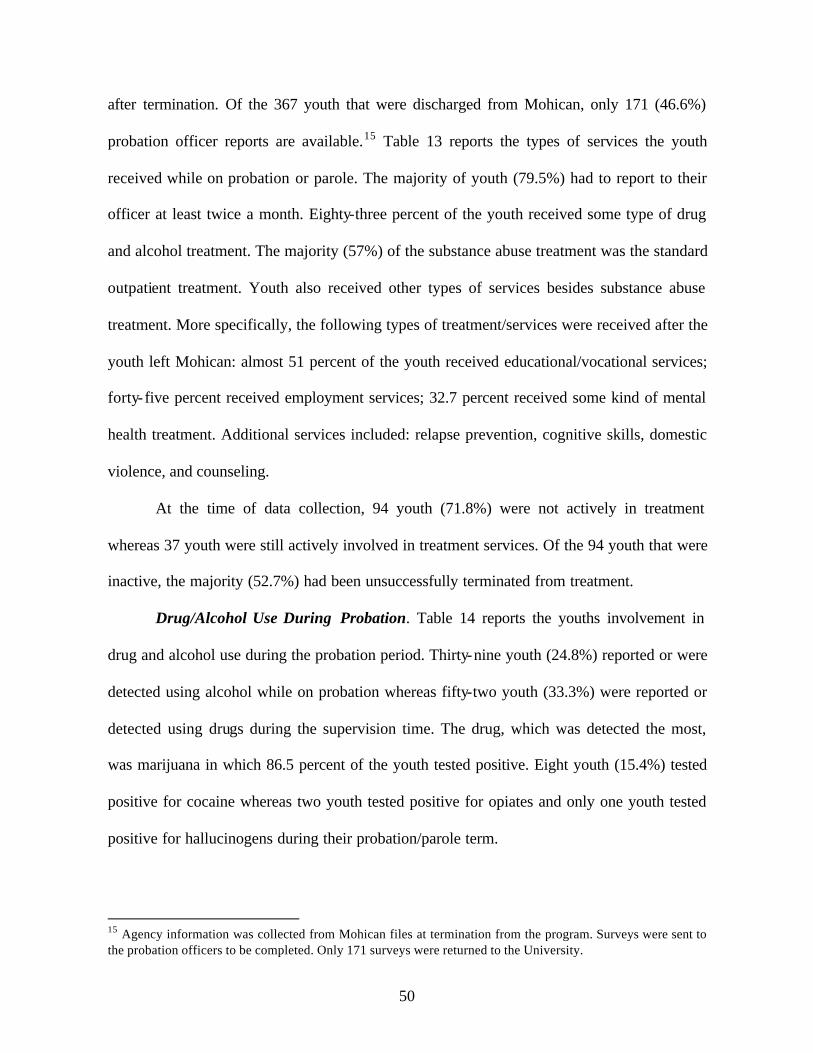
50
after termination. Of the 367 youth that were discharged from Mohican, only 171 (46.6%)
probation officer reports are available.15 Table 13 reports the types of services the youth
received while on probation or parole. The majority of youth (79.5%) had to report to their
officer at least twice a month. Eighty-three percent of the youth received some type of drug
and alcohol treatment. The majority (57%) of the substance abuse treatment was the standard
outpatient treatment. Youth also received other types of services besides substance abuse
treatment. More specifically, the following types of treatment/services were received after the
youth left Mohican: almost 51 percent of the youth received educational/vocational services;
forty-five percent received employment services; 32.7 percent received some kind of mental
health treatment. Additional services included: relapse prevention, cognitive skills, domestic
violence, and counseling.
At the time of data collection, 94 youth (71.8%) were not actively in treatment
whereas 37 youth were still actively involved in treatment services. Of the 94 youth that were
inactive, the majority (52.7%) had been unsuccessfully terminated from treatment.
Drug/Alcohol Use During Probation. Table 14 reports the youths involvement in
drug and alcohol use during the probation period. Thirty-nine youth (24.8%) reported or were
detected using alcohol while on probation whereas fifty-two youth (33.3%) were reported or
detected using drugs during the supervision time. The drug, which was detected the most,
was marijuana in which 86.5 percent of the youth tested positive. Eight youth (15.4%) tested
positive for cocaine whereas two youth tested positive for opiates and only one youth tested
positive for hallucinogens during their probation/parole term.
15 Agency information was collected from Mohican files at termination from the program. Surveys were sent to the probation officers to be completed. Only 171 surveys were returned to the University.
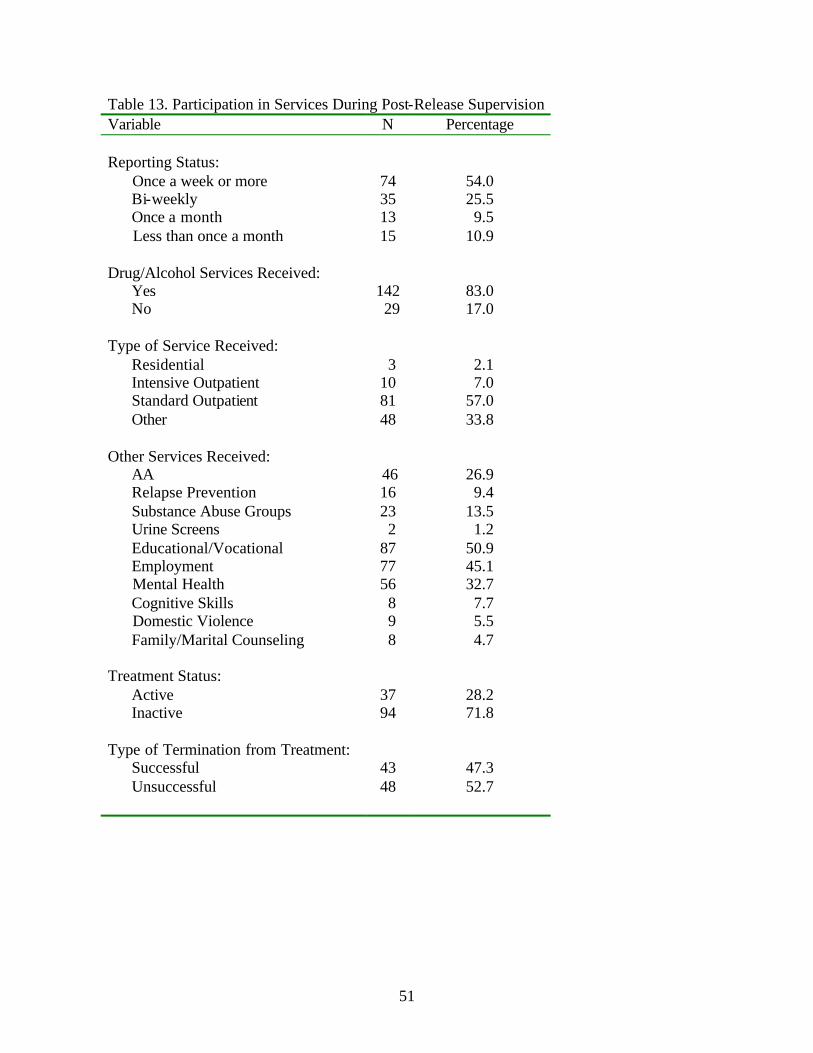
51
Table 13. Participation in Services During Post-Release Supervision Variable N Percentage Reporting Status: Once a week or more 74 54.0 Bi-weekly 35 25.5 Once a month 13 9.5 Less than once a month 15 10.9 Drug/Alcohol Services Received: Yes 142 83.0 No 29 17.0 Type of Service Received: Residential 3 2.1 Intensive Outpatient 10 7.0 Standard Outpatient 81 57.0 Other 48 33.8 Other Services Received: AA 46 26.9 Relapse Prevention 16 9.4 Substance Abuse Groups 23 13.5 Urine Screens 2 1.2 Educational/Vocational 87 50.9 Employment 77 45.1 Mental Health 56 32.7 Cognitive Skills 8 7.7 Domestic Violence 9 5.5 Family/Marital Counseling 8 4.7 Treatment Status: Active 37 28.2 Inactive 94 71.8 Type of Termination from Treatment: Successful 43 47.3 Unsuccessful 48 52.7
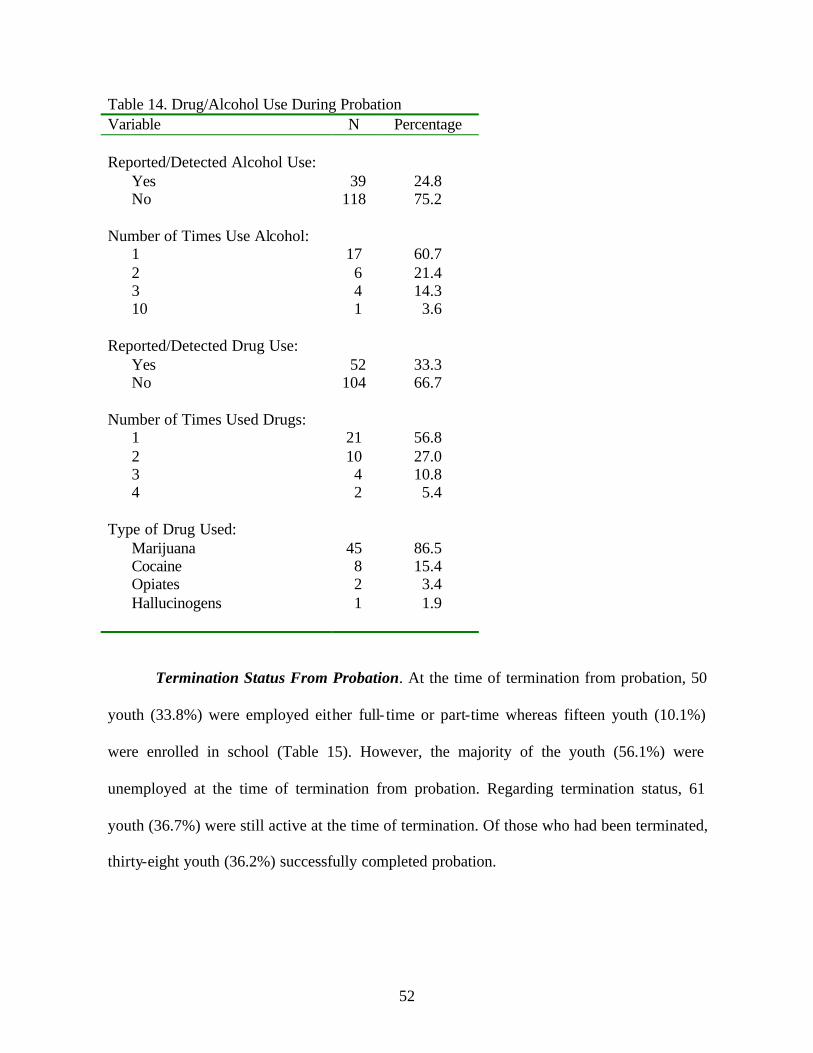
52
Table 14. Drug/Alcohol Use During Probation Variable N Percentage Reported/Detected Alcohol Use: Yes 39 24.8 No 118 75.2 Number of Times Use Alcohol: 1 17 60.7 2 6 21.4 3 4 14.3 10 1 3.6 Reported/Detected Drug Use: Yes 52 33.3 No 104 66.7 Number of Times Used Drugs: 1 21 56.8 2 10 27.0 3 4 10.8 4 2 5.4 Type of Drug Used: Marijuana 45 86.5 Cocaine 8 15.4 Opiates 2 3.4 Hallucinogens 1 1.9
Termination Status From Probation. At the time of termination from probation, 50
youth (33.8%) were employed either full- time or part-time whereas fifteen youth (10.1%)
were enrolled in school (Table 15). However, the majority of the youth (56.1%) were
unemployed at the time of termination from probation. Regarding termination status, 61
youth (36.7%) were still active at the time of termination. Of those who had been terminated,
thirty-eight youth (36.2%) successfully completed probation.
53
Table 15: Treatment Group Status at Termination from Probation Variable N Percentage Employment Status at Termination: Unemployed 83 56.1 Student 15 10.1 Employed 50 33.8 Termination from Probation: Successful 38 22.9 Unsuccessful 67 40.4 Active 61 36.7 Type of Unsuccessful Termination Abscond
11
16.4
Revocation 12 17.9 Other 44 65.8 Performance After Termination from Treatment
Incarcerated After Termination16. Information pertaining to new periods of
incarceration (either DYS or DRC) was obtained for all participants. As Table 16 revealed,
the majority of participants within each group were not incarcerated upon termination. Chi-
square analysis revealed that the pre-TC participants were more likely to be to an institution
when compared to the treatment group. In addition, the treatment group was less likely to be
incarcerated after termination when compared to the pre-TC group or the DYS group. There
were significant differences between the mean lengths of time to be incarcerated. The pre-TC
group had the largest average amount of time (296.03 days) to new incarceration followed by
DYS (255.07 days) and then the treatment group (193.89 days).
16 The comparison group was followed for a period of approximately 21months (636 days) because the longest amount of time that the treatment group was at risk in the community was for a period of 21 months. Thus, the outcome information only examined the time period of 21 months or less for all three groups. In addition, because the base rate for commitment to DRC was so low when only examining a 21-month follow-up, new incarceration included commitments to DYS or DRC.
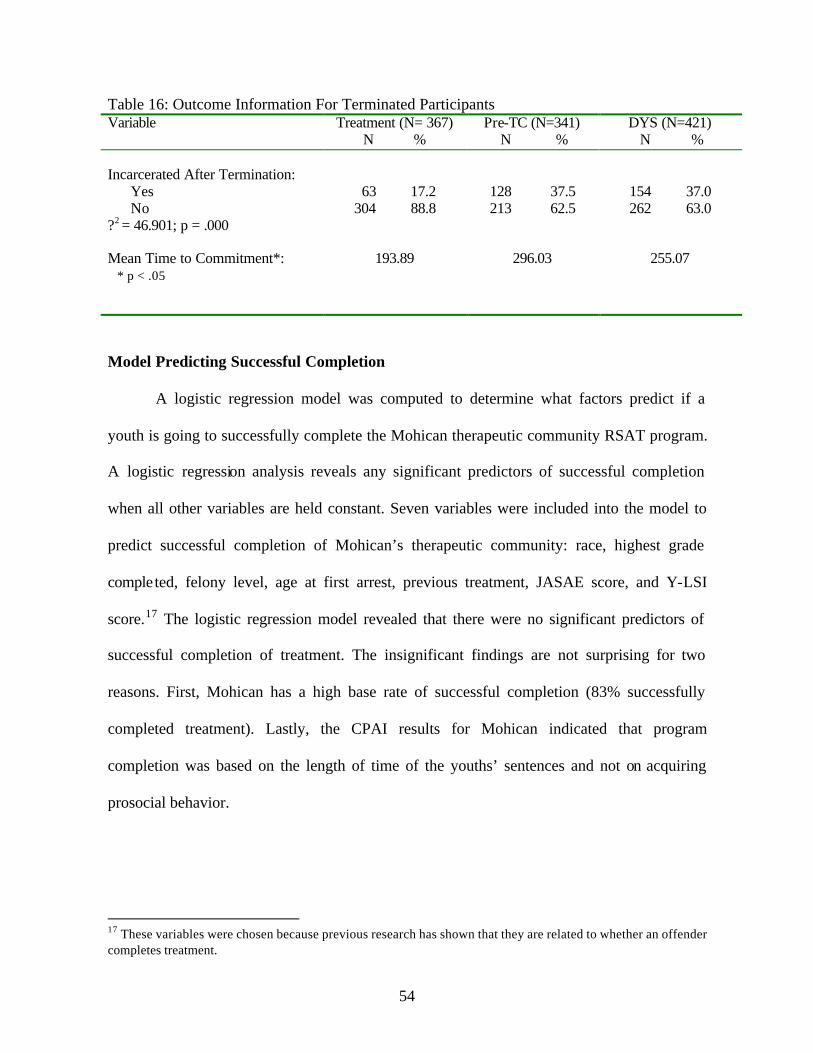
54
Table 16: Outcome Information For Terminated Participants Variable
Treatment (N= 367) N %
Pre-TC (N=341) N %
DYS (N=421) N %
Incarcerated After Termination: Yes 63 17.2 128 37.5 154 37.0 No 304 88.8 213 62.5 262 63.0 ?2 = 46.901; p = .000 Mean Time to Commitment*: 193.89 296.03 255.07 * p < .05
Model Predicting Successful Completion
A logistic regression model was computed to determine what factors predict if a
youth is going to successfully complete the Mohican therapeutic community RSAT program.
A logistic regression analysis reveals any significant predictors of successful completion
when all other variables are held constant. Seven variables were included into the model to
predict successful completion of Mohican’s therapeutic community: race, highest grade
completed, felony level, age at first arrest, previous treatment, JASAE score, and Y-LSI
score.17 The logistic regression model revealed that there were no significant predictors of
successful completion of treatment. The insignificant findings are not surprising for two
reasons. First, Mohican has a high base rate of successful completion (83% successfully
completed treatment). Lastly, the CPAI results for Mohican indicated that program
completion was based on the length of time of the youths’ sentences and not on acquiring
prosocial behavior.
17 These variables were chosen because previous research has shown that they are related to whether an offender completes treatment.
55
Models Predicting Outcomes
As previously stated, the follow-up time period for the current study was 21 months.
Thus, youth were followed up to 21months from the time they left Mohican or DYS. Since
the follow-up time period was 21 months that restricted the chance of being placed in DRC.
Accordingly, the base rate for commitment to DRC was too low to perform separate analysis.
Therefore, the outcome for the models predicting commitment combines recommitment to
DYS and commitment to DRC.
In order to determine what factors were significant in predicting which youth would
be committed, several logistic regression analysis were calculated. For each model, the
dependent variable was commitment to an institution. For example, the first model shows
what factors are significant in predicting commitment examining all the groups together. The
second model reveals what factors predict commitment when examining the treatment group
and the pre-TC group. The last model predicts commitment when examining the treatment
group and the DYS group. The variables that were entered into the model and their codings
are presented in Table B10 in Appendix B.
Logistic regressions calculate beta coefficients for each predictor entered into the
model, assuming all other factors in the model are being held constant. Doing this allows for
the power and significant of each factor on its own to be revealed. In brief, the variables
entered into each model included18 race, age, highest grade completed, felony level, JASAE
score, YO-LSI score, and which group the participants were placed in. 19 These variables were
included in the model because they were correlated with the dependent variable
18 Mean replacement was used for missing information on the Y-LSI scores, the JASAE score, and age whereas the mode was used to replace missing information for highest grade completed and felony level. 19 Bivariate correlations were computed for type of termination and incarceration. The relationship was not significant. Thus, for a more parsimonious model, type of termination was not included in the logistic regression models.
56
(incarceration) or there were significant differences between the groups on these
characteristics. Table B11 through Table B13 (see Appendix B) show the actual coefficients
with their significance levels for each regression calculated in these analyses.
All Groups Predicting Incarceration. The first model examined the predictive ability
of treatment compared to pre-TC and DYS combined on whether a youth was recommitted.
There were five significant factors in the logistic regression predicting recommitment; age,
highest grade completed, felony level, the JASAE score, and the group variable. More
specifically, those more likely to be incarcerated were younger youth; those who had
completed higher grade levels in school, youth who committed a less serious offense, those
who had a more severe substance abuse problem, and youth who did not participate in
Mohican’s therapeutic community were more likely to be incarcerated.
In order to present the logit coefficients in a fashion that is easily understood, each
beta was converted into log-odds probabilities, for each of the significant predictors in the
model. Figure 7 shows the results for the model examining the effectiveness of all groups
combined to predict commitment. There is a negative linear relationship between age and
incarceration. More specifically, a two-year difference in age accounted for a 21-point
decrease in the probability of being incarcerated
Youth who had completed the 9th grade had a 37 percent probability in being
incarcerated whereas youth who had completed the 7th grade had a 30 percent probability of
being incarcerated. In addition, youth who had been sentenced to Mohican or DYS on a less
serious offense such as felony 3 had a higher probability of being incarcerated (37%) than
youth committed for a more serious offense such as felony 1 (31%). Youth with a JASAE
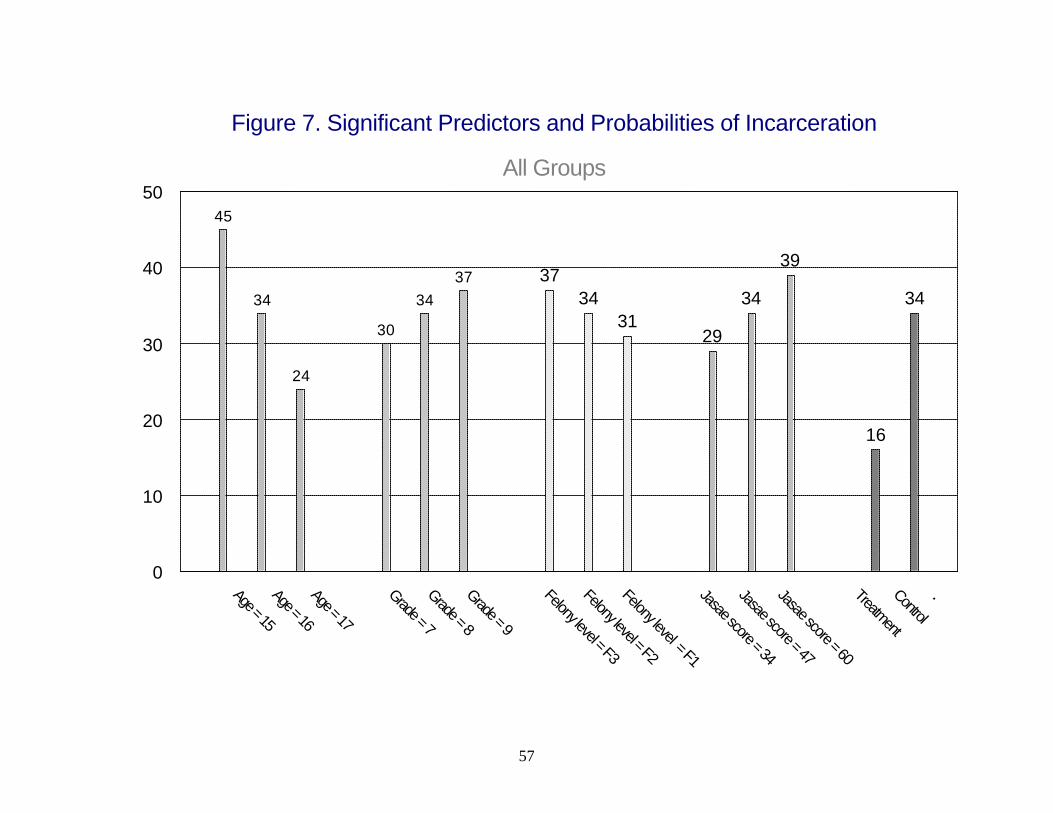
57
Figure 7. Significant Predictors and Probabilities of Incarceration
All Groups
45
34
24
30
3437 37
3431
29
34
39
16
34
Age = 15
Age = 16
Age = 17
Grade = 7
Grade = 8
Grade = 9
Felony level = F3
Felony level = F2
Felony level = F1
Jasae score = 34
Jasae score = 47
Jasae score = 60
Treatment
Control
.0
10
20
30
40
50
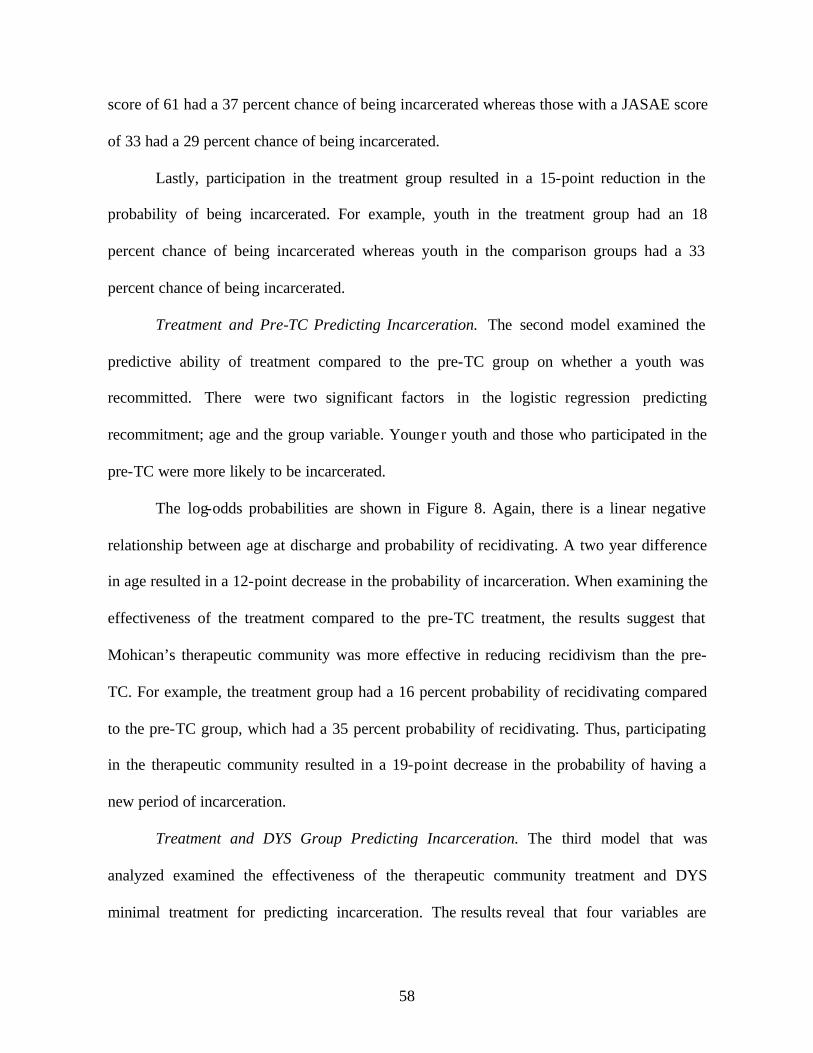
58
score of 61 had a 37 percent chance of being incarcerated whereas those with a JASAE score
of 33 had a 29 percent chance of being incarcerated.
Lastly, participation in the treatment group resulted in a 15-point reduction in the
probability of being incarcerated. For example, youth in the treatment group had an 18
percent chance of being incarcerated whereas youth in the comparison groups had a 33
percent chance of being incarcerated.
Treatment and Pre-TC Predicting Incarceration. The second model examined the
predictive ability of treatment compared to the pre-TC group on whether a youth was
recommitted. There were two significant factors in the logistic regression predicting
recommitment; age and the group variable. Younger youth and those who participated in the
pre-TC were more likely to be incarcerated.
The log-odds probabilities are shown in Figure 8. Again, there is a linear negative
relationship between age at discharge and probability of recidivating. A two year difference
in age resulted in a 12-point decrease in the probability of incarceration. When examining the
effectiveness of the treatment compared to the pre-TC treatment, the results suggest that
Mohican’s therapeutic community was more effective in reducing recidivism than the pre-
TC. For example, the treatment group had a 16 percent probability of recidivating compared
to the pre-TC group, which had a 35 percent probability of recidivating. Thus, participating
in the therapeutic community resulted in a 19-point decrease in the probability of having a
new period of incarceration.
Treatment and DYS Group Predicting Incarceration. The third model that was
analyzed examined the effectiveness of the therapeutic community treatment and DYS
minimal treatment for predicting incarceration. The results reveal that four variables are
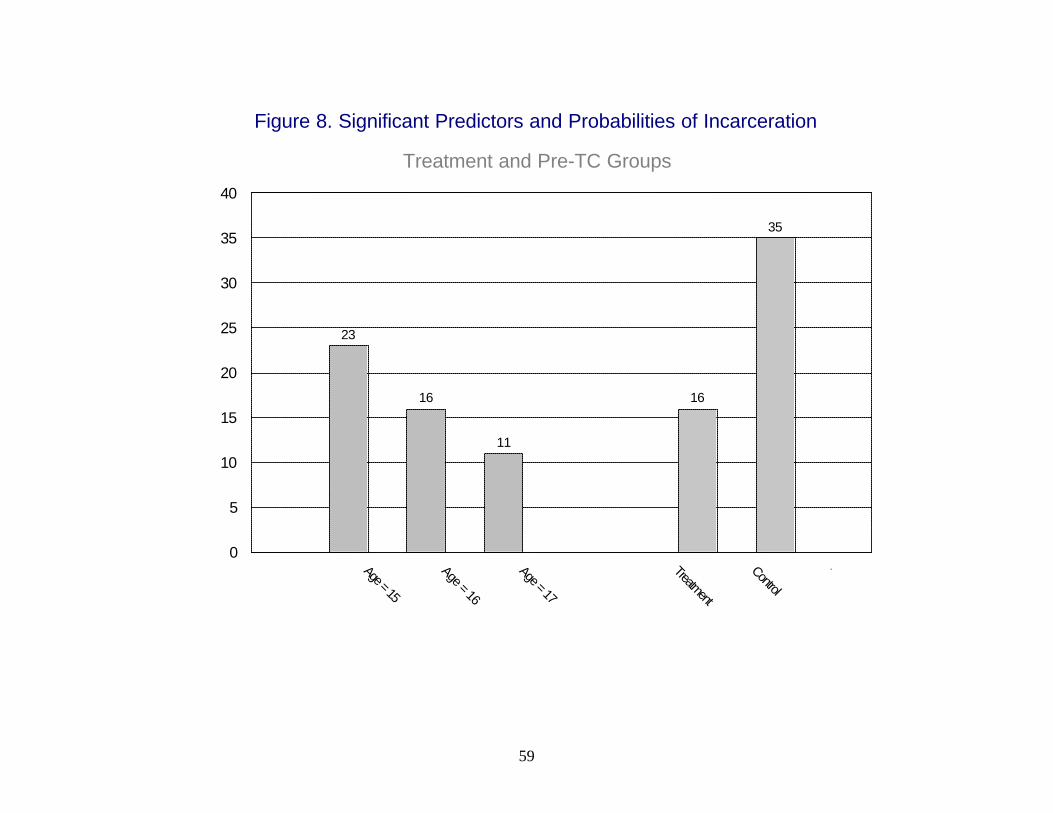
59
Figure 8. Significant Predictors and Probabilities of Incarceration
Treatment and Pre-TC Groups
23
16
11
16
35
Age = 15
Age = 16
Age = 17
Treatment
Control
.0
5
10
15
20
25
30
35
40
60
significant predictors of being committed to an institution – age, felony level, JASAE score,
and the group variable. Again, younger youth, youth with a less serious committing offense,
youth with a higher JASAE score, and youth that participated in the treatment group were
more likely to be incarcerated after termination.
Figure 9 shows the probabilities of recidivating for the treatment group and the DYS
group. Again, there was a negative linear relationship between age at discharge and
commitment to an institution. A 15 year-old had a 46 percent chance of being incarcerated
whereas a 17 year-old had a 22 percent chance of being incarcerated. Thus, a two-year
difference in age resulted in a 24-point difference in being incarcerated after termination.
Youth who were committed to Mohican or DYS on a less serious charge (felony 5)
had a 37 percent chance of being incarcerated while youth committed on a more serious
charge (felony 3) had a 30 percent chance of being incarcerated. Those with a higher JASAE
score (score of 61) had a 37 percent chance of being incarcerated while those with a JASAE
score of 33 had a 29 percent chance of being incarcerated.
The other variable that was a significant predictor for this model was the group
variable. The treatment group had an 18 percent chance of being placed in an institution and
the DYS group had a 33 percent chance of being placed in an institution. Thus, Mohican’s
treatment resulted in a 15-point reduction in the probability of being incarcerated when
compared to the DYS group.
Model Predicting Outcome for the Treatment Group Only. A logistic regression
model was computed to determine what variables were significant predictors of outcome for
the treatment group only. Ten variables were included in the model: race, highest grade
completed, felony degree, age at first arrest, participation in previous treatment, JASAE
61
Figure 9. Significant Predictors and Probabilities of Incarceration
Treatment and DYS Groups
46
33
22
37
3330 29
3337
18
33
Age = 15
Age = 16
Age = 17
Felony level = F5
Felony level = F4
Felony level = F3
JASAE score = 33
JASAE score = 47
JASAE score = 61
Treatment
Control
.0
10
20
30
40
50
60
62
score, type of termination, Y-LSI score, length of time in treatment, and time at risk in the
community. There was only one significant predictor of incarceration – time at risk. The
longer amount of time the youth spent in the community, the more likely they were to be
incarcerated.20 The insignificant findings for the variables are not surprising given the fact
that Mohican’s population is at a high risk for recidivism. Therefore, there is little variation
between the youth on these characteristics.
DISCUSSION
Limitations of the Study
The conclusions of this outcome evaluation are limited by the amount of missing data
for the comparison groups on some variables. For example, the finding of a treatment effect
for Mohican’s therapeutic community could be strengthened if the study was able to control
for services received after termination from Mohican or DYS. However, this type of
information was not known for the comparison group and for less than half of the treatment
group. In addition, other information such as number of prior arrests and commitments were
not available for the pre-TC and the DYS. Therefore, the current study could not control for
these factors.
Another limitation of the study was that random assignment to groups was not
possible. Random assignment to groups would have allowed the groups to be very similar
and would have strengthened any findings of a treatment effect. Since random assignment
was not available, there were significant differences on some background characteristics.
These characteristics had to be controlled for when predicting outcome.
20 The model was also ran without time at risk as a predictor. The other nine variables were not significant predictors of incarceration.
63
The amount of follow-up time available for the groups was also a limitation. The
current study only tracked the youth for a period up to 21 months after they left Mohican or
DYS. The amount of time at risk may not be long enough to adequately assess the long-term
effects of Mohican’s RSAT program.
General Conclusions
First, it appears that Mohican is targeting an appropriate population for the type of
intensive treatment provided by the institution. The data reveal that the majority of Mohican
participants have substantial criminal histories and are at moderate to high risk of recidivism
according to the Y-LSI. JASAE scores revealed that all participants scored 21 or above on
the JASAE indicating a severe substance abuse problem and the need for residential
treatment. JASAE scores ranging from 17 to 74, however, suggest a broad range in the
severity of substance abuse problems among Mohican participants.
Second, Mohican has changed treatment modalities from a 12-step residential
substance abuse model to a therapeutic community. Mohican’s therapeutic community has
some cognitive components such as teaching youth to identify triggers, but the main
emphasis is on the environment and interactions of the youth in changing behavior. For
example, the therapeutic community allow the youth to have more control over their
treatment by providing them opportunities to confront others antisocial behaviors and to
direct the treatment in the morning and evening meetings.
When examining the intermediate outcomes, participation in Mohican reduced
youths’ levels of depression and increased youths’ self-esteem and decision-making ability.
However, participation in treatment increased youths’ level of hostility. These factors,

64
however, were not correlated with outcome for the treatment group 21. This finding is not
surprising given the risk and need principle. Prior research has shown that depression and
self-esteem are not strong predictors of recidivism. They may, however, be responsivity
issues that can impede the treatment process, and thus should be addressed.
Fourth, the rate of program completion is high (82.1%). This may be due to the fact
that once placed in treatment, most infractions were handled within the institution and did not
necessitate the removal of youth to other institutions. Successful release from the program,
however, should not be confused with progress in treatment for two reasons: 1) during the
CPAI, it was revealed that a youth’s movement through the program was more dependent on
the completion of their sentence than it was on the acquisition of prosocial attitudes and
behaviors and 2) the results of the service tracking form indicated that only 136 youth
actually completed the last phase of treatment.
Last, Table 17 reviews the significant predictors across all models. Age was a
significant predictor of incarceration for all three models. Younger youth were more likely to
be incarcerated after termination. Felony level and JASAE score was significant two models:
all groups combined and treatment and DYS group predicting outcome. Thus, youth who had
been committed on a more serious offense and youth who had more serious levels of
substance abuse were more likely to be incarcerated after release. Highest grade completed
was only significant when examining all groups combined.
The last significant predictor of incarceration was the group variable. In all three
models, participation in Mohican’s therapeutic community RSAT program significantly
21 A bivariate correlation was computed between depression and incarceration after termination and between self-esteem and incarceration after termination. These variables were not correlated with incarceration. In addition, these variables were included in a logistic regression model predicting outcome. They were not significant predictors of incarceration after termination.
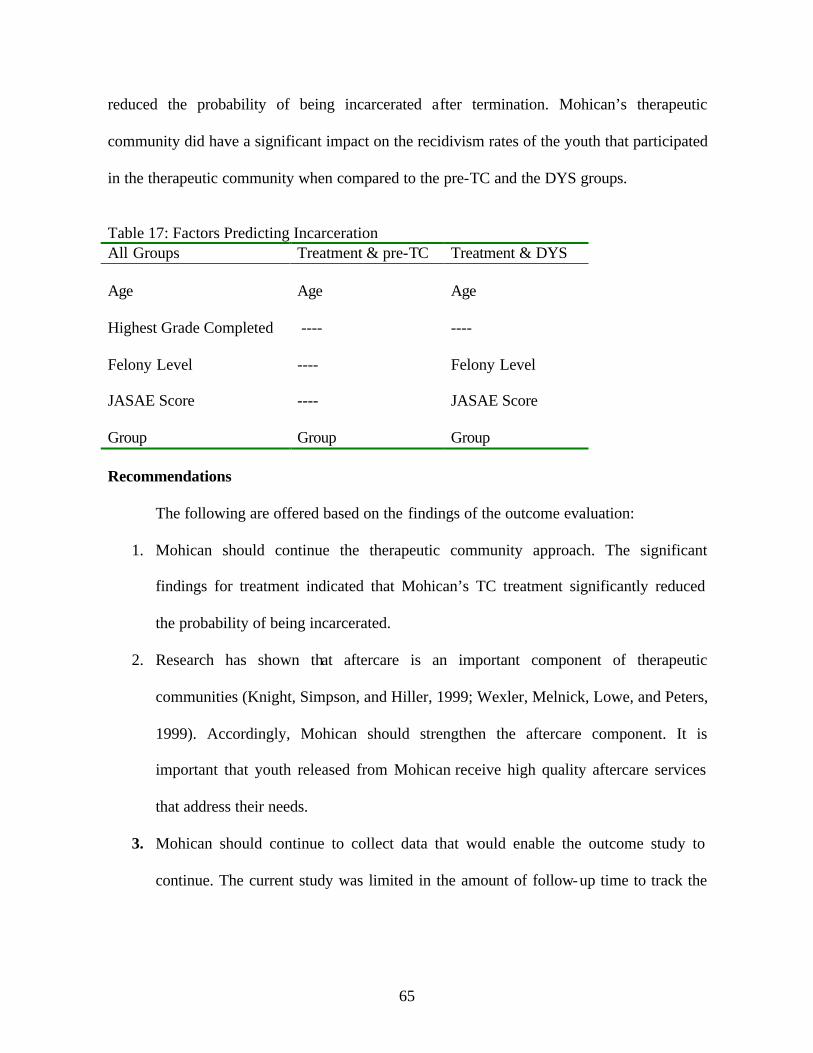
65
reduced the probability of being incarcerated after termination. Mohican’s therapeutic
community did have a significant impact on the recidivism rates of the youth that participated
in the therapeutic community when compared to the pre-TC and the DYS groups.
Table 17: Factors Predicting Incarceration All Groups Treatment & pre-TC Treatment & DYS Age Age Age Highest Grade Completed ---- ---- Felony Level ---- Felony Level JASAE Score ---- JASAE Score Group Group Group Recommendations
The following are offered based on the findings of the outcome evaluation:
1. Mohican should continue the therapeutic community approach. The significant
findings for treatment indicated that Mohican’s TC treatment significantly reduced
the probability of being incarcerated.
2. Research has shown that aftercare is an important component of therapeutic
communities (Knight, Simpson, and Hiller, 1999; Wexler, Melnick, Lowe, and Peters,
1999). Accordingly, Mohican should strengthen the aftercare component. It is
important that youth released from Mohican receive high quality aftercare services
that address their needs.
3. Mohican should continue to collect data that would enable the outcome study to
continue. The current study was limited in the amount of follow-up time to track the
66
youth. However, if Mohican continues the study, research can further examine the
long-term effects of the therapeutic community RSAT program.
67
REFERENCES ADE Incorporated. (1997). Juvenile Automated Substance Abuse Evaluation Reference Guide. Clarkston, MI: Author. Antonwicz, D.H. and Ross, R.R. (1994). “Essential components of successful rehabilitation programs for offenders.” International Journal of Offender Therapy and Comparative Criminology, 38(2): 97-104. Barriga, A. Q., Gibbs, J. C., Potter, G., and Liau, A. K. (1999) How I Think Questionnaire. Brook, R. C., and Whitehead, P. C. (1980). “Treatment of Drug Abuse.” In M. Tonry and J. Q. Wilson (Eds.), Drugs and Crime. Chicago: The University of Chicago Press. DeLeon, G. (1990a). “Treatment Strategies.” In J. Inciardi (Ed.), Handbook of Drug Control in the United States (pp. 115-138). Westport: Greenwood Press. DeLeon, G. (1990b). “Effectiveness of Therapeutic Communities.” In J. J. Platt, C. D. Kaplin, and P. J. McKim (Eds.), The Effectiveness of Drug Abuse Treatment: Dutch and American Perspectives (pp. 113-126). Malabar, FL: Robert E. Krieger Publishing. DeLeon, G. and Ziegenfuss, J. T. (1986). Therapeutic Communities for Addictions: Readings in Theory, Research and Practice. Springfield, IL: Charles C. Thomas Publisher. DeLeon, G. and Rosenthal, M. (1979). “Therapeutic Communities.” In R. L. Dupont, A. Goldstein, and J. O’Donnell (Eds.), Handbook on Drug Abuse (pp. 39-48). Washington, D.C.: U.S. Government Printing Office. Faupel, C. E. (1981). “Drug Treatment and Criminality: Methodological and Theoretical Considerations.” In J. A. Inciardi (Ed.), The Drugs Crime Connection (pp. 183-206). Beverly Hills: Sage. Gendreau, P. and Andrews, D. A. (1994). Correctional Program Assessment Inventory (4th ed.). St. John, New Brunswick: University of New Brunswick. Holsinger, A.M. (1999). Opening the Black Box : Assessing the Relationship between Program Integrity and Recidivism. (Dissertation). Ann Arbor, MI: UMI. Inciardi, J. A., Martin, S. S., Butzin, C. A., Hooper, R. M., and Harrison, L. D. (1997). “An Effective Model of Prison-Based Treatment for Drug-Involve Offenders.” Journal of Drug Issues,27(2): 261-278. Knight, K., Simpson, D. D., and Hiller, M. L. (1999). “Three-Year Reincarceration Outcomes for In-Prison Therapeutic Community Treatment in Texas.” The Prison Journal,79(3): 337-351.
68
National Institute of Justice. (1998). 1997 Drug Use Forecasting Annual Report on Adult and Juvenile Arrestees. Washington, DC: Author, U.S. Department of Justice. Sandhu, T. S. (1981). “The Effectiveness of Community-Based Correctional Programs.” in S. Sandhu (Ed.), Community Corrections: New Horizons (pp. 296-351). Springfield: BannerStone House. Simpson, D. D. (1984). “National Treatment System Based on the Drug Abuse Reporting Program (DARP) Follow-up Research.” In F. Tims and J. Ludford (Eds.), Drug Abuse Treatment Evaluation: Strategies, Progress, and Prospects (pp. 29-41). National Institute on Drug Abuse Research Monograph No. 51. Rockville, MD: U.S. Department of Health and Human Services, National Institute on Drug Abuse. Simpson, D. D. and Knight, K. (1998). TCU Data Collection Forms for Correctional Residential Treatment. Fort Worth: Texas Christian University, Institute of Behavioral Research [On-line]. Available: www.ibr.tcu.edu. Snyder, H. N. (1999). “Juvenile Arrests 1998.” OJJDP Juvenile Justice Bulletin. Washington, DC: OJJDP, U.S. Department of Justice. Van Voorhis, P. and G. Hurst. (2000). “Treating substance abuse in offender populations.” In P. Van Voorhis, M. Braswell, and D. Lester (Eds.), Correctional Counseling and Rehabilitation (pp. 265-288). Cincinnati, OH: Anderson Publishing Co. Wexler, H. K. (1995). “The Success of Therapeutic Communities for Substance Abusers in American Prisons.” Journal of Psychoactive Drugs,27(1): 57-66. Wexler, H. K., Melnick, G., Lowe, L., and Peters, J. (1999). “Three-Year Reincarceration Outcomes for Amity In-Prison Therapeutic Community and Aftercare in California.” The Prison Journal,79(3): 321-336. Yochelson, S. and Samenow, S. E. (1976). The Criminal Personality: A Profile for Change. New York, NY: Jason Aronson.
APPENDIX A
DATA COLLECTION INSTRUMENTS
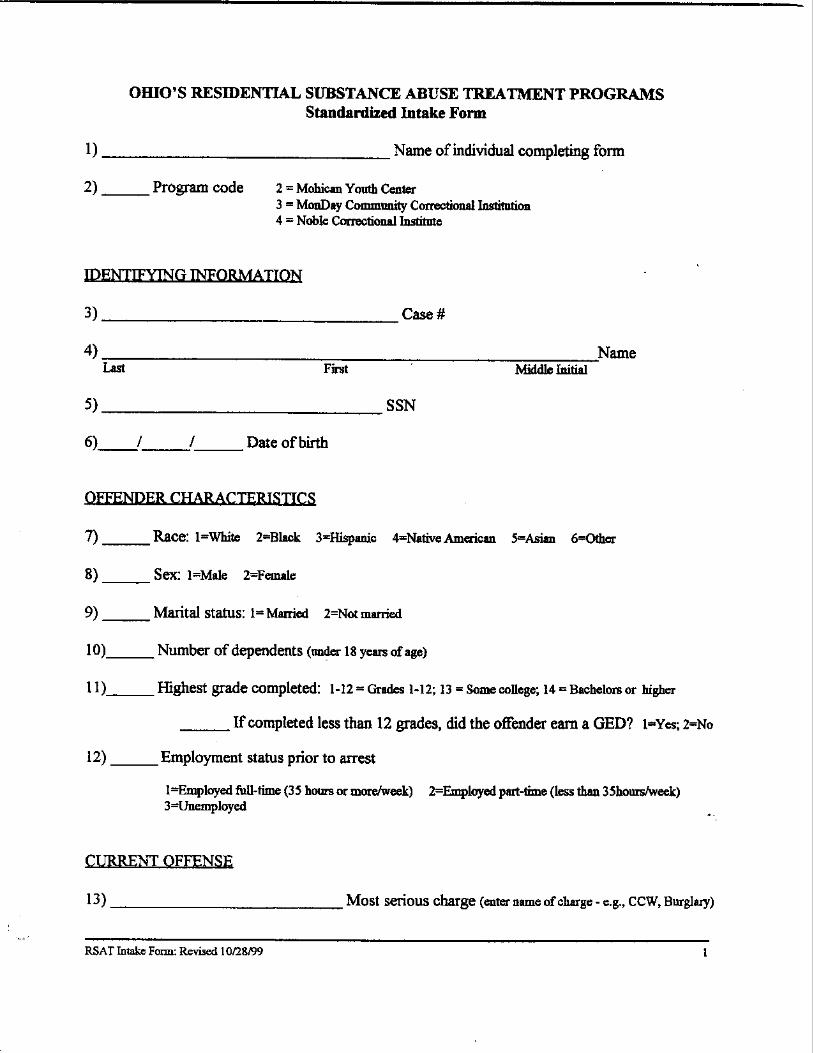
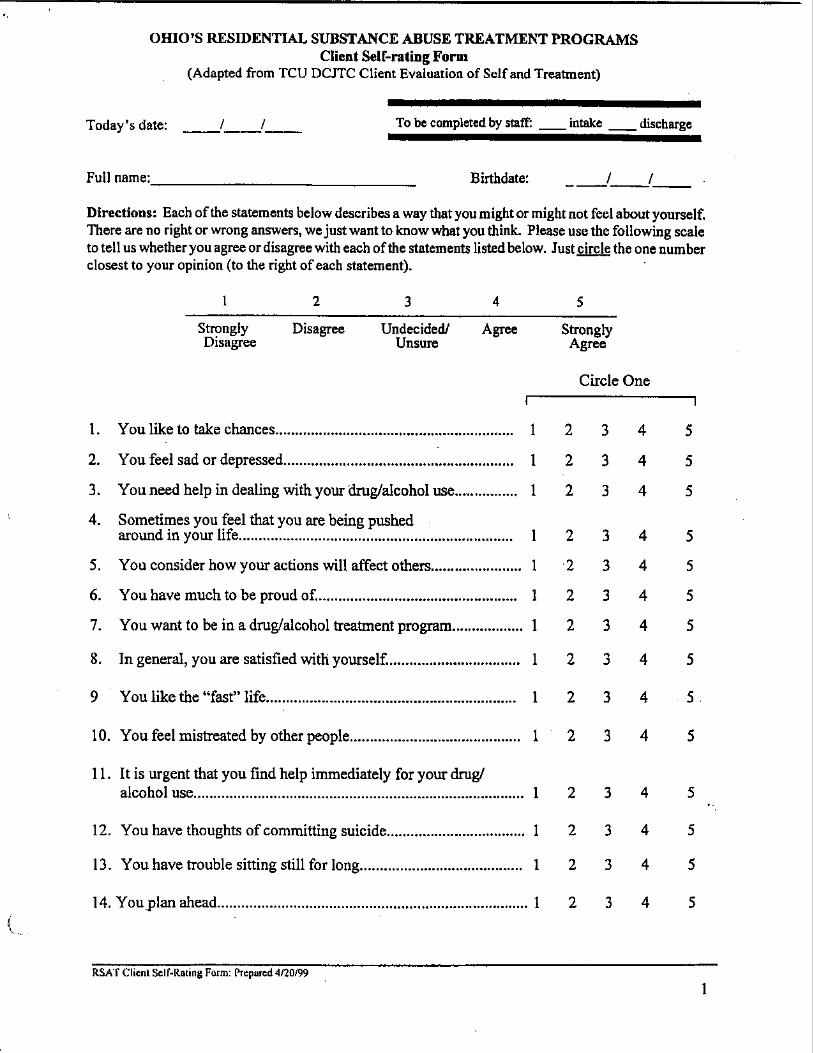
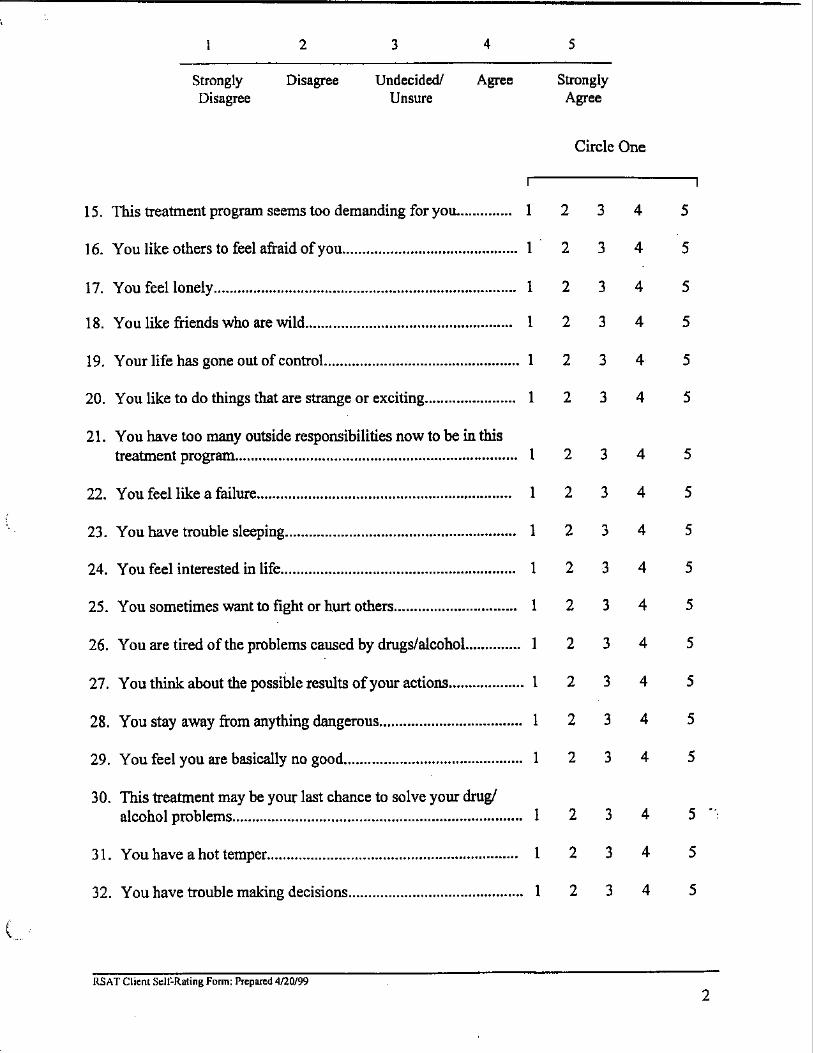
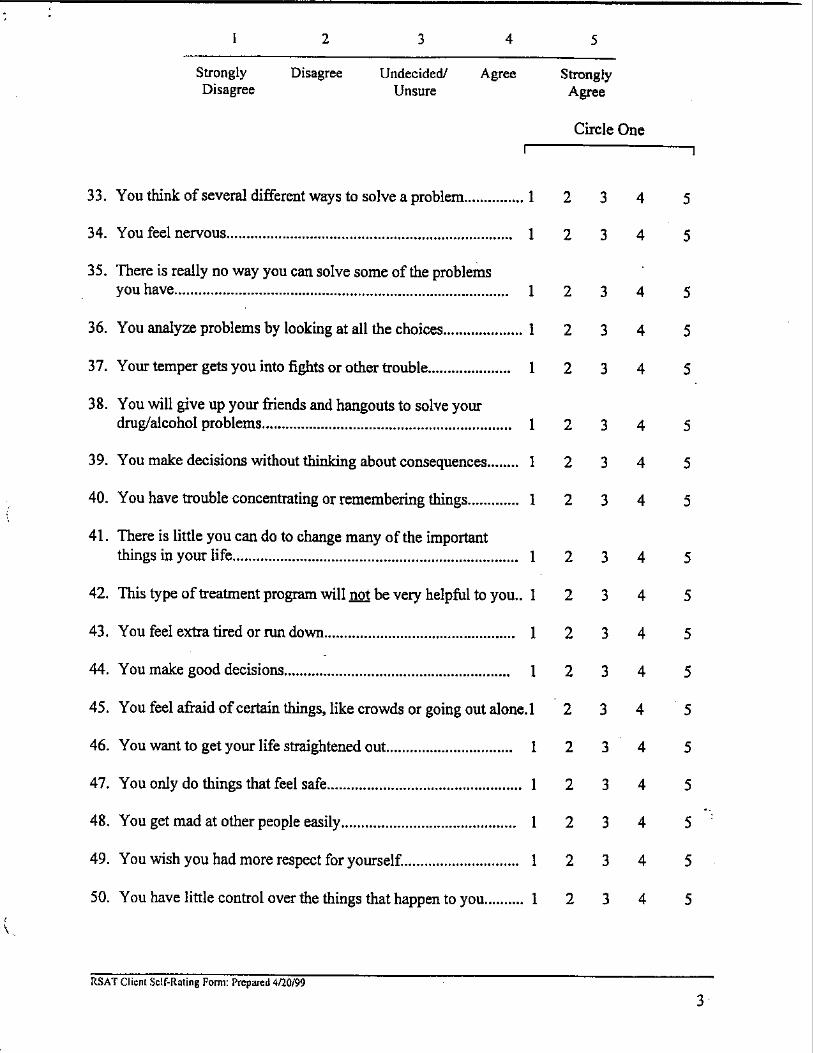
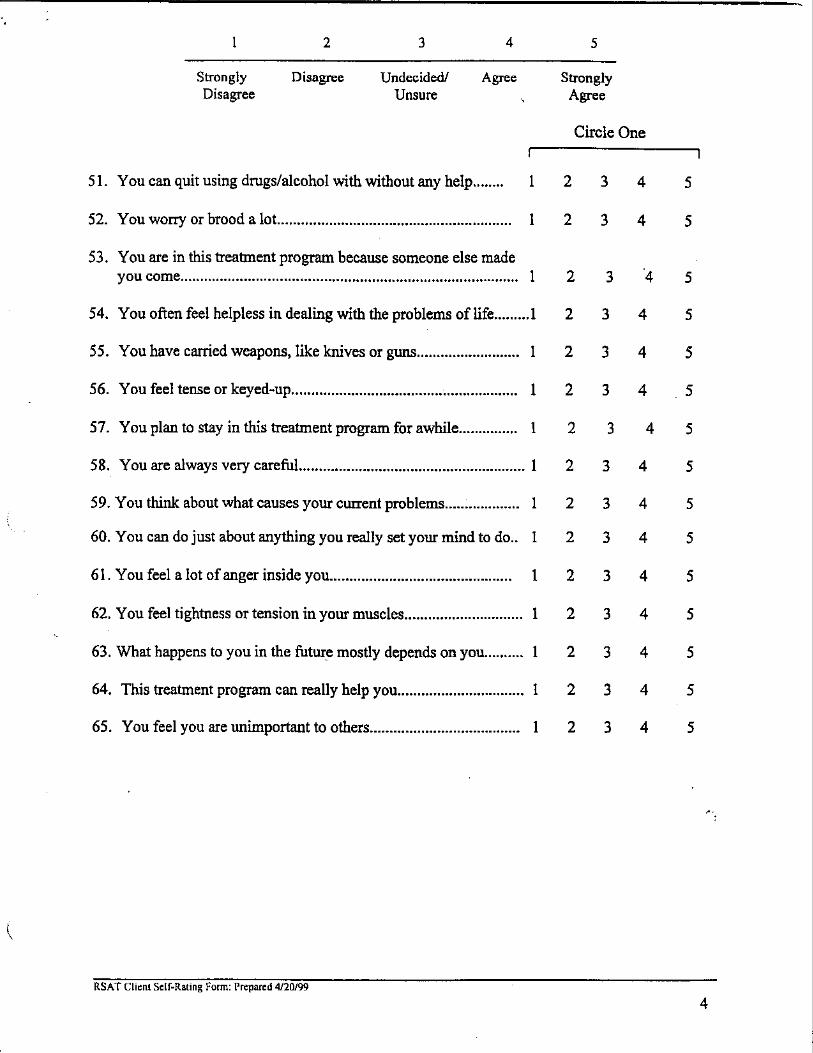
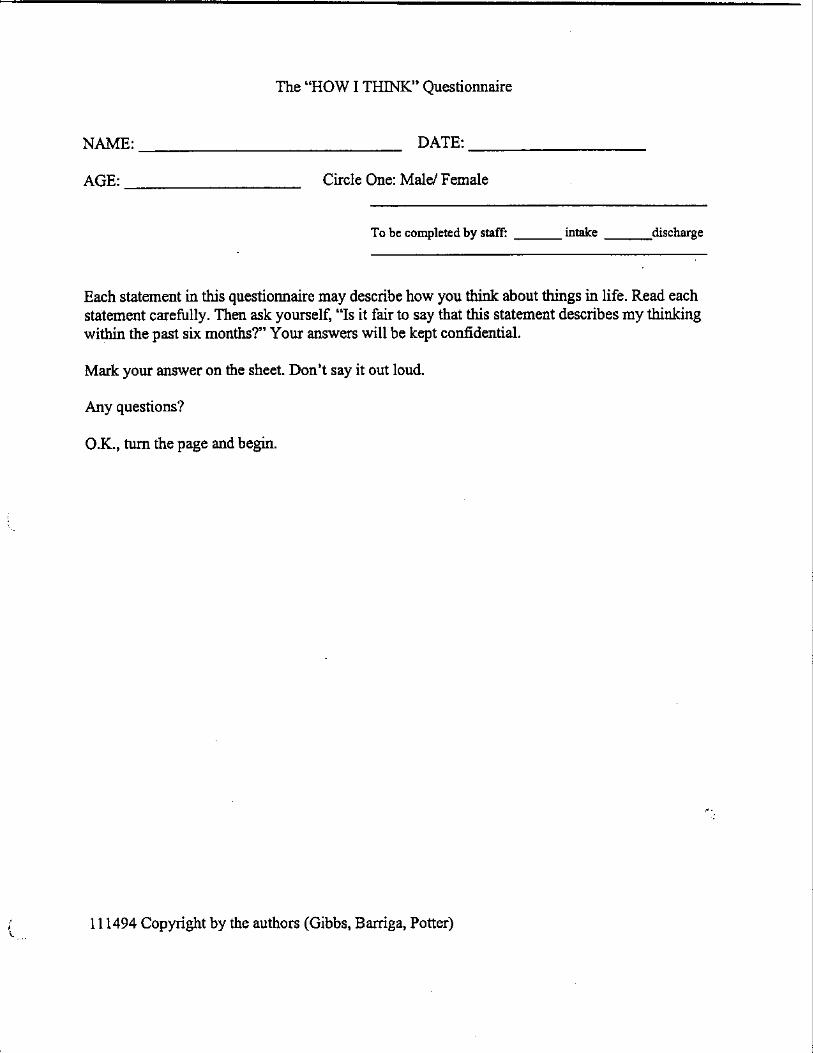
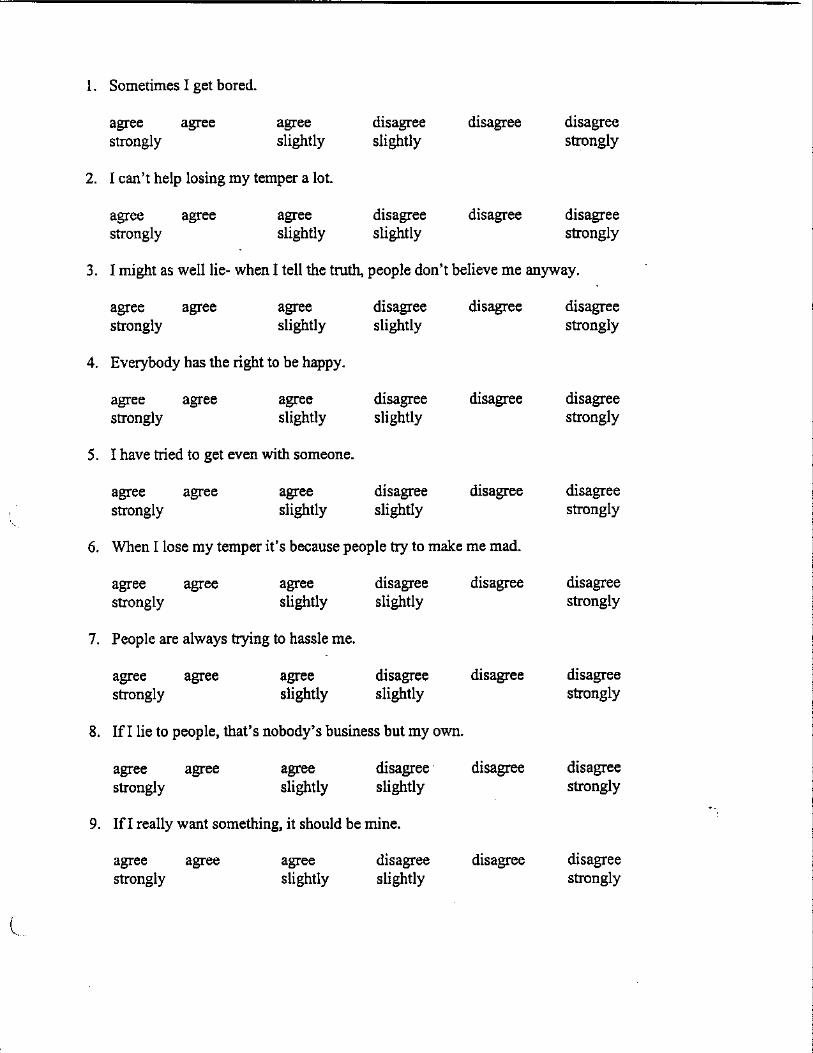
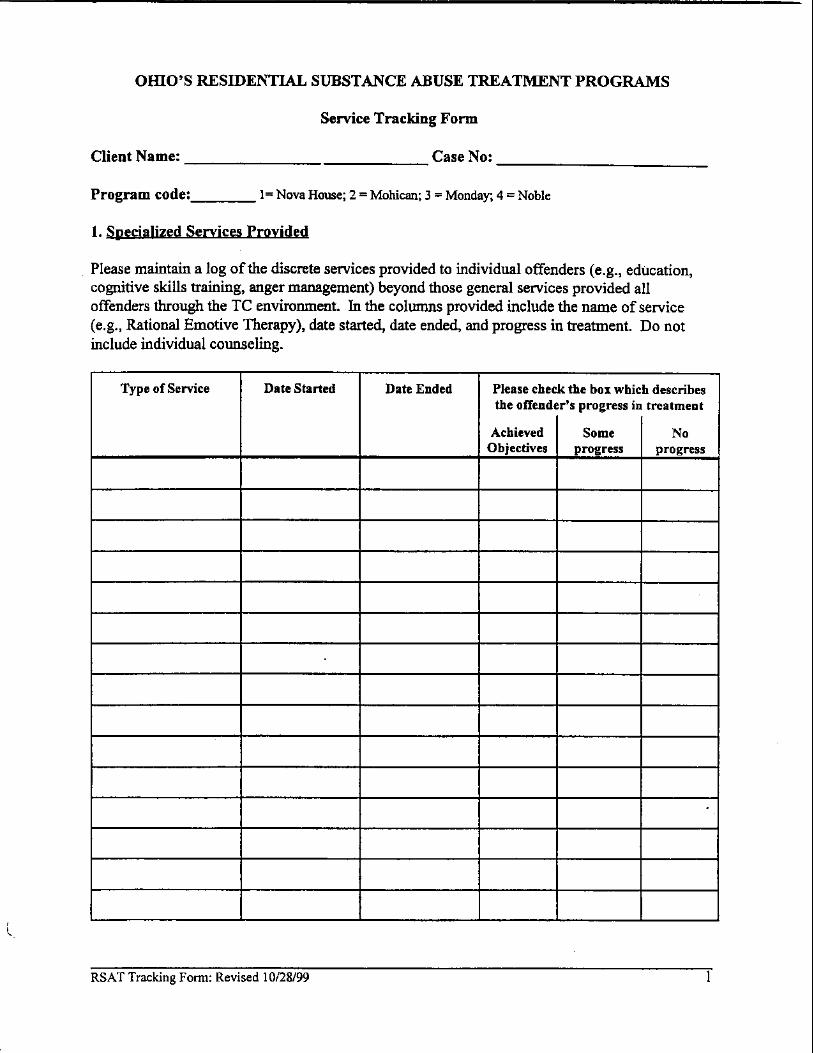
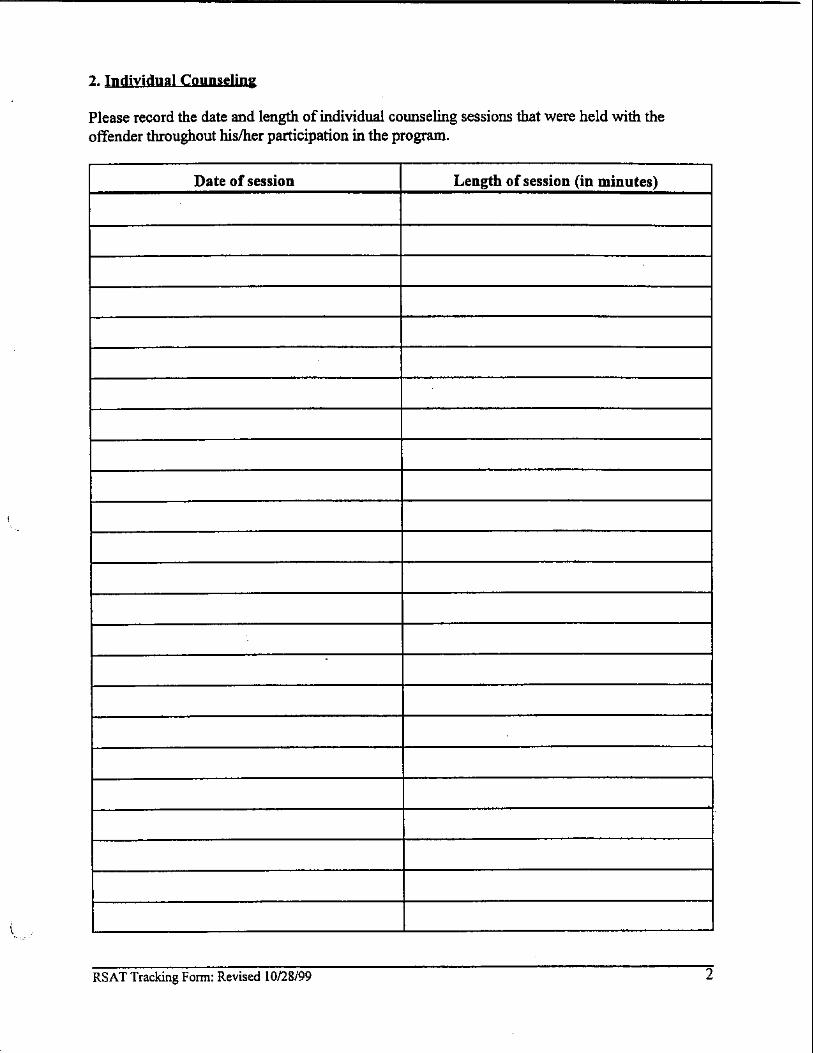
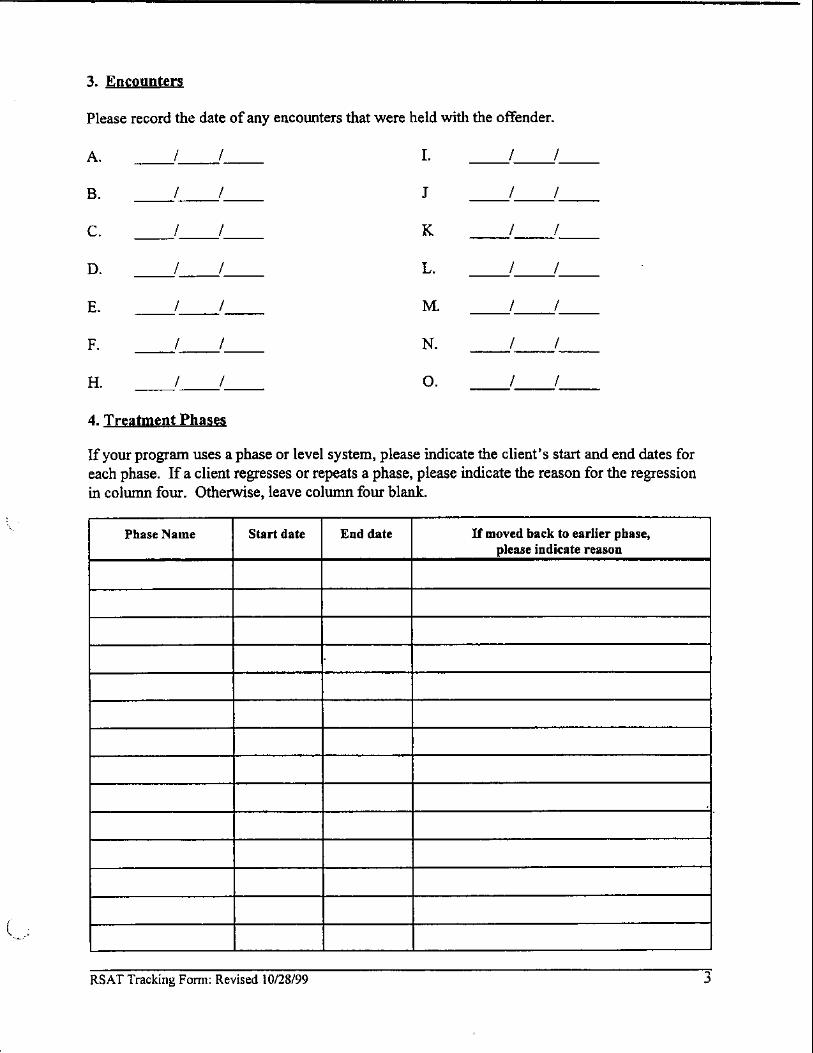

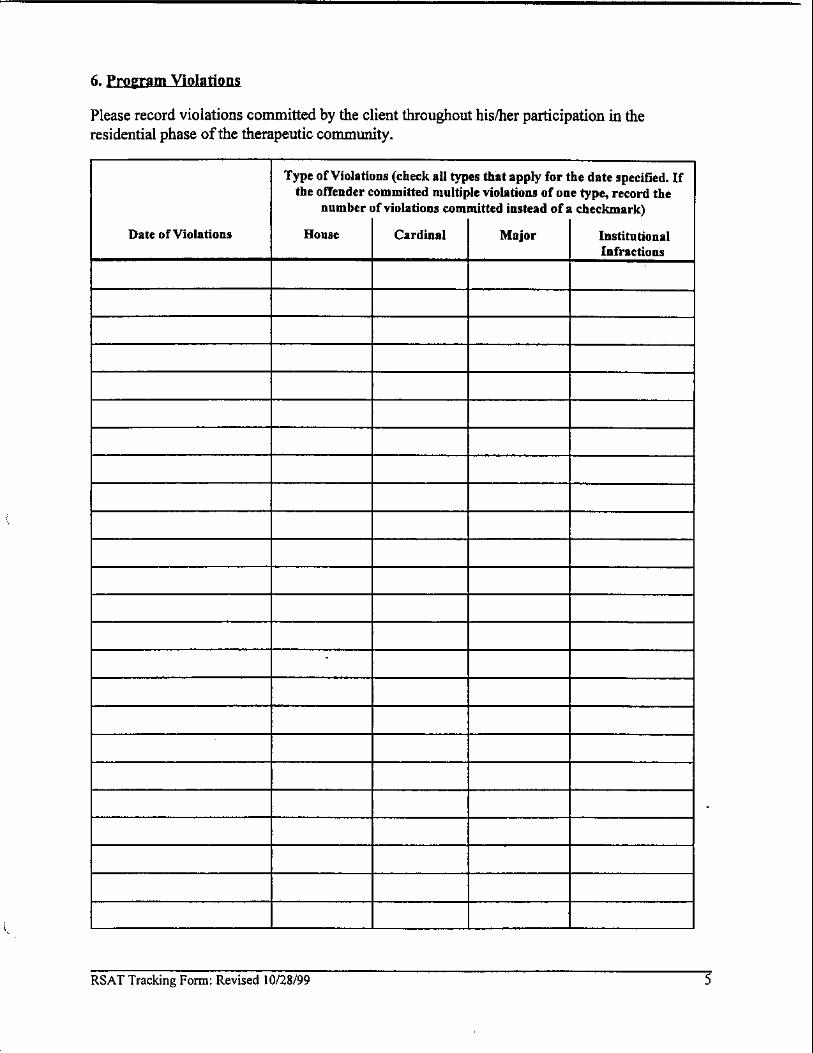

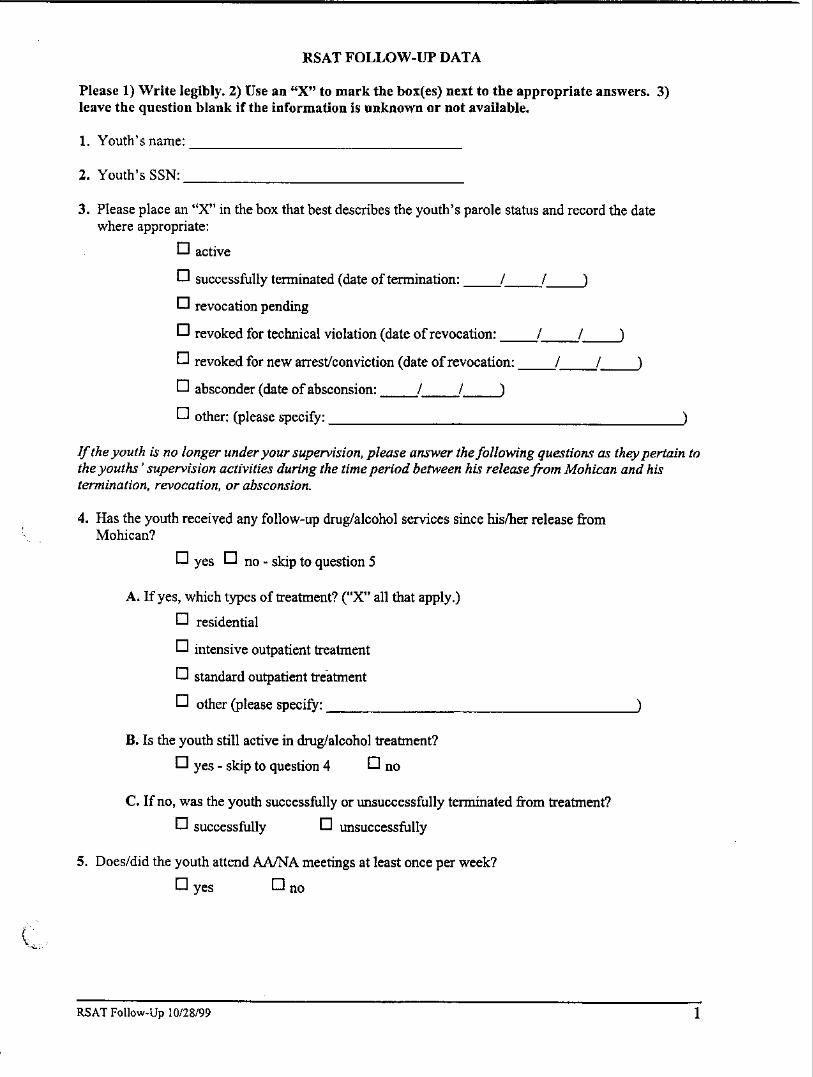
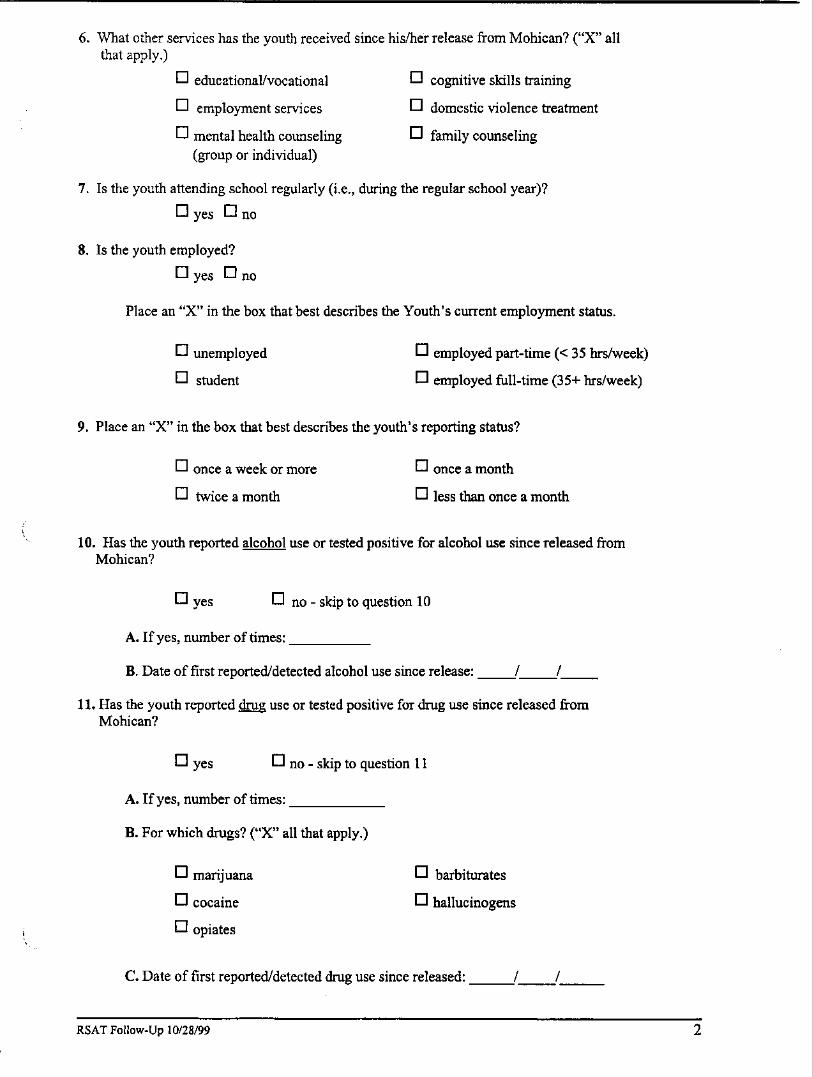
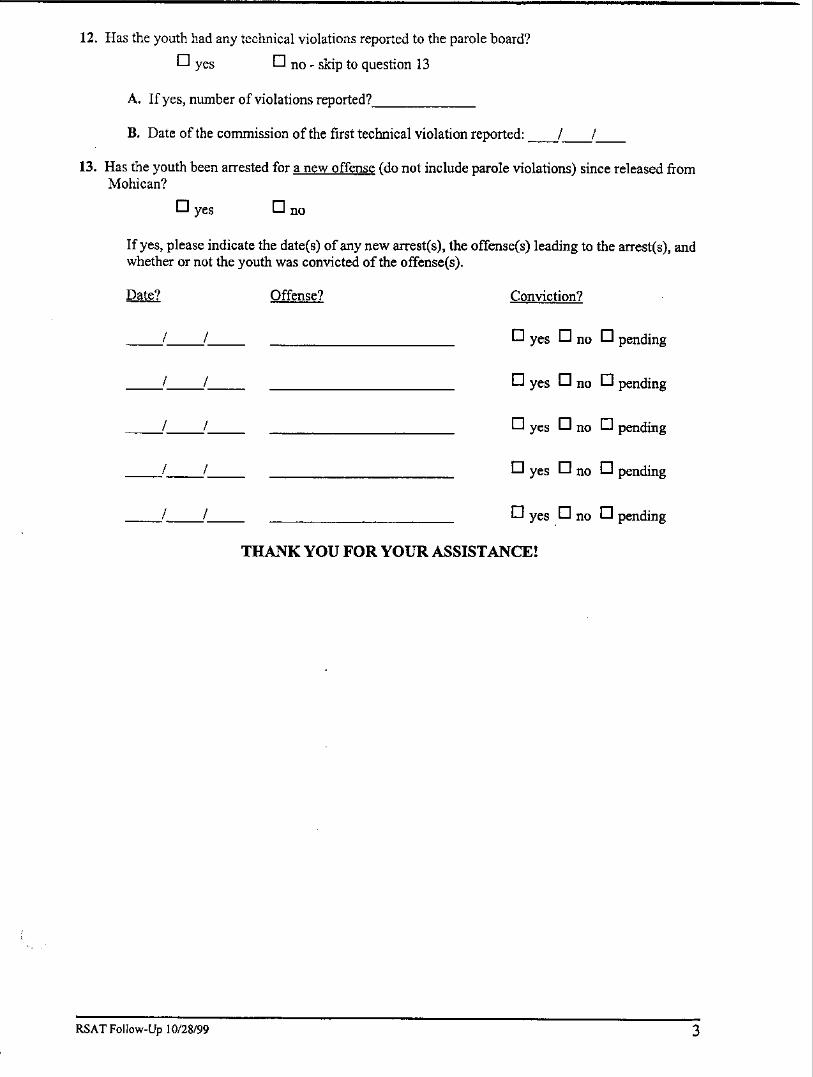
APPENDIX B
DESCRIPTIVE STATISTICS
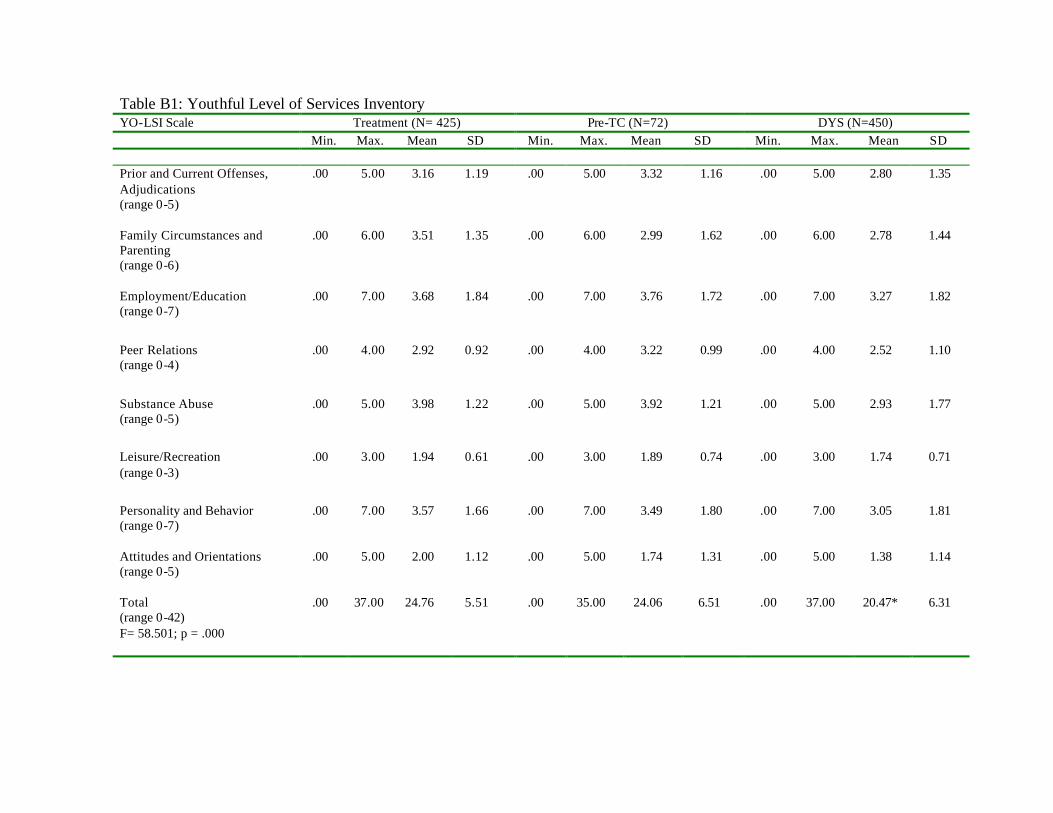
Table B1: Youthful Level of Services Inventory YO-LSI Scale Treatment (N= 425) Pre-TC (N=72) DYS (N=450) Min. Max. Mean SD Min. Max. Mean SD Min. Max. Mean SD Prior and Current Offenses, Adjudications (range 0-5)
.00 5.00 3.16 1.19 .00 5.00 3.32 1.16 .00 5.00 2.80 1.35
Family Circumstances and Parenting (range 0-6)
.00 6.00 3.51 1.35 .00 6.00 2.99 1.62 .00 6.00 2.78 1.44
Employment/Education (range 0-7)
.00 7.00 3.68 1.84 .00 7.00 3.76 1.72 .00 7.00 3.27 1.82
Peer Relations (range 0-4)
.00 4.00 2.92 0.92 .00 4.00 3.22 0.99 .00 4.00 2.52 1.10
Substance Abuse (range 0-5)
.00 5.00 3.98 1.22 .00 5.00 3.92 1.21 .00 5.00 2.93 1.77
Leisure/Recreation (range 0-3)
.00 3.00 1.94 0.61 .00 3.00 1.89 0.74 .00 3.00 1.74 0.71
Personality and Behavior (range 0-7)
.00 7.00 3.57 1.66 .00 7.00 3.49 1.80 .00 7.00 3.05 1.81
Attitudes and Orientations (range 0-5)
.00 5.00 2.00 1.12 .00 5.00 1.74 1.31 .00 5.00 1.38 1.14
Total (range 0-42)
.00 37.00 24.76 5.51 .00 35.00 24.06 6.51 .00 37.00 20.47* 6.31
F= 58.501; p = .000
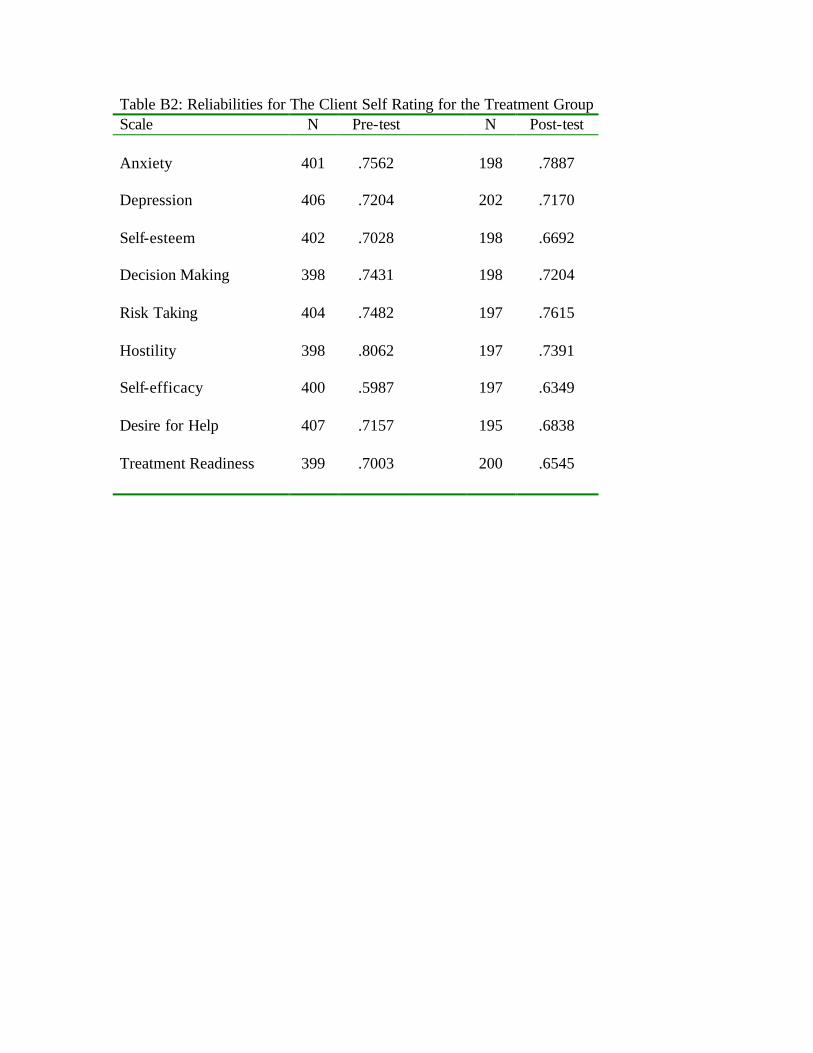
Table B2: Reliabilities for The Client Self Rating for the Treatment Group Scale N Pre-test N Post-test Anxiety 401 .7562 198 .7887 Depression 406 .7204 202 .7170 Self-esteem 402 .7028 198 .6692 Decision Making 398 .7431 198 .7204 Risk Taking 404 .7482 197 .7615 Hostility 398 .8062 197 .7391 Self-efficacy 400 .5987 197 .6349 Desire for Help 407 .7157 195 .6838 Treatment Readiness 399 .7003 200 .6545
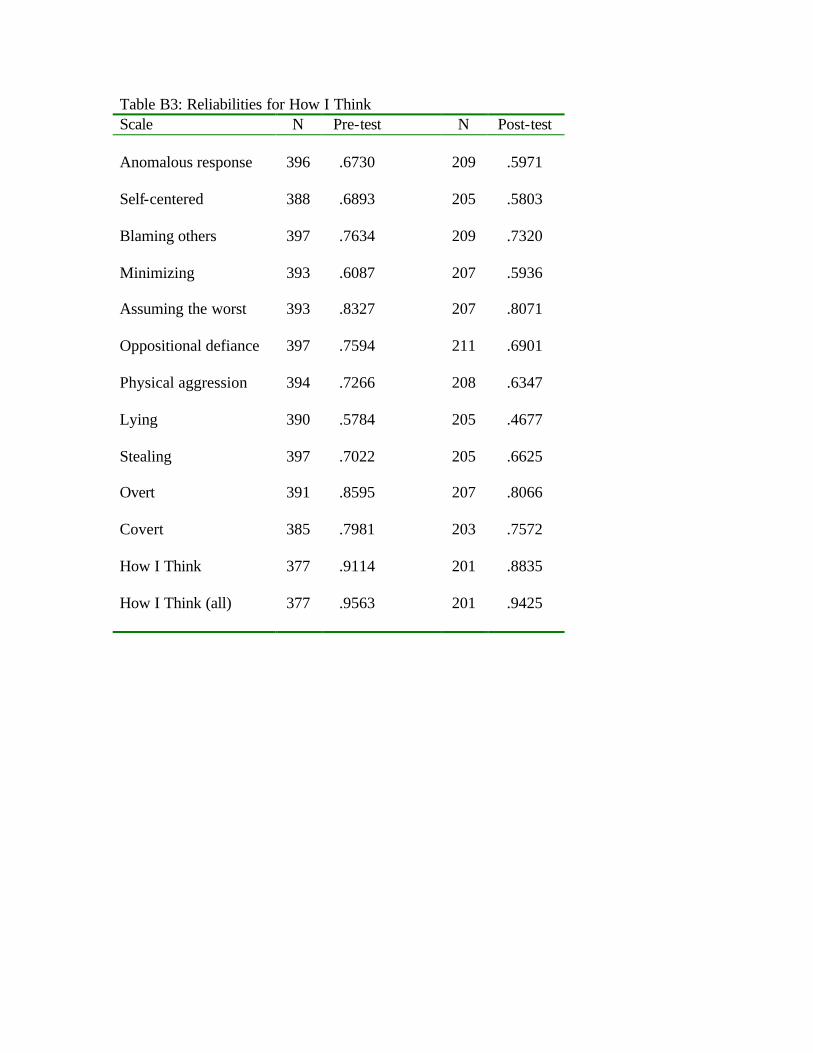
Table B3: Reliabilities for How I Think Scale N Pre-test N Post-test Anomalous response 396 .6730 209 .5971 Self-centered 388 .6893 205 .5803 Blaming others 397 .7634 209 .7320 Minimizing 393 .6087 207 .5936 Assuming the worst 393 .8327 207 .8071 Oppositional defiance 397 .7594 211 .6901 Physical aggression 394 .7266 208 .6347 Lying 390 .5784 205 .4677 Stealing 397 .7022 205 .6625 Overt 391 .8595 207 .8066 Covert 385 .7981 203 .7572 How I Think 377 .9114 201 .8835 How I Think (all) 377 .9563 201 .9425
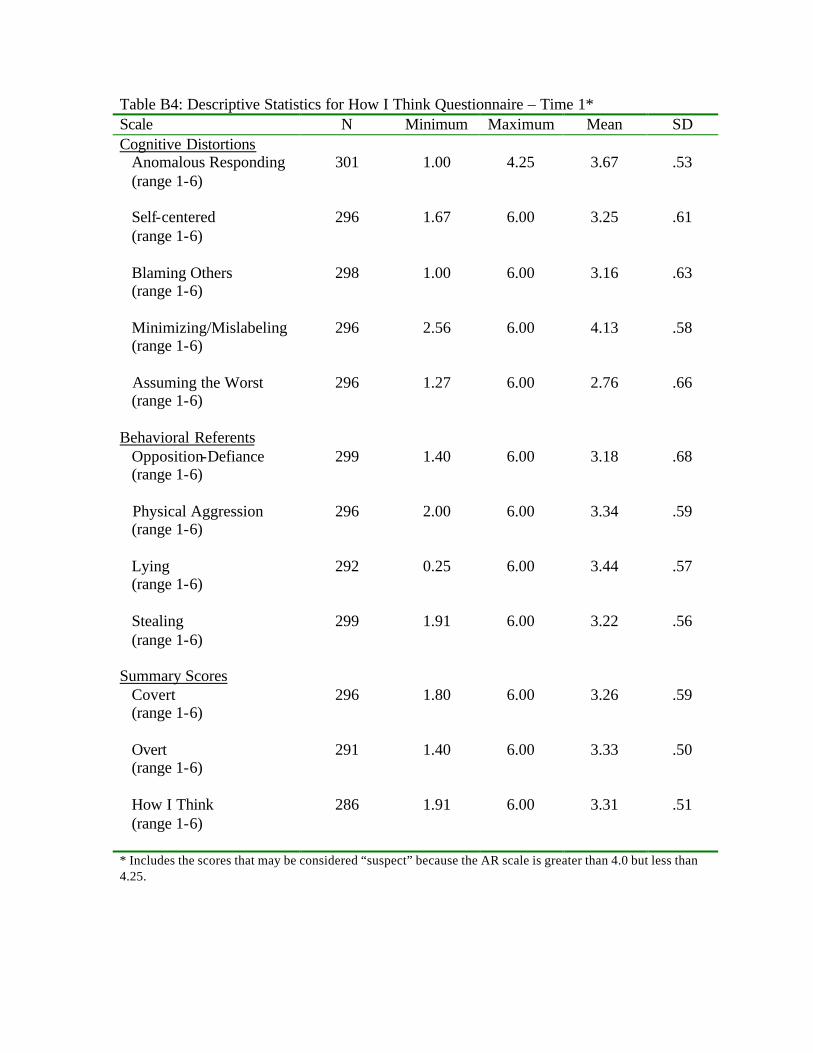
Table B4: Descriptive Statistics for How I Think Questionnaire – Time 1* Scale N Minimum Maximum Mean SD Cognitive Distortions Anomalous Responding (range 1-6)
301 1.00 4.25 3.67 .53
Self-centered (range 1-6)
296 1.67 6.00 3.25 .61
Blaming Others (range 1-6)
298 1.00 6.00 3.16 .63
Minimizing/Mislabeling (range 1-6)
296 2.56 6.00
4.13 .58
Assuming the Worst (range 1-6)
296 1.27 6.00 2.76 .66
Behavioral Referents Opposition-Defiance (range 1-6)
299 1.40 6.00 3.18 .68
Physical Aggression (range 1-6)
296 2.00 6.00 3.34
.59
Lying (range 1-6)
292 0.25 6.00 3.44 .57
Stealing (range 1-6)
299 1.91 6.00 3.22 .56
Summary Scores Covert (range 1-6)
296 1.80 6.00 3.26 .59
Overt (range 1-6)
291 1.40 6.00 3.33 .50
How I Think (range 1-6)
286 1.91 6.00 3.31 .51
* Includes the scores that may be considered “suspect” because the AR scale is greater than 4.0 but less than 4.25.
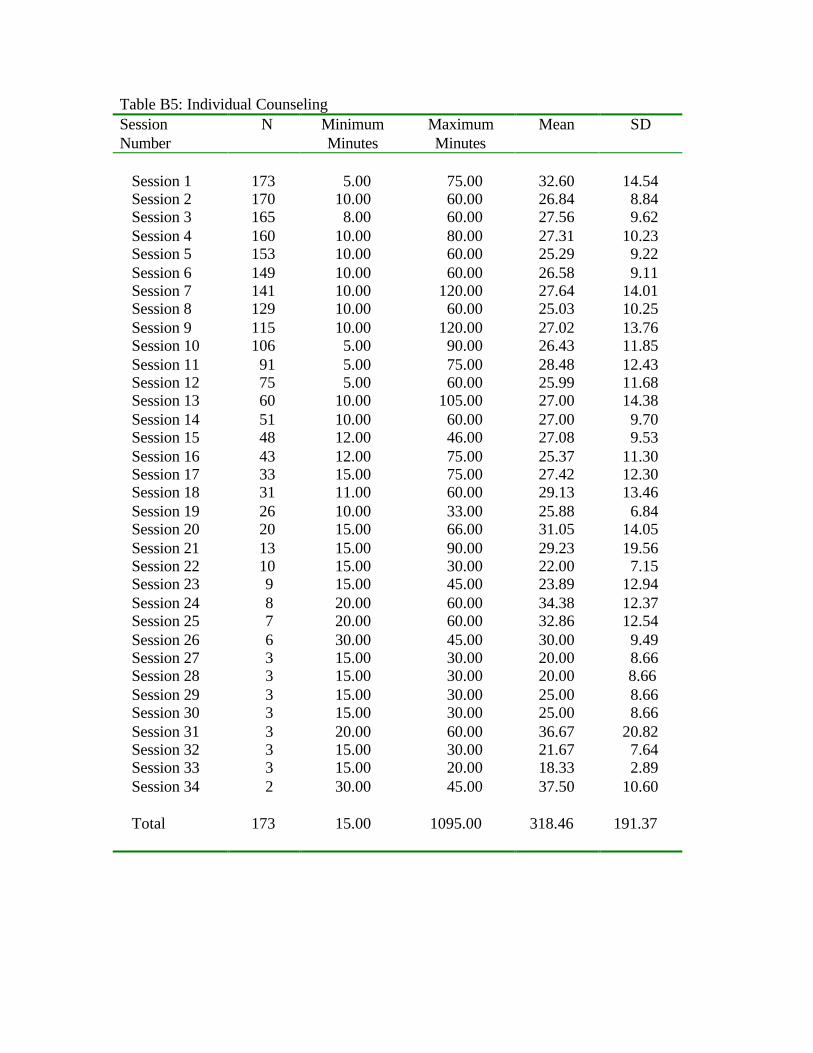
Table B5: Individual Counseling Session Number
N Minimum Minutes
Maximum Minutes
Mean SD
Session 1 173 5.00 75.00 32.60 14.54 Session 2 170 10.00 60.00 26.84 8.84 Session 3 165 8.00 60.00 27.56 9.62 Session 4 160 10.00 80.00 27.31 10.23 Session 5 153 10.00 60.00 25.29 9.22 Session 6 149 10.00 60.00 26.58 9.11 Session 7 141 10.00 120.00 27.64 14.01 Session 8 129 10.00 60.00 25.03 10.25 Session 9 115 10.00 120.00 27.02 13.76 Session 10 106 5.00 90.00 26.43 11.85 Session 11 91 5.00 75.00 28.48 12.43 Session 12 75 5.00 60.00 25.99 11.68 Session 13 60 10.00 105.00 27.00 14.38 Session 14 51 10.00 60.00 27.00 9.70 Session 15 48 12.00 46.00 27.08 9.53 Session 16 43 12.00 75.00 25.37 11.30 Session 17 33 15.00 75.00 27.42 12.30 Session 18 31 11.00 60.00 29.13 13.46 Session 19 26 10.00 33.00 25.88 6.84 Session 20 20 15.00 66.00 31.05 14.05 Session 21 13 15.00 90.00 29.23 19.56 Session 22 10 15.00 30.00 22.00 7.15 Session 23 9 15.00 45.00 23.89 12.94 Session 24 8 20.00 60.00 34.38 12.37 Session 25 7 20.00 60.00 32.86 12.54 Session 26 6 30.00 45.00 30.00 9.49 Session 27 3 15.00 30.00 20.00 8.66 Session 28 3 15.00 30.00 20.00 8.66 Session 29 3 15.00 30.00 25.00 8.66 Session 30 3 15.00 30.00 25.00 8.66 Session 31 3 20.00 60.00 36.67 20.82 Session 32 3 15.00 30.00 21.67 7.64 Session 33 3 15.00 20.00 18.33 2.89 Session 34 2 30.00 45.00 37.50 10.60 Total 173 15.00 1095.00 318.46 191.37
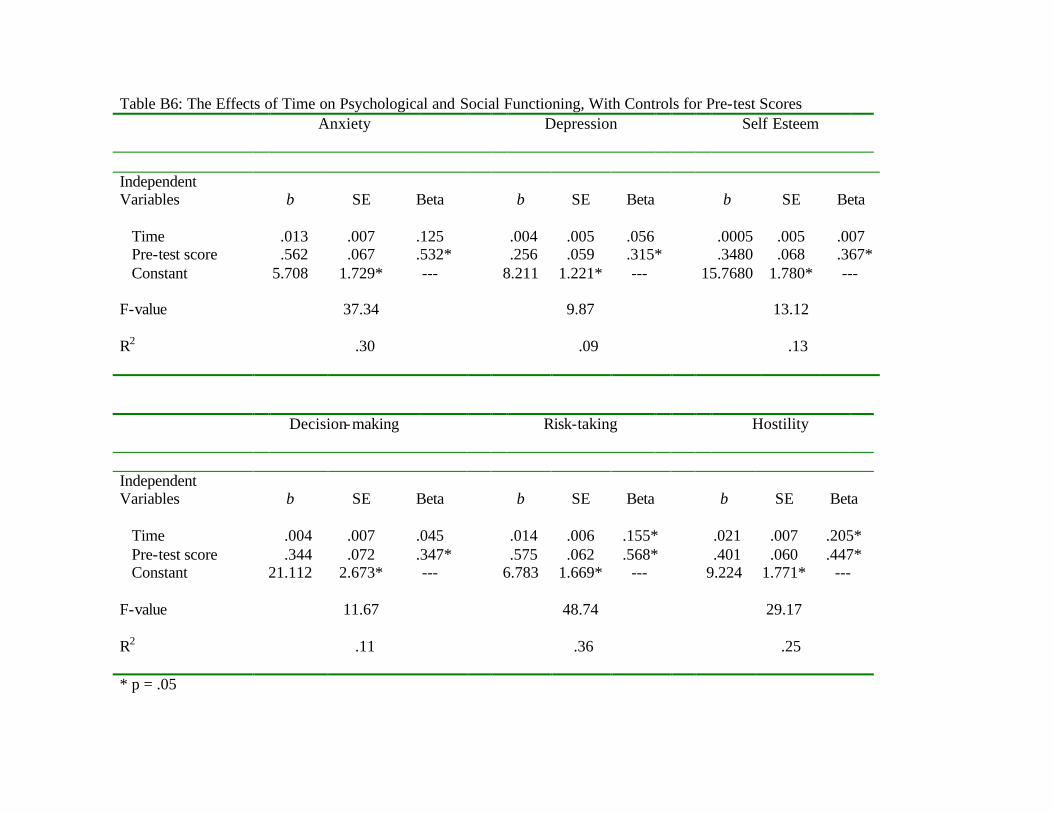
Table B6: The Effects of Time on Psychological and Social Functioning, With Controls for Pre-test Scores
Anxiety Depression Self Esteem
Independent Variables
b
SE
Beta
b
SE
Beta
b
SE
Beta
Time .013 .007 .125 .004 .005 .056 .0005 .005 .007 Pre-test score .562 .067 .532* .256 .059 .315* .3480 .068 .367* Constant 5.708 1.729* --- 8.211 1.221* --- 15.7680 1.780* --- F-value 37.34 9.87 13.12 R2 .30 .09 .13
Decision-making Risk-taking Hostility
Independent Variables
b
SE
Beta
b
SE
Beta
b
SE
Beta
Time .004 .007 .045 .014 .006 .155* .021 .007 .205* Pre-test score .344 .072 .347* .575 .062 .568* .401 .060 .447* Constant 21.112 2.673* --- 6.783 1.669* --- 9.224 1.771* --- F-value 11.67 48.74 29.17 R2 .11 .36 .25 * p = .05
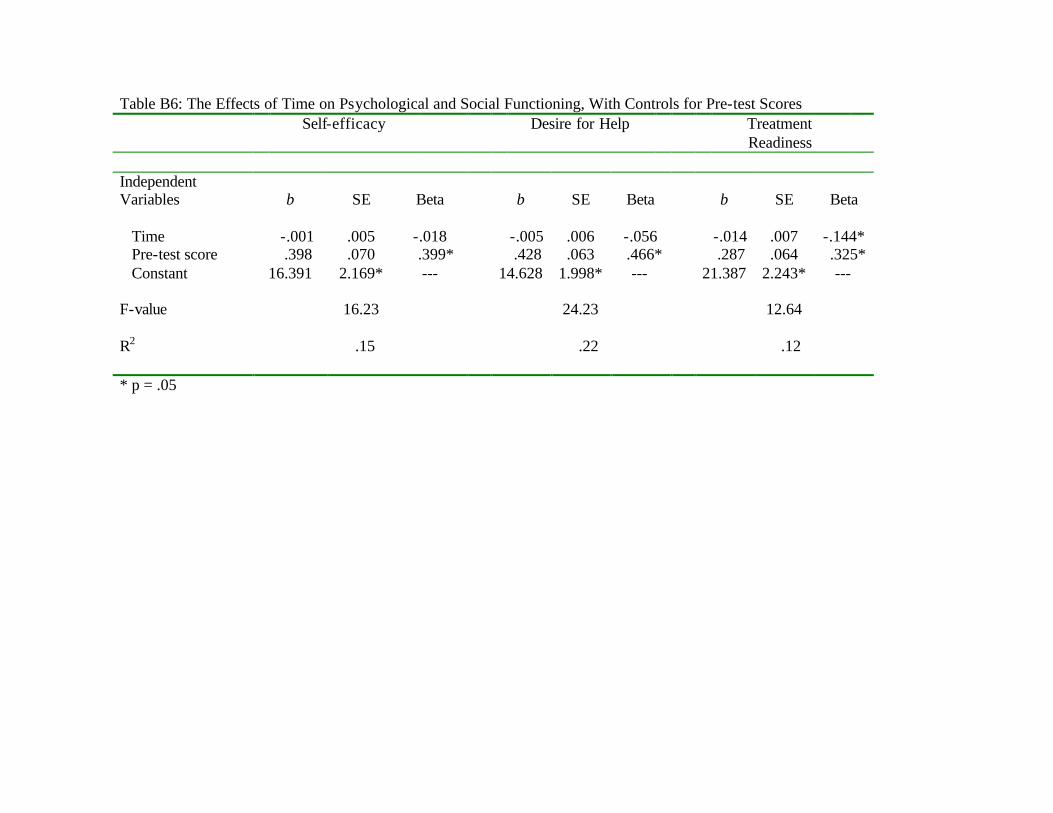
Table B6: The Effects of Time on Psychological and Social Functioning, With Controls for Pre-test Scores
Self-efficacy Desire for Help Treatment Readiness
Independent Variables
b
SE
Beta
b
SE
Beta
b
SE
Beta
Time -.001 .005 -.018 -.005 .006 -.056 -.014 .007 -.144* Pre-test score .398 .070 .399* .428 .063 .466* .287 .064 .325* Constant 16.391 2.169* --- 14.628 1.998* --- 21.387 2.243* --- F-value 16.23 24.23 12.64 R2 .15 .22 .12 * p = .05
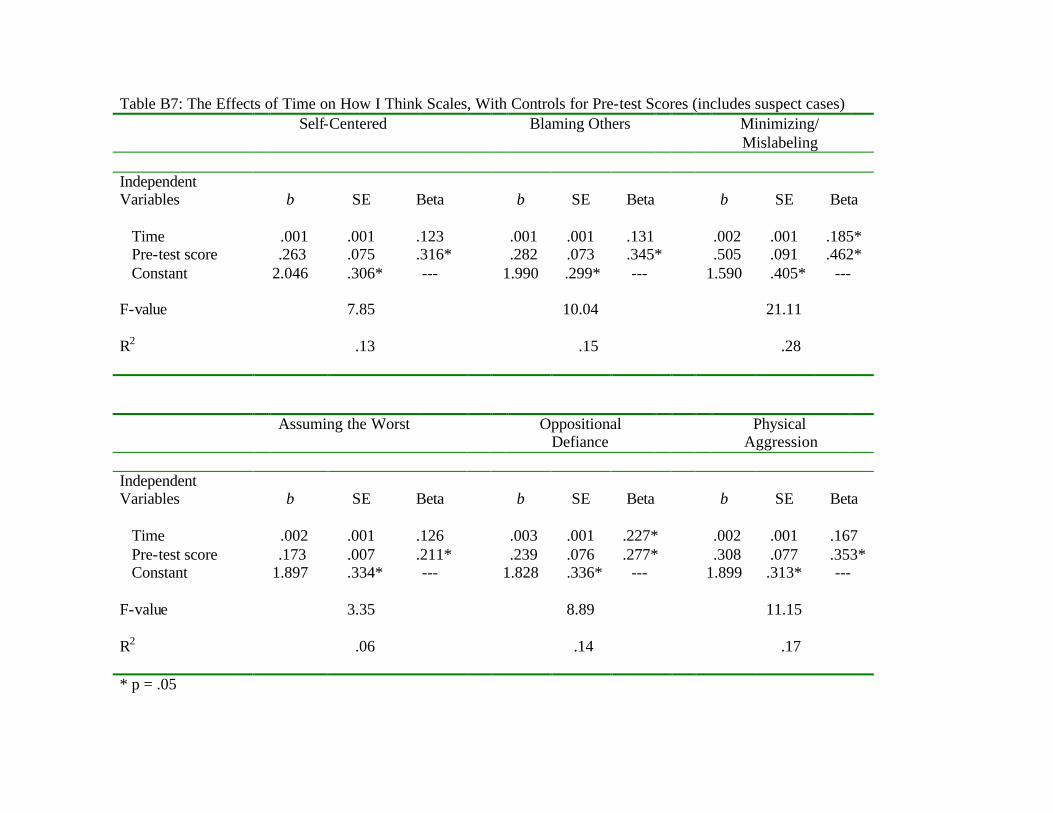
Table B7: The Effects of Time on How I Think Scales, With Controls for Pre-test Scores (includes suspect cases)
Self-Centered Blaming Others Minimizing/ Mislabeling
Independent Variables
b
SE
Beta
b
SE
Beta
b
SE
Beta
Time .001 .001 .123 .001 .001 .131 .002 .001 .185* Pre-test score .263 .075 .316* .282 .073 .345* .505 .091 .462* Constant 2.046 .306* --- 1.990 .299* --- 1.590 .405* --- F-value 7.85 10.04 21.11 R2 .13 .15 .28
Assuming the Worst Oppositional Defiance
Physical Aggression
Independent Variables
b
SE
Beta
b
SE
Beta
b
SE
Beta
Time .002 .001 .126 .003 .001 .227* .002 .001 .167 Pre-test score .173 .007 .211* .239 .076 .277* .308 .077 .353* Constant 1.897 .334* --- 1.828 .336* --- 1.899 .313* --- F-value 3.35 8.89 11.15 R2 .06 .14 .17 * p = .05

Table B7: The Effects of Time on How I Think Scales, With Controls for Pre-test Scores (includes suspect cases)
Lying Stealing Overt
Independent Variables
b
SE
Beta
b
SE
Beta
b
SE
Beta
Time .001 .001 .118 .000 .001 .078 .003 .001 .220* Pre-test score .233 .066 .329 .338 .074 .402* .276 .071 .340* Constant 2.392 .279* --- 1.960 .293* --- 1.868 .292* --- F-value 7.76 11.70 12.02 R2 .13 .18 .18
Covert How I Think
Independent Variables
b
SE
Beta
b
SE
Beta
Time .001 .001 .109 .001 .001 .188* Pre-test score .287 .069 .380* .294 .071 .376* Constant 2.163 .271* --- 1.959 .281* --- F-value 10.34 12.06 R2 .17 .20 * p = .05
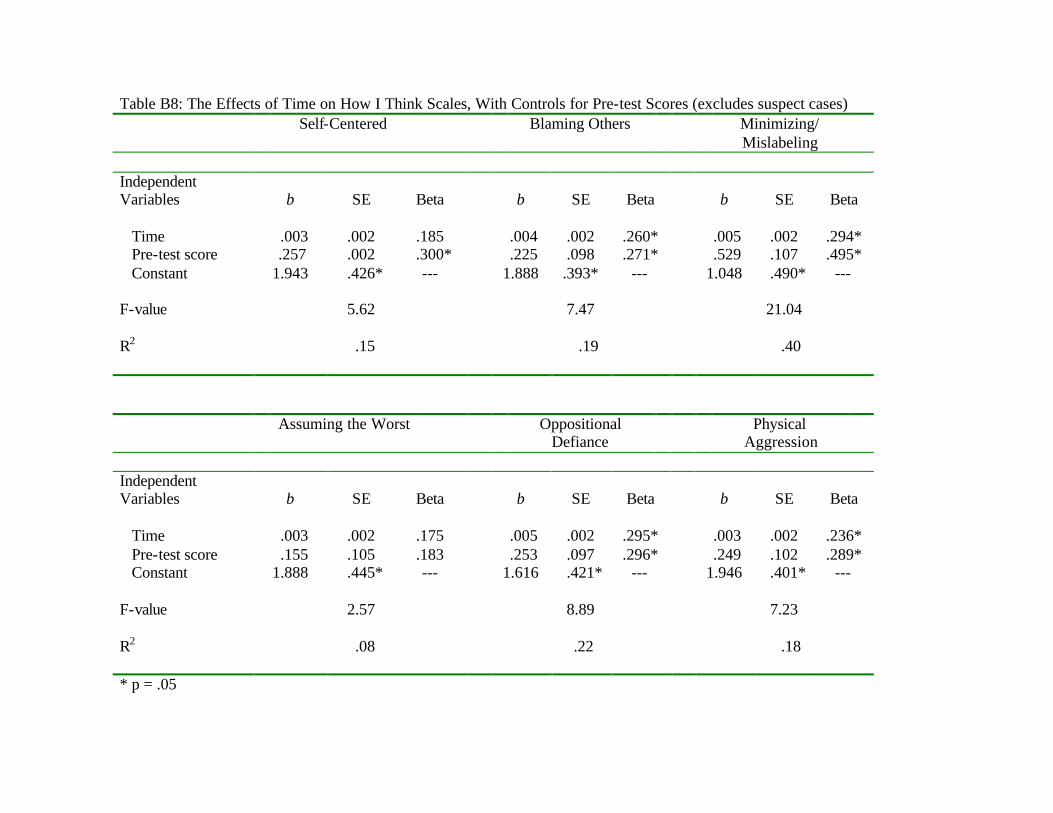
Table B8: The Effects of Time on How I Think Scales, With Controls for Pre-test Scores (excludes suspect cases)
Self-Centered Blaming Others Minimizing/ Mislabeling
Independent Variables
b
SE
Beta
b
SE
Beta
b
SE
Beta
Time .003 .002 .185 .004 .002 .260* .005 .002 .294* Pre-test score .257 .002 .300* .225 .098 .271* .529 .107 .495* Constant 1.943 .426* --- 1.888 .393* --- 1.048 .490* --- F-value 5.62 7.47 21.04 R2 .15 .19 .40
Assuming the Worst Oppositional Defiance
Physical Aggression
Independent Variables
b
SE
Beta
b
SE
Beta
b
SE
Beta
Time .003 .002 .175 .005 .002 .295* .003 .002 .236* Pre-test score .155 .105 .183 .253 .097 .296* .249 .102 .289* Constant 1.888 .445* --- 1.616 .421* --- 1.946 .401* --- F-value 2.57 8.89 7.23 R2 .08 .22 .18 * p = .05
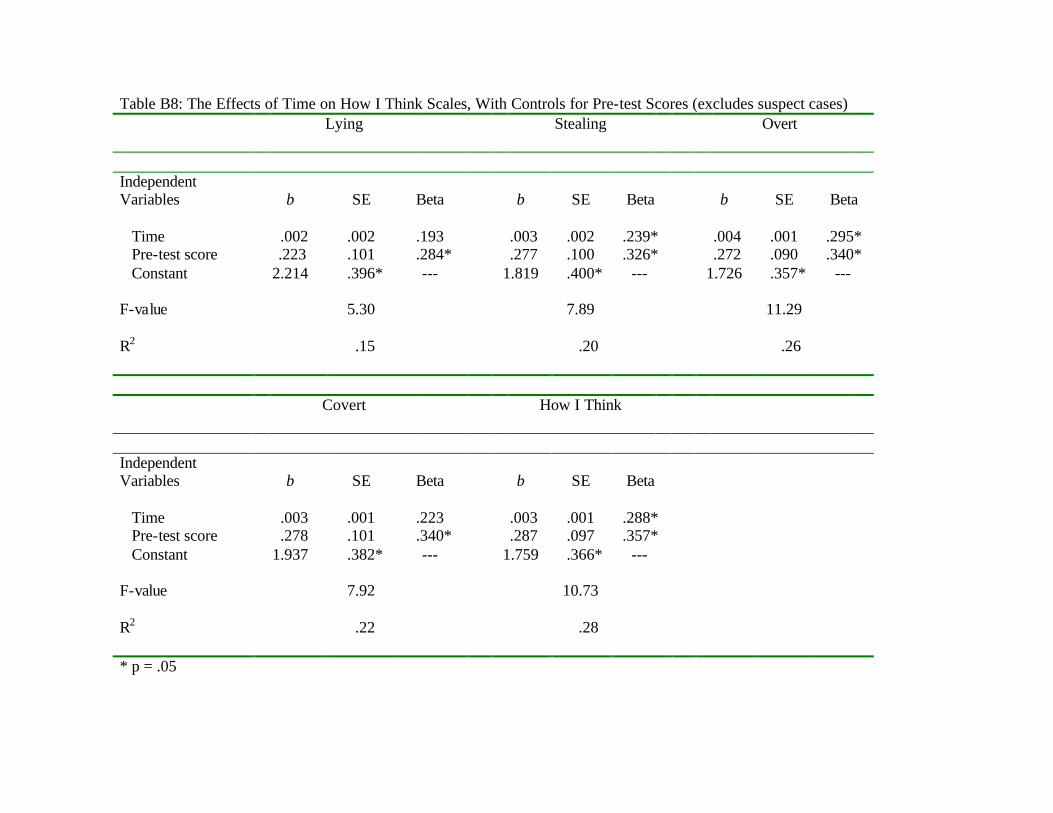
Table B8: The Effects of Time on How I Think Scales, With Controls for Pre-test Scores (excludes suspect cases)
Lying Stealing Overt
Independent Variables
b
SE
Beta
b
SE
Beta
b
SE
Beta
Time .002 .002 .193 .003 .002 .239* .004 .001 .295* Pre-test score .223 .101 .284* .277 .100 .326* .272 .090 .340* Constant 2.214 .396* --- 1.819 .400* --- 1.726 .357* --- F-value 5.30 7.89 11.29 R2 .15 .20 .26
Covert How I Think
Independent Variables
b
SE
Beta
b
SE
Beta
Time .003 .001 .223 .003 .001 .288* Pre-test score .278 .101 .340* .287 .097 .357* Constant 1.937 .382* --- 1.759 .366* --- F-value 7.92 10.73 R2 .22 .28 * p = .05
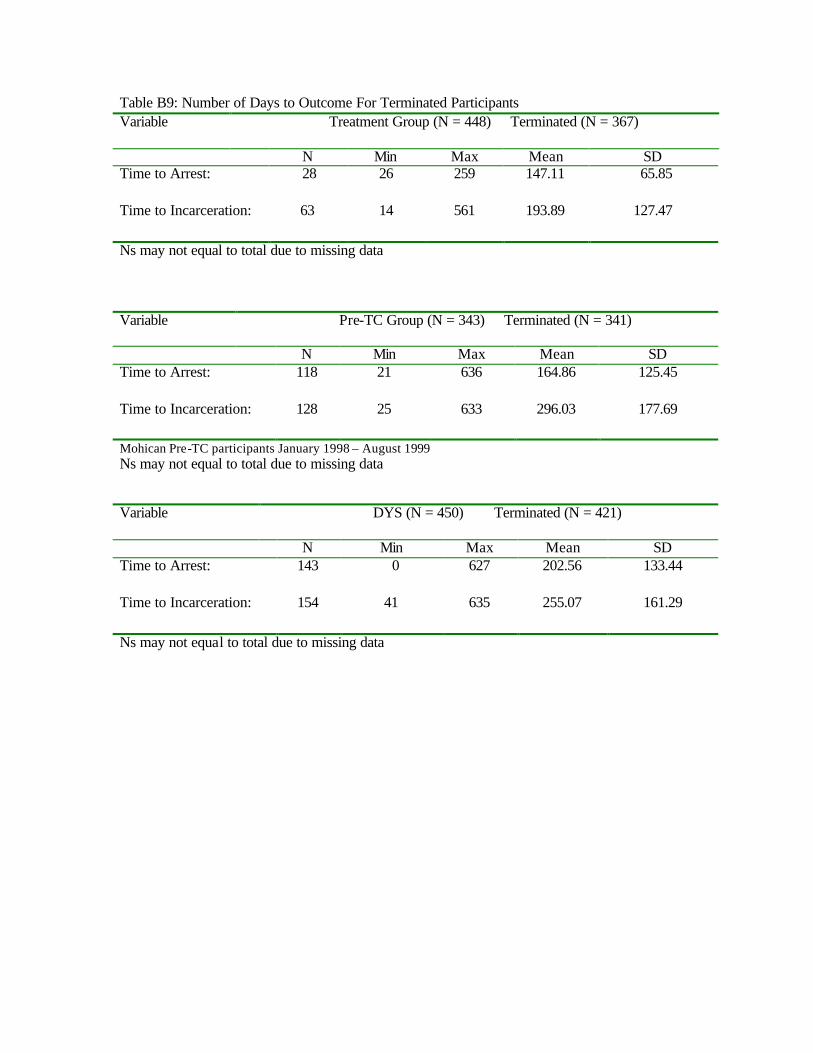
Table B9: Number of Days to Outcome For Terminated Participants Variable
Treatment Group (N = 448) Terminated (N = 367)
N Min Max Mean SD Time to Arrest: 28 26 259 147.11 65.85 Time to Incarceration: 63 14 561 193.89 127.47 Ns may not equal to total due to missing data Variable
Pre-TC Group (N = 343) Terminated (N = 341)
N Min Max Mean SD Time to Arrest: 118 21 636 164.86 125.45 Time to Incarceration: 128 25 633 296.03 177.69 Mohican Pre-TC participants January 1998 – August 1999 Ns may not equal to total due to missing data Variable
DYS (N = 450) Terminated (N = 421)
N Min Max Mean SD Time to Arrest: 143 0 627 202.56 133.44 Time to Incarceration: 154 41 635 255.07 161.29 Ns may not equal to total due to missing data
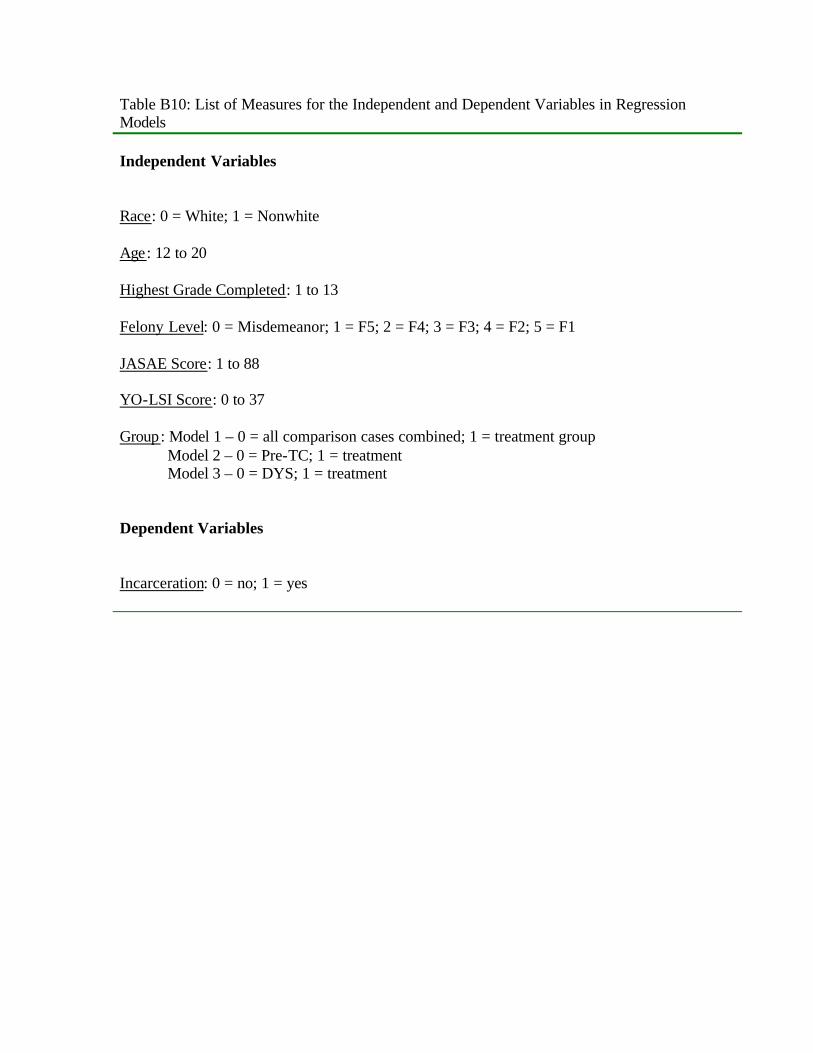
Table B10: List of Measures for the Independent and Dependent Variables in Regression Models
Independent Variables
Race: 0 = White; 1 = Nonwhite Age: 12 to 20 Highest Grade Completed: 1 to 13 Felony Level: 0 = Misdemeanor; 1 = F5; 2 = F4; 3 = F3; 4 = F2; 5 = F1 JASAE Score: 1 to 88 YO-LSI Score: 0 to 37 Group: Model 1 – 0 = all comparison cases combined; 1 = treatment group Model 2 – 0 = Pre-TC; 1 = treatment Model 3 – 0 = DYS; 1 = treatment Dependent Variables
Incarceration: 0 = no; 1 = yes
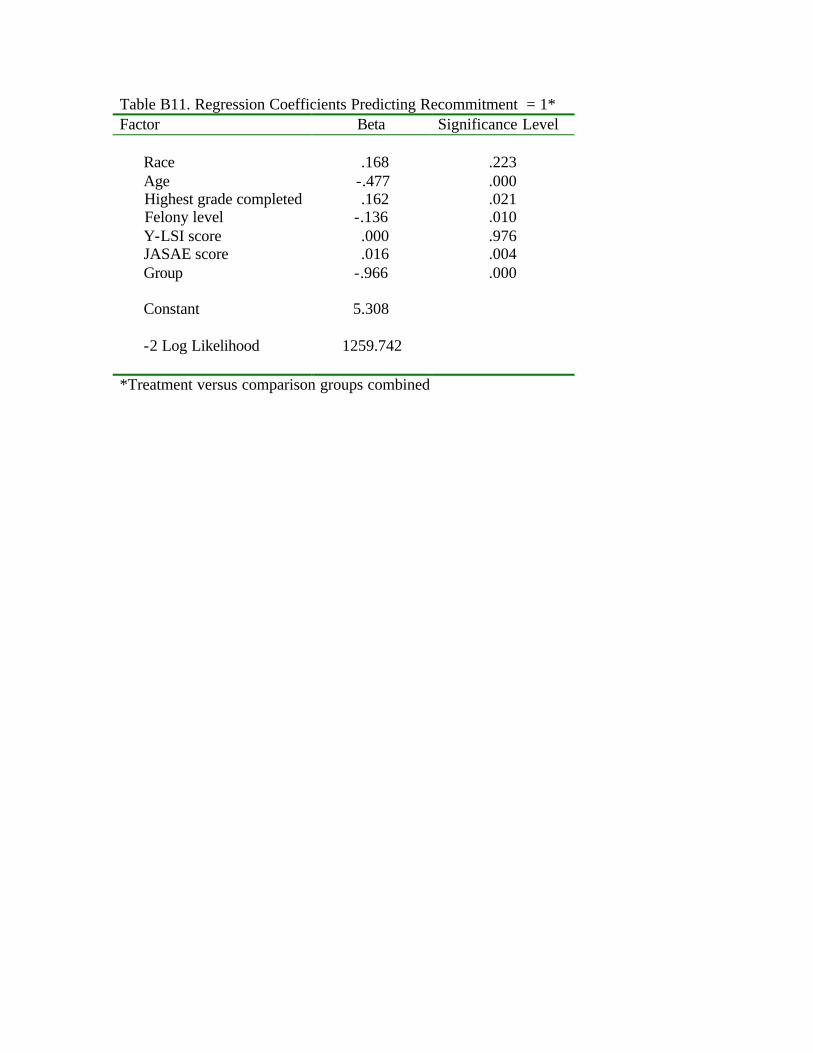
Table B11. Regression Coefficients Predicting Recommitment = 1* Factor Beta Significance Level Race .168 .223 Age -.477 .000 Highest grade completed .162 .021 Felony level -.136 .010 Y-LSI score .000 .976 JASAE score .016 .004 Group -.966 .000 Constant 5.308 -2 Log Likelihood 1259.742 *Treatment versus comparison groups combined
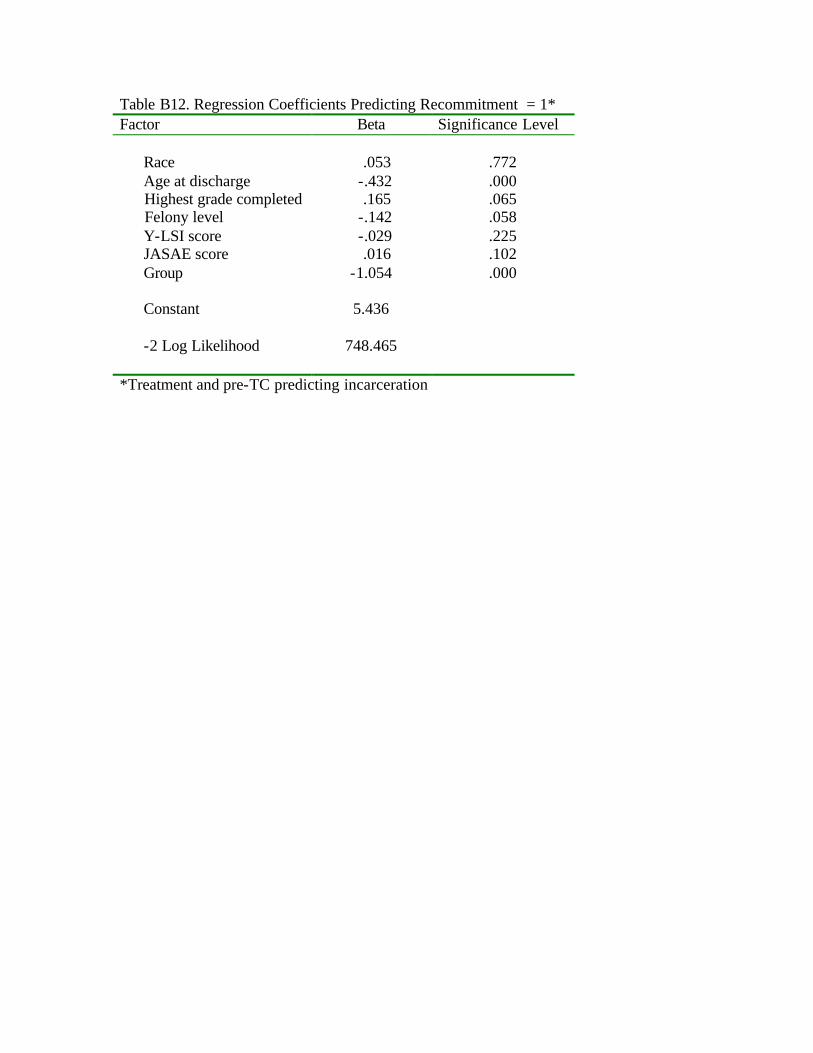
Table B12. Regression Coefficients Predicting Recommitment = 1* Factor Beta Significance Level Race .053 .772 Age at discharge -.432 .000 Highest grade completed .165 .065 Felony level -.142 .058 Y-LSI score -.029 .225 JASAE score .016 .102 Group -1.054 .000 Constant 5.436 -2 Log Likelihood 748.465 *Treatment and pre-TC predicting incarceration