Embed Size (px)
Citation preview

1
Please note that this is an author-produced PDF of an article accepted for publication following peer review. The definitive publisher-authenticated version is available on the publisher Web site.
Polymer Testing April 2015, Volume 171, Pages 87-95 http://dx.doi.org/10.1016/j.polymertesting.2015.02.004 http://archimer.ifremer.fr/doc/00252/36371/ © 2015 Elsevier Ltd. All rights reserved.
Achimer http://archimer.ifremer.fr
Moisture sorption in polyamide 6.6: experimental investigation and comparison to four physical-based
models
Broudin M. 1, 3, Le Saux V. 1, * , Le Gac Pierre-Yves 2, Champy C. 3, Robert G. 4, Charrier P. 3, Marco Y. 1
1 Laboratoire Brestois de Mécanique et des Systèmes (EA 4325), ENSTA Bretagne/Université de Brest/ENIB, 2 rue F. Verny, 29806 Brest Cedex 9, France 2 Materials and Structures Group, IFREMER (French Ocean Research Institute), Centre de Brest, BP 70, 29280 Plouzané, France 3 TrelleborgVibracoustic, Z.I. Nantes Carquefou, BP 419, 44474 Carquefou Cedex, France 4 Solvay Engineering Plastics, Technyl Innovation Center-Simulation et Validation des Applications, Avenue Ramboz – BP64 – 69192 Saint Fons, France
* Corresponding author : V. Le Saux, tel.: +33 (0)2 98 34 87 18 ; email address : [email protected]
Abstract : Water sorption in polyamide 6.6 has been characterized for a wide range of temperature (25°C to 80°C) and various water activities using a Dynamic Vapor Sorption testing machine. Complex sorption mechanisms govern the water uptake in the material. The competition between two main temperature dependant mechanisms has been observed: a Henry’s sorption mechanism that mainly governs the sorption curve at low water activities, and a second mechanism at high water activities that could be related to the formation of water clusters. It is observed that the temperature dependency can mainly be attributed to the Henry’s contribution. Four physically based models are then used and identified thanks to the extended experimental database. It is shown that a simple Flory-Huggins model is not able to capture the experimental observations at very high water activities for all the temperatures tested. The ENSIC model is a better choice, but good prediction for very high water activity cannot be obtained. Both modified Park and GAB models can accurately predict the volume fraction of water for the whole ranges of water activity and temperature, although the modified Park model should be preferred considering the number of parameters and the mathematical simplicity.
Keywords : polyamide 6.6, water sorption, temperature, relative humidity, physically-based models

MANUSCRIP
T
ACCEPTED
ACCEPTED MANUSCRIPT
1. Introduction In order to reduce CO2 emission and fuel consumption, the automotive industry wishes
to reduce the mass of vehicles. Short glass fiber reinforced polyamide 6.6 composites are
appropriate candidates because they combine an affordable price and a reasonable stiffness
thanks to the complex shapes allowed by the injection molding process. These materials are
not new in the automotive industry, they have been used for a long time for parts submitted to
limited thermo-mechanical loading. They are nowadays increasingly used for structural
applications such as engine mounts or clutch pedals (Figure 1) that are submitted to complex
cyclic movements. Furthermore, important variations of the temperature and relative humidity
can be induced by the service conditions (under-bonnet temperature and climatic variations)
[1]. Both temperature and relative humidity are known to have a strong impact on the
mechanical properties of polyamide [2-5].
Fig. 1 – TrelleborgVibracoustic engine mount with PA6.6 50%wtGF housing for PSA.
The strong influence of the relative humidity on the mechanical response is especially
high for polyamide because of the hydrophilic nature of the amide functional group [6]. In the
case of unfilled polyamide 6.6, saturation values of water absorption up to 8.5% at 23°C and
relative humidity of 100% are commonly found in the literature [7]. The absorption of water
in the polyamide leads to at least three consequences. The first is modification of the matrix
behavior: the ultimate strain increases and the material stiffness decreases [2, 5]. The second
is the reduction of the glass temperature transition Tg with the increase of water content. A
reduction of nearly 60°C when the relative humidity ratio is increased from 0 to 80% (Tg
varies from 320K to 260K) is, for example, reported [7]. The last consequence is swelling of
the structure that induces dimensional changes that can be problematic for the integration of
the structure in its environment [8]. Moreover, in many industrial parts submitted to
demanding loading, the concentration of water in the material is not homogeneous. Thus,
understanding of the water gradient and the consequences on the mechanical and physical
properties variations with time, but also with position, is mandatory to predict the thermo-
mechanical response needed to get a reliable design.
The classical way to investigate the water sorption consists of monitoring the global
mass uptake using gravimetric analysis. Two main quantities can be defined from these
MANUSCRIP
T
ACCEPTED
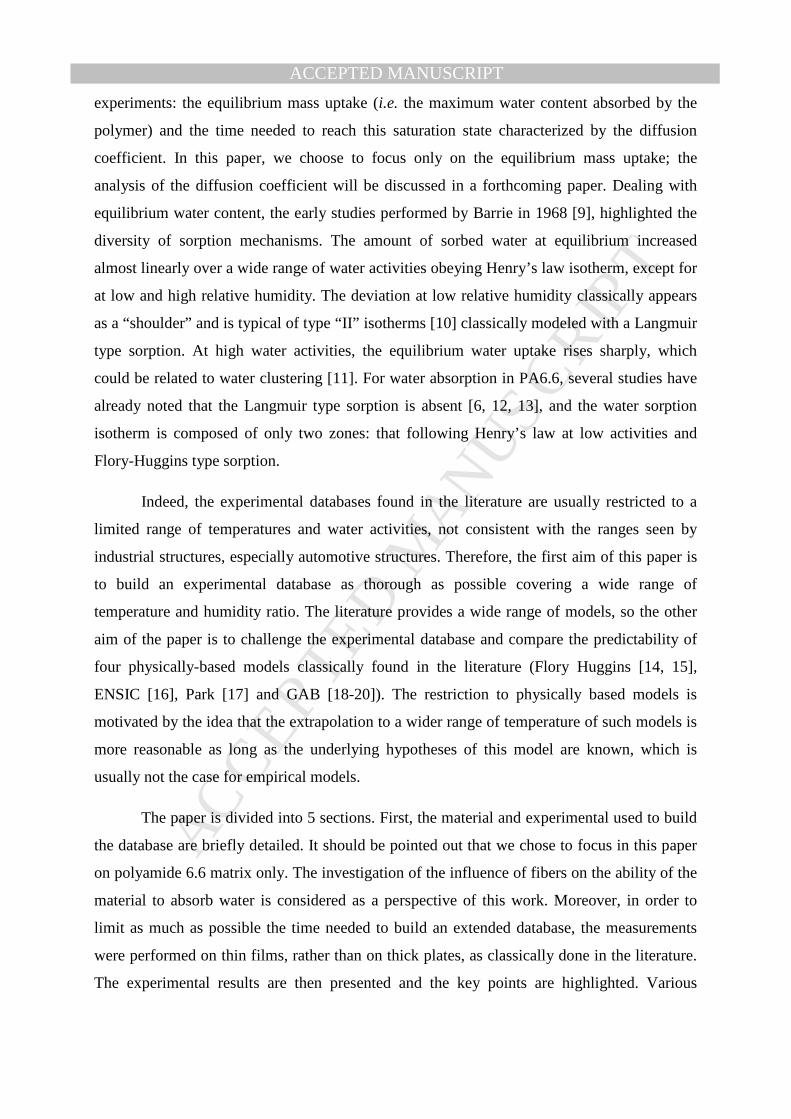
ACCEPTED MANUSCRIPTexperiments: the equilibrium mass uptake (i.e. the maximum water content absorbed by the
polymer) and the time needed to reach this saturation state characterized by the diffusion
coefficient. In this paper, we choose to focus only on the equilibrium mass uptake; the
analysis of the diffusion coefficient will be discussed in a forthcoming paper. Dealing with
equilibrium water content, the early studies performed by Barrie in 1968 [9], highlighted the
diversity of sorption mechanisms. The amount of sorbed water at equilibrium increased
almost linearly over a wide range of water activities obeying Henry’s law isotherm, except for
at low and high relative humidity. The deviation at low relative humidity classically appears
as a “shoulder” and is typical of type “II” isotherms [10] classically modeled with a Langmuir
type sorption. At high water activities, the equilibrium water uptake rises sharply, which
could be related to water clustering [11]. For water absorption in PA6.6, several studies have
already noted that the Langmuir type sorption is absent [6, 12, 13], and the water sorption
isotherm is composed of only two zones: that following Henry’s law at low activities and
Flory-Huggins type sorption.
Indeed, the experimental databases found in the literature are usually restricted to a
limited range of temperatures and water activities, not consistent with the ranges seen by
industrial structures, especially automotive structures. Therefore, the first aim of this paper is
to build an experimental database as thorough as possible covering a wide range of
temperature and humidity ratio. The literature provides a wide range of models, so the other
aim of the paper is to challenge the experimental database and compare the predictability of
four physically-based models classically found in the literature (Flory Huggins [14, 15],
ENSIC [16], Park [17] and GAB [18-20]). The restriction to physically based models is
motivated by the idea that the extrapolation to a wider range of temperature of such models is
more reasonable as long as the underlying hypotheses of this model are known, which is
usually not the case for empirical models.
The paper is divided into 5 sections. First, the material and experimental used to build
the database are briefly detailed. It should be pointed out that we chose to focus in this paper
on polyamide 6.6 matrix only. The investigation of the influence of fibers on the ability of the
material to absorb water is considered as a perspective of this work. Moreover, in order to
limit as much as possible the time needed to build an extended database, the measurements
were performed on thin films, rather than on thick plates, as classically done in the literature.
The experimental results are then presented and the key points are highlighted. Various
MANUSCRIP
T
ACCEPTED
ACCEPTED MANUSCRIPTmodels are then presented and their ability to capture the specificities of the experimental
database is then discussed. Finally, conclusions are proposed.
2. Materials and methods 2.1 Materials and samples
The material used is a polyamide 6.6 matrix provided by Solvay® (A218nat) with a
density of 1.14 g/cm3, and a molecular weight of 16 500g/mol. The glass transition
temperature of the polymer in the dry state has been evaluated at 56±1°C with classical
DMTA tests using the three tangents method on the storage modulus E’. Thin films of 100µm
thickness were cut from injected plates using a Leica microtome.
2.2 Gravimetric experiments and construction of the sorption curves
The gravimetric experiments were performed using a Dynamic Vapor Sorption (DVS)
Q5000SA, TA Instruments, equipped with a high-accuracy micro-balance (0.1µg ± 1%). The
accuracy of the system is ± 1% for the RH over a range of 0-98% and ± 0.1°C for the
temperature stability. During a DVS measurement, the sample can be subjected to varying
humidity and temperature conditions, and the mass of the sample is measured continuously
during the test. To simplify the interpretation of our measurements, the temperature remained
fixed whereas the humidity ratio was changed in order to build isothermal water sorption
curves.
Before being exposed to any vapor, the samples were dried at 0% RH to remove any surface
adsorbed vapor and to establish a dry mass baseline. The samples were then exposed to carrier
air with varying relative humidity obtained by mixing flows of dry and wet nitrogen at
200ml/min. The relative humidity was increased step by step during adsorption. The time of
each step was chosen such that the weight equilibrium was reached. The next step then starts
from this new equilibrium state. Figure 2 presents an illustration of a typical result where
water activity is progressively increased from a value of 0 to 0.85. It should be pointed out
that the maximum water activity reached during the DVS measurement is temperature
dependant and chosen so that no condensation occurs in the test apparatus (values are chosen
as given in the documentation of the test apparatus).

MANUSCRIP
T
ACCEPTED
ACCEPTED MANUSCRIPTFig. 2 – Example of DVS result obtained for a temperature of 40°C. The mass evolution
∆m=mt-m0 is plotted versus time
Because RH of 100% cannot be obtained using the DVS measurements, two complementary
points were also obtained by classical gravimetric analysis at 25°C and 80°C by immersing
the samples in water. The main purpose of these points is to have data in a specific range
where a small increase of relative humidity can have an important impact on the maximum
sorbed water, and can thus challenge the model identification and predictability. As these tests
are performed on plates and not thin films, several complementary points were also defined to
make sure that the experimental results that come from DVS and classical gravimetric
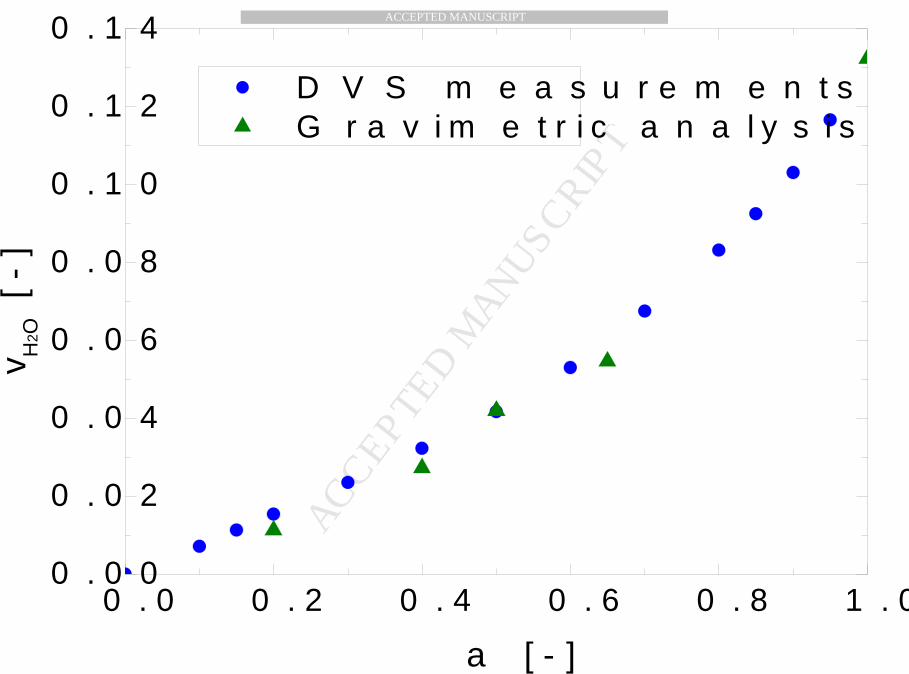
analysis are comparable. Figure 3 plots the data obtained using DVS measurements and
classical gravimetric analysis, and more specifically the value at saturation for a temperature
of 25°C (the meaning of the quantity vH20 will be explained in the next paragraph). No
specific differences are noticed between the two techniques. We can, therefore, use both
techniques to build our experimental database. Common points are omitted to simplify the
database and only those from DVS are kept (except for RH of 100%).
Fig. 3 – Comparison between DVS measurements and classical gravimetric analysis for a
temperature of 25°C.
Sorption isotherms are obtained by plotting the mass evolution at sorption equilibrium versus
the water activity defined as:
satp
pa = (1)
where p is the vapour pressure of water in the environment and psat the saturated pressure of
water at the same temperature. The mass evolution is calculated according to:
0mmm t −=∆ (2)
where mt is the mass of the sample at time t and m0 is the mass of the sample in the dry state.
It is usually convenient to define the evolution of the mass absorption ratio Mt:
0
0
m
mmM t
t
−= (3)
As polyamide 6.6 is a semi-crystalline polymer and as water diffuses only in the amorphous
phase [2], the sorption mechanism will be considered only over the combination of water and

MANUSCRIP
T
ACCEPTED
ACCEPTED MANUSCRIPTamorphous phase. The relative mass ratio wH2O and relative volume ratio vH2O will be
considered here and can be defined as:
( ) ( )χχ −+=
∆+−∆=
11 02
t
tOH M
M
mm
mw (4)
( ) wOHaOH
aOHOH ww
wv
ρρρ
22
22 1−+
= (5)
where ρa and ρw are the respective densities of the amorphous phase of the polymer and water.
Their values will be taken equal to 1080g/cm3 for ρa [21] and 1000g/cm3 for ρw.
3. Experimental results
We present in this section the experimental results and highlight some specifics of the studied
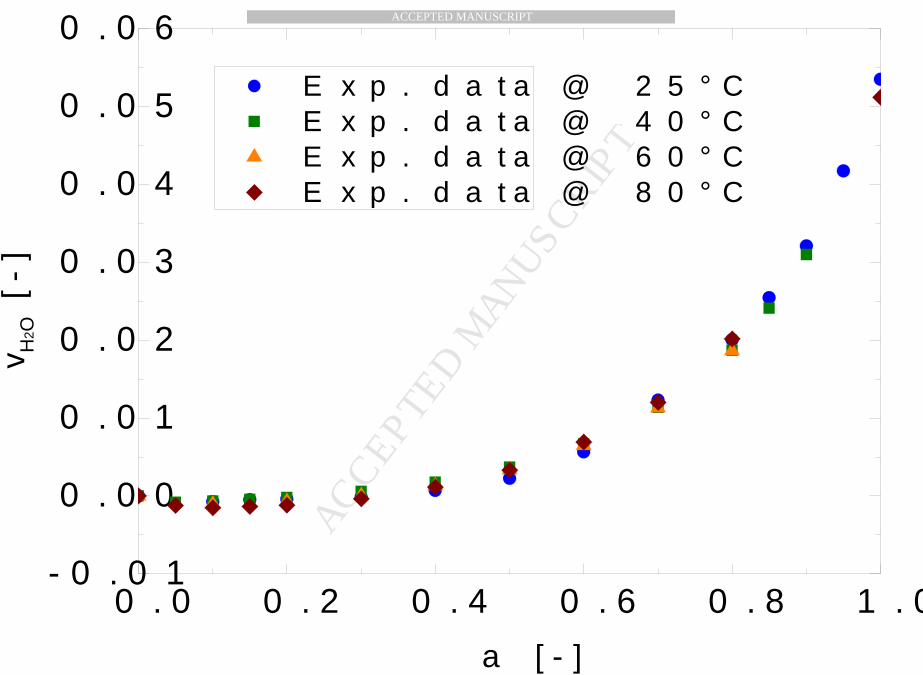
material. Figure 4 plots the volumetric fraction of water in the amorphous phase of the versus
the water activity for all the temperatures tested. Several aspects can be pointed out. Prior to
any misleading interpretation, an experimental scattering analysis has to be performed in
order to make sure that the results are related to a physical phenomenon and not to the
experimental scatter. The results of 3 tests performed on 3 different samples for a temperature
of 40°C degree and the mean values as well as the standard deviation are plotted in Figure 4.
We can note that this standard deviation is lower than the differences induced by the
temperature on the sorption curves. Therefore, the temperature dependency has to be taken
into account since it is related to a physical phenomenon.
Then, we see in Figure 4, as expected, different behaviour in the isotherm sorption at lower
and higher water activities [12, 13, 22]. It is observed that the isotherms display an upward
curvature that becomes more and more pronounced as activity increases. No initial curvature
at low activities is noticed, with no Langmuir sorption phase, which is a classical result for
PA6,6 matrix [6, 12, 13]. The sorption curve can be described by a linear curve at low
activities according to Henry’s behaviour. At high activity (a>0.6), a deviation from this
linear part is seen that can be explained by to the formation of water clusters [6, 11].
Fig. 4 – Sorption curves for all the testing temperature.

MANUSCRIP
T
ACCEPTED
ACCEPTED MANUSCRIPTThe second point is that the sorption isotherms depend on the temperature. To highlight this
phenomenon, Figure 5 plots the volume fraction of water in the amorphous phase of the PA6
matrix versus the temperature for various water activities. It can be clearly pointed out that the
higher the temperature, the lower the vH2O value (for a given water activity). This result stands
for all the water activities studied.
Fig. 5– Effect of the temperature on the sorption curves.
The dependency of the maximum water uptake on the temperature is a classical result for
highly hydrophilic polymers, such as certain epoxide-amine networks [23], but is quite
unusual for PA66 [13, 24] where the maximum water uptake was found to be almost
temperature independent. This result encouraged consideration of this uptake as well
representative of the water-polymer interaction [12]. However, this temperature dependant
behavior has already been noted in the literature for PA66 [6], and can be physically
explained by Henry’s law [25]. Dealing with our experimental results, it seems that the main
differences occur on the initial slope (related to the Henry behavior). The non linear
contribution does not seem affected by the temperature, as the shape of the curves does not
evolve with temperature for high water activities. To highlight this, Figure 6 plots the
experimental results already presented in Figure 4 but where the linear contribution (that is
temperature dependant) has been subtracted to isolate the non linear part of the curve strongly
related to water clustering [11].
Fig. 6 – Effect of the temperature on the nonlinear contribution of the sorption curves
obtained by subtracting the linear contribution evaluated experimental data for water activities
up to 0.4.
To obtain these data, the initial slope of each curve was estimated for each temperature using
the data obtained for water activities up to 0.4. We can clearly see independence of the non
linear contribution to the temperature, leading to the conclusion that the dependency of the
maximum water uptake to the temperature can be taken into account in the linear contribution,
i.e. the Henry one.
4. Models and identification

MANUSCRIP
T
ACCEPTED
ACCEPTED MANUSCRIPTWe discuss in this section the model candidates to reproduce the experimental results and,
more specifically, to focus on a way to integrate the effect of temperature on the sorption
curves. We chose to consider 4 different models that are widely used in the literature. Before
briefly presenting the models, we describe the numerical strategy we set up to identify the
constitutive parameters of these models. This strategy is the same for all models.
4.1 Identification strategy The constitutive parameters of the models are identified thanks to an optimization procedure
based on a least squares fitting. The parameters are found such as they guarantee:
( ) ( )[ ]2
1
expexpexpexp ,,,min∑=
−N
iiiii
pTaypTas (6)
where p represents the model parameters array, s is the response of the model for a given
activity and temperature, y corresponds to the experimental data obtained for a given
temperature and activity and N is the number of experimental observations. As several
temperatures are considered, the global error array is obtained by concatenating the array
obtained for each temperature. Therefore, the strategy used here is a global one, i.e. the
identification is performed considering the whole database and for each temperature
independently. The identification is performed using a python script that uses the function
“leastsq” given in the optimization toolbox of the “scipy project” [26]. The function uses a
gradient-based Levenberg-Marquardt algorithm. To start the algorithm, an initial point must
be provided. For each model, these parameters are chosen consistent with its physical
meaning. Sensitivity analysis of the results to this initial guess was systematically done
afterwards in order to make sure that the final parameters do not depend on this initial guess
and can, therefore, be considered as the optimum ones.
In order to be able to compare qualitatively the model identification, a scalar value, termed
Determination Coefficient, is calculated according to:
( ) ( )( )
( )( )∑
∑
=
=
−
−−=
N
iii
N
ioptiiii
yTay
pTasTayDC
1
2expexp
1
2expexpexpexp
,
,,,1 (7)
where y represents the mean value of the array y:
MANUSCRIP
T
ACCEPTED
ACCEPTED MANUSCRIPT
∑=
=N
iiy
Ny
1
1 (8)
and popt the “optimum” set of parameters. The DC quantity evolves between 0 and 1. A value
of 0 means very poor correlation (the model should be avoided) and a value of 1 means
excellent correlation.
4.2 Flory-Huggins model (1942) Flory [14] and Huggins [15] developed in the 40s a mean-field theory used to describe
sorption in polymers based on a statistical analysis of the different configuration of a
polymer/solvent system using a lattice conception, which still remains the basis for new more
refined theories. The model has the following simple form:
( ) ( ) ( ) ( )2222 11lnln OHOHOH vvva −+−+= γ (9)
where a is the water activity of the surrounding air, vH2O the volumic fraction of water
absorbed in the matrix and γ is the Flory-Huggins interaction parameter that can be
temperature dependant [12] according to a classical Arrhenius equation:
=
RT
Eaγ
γγ exp0 (10)
This parameter is a reflection of the polymer/solvant affinity, where the lowest γ value
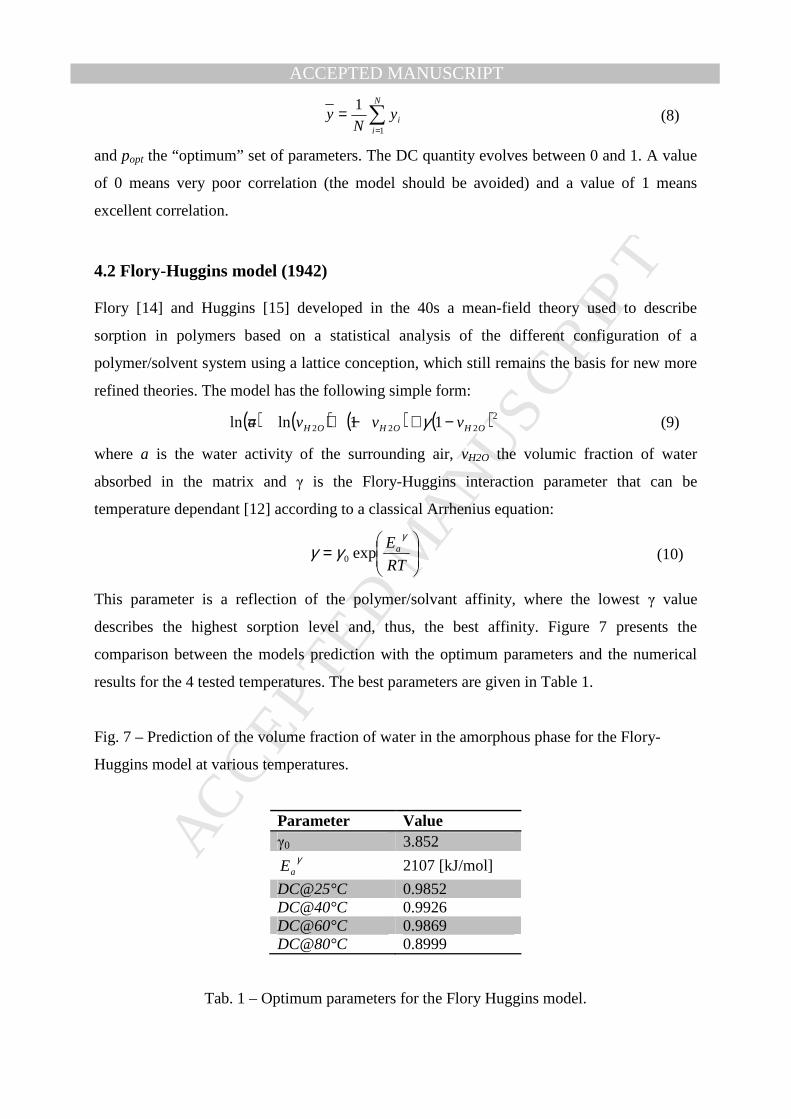
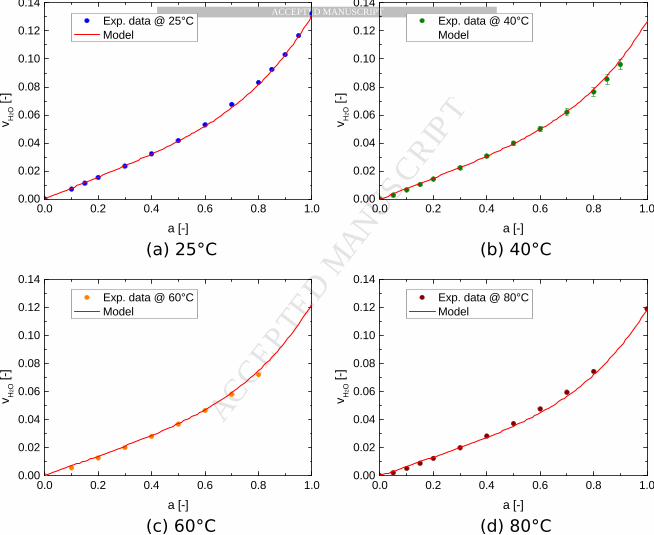
describes the highest sorption level and, thus, the best affinity. Figure 7 presents the
comparison between the models prediction with the optimum parameters and the numerical
results for the 4 tested temperatures. The best parameters are given in Table 1.
Fig. 7 – Prediction of the volume fraction of water in the amorphous phase for the Flory-
Huggins model at various temperatures.
Parameter Value γ0 3.852
γaE 2107 [kJ/mol]
DC@25°C 0.9852 DC@40°C 0.9926 DC@60°C 0.9869 DC@80°C 0.8999
Tab. 1 – Optimum parameters for the Flory Huggins model.

MANUSCRIP
T
ACCEPTED
ACCEPTED MANUSCRIPT
4.3 ENSIC model (1996) The ENgaged Species Induced Clustering (ENSIC) model has been developed more recently
[16]. This model considers the probability of insertion of a non-polymeric molecule in a
system that contains only two types of species, i.e. the polymer and the sorbed molecules, the
latter being present only in its condensed phase. Based on a basic lattice concept, the
following relation was derived:
( )( )[ ]1exp2 −⋅−−
= akkkk
kv ps
ps
pOH (11)
The key parameters are the elementary affinity between the non-polymeric species (water
molecules here) and either a polymer site (kp) or a previously sorbed solvent molecule (ks).
One particular characteristic of this model is its ability to describe Langmuir type sorption,
Flory-Huggins-like isotherms or Henry sorption depending on the values of ks and kp.
Moreover, this model enables solvent clustering as long as the solvent/solvent affinity (ks) is
higher than the solvent/polymer affinity (kp). Based on the experimental observation and the
physical meaning of the parameters, a possible extension in order to make the model
temperature dependant would be to suggest evolution of the kp with temperature according to:
−=
RT
Ekk
pk
aPp exp0 (12)
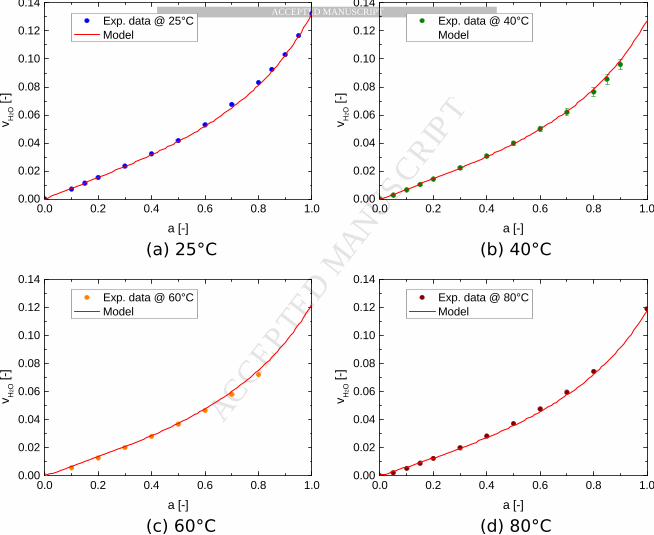
Figure 8 presents the comparison between the models prediction with the optimum parameters
and the numerical results for the 4 tested temperatures. The best parameters are given in Table
2.
Fig. 8 – Prediction of the volume fraction of water in the amorphous phase for the ENSIC
model at various temperatures.
Parameter Value kp0 0.0251
pkaE -1889 [kJ/mol]
ks 1.596

MANUSCRIP
T
ACCEPTED
ACCEPTED MANUSCRIPT
DC@25°C 0.9965 DC@40°C 0.9923 DC@60°C 0.9853 DC@80°C 0.9960
Tab. 2 – Optimum parameters for the ENSIC model.
4.4 Modified Park model (1986) Based on the assumption that three different physical mechanisms can explain the shape of a
sorption isotherm curve (langmuir, Henry and clustering phenomena), Park [17] suggests a
simple mathematical representation based on the decomposition of these phenomena:
n
asKsa
ab
aAbv
nnc
L
LOH ++
+=
12 (13)
where vH2O is the water concentration, a is the water activity, Kc the equilibrium constant for
the clustering reaction, s the Henry’s type solubility coefficient, n the mean number of water
molecules per cluster, A the Langmuir capacity constant and bL the Langmuir affinity
constant. In equation (13), the first term represents the Langmuir sorption, the second one the
Henry’s law term and the third one is the non linear contribution of the water clusters. The
parameters of the Park model have a predominant effect in a limited water activity range.
Langmuir’s terms, A and bL have an influence in zone I for low water activity (a<0.1).
Henry’s solubility coefficient, s, defines the slope of the isotherm in zone II (0.1<a<0.6). The
value Kc and n could be linked to the equilibrium state corresponding to the water clusters in
zone III (a>0.6).
A simplified representation of the Park model has been suggested by [12] where the Langmuir
sorption mechanism is not taken into account and the remaining two terms are written
according to a simpler form:
mbaHav += (14)
The first term is related to the linear part observed for low activities and related to the Henry's
behavior. The second term is related to the non linear part that appears at high water activities,
generally related to the formation of water clusters.
A possible extension of the model would be to consider a temperature dependency of Henry
mechanism on temperature dependant. Equation (14) can, therefore, be modified according to:

MANUSCRIP
T
ACCEPTED
ACCEPTED MANUSCRIPT
mHa
OH baaRT
EHv +⋅
=
0
exp02 (15)
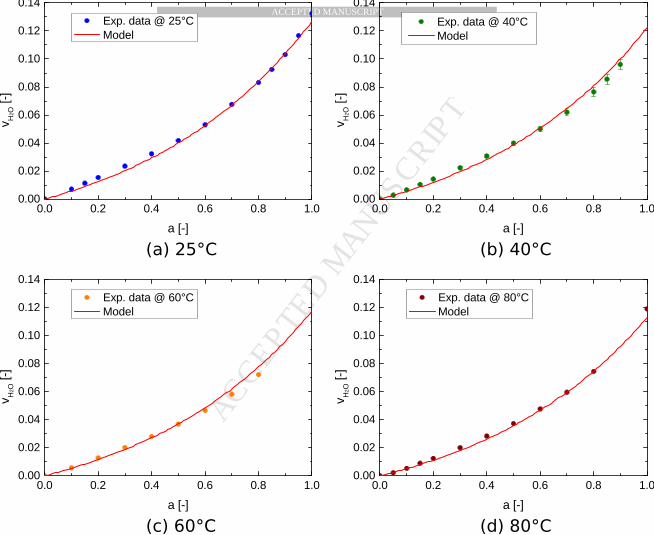
Figure 9 presents the comparison between the models prediction with the optimum parameters
and the numerical results for the 4 tested temperatures. The best parameters are given in Table
3.
Fig. 9 – Prediction of the volume fraction of water in the amorphous phase for the modified
Park model at various temperatures
Parameter Value H0 0.027
HaE -2642 [kJ/mol]
b 0.052 m 4.554 DC@25°C 0.9993 DC@40°C 0.9977 DC@60°C 0.9954 DC@80°C 0.9977
Tab. 3 – Optimum parameters for the modified Park model.
4.5 GAB model (1966)
The GAB model [18-20] (Guggenheim-Anderson-de Boer) is one of the most, if not
the most, widely used model in the literature. The basic assumption of the model is the
localization of the physical absorption in multilayers with no lateral absorption. The first
sorbed molecules cover the surface and are very strongly bounded to the monolayer.
Subsequently, the layers of molecules sorbed have less interaction with the sorbent surface
and the range in energy levels is between those of the monolayer molecules and those of the
bulk liquid. The GAB equation is expressed as:
( ) ( )( )1112 −+−=
CaKaK
aCKvv m
OH (16)
MANUSCRIP
T
ACCEPTED
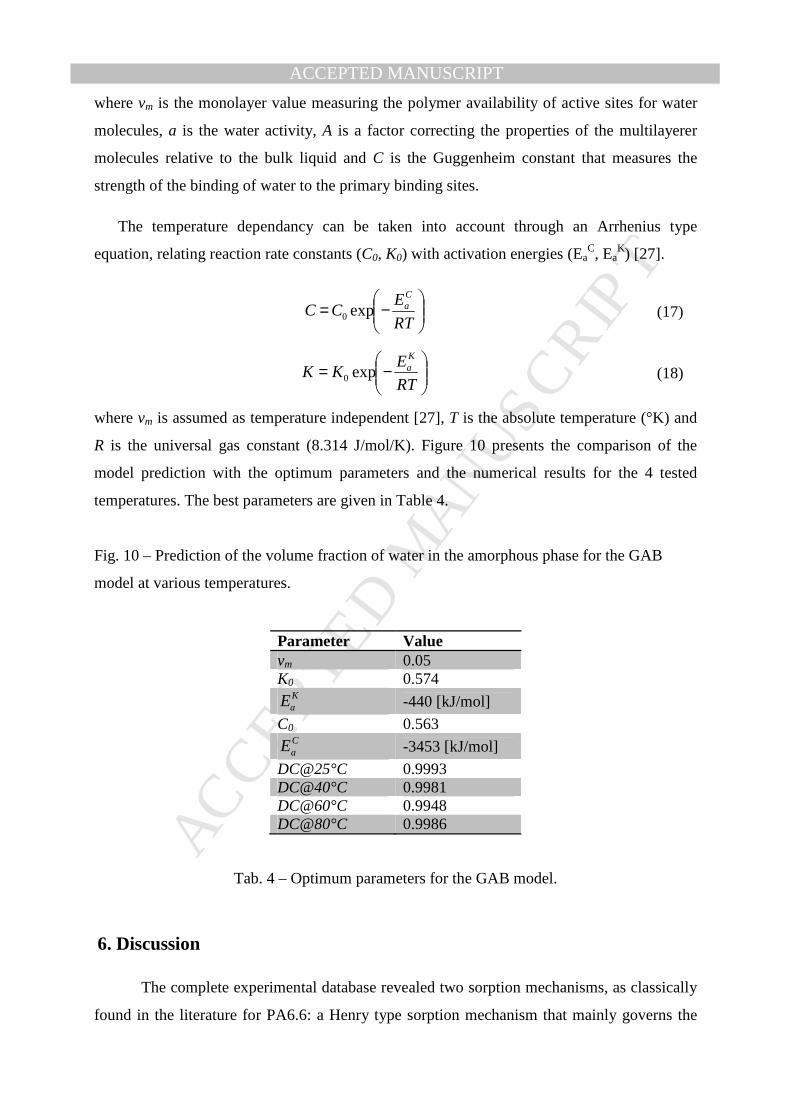
ACCEPTED MANUSCRIPTwhere vm is the monolayer value measuring the polymer availability of active sites for water
molecules, a is the water activity, A is a factor correcting the properties of the multilayerer
molecules relative to the bulk liquid and C is the Guggenheim constant that measures the
strength of the binding of water to the primary binding sites.
The temperature dependancy can be taken into account through an Arrhenius type
equation, relating reaction rate constants (C0, K0) with activation energies (EaC, Ea
K) [27].
−=
RT
ECC
Caexp0 (17)
−=
RT
EKK
Kaexp0 (18)
where vm is assumed as temperature independent [27], T is the absolute temperature (°K) and
R is the universal gas constant (8.314 J/mol/K). Figure 10 presents the comparison of the
model prediction with the optimum parameters and the numerical results for the 4 tested
temperatures. The best parameters are given in Table 4.
Fig. 10 – Prediction of the volume fraction of water in the amorphous phase for the GAB
model at various temperatures.
Parameter Value vm 0.05 K0 0.574
KaE -440 [kJ/mol]
C0 0.563 CaE -3453 [kJ/mol]
DC@25°C 0.9993 DC@40°C 0.9981 DC@60°C 0.9948 DC@80°C 0.9986
Tab. 4 – Optimum parameters for the GAB model.
6. Discussion
The complete experimental database revealed two sorption mechanisms, as classically
found in the literature for PA6.6: a Henry type sorption mechanism that mainly governs the
MANUSCRIP
T
ACCEPTED
ACCEPTED MANUSCRIPTsorption behavior at low activities and a Flory Huggins sorption mechanism at high activities.
It was also noticed that the maximum water uptake is temperature dependant. The higher the
temperature, the lower the maximum water uptake (for a given activity), which is a new
result, contradicting some recent authors [13, 23]. This temperature dependency is attributed
to the Henry contribution [12, 24, 25], i.e. the linear part of the curve. Our experimental
observations tend to correlate the interpretation that the global shape of the curves does not
change with temperature and that the linear contribution, evaluated from the initial slope, is
clearly temperature dependant.
Four models were challenged to reproduce these experimental observations. In section 4.2, the
Flory Huggins was identified and compared to this database. Fairly good agreement was seen
for low activities, and the temperature dependency is well captured. However, a deviation
between the experimental results and the model prediction appears for water activities over
0.5. Moreover, this deviation appears sooner as the temperature increases. This result can be
attributed to the fact that the influence of the Henry contribution decreases as the temperature
increases due to the effect of the temperature on the maximum water uptake at equilibrium.
Therefore, the non linear aspect appears sooner as the temperature increased. The limitation
of the Flory-Huggins model can be justified thanks to its underlying hypothesis. Indeed, the
model is based on the assumption of random mixing [6] and does not take into consideration
the specific interaction between the sorbent and the substrate, i.e. the formation of water
cluster in our specific case. Therefore, the accuracy of the model is reduced for high water
activities.
The ENSIC model fits better the experimental results over the whole activity range and for all
the temperatures than the Flory-Huggins model. Moreover, the theoretical limitation of the
Flory-Huggins model does not stand for this model since the clustering phenomenon can be
taken into account. However, we can also see a slight reduction of the model accuracy at low
water activity compared to the previous model, and an underestimation of the prediction at
very high water activities. This specific behavior can be explained by an intrinsic limitation of
the model. Indeed, the model can only describe one sorption mechanism (Langmuir, Henry,
clustering) at the same time. Any combination of these phenomena is, by construction of the
model, impossible. Therefore, as at least two sorption mechanisms are observed, this model is
not appropriate. Besides these problems, the ENSIC model seems able to reproduce the
experimental results with an acceptable precision with only 3 parameters. However, as two
MANUSCRIP
T
ACCEPTED
ACCEPTED MANUSCRIPTdifferent physical mechanisms are observed, the use of this model is not recommended,
especially if extrapolation is needed.
The predictions are improved with the modified Park model. Within the whole water activity
range and for all temperatures, the accuracy of the model is excellent, which is very
interesting considering the small number of parameters (4). Moreover, every sorption
mechanisms highlighted during the section dealing with experimental observations has its
own mathematical functions. Therefore, this model is very appropriate for this material and
extrapolation is possible as long as no additional sorption mechanism occurs.
Dealing with the GAB model, very good agreement is observed for all the temperature and all
the water activities. From a visual point of view, no specific differences between the modified
Park and GAB model are observable. However, this model has one additional term compared
to the modified Park model and no improvement can be detected.
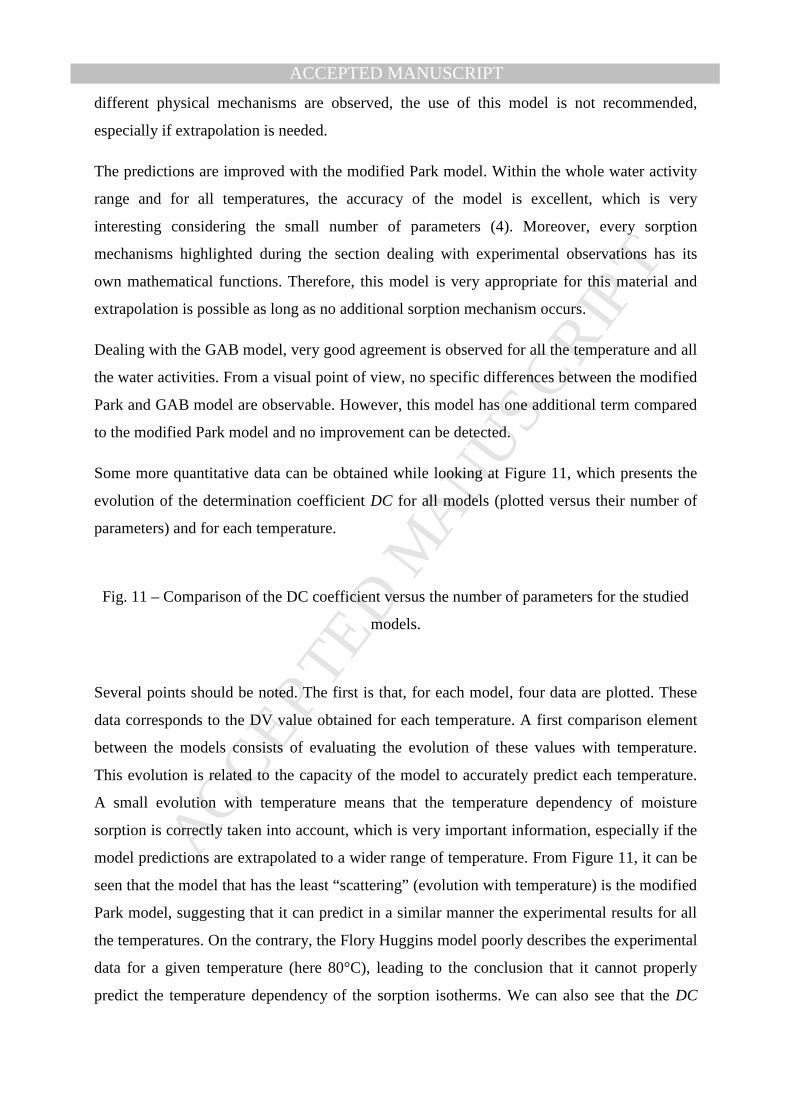
Some more quantitative data can be obtained while looking at Figure 11, which presents the
evolution of the determination coefficient DC for all models (plotted versus their number of
parameters) and for each temperature.
Fig. 11 – Comparison of the DC coefficient versus the number of parameters for the studied
models.
Several points should be noted. The first is that, for each model, four data are plotted. These
data corresponds to the DV value obtained for each temperature. A first comparison element
between the models consists of evaluating the evolution of these values with temperature.
This evolution is related to the capacity of the model to accurately predict each temperature.
A small evolution with temperature means that the temperature dependency of moisture
sorption is correctly taken into account, which is very important information, especially if the
model predictions are extrapolated to a wider range of temperature. From Figure 11, it can be
seen that the model that has the least “scattering” (evolution with temperature) is the modified
Park model, suggesting that it can predict in a similar manner the experimental results for all
the temperatures. On the contrary, the Flory Huggins model poorly describes the experimental
data for a given temperature (here 80°C), leading to the conclusion that it cannot properly
predict the temperature dependency of the sorption isotherms. We can also see that the DC
MANUSCRIP
T
ACCEPTED
ACCEPTED MANUSCRIPTvalue is logically higher for more numerous. However, no differences between the Park model
and the GAB model are observable, leading to the same conclusion as that given in the last
paragraph. Therefore, considering the DC value and its scatter for a given model, it seems
that the best model for describing the temperature dependency of water sorption in PA66 is
the modified Park model.
7. Conclusions
In this study, the sorption of water in PA6.6 films and plates was studied over a wide range of
temperature and water activities. The large database built revealed two sorption mechanisms.
At low water activity, the water uptake at equilibrium is linearly dependent on the water
activity and with an Arrhenius-like temperature dependency. Therefore, the water uptake
obeys Henry’s law. At high activity, a non linear contribution appears and can be related to
the creation of water clusters. These experimental observations were compared to classical
physically-based sorption models. It was found that the Flory Huggins is not able to reproduce
the experimental data at high water activities. The predictions are far better using the ENSIC
model, but a limitation on the number of sorption mechanism prevents the recommendation of
this model for PA66. GAB and modified Park models are equivalent (from a predictability
point of view) since they are able to reproduce the experimental data for every temperature
and the full range of water activities. However, the modified Park model has a simpler
mathematical formulation directly related to the sorption mechanism, and has one parameter
less compared to the GAB model. This model is, therefore, recommended to predict the
temperature dependency of the maximum water sorption in PA66.
MANUSCRIP
T
ACCEPTED
ACCEPTED MANUSCRIPT References
[1] A. Launay, Y. Marco, M.H. Maitournam and I. Raoult, Modelling the influence of temperature and relative humidity on the time-dependant mechanical behavior of a shortglass fiber reinforced polyamide, Mechanics of Materials, 56:1-10:2013.
[2] H.K. Reimschuessel, Relationships on the effect of water on glass transition temperature and Young’s modulus on nylon 6, Journal of Polymer Science: Polymer Chemistry Edition, 16:1229–1236, 1978.
[3] P.E. Bretz, R.W. Hertzberg and J.A. Manson, Influence of absorbed moisture on fatigue crack propagation behaviour in polyamides, Journal of Materials Science, 16:2061-2069, 1981.
[4] D. Valentin, F. Paray and B. Guetta, The hygrothermal behaviour of glass fibre reinforced Pa66 composites: A study of the effect of water absorption on their mechanical properties, Journal of Materials Science, 22:46-56, 1987.
[5] R. Puffr and J. Sebenda, On the structure and properties of polyamide. XXVII. The mechanism of water sorption in polyamides, Journal of Polymer Science Part C: Polymer Symposia, 16:79-93, 1967.
[6] L.-T. Lim, I.-J. Britt, and M.-A. Tung, Sorption and transport of water vapor in nylon 6,6 film, Journal of Applied Polymer Science, 71:197–206, 1999.
[7] M. Akay, Moisture absorption and its influence on the tensile properties of glass-fibre reinforced polyamide 6.6, Polymers & polymer composites, 2:349–354, 1994.
[8] L. Monson, M. Braunwarth, and C. W. Extrand, Moisture absorption by various polyamides and their associated dimensional changes, Journal of Applied Polymer Science, 107:355–363, 2008.
[9] J.A. Barrie and D. Machin, Sorption effects in the measurement of the time lag for water vapor, Journal of Applied Polymer Science, 12:2633–2638, 1968.
[10] S. Brunauer, The Adsorption Of Gases And Vapors Vol I. Oxford University Press, 1943.
[11] P.-Y. Le Gac, G. Roux, P. Davies, B. Fayolle and J. Verdu. Water clustering in polychloroprene. Polymer, 55(12):2861-2866, 2014.
[12] E. Gaudichet-Maurin, F. Thominette, and J. Verdu, Water sorption characteristics in moderately hydrophilic polymers, Part 1: Effect of polar groups concentration and temperature in water sorption in aromatic polysulfones, Journal of Applied Polymer Science, 109:3279–3285, 2008.
[13] C. El Mazry. Durabilité de produits innovants de robinetterie en polyamide 6.6. Phd Thesis ENSAM Paris, 2013.
MANUSCRIP
T
ACCEPTED
ACCEPTED MANUSCRIPT[14] P. Flory, Thermodynamics of high-polymer solutions. Journal of Chemical Physics, 10:51-61, 1942.
[15] M. Huggins, Thermodynamics properties of solutions of long-chain compounds, Annals of the New York Academy of Science, 43:1-32, 1942.
[16] E. Favre, Q.T. Nguyan, R. Clément and J. Néel, The engaged species induced clustering (ENSIC) model: a unified mechanistic approach of sorption phenomena in polymers, Journal of Membrane Science, 117,227:236, 1996.
[17] G.S. Park, Transport principles – solution, diffusion and permeation in polymer membranes, Synthetic Membranes: Science, Engineering and Applications, 181:57-107, 1986.
[18] E.A. Guggenheim, Application of statistical mechanics, Oxford: Clarendon Press, 1966.
[19] R.B. Anderson, Modification of the Brunauer, Emmet and Teller equation. Journal of the American Chemical Society, 68:686-691, 1946.
[20] J.H. de Boer, The dynamic character of adsorption, Oxford: Clarendon Press, 1953.
[21] G. W.Ehrenstein, R.P. Theriault. Polymeric materials: structure, properties, applications. Hanser Verlag. pp. 67–78, 2001.
[22] H. Feng, Modeling of vapor sorption in lglassy polymers using a new dual mode sorption model based on multilayer sorption theory, Polymer, 48:2988-3002, 2007.
[23] B. Ledieu, Vieillissement en milieu eau/glycol du polyamide 66 renforçés de fibrs de verre courtes pou l’application boite à eau de radiateur de refroidissement moteur, Thèse de doctorat, ENSAM Bordeaux, 2010.
[24] A. Tcharkhtchi, P. Y. Bronnec, and J. Verdu, Water absorption characteristics of diglycidylether of butane diol–3,5-diethyl-2,4-diaminotoluene networks, Polymer, 41:5777–5785, 2000.
[25] I. Merdas, F. Thominette, A. Tcharkhtchi, and J. Verdu, Factors governing water absorption by composite matrices, Composites Science and Technology , 62:487–492, 2002.
[26] E. Jones, T. Oliphant, and P. Peterson, “SciPy: Open source scientific tools for Python,” http://www.scipy.org, 2001.
[27] Z. B. Maroulis, E. Tsami, D. Marinos-Kouris, and G. D. Saravacos, Application of the GAB model to the moisture sorption isotherms for dried fruits, Journal of Food Engineering, 7:63–78, 1988.
MANUSCRIP
T
ACCEPTED
ACCEPTED MANUSCRIPT
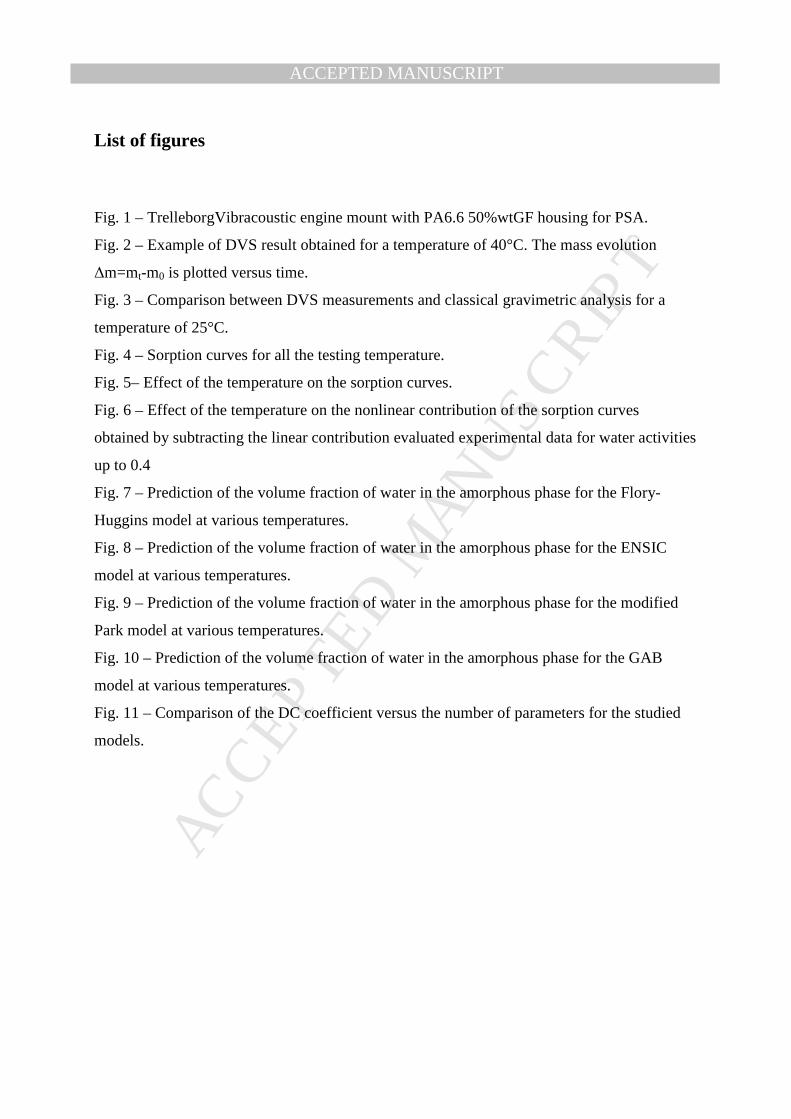
List of figures
Fig. 1 – TrelleborgVibracoustic engine mount with PA6.6 50%wtGF housing for PSA.
Fig. 2 – Example of DVS result obtained for a temperature of 40°C. The mass evolution
∆m=mt-m0 is plotted versus time.
Fig. 3 – Comparison between DVS measurements and classical gravimetric analysis for a
temperature of 25°C.
Fig. 4 – Sorption curves for all the testing temperature.
Fig. 5– Effect of the temperature on the sorption curves.
Fig. 6 – Effect of the temperature on the nonlinear contribution of the sorption curves
obtained by subtracting the linear contribution evaluated experimental data for water activities
up to 0.4
Fig. 7 – Prediction of the volume fraction of water in the amorphous phase for the Flory-
Huggins model at various temperatures.
Fig. 8 – Prediction of the volume fraction of water in the amorphous phase for the ENSIC
model at various temperatures.
Fig. 9 – Prediction of the volume fraction of water in the amorphous phase for the modified
Park model at various temperatures.
Fig. 10 – Prediction of the volume fraction of water in the amorphous phase for the GAB
model at various temperatures.
Fig. 11 – Comparison of the DC coefficient versus the number of parameters for the studied
models.

MANUSCRIP
T
ACCEPTED
ACCEPTED MANUSCRIPTList of tables
Tab. 1 – Optimum parameters of the Flory Huggins model
Tab. 2 – Optimum parameters of the ENSIC model
Tab. 3 – Optimum parameters of the modified Park model
Tab. 4 – Optimum parameters of the GAB model

MANUSCRIP
T
ACCEPTED
ACCEPTED MANUSCRIPT

MANUSCRIP
T
ACCEPTED
ACCEPTED MANUSCRIPT
T i m e [ m i n ]
Mass
evolu
tion [
mg]
0 . 0
0 . 2
0 . 4
0 . 6
0 . 8
1 . 0
a [-]
MANUSCRIP
T
ACCEPTED
ACCEPTED MANUSCRIPT
0 . 0 0 . 2 0 . 4 0 . 6 0 . 8 1 . 00 . 0 00 . 0 20 . 0 40 . 0 60 . 0 80 . 1 00 . 1 20 . 1 4
D V S m e a s u r e m e n t s G r a v i m e t r i c a n a l y s i s
v H2O [
-]
a [ - ]

MANUSCRIP
T
ACCEPTED
ACCEPTED MANUSCRIPT
0 . 0 0 . 1 0 . 2 0 . 3 0 . 4 0 . 5 0 . 6 0 . 7 0 . 8 0 . 9 1 . 00 . 0 00 . 0 20 . 0 40 . 0 60 . 0 80 . 1 00 . 1 20 . 1 4
2 5 ° C 4 0 ° C 6 0 ° C 8 0 ° C
v H2O [-
]
a [ - ]

MANUSCRIP
T
ACCEPTED
ACCEPTED MANUSCRIPT
0 2 0 4 0 6 0 8 0 1 0 00 . 0 0
0 . 0 1
0 . 0 2
0 . 0 3
0 . 0 4
0 . 0 5
0 . 0 6
a = 0 . 1 a = 0 . 2 a = 0 . 3 a = 0 . 4 a = 0 . 5 a = 0 . 6
v H2O [-
]
T e m p e r a t u r e [ ° C ]
MANUSCRIP
T
ACCEPTED
ACCEPTED MANUSCRIPT
0 . 0 0 . 2 0 . 4 0 . 6 0 . 8 1 . 0- 0 . 0 10 . 0 00 . 0 10 . 0 20 . 0 30 . 0 40 . 0 50 . 0 6
E x p . d a t a @ 2 5 ° C E x p . d a t a @ 4 0 ° C E x p . d a t a @ 6 0 ° C E x p . d a t a @ 8 0 ° C
v H2O [-
]
a [ - ]

MANUSCRIP
T
ACCEPTED
ACCEPTED MANUSCRIPT
(a) 25°C (b) 40°C
(c) 60°C (d) 80°C
0.0 0.2 0.4 0.6 0.8 1.00.00
0.02
0.04
0.06
0.08
0.10
0.12
0.14
Exp. data @ 25°CModel
v H2O
[-]
a [-]
0.0 0.2 0.4 0.6 0.8 1.00.00
0.02
0.04
0.06
0.08
0.10
0.12
0.14
Exp. data @ 40°CModel
v H2O
[-]
a [-]
0.0 0.2 0.4 0.6 0.8 1.00.00
0.02
0.04
0.06
0.08
0.10
0.12
0.14
Exp. data @ 60°CModel
v H2O
[-]
a [-]
0.0 0.2 0.4 0.6 0.8 1.00.00
0.02
0.04
0.06
0.08
0.10
0.12
0.14
Exp. data @ 80°CModel
v H2O
[-]
a [-]

MANUSCRIP
T
ACCEPTED
ACCEPTED MANUSCRIPT
0 1 2 3 4 5 60 . 8 8
0 . 9 0
0 . 9 2
0 . 9 4
0 . 9 6
0 . 9 8
1 . 0 0DC
[-]
n p a r a m [ - ]