Embed Size (px)
Citation preview
Bioresource Technology 117 (2012) 13–19
Contents lists available at SciVerse ScienceDirect
Bioresource Technology
journal homepage: www.elsevier .com/locate /bior tech
Moisture variation associated with water input and evaporation during sewagesludge bio-drying
Lu Cai, Ding Gao ⇑, Tong-Bin Chen, Hong-Tao Liu, Guo-Di Zheng, Qi-Wei YangCenter for Environmental Remediation, Institute of Geographic Sciences and Natural Resources Research, Chinese Academy of Sciences, 11A Datun Road, Beijing 100101, PR China
a r t i c l e i n f o
Article history:Received 14 February 2012Received in revised form 29 March 2012Accepted 29 March 2012Available online 4 April 2012
Keywords:Sewage sludgeBio-dryingMoisture contentWater evaporationWater generation
0960-8524/$ - see front matter � 2012 Published byhttp://dx.doi.org/10.1016/j.biortech.2012.03.092
⇑ Corresponding author. Tel./fax: +86 10 64889303E-mail address: [email protected] (D. Gao).
a b s t r a c t
The variation of moisture during sewage sludge bio-drying was investigated. In situ measurements wereconducted to monitor the bulk moisture and water vapor, while the moisture content, water generation,water evaporation and aeration water input of the bio-drying bulk were calculated based on the watermass balance. The moisture in the sewage sludge bio-drying material decreased from 66% to 54% inresponse to control technology for bio-drying. During the temperature increasing and thermophilicphases of sewage sludge bio-drying, the moisture content, water generation and water evaporation ofthe bulk initially increased and then decreased. The peak water generation and evaporation occurred dur-ing the thermophilic phase. During the bio-drying, water evaporation was much greater than water gen-eration, and aeration facilitated the water evaporation.
� 2012 Published by Elsevier Ltd.
1. Introduction
The moisture content (MC) of dewatered sewage sludge is about80%, which causes a series of problems in terms of sludge treat-ment and disposal; therefore, reducing sludge moisture is impor-tant to the reduction of sludge volume and quantity (Zhao et al.,2010). Sludge bio-drying is an economical and energy-savingmethod of simplifying thermophilic aerobic fermentation that uti-lizes the biological energy produced by microbial fermentation toactivate bound water and evaporate moisture (Navaee-Ardehet al., 2010), resulting in rapid reduction of the moisture in thebio-drying material (Zhang et al., 2008). The main drying mecha-nism in bio-drying is convective evaporation, which utilizes heatproduced from the biodegradation of organic matter and is facili-tated by mechanically controlled aeration (Navaee-Ardeh et al.,2006). The process by which the moisture of the bio-drying mate-rial is reduced is as follows: water molecules evaporate from thesurface of the material into the air, after which the evaporatedwater (vapor) is transported and removed by airflow (Velis et al.,2009). Air convection and molecular diffusion are the primary ap-proaches to the removal of water from bio-drying material (Freiet al., 2004).
Moisture is a critical parameter involved in bio-drying technol-ogy that influences the complex biochemical reactions associatedwith microbial growth and the biodegradation of organic matter
Elsevier Ltd.
.
that occurs during the process (Ryckeboer et al., 2003). In addition,maximizing the removal of moisture present in bio-drying bulk is acrucial pre-treatment step that is beneficial to sludge treatmentand disposal (Velis et al., 2009).
The water mass balance of bio-drying bulk indicates that varia-tions in bulk moisture are associated with water input and wateroutput. Water input includes: (1) water generation (WG), whichis water produced by microbial metabolism during organic matterdecomposition (Sole-Mauri et al., 2007; Zhang et al., 2010); and (2)aeration water input (AWI), which is moisture added to the bulkduring forced aeration. In a study conducted by Chen (2010), theairflow from the air chamber under the bulk removed moisturefrom the bottom of the bulk and no leachate was collected; there-fore, it is assumed that no leachate is produced during drying of thebulk. As a result, the water is removed by water evaporation (WE)during bio-drying. WE is achieved via the evaporation of free waterand primarily removed by air convection (Velis et al., 2009).Accordingly, the water output is actually the water evaporatedfrom the bulk material. In addition, the apparent moisture reduc-tion (AMR) is defined as the difference between two MC valuesmeasured at different times. During bio-drying, the degree of dry-ing depends on the ratio of water output to water input (Richard,2004).
Investigation of the WG and WE during sludge bio-drying isbeneficial to improving the efficiency of moisture reduction andcontributes to reduction of the sludge volume. However, recentstudies have focused on the MC of the bulk itself, and few studieshave investigated the water mass balance. Accordingly, the waterinput and evaporation during sludge bio-drying is not fully
Nomenclature
MH2O;t total moisture of the bio-drying bulk on day t (kg)M0 initial weight of the bio-drying bulk on day 1 (kg)MC0 moisture content of the bio-drying material on day 1 (%)VS0 volatile solids content of the bio-drying material on day
1 (%)MCt moisture content of the bio-drying material on day t (%)VSt volatile solids content of the bio-drying material on day
t (%)q0 density of the bio-drying bulk on day 1 (kg m�3)V volume of the bio-drying bulk on day 1 (m3)e vapor flux above the bulk surface (kg m�2 s�1)qe specific humidity of the airflow above the bulk surface
(kg water kg�1 air)ue vertical air velocity of the airflow above the bulk surface
(m s�1)
qe density of the air above the bulk surface (kg m�3)Mwater molecular mass of water (g mol�1)Mair molecular mass of air (g mol�1)T temperature of air (�C)b relative humidity of air (%)E water evaporation of the bulk (kg)Mi water vapor input per second (kg s�1)qi density of forced air (kg m�3)Qi volume of forced air (m3 s�1)qi specific humidity of air forced into the bulk (kg water
kg�1 air)I aeration water input of the bulk (kg)DMH2O;a apparent moisture reduction of the bulk (kg)MH2O;t�1 total moisture of the bulk on day t-1 (kg)DMH2O;g water generation of the bulk (kg)
14 L. Cai et al. / Bioresource Technology 117 (2012) 13–19
understood. Therefore, this study was conducted to investigate thevariations in water input and evaporation of sludge bio-drying bulkin terms of a water mass balance developed via in situ moisture andvapor measurement.
2. Methods
2.1. Bio-drying materials
Sewage sludge (SS) was collected from the municipal wastewa-ter treatment plant in Qinhuangdao, China. Sawdust (SD) was ac-quired from wood-working factories in the same city. Bio-driedproduct (BP) was obtained from Lvgang Municipal Sewage SludgeTreatment Plant, which is a SS bio-drying plant in Qinghuangdao,China. SD and BP were used as bulking agents for bio-drying. Spe-cifically, these materials were added to three feed bins and thenfed into a mixing machine by screw conveyors. The mixing ratioof the three materials was 3:2:1 (SS:BP:SD) based on volume,and this was set by adjusting the rotating speed of the screw con-veyors. This ratio was selected based on the initial MC and free airspace of bio-drying material that was appropriate for microbial fer-mentation (Adhikari et al., 2009; Chen et al., 2011). The character-istics of the raw materials and mixture feedstock used in this studyare presented in Table 1.
2.2. Experimental procedures
The mixture for bio-drying was loaded into the fermentationcompartment and then flattened using a slope trimmer. The processof sludge bio-drying was conducted by CTB (control technology forbio-drying) auto-control based on a combination of temperatureand O2 concentration feedback from temperature sensors andoxygen sensors, which were controlled using Compsoft� 3.0 (Green-Tech Environmental Engineering Ltd., Beijing, China) (Chen et al.,2011). Air was forced from the air chamber under the bulk to thetop of the bulk by an air blower. The volume of forced air was ad-justed according to the bulk temperature and O2 consumption rateduring different bio-drying phases (Chen et al., 2011).
The experimental equipment for SS bio-drying is shown in Fig. 1.An unsealed cylindrical cover made of hydrophobic material wasvertically installed into the bulk from top to bottom to minimizethe interference caused by external factors. The cylindrical coverhad an internal diameter of 1.13 m and a cross-sectional area of1.0 m2, and the bio-drying bulk was 1.6 m in height; therefore, thevolume of the experimental bulk material was about 1.6 m3
(1.0 m2 � 1.6 m). A water vapor sensor was installed along the
central axis of the cylindrical cover about 0.5 m above the top ofthe bulk. A moisture sensor and temperature sensor were insertedinto the bulk at a depth of 0.6 m (from top to bottom). An airflowmeter was located in the horizontal ventilation duct from the airblower to the air chamber. The period of sludge bio-drying was20 days and the bio-drying bulk was intermittently aerated usingan air blower throughout the study period. In addition, the bulkwas turned on days 9, 12, 15 and 18.
2.3. Data acquisition and sample analysis
Bulk temperature was monitored in real time using a PT100temperature sensor throughout the study period. The MC of thebio-drying material was measured using a moisture sensor basedon time domain reflectometry that consisted of a pulse generator(Soilmoisture Equipment Corp., USA) and probes. The MC wasdetermined by in situ analysis of 15 replicates at the same timeevery day. A water vapor sensor composed of an ultrasonic ane-mometer (Gill Instruments, UK), a temperature sensor and ahumidity sensor (Rotronic, Switzerland), was used to log data fromthree replicates at a 2-s interval. Airflow was measured in real timeusing a thermal flowmeter (Virvo, USA) and data were logged at a1-min interval based on three replicates. Additionally, bio-dryingmaterial was collected from the bulk daily to measure the volatilesolids (VS) content, which was determined by oven-drying of thesample and subsequent incineration in a muffle furnace. The col-lected bio-drying material was also used to determine the bulkdensity by the cutting ring method. The VS and bulk density weredetermined based on five replicates analyzed using the methodsdescribed by the US Department of Agriculture and US CompostingCouncil (2001).
2.4. Formulas for data computation
During sludge bio-drying, the WE accounted for the total wateroutput, while the water input consisted of WG and AWI. The differ-ence between the two values of total moisture is the AMR.
2.4.1. Total moisture of bulkIn this study, MC is expressed on a wet weight basis (i.e., weight
of moisture/wet weight of sample). Assuming that the change inthe weight of the bulk is determined by the degradation of VSand migration of moisture, and that the ash content of the bulkdoes not change throughout the bio-drying process, the totalweight of moisture of the bulk on day t can be obtained from thefollowing formula:
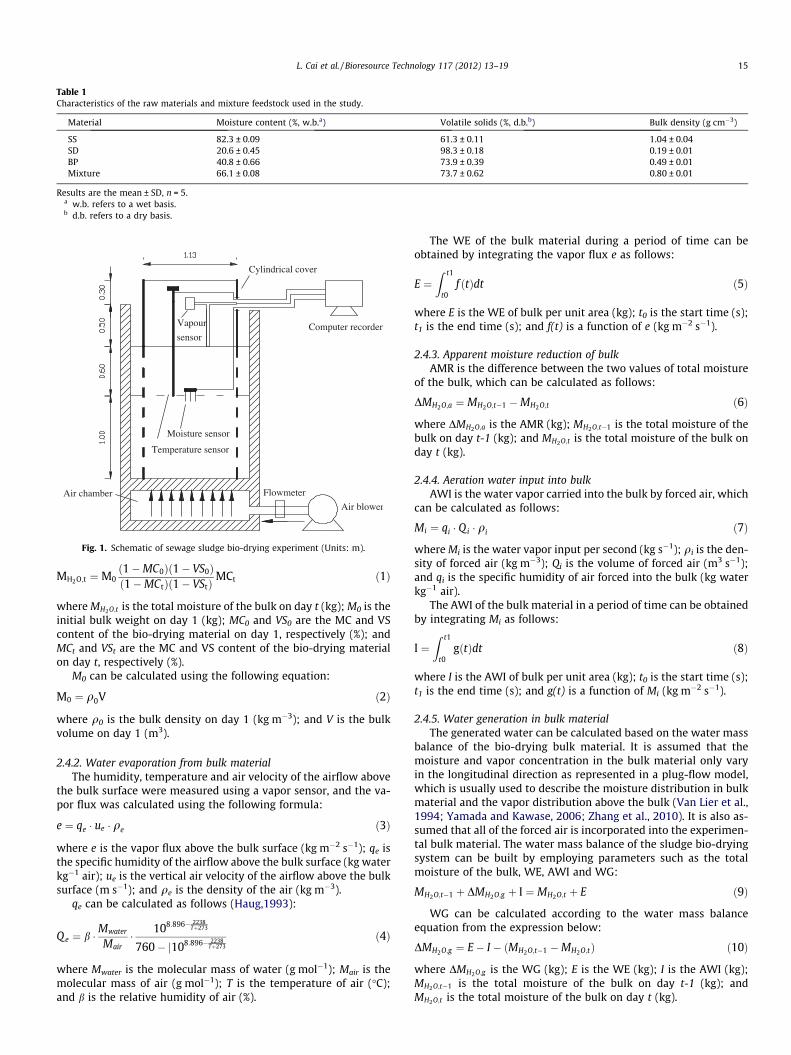
Table 1Characteristics of the raw materials and mixture feedstock used in the study.
Material Moisture content (%, w.b.a) Volatile solids (%, d.b.b) Bulk density (g cm�3)
SS 82.3 ± 0.09 61.3 ± 0.11 1.04 ± 0.04SD 20.6 ± 0.45 98.3 ± 0.18 0.19 ± 0.01BP 40.8 ± 0.66 73.9 ± 0.39 0.49 ± 0.01Mixture 66.1 ± 0.08 73.7 ± 0.62 0.80 ± 0.01
Results are the mean ± SD, n = 5.a w.b. refers to a wet basis.b d.b. refers to a dry basis.
Cylindrical cover
Vapour
sensorComputer recorder
Air blowerAir chamber
Moisture sensor
Temperature sensor
Flowmeter
Fig. 1. Schematic of sewage sludge bio-drying experiment (Units: m).
L. Cai et al. / Bioresource Technology 117 (2012) 13–19 15
MH2O;t ¼M0ð1�MC0Þð1� VS0Þð1�MCtÞð1� VStÞ
MCt ð1Þ
where MH2O;t is the total moisture of the bulk on day t (kg); M0 is theinitial bulk weight on day 1 (kg); MC0 and VS0 are the MC and VScontent of the bio-drying material on day 1, respectively (%); andMCt and VSt are the MC and VS content of the bio-drying materialon day t, respectively (%).
M0 can be calculated using the following equation:
M0 ¼ q0V ð2Þ
where q0 is the bulk density on day 1 (kg m�3); and V is the bulkvolume on day 1 (m3).
2.4.2. Water evaporation from bulk materialThe humidity, temperature and air velocity of the airflow above
the bulk surface were measured using a vapor sensor, and the va-por flux was calculated using the following formula:
e ¼ qe � ue � qe ð3Þ
where e is the vapor flux above the bulk surface (kg m�2 s�1); qe isthe specific humidity of the airflow above the bulk surface (kg waterkg�1 air); ue is the vertical air velocity of the airflow above the bulksurface (m s�1); and qe is the density of the air (kg m�3).
qe can be calculated as follows (Haug,1993):
Q e ¼ b �Mwater
Mair� 108:896� 2238
Tþ273
760� j108:896� 2238Tþ273
ð4Þ
where Mwater is the molecular mass of water (g mol�1); Mair is themolecular mass of air (g mol�1); T is the temperature of air (�C);and b is the relative humidity of air (%).
The WE of the bulk material during a period of time can beobtained by integrating the vapor flux e as follows:
E ¼Z t1
t0f ðtÞdt ð5Þ
where E is the WE of bulk per unit area (kg); t0 is the start time (s);t1 is the end time (s); and f(t) is a function of e (kg m�2 s�1).
2.4.3. Apparent moisture reduction of bulkAMR is the difference between the two values of total moisture
of the bulk, which can be calculated as follows:
DMH2O;a ¼ MH2O;t�1 �MH2O;t ð6Þ
where DMH2O;a is the AMR (kg); MH2O;t�1 is the total moisture of thebulk on day t-1 (kg); and MH2O;t is the total moisture of the bulk onday t (kg).
2.4.4. Aeration water input into bulkAWI is the water vapor carried into the bulk by forced air, which
can be calculated as follows:
Mi ¼ qi � Qi � qi ð7Þ
where Mi is the water vapor input per second (kg s�1); qi is the den-sity of forced air (kg m�3); Qi is the volume of forced air (m3 s�1);and qi is the specific humidity of air forced into the bulk (kg waterkg�1 air).
The AWI of the bulk material in a period of time can be obtainedby integrating Mi as follows:
I ¼Z t1
t0gðtÞdt ð8Þ
where I is the AWI of bulk per unit area (kg); t0 is the start time (s);t1 is the end time (s); and g(t) is a function of Mi (kg m�2 s�1).
2.4.5. Water generation in bulk materialThe generated water can be calculated based on the water mass
balance of the bio-drying bulk material. It is assumed that themoisture and vapor concentration in the bulk material only varyin the longitudinal direction as represented in a plug-flow model,which is usually used to describe the moisture distribution in bulkmaterial and the vapor distribution above the bulk (Van Lier et al.,1994; Yamada and Kawase, 2006; Zhang et al., 2010). It is also as-sumed that all of the forced air is incorporated into the experimen-tal bulk material. The water mass balance of the sludge bio-dryingsystem can be built by employing parameters such as the totalmoisture of the bulk, WE, AWI and WG:
MH2O;t�1 þ DMH2O;g þ I ¼ MH2O;t þ E ð9Þ
WG can be calculated according to the water mass balanceequation from the expression below:
DMH2O;g ¼ E� I � ðMH2O;t�1 �MH2O;tÞ ð10Þ
where DMH2O;g is the WG (kg); E is the WE (kg); I is the AWI (kg);MH2O;t�1 is the total moisture of the bulk on day t-1 (kg); andMH2O;t is the total moisture of the bulk on day t (kg).
16 L. Cai et al. / Bioresource Technology 117 (2012) 13–19
3. Results and discussion
3.1. Moisture content and volatile solids content of bio-drying material
The bio-drying bulk material entered the thermophilic phase onday 3, and its maximum temperature exceeded 70 �C on day 9.After the first turning on day 9, the bulk entered the second tem-perature increasing phase. At the end of the bio-drying process,the bulk temperature decreased to that of the surrounding temper-ature (21.9 �C). The MC of the bio-drying material was reducedfrom 66.1% ± 0.08% to 54.7% ± 0.12%. During the temperatureincreasing phase (from day 1 to day 3), the MC increased slightly,was maintained at a relatively high state (66.0% ± 0.31%), then de-creased rapidly at a rate of 1.34% d�1 on days 4–8. The MC contin-ued to decrease on days 8 and 9, but at a slower rate of 0.92% d�1.After turning, the decline rate of MC increased to 1.55% d�1. There-after, the MC decreased gradually as the sludge bio-drying processcontinued. The decline rate was 0.51% d�1 on days 16–20, duringwhich period it tended to be constant.
The VS content of the bio-drying material was also measured,which was used in equation (1) to determine the total moistureof the bulk. The VS content decreased from 73.7% ± 0.62% to66.7% ± 0.21% during sludge bio-drying. An intense degradationof VS was present on days 1–4 at a decline rate of 1.05% d�1, whilethe decline rate was greatly reduced to 0.17% d�1 from day 16 today 20.
3.2. Water output
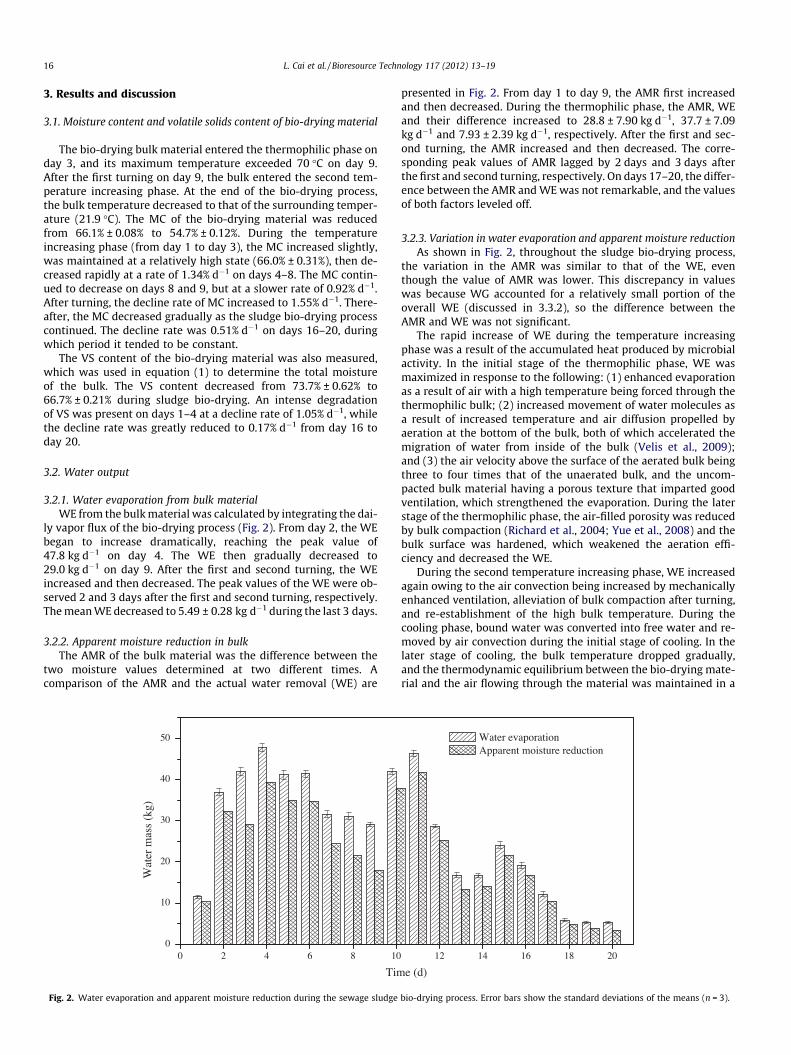
3.2.1. Water evaporation from bulk materialWE from the bulk material was calculated by integrating the dai-
ly vapor flux of the bio-drying process (Fig. 2). From day 2, the WEbegan to increase dramatically, reaching the peak value of47.8 kg d�1 on day 4. The WE then gradually decreased to29.0 kg d�1 on day 9. After the first and second turning, the WEincreased and then decreased. The peak values of the WE were ob-served 2 and 3 days after the first and second turning, respectively.The mean WE decreased to 5.49 ± 0.28 kg d�1 during the last 3 days.
3.2.2. Apparent moisture reduction in bulkThe AMR of the bulk material was the difference between the
two moisture values determined at two different times. Acomparison of the AMR and the actual water removal (WE) are
0 2 4 6 8 100
10
20
30
40
50
Wat
er m
ass
(kg)
Tim
Fig. 2. Water evaporation and apparent moisture reduction during the sewage sludge
presented in Fig. 2. From day 1 to day 9, the AMR first increasedand then decreased. During the thermophilic phase, the AMR, WEand their difference increased to 28.8 ± 7.90 kg d�1, 37.7 ± 7.09kg d�1 and 7.93 ± 2.39 kg d�1, respectively. After the first and sec-ond turning, the AMR increased and then decreased. The corre-sponding peak values of AMR lagged by 2 days and 3 days afterthe first and second turning, respectively. On days 17–20, the differ-ence between the AMR and WE was not remarkable, and the valuesof both factors leveled off.
3.2.3. Variation in water evaporation and apparent moisture reductionAs shown in Fig. 2, throughout the sludge bio-drying process,
the variation in the AMR was similar to that of the WE, eventhough the value of AMR was lower. This discrepancy in valueswas because WG accounted for a relatively small portion of theoverall WE (discussed in 3.3.2), so the difference between theAMR and WE was not significant.
The rapid increase of WE during the temperature increasingphase was a result of the accumulated heat produced by microbialactivity. In the initial stage of the thermophilic phase, WE wasmaximized in response to the following: (1) enhanced evaporationas a result of air with a high temperature being forced through thethermophilic bulk; (2) increased movement of water molecules asa result of increased temperature and air diffusion propelled byaeration at the bottom of the bulk, both of which accelerated themigration of water from inside of the bulk (Velis et al., 2009);and (3) the air velocity above the surface of the aerated bulk beingthree to four times that of the unaerated bulk, and the uncom-pacted bulk material having a porous texture that imparted goodventilation, which strengthened the evaporation. During the laterstage of the thermophilic phase, the air-filled porosity was reducedby bulk compaction (Richard et al., 2004; Yue et al., 2008) and thebulk surface was hardened, which weakened the aeration effi-ciency and decreased the WE.
During the second temperature increasing phase, WE increasedagain owing to the air convection being increased by mechanicallyenhanced ventilation, alleviation of bulk compaction after turning,and re-establishment of the high bulk temperature. During thecooling phase, bound water was converted into free water and re-moved by air convection during the initial stage of cooling. In thelater stage of cooling, the bulk temperature dropped gradually,and the thermodynamic equilibrium between the bio-drying mate-rial and the air flowing through the material was maintained in a
12 14 16 18 20
e (d)
Water evaporation Apparent moisture reduction
bio-drying process. Error bars show the standard deviations of the means (n = 3).
L. Cai et al. / Bioresource Technology 117 (2012) 13–19 17
constant state. Consequently, convection reached the hygroscopiclimit, resulting in a low WE (Velis et al., 2009).
3.3. Water input
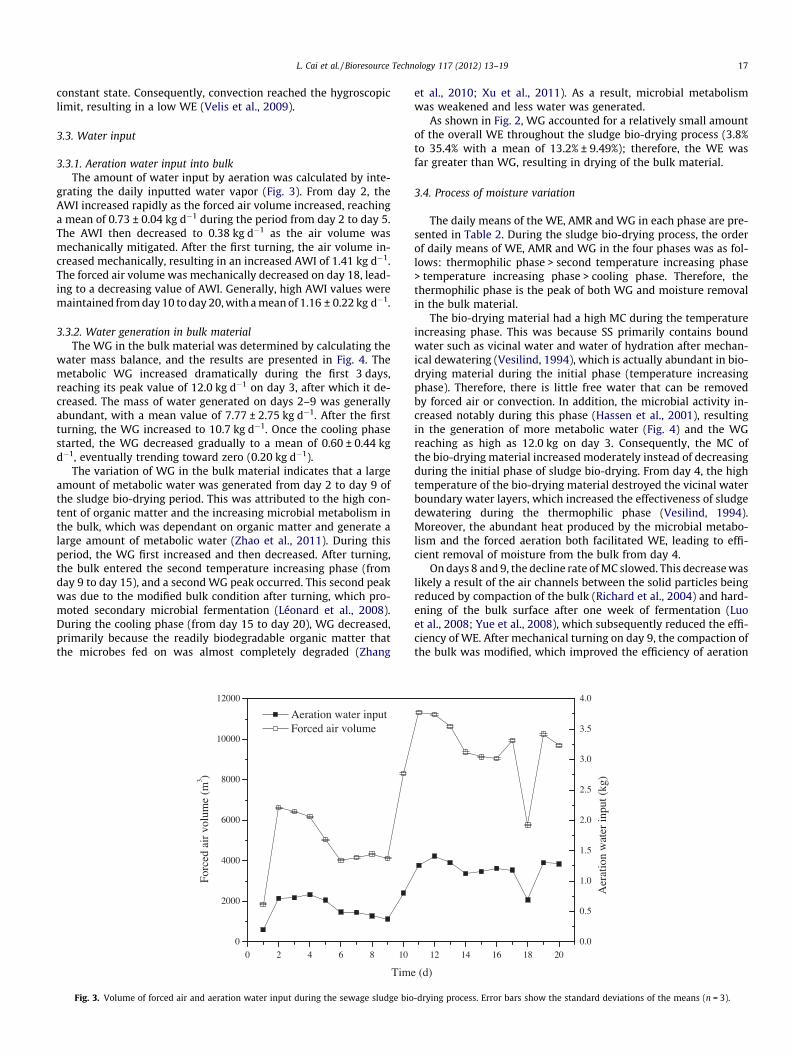
3.3.1. Aeration water input into bulkThe amount of water input by aeration was calculated by inte-
grating the daily inputted water vapor (Fig. 3). From day 2, theAWI increased rapidly as the forced air volume increased, reachinga mean of 0.73 ± 0.04 kg d�1 during the period from day 2 to day 5.The AWI then decreased to 0.38 kg d�1 as the air volume wasmechanically mitigated. After the first turning, the air volume in-creased mechanically, resulting in an increased AWI of 1.41 kg d�1.The forced air volume was mechanically decreased on day 18, lead-ing to a decreasing value of AWI. Generally, high AWI values weremaintained from day 10 to day 20, with a mean of 1.16 ± 0.22 kg d�1.
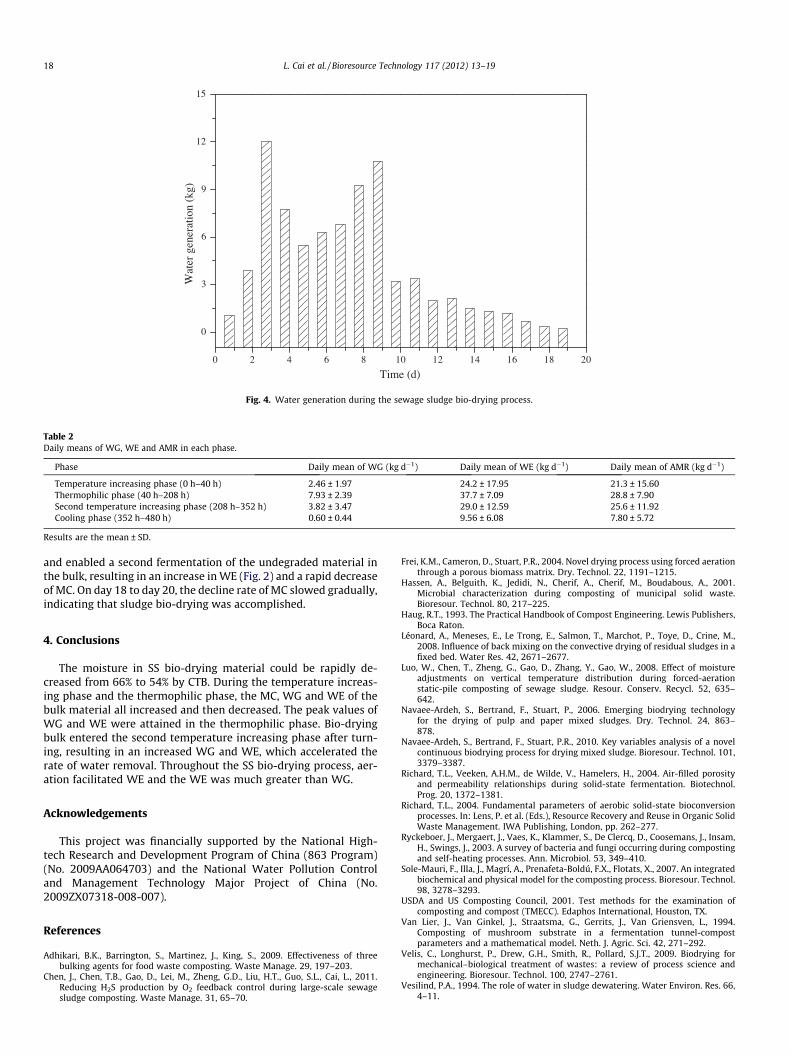
3.3.2. Water generation in bulk materialThe WG in the bulk material was determined by calculating the
water mass balance, and the results are presented in Fig. 4. Themetabolic WG increased dramatically during the first 3 days,reaching its peak value of 12.0 kg d�1 on day 3, after which it de-creased. The mass of water generated on days 2–9 was generallyabundant, with a mean value of 7.77 ± 2.75 kg d�1. After the firstturning, the WG increased to 10.7 kg d�1. Once the cooling phasestarted, the WG decreased gradually to a mean of 0.60 ± 0.44 kgd�1, eventually trending toward zero (0.20 kg d�1).
The variation of WG in the bulk material indicates that a largeamount of metabolic water was generated from day 2 to day 9 ofthe sludge bio-drying period. This was attributed to the high con-tent of organic matter and the increasing microbial metabolism inthe bulk, which was dependant on organic matter and generate alarge amount of metabolic water (Zhao et al., 2011). During thisperiod, the WG first increased and then decreased. After turning,the bulk entered the second temperature increasing phase (fromday 9 to day 15), and a second WG peak occurred. This second peakwas due to the modified bulk condition after turning, which pro-moted secondary microbial fermentation (Léonard et al., 2008).During the cooling phase (from day 15 to day 20), WG decreased,primarily because the readily biodegradable organic matter thatthe microbes fed on was almost completely degraded (Zhang
0 2 4 6 8 10
0
2000
4000
6000
8000
10000
12000
Forc
ed a
ir v
olum
e (m
3 )
Time
Aeration water input Forced air volume
Fig. 3. Volume of forced air and aeration water input during the sewage sludge bio
et al., 2010; Xu et al., 2011). As a result, microbial metabolismwas weakened and less water was generated.
As shown in Fig. 2, WG accounted for a relatively small amountof the overall WE throughout the sludge bio-drying process (3.8%to 35.4% with a mean of 13.2% ± 9.49%); therefore, the WE wasfar greater than WG, resulting in drying of the bulk material.
3.4. Process of moisture variation
The daily means of the WE, AMR and WG in each phase are pre-sented in Table 2. During the sludge bio-drying process, the orderof daily means of WE, AMR and WG in the four phases was as fol-lows: thermophilic phase > second temperature increasing phase> temperature increasing phase > cooling phase. Therefore, thethermophilic phase is the peak of both WG and moisture removalin the bulk material.
The bio-drying material had a high MC during the temperatureincreasing phase. This was because SS primarily contains boundwater such as vicinal water and water of hydration after mechan-ical dewatering (Vesilind, 1994), which is actually abundant in bio-drying material during the initial phase (temperature increasingphase). Therefore, there is little free water that can be removedby forced air or convection. In addition, the microbial activity in-creased notably during this phase (Hassen et al., 2001), resultingin the generation of more metabolic water (Fig. 4) and the WGreaching as high as 12.0 kg on day 3. Consequently, the MC ofthe bio-drying material increased moderately instead of decreasingduring the initial phase of sludge bio-drying. From day 4, the hightemperature of the bio-drying material destroyed the vicinal waterboundary water layers, which increased the effectiveness of sludgedewatering during the thermophilic phase (Vesilind, 1994).Moreover, the abundant heat produced by the microbial metabo-lism and the forced aeration both facilitated WE, leading to effi-cient removal of moisture from the bulk from day 4.
On days 8 and 9, the decline rate of MC slowed. This decrease waslikely a result of the air channels between the solid particles beingreduced by compaction of the bulk (Richard et al., 2004) and hard-ening of the bulk surface after one week of fermentation (Luoet al., 2008; Yue et al., 2008), which subsequently reduced the effi-ciency of WE. After mechanical turning on day 9, the compaction ofthe bulk was modified, which improved the efficiency of aeration
12 14 16 18 20
(d)
0.0
0.5
1.0
1.5
2.0
2.5
3.0
3.5
4.0
Aer
atio
n w
ater
inpu
t (kg
)
-drying process. Error bars show the standard deviations of the means (n = 3).
0 2 4 6 8 10 12 14 16 18 20
0
3
6
9
12
15
Wat
er g
ener
atio
n (k
g)
Time (d)
Fig. 4. Water generation during the sewage sludge bio-drying process.
Table 2Daily means of WG, WE and AMR in each phase.
Phase Daily mean of WG (kg d�1) Daily mean of WE (kg d�1) Daily mean of AMR (kg d�1)
Temperature increasing phase (0 h–40 h) 2.46 ± 1.97 24.2 ± 17.95 21.3 ± 15.60Thermophilic phase (40 h–208 h) 7.93 ± 2.39 37.7 ± 7.09 28.8 ± 7.90Second temperature increasing phase (208 h–352 h) 3.82 ± 3.47 29.0 ± 12.59 25.6 ± 11.92Cooling phase (352 h–480 h) 0.60 ± 0.44 9.56 ± 6.08 7.80 ± 5.72
Results are the mean ± SD.
18 L. Cai et al. / Bioresource Technology 117 (2012) 13–19
and enabled a second fermentation of the undegraded material inthe bulk, resulting in an increase in WE (Fig. 2) and a rapid decreaseof MC. On day 18 to day 20, the decline rate of MC slowed gradually,indicating that sludge bio-drying was accomplished.
4. Conclusions
The moisture in SS bio-drying material could be rapidly de-creased from 66% to 54% by CTB. During the temperature increas-ing phase and the thermophilic phase, the MC, WG and WE of thebulk material all increased and then decreased. The peak values ofWG and WE were attained in the thermophilic phase. Bio-dryingbulk entered the second temperature increasing phase after turn-ing, resulting in an increased WG and WE, which accelerated therate of water removal. Throughout the SS bio-drying process, aer-ation facilitated WE and the WE was much greater than WG.
Acknowledgements
This project was financially supported by the National High-tech Research and Development Program of China (863 Program)(No. 2009AA064703) and the National Water Pollution Controland Management Technology Major Project of China (No.2009ZX07318-008-007).
References
Adhikari, B.K., Barrington, S., Martinez, J., King, S., 2009. Effectiveness of threebulking agents for food waste composting. Waste Manage. 29, 197–203.
Chen, J., Chen, T.B., Gao, D., Lei, M., Zheng, G.D., Liu, H.T., Guo, S.L., Cai, L., 2011.Reducing H2S production by O2 feedback control during large-scale sewagesludge composting. Waste Manage. 31, 65–70.
Frei, K.M., Cameron, D., Stuart, P.R., 2004. Novel drying process using forced aerationthrough a porous biomass matrix. Dry. Technol. 22, 1191–1215.
Hassen, A., Belguith, K., Jedidi, N., Cherif, A., Cherif, M., Boudabous, A., 2001.Microbial characterization during composting of municipal solid waste.Bioresour. Technol. 80, 217–225.
Haug, R.T., 1993. The Practical Handbook of Compost Engineering. Lewis Publishers,Boca Raton.
Léonard, A., Meneses, E., Le Trong, E., Salmon, T., Marchot, P., Toye, D., Crine, M.,2008. Influence of back mixing on the convective drying of residual sludges in afixed bed. Water Res. 42, 2671–2677.
Luo, W., Chen, T., Zheng, G., Gao, D., Zhang, Y., Gao, W., 2008. Effect of moistureadjustments on vertical temperature distribution during forced-aerationstatic-pile composting of sewage sludge. Resour. Conserv. Recycl. 52, 635–642.
Navaee-Ardeh, S., Bertrand, F., Stuart, P., 2006. Emerging biodrying technologyfor the drying of pulp and paper mixed sludges. Dry. Technol. 24, 863–878.
Navaee-Ardeh, S., Bertrand, F., Stuart, P.R., 2010. Key variables analysis of a novelcontinuous biodrying process for drying mixed sludge. Bioresour. Technol. 101,3379–3387.
Richard, T.L., Veeken, A.H.M., de Wilde, V., Hamelers, H., 2004. Air-filled porosityand permeability relationships during solid-state fermentation. Biotechnol.Prog. 20, 1372–1381.
Richard, T.L., 2004. Fundamental parameters of aerobic solid-state bioconversionprocesses. In: Lens, P. et al. (Eds.), Resource Recovery and Reuse in Organic SolidWaste Management. IWA Publishing, London, pp. 262–277.
Ryckeboer, J., Mergaert, J., Vaes, K., Klammer, S., De Clercq, D., Coosemans, J., Insam,H., Swings, J., 2003. A survey of bacteria and fungi occurring during compostingand self-heating processes. Ann. Microbiol. 53, 349–410.
Sole-Mauri, F., Illa, J., Magrí, A., Prenafeta-Boldú, F.X., Flotats, X., 2007. An integratedbiochemical and physical model for the composting process. Bioresour. Technol.98, 3278–3293.
USDA and US Composting Council, 2001. Test methods for the examination ofcomposting and compost (TMECC). Edaphos International, Houston, TX.
Van Lier, J., Van Ginkel, J., Straatsma, G., Gerrits, J., Van Griensven, L., 1994.Composting of mushroom substrate in a fermentation tunnel-compostparameters and a mathematical model. Neth. J. Agric. Sci. 42, 271–292.
Velis, C., Longhurst, P., Drew, G.H., Smith, R., Pollard, S.J.T., 2009. Biodrying formechanical–biological treatment of wastes: a review of process science andengineering. Bioresour. Technol. 100, 2747–2761.
Vesilind, P.A., 1994. The role of water in sludge dewatering. Water Environ. Res. 66,4–11.

L. Cai et al. / Bioresource Technology 117 (2012) 13–19 19
Xu, H., He, P., Wang, G., Shao, L., Lee, D., 2011. Anaerobic storage as a pretreatmentfor enhanced biodegradability of dewatered sewage sludge. Bioresour. Technol.102, 667–671.
Yamada, Y., Kawase, Y., 2006. Aerobic composting of waste activated sludge: Kineticanalysis for microbiological reaction and oxygen consumption. Waste Manage.26, 49–61.
Yue, B., Chen, T.B., Gao, D., Zheng, G.D., Liu, B., Lee, D.J., 2008. Pile settlement andvolume reduction measurement during forced-aeration static composting.Bioresour. Technol. 99, 7450–7457.
Zhang, D.Q., He, P.J., Jin, T.F., Shao, L.M., 2008. Bio-drying of municipal solid wastewith high water content by aeration procedures regulation and inoculation.Bioresour. Technol. 99, 8796–8802.
Zhang, J., Gao, D., Chen, T.B., Zheng, G.D., Chen, J., Ma, C., Guo, S.L., Du, W., 2010.Simulation of substrate degradation in composting of sewage sludge. WasteManage. 30, 1931–1938.
Zhao, L., Gu, W.M., He, P.J., Shao, L.M., 2010. Effect of air-flow rate and turningfrequency on bio-drying of dewatered sludge. Water Res. 44, 6144–6152.
Zhao, L., Wang, X.Y., Gu, W.M., Shao, L.M., He, P.J., 2011. Distribution of C and N insoluble fractionations for characterizing the respective biodegradation of sludgeand bulking agents. Bioresour. Technol. 102, 10745–10749.