Embed Size (px)
Citation preview

MOLAB DATA‐LOGGER ML01 USER’S GUIDE
CENTRE FOR MICROCOMPUTER APPLICATIONS
http://www.cma-science.nl

2 | ML01 MoLab User’s Guide
MoLab User’s Guide ver. 2.0, February 2014 Author: Ewa Kedzierska © CMA, Amsterdam, 2014
For our international customers… Check the CMA International website (www.cma-science.nl/english/downloads) for the latest version of this manual and updates of Coach 6 CE and Coach 6 software products. Aan onze Nederlandse gebruikers… MoLab wordt standaard uitgeleverd met Engelse handleiding. U kunt de laatste versie van de Nederlandse handleiding en de nieuwste update van Coach 6 CE en Coach 6 downloaden van de CMA-website (www.cma-science.nl), rubriek ‘Ondersteuning’.

ML01 MoLab User’s Guide | 3
TABLE OF CONTENTS
I. INTRODUCTION 5
II. ITEMS INCLUDED WITH MOLAB 5
III. THE MOLAB DATA‐LOGGER 6
IV. POWERING 7
V. WINDOWS CE OPERATING SYSTEM 7
VI. USING MEMORY CARD 8
VII. CONNECTING SENSORS 8
VIII. USING MOLAB AS A STANDALONE DEVICE – WORKING WITH COACH 6 CE 9
1. Main Screen 9
2. Coach Activities and Results 10
3. Activity Screen 11
4. Sensors Screen 12
5. Diagram Screen 14
6. Table Screen 15
7. Text Screen 16
8. Image Screen 17
9. Collecting data with Coach 6 CE 18
10. Processing and analyzing data 19 10.1. Select/Remove Data 19 10.2. Smooth 20 10.3. Derivative 21 10.4. Integral 21 10.5. Slope 22 10.6. Area 22 10.7. Function Fit 23 10.8. Signal Analysis 24 10.9. Statistics 24 10.10. Histogram 25

4 | ML01 MoLab User’s Guide
IX. Using MoLab with a PC computer 26
1. Installing the MoLab driver 26 1.1. Windows XP and earlier versions of Windows 26 1.2. Windows Vista and Windows 7 26
2. Installing Windows CE Services software 27 2.1. Windows XP and earlier versions of Windows 27 2.2. Windows Vista and Windows 7 27
3. Transferring files between MoLab and a computer 27
4. Using MoLab for data collection with the Coach 6 PC program 28 4.1. Activities for MoLab 29 4.2. Typical measurement procedure in Coach 6 29
5. MoLab View 30
6. MoLab Update 31
X. TECHNICAL SPECIFICATIONS 31
1. MoLab device 32
2. Sensor which can be connected to MoLab 32
3. Working conditions and maintenance 32
4. CMA software for MoLab 33
5. Microsoft software for MoLab 33

ML01 MoLab User’s Guide | 5
I. INTRODUCTION
MoLab data‐logger ML01 is a mobile graphic data acquisition system. It is a handheld Windows CE device equipped with its own processor and memory. Its touch screen provides color display and easy control. CMA sensors of the ML type can be connected to the four MoLab sensor inputs. Temperature, voltage and light sensors are included. An internal sound sensor is built‐in. The Coach 6 CE program, preinstalled on MoLab, offers tools for data collection and data analysis and provides possibilities to create student activities filled with texts and images. MoLab is a versatile device, which can be used standalone as well as connected to a PC computer, in the field or in the classroom.
II. ITEMS INCLUDED WITH MOLAB
The MoLab package contains the following items:
MoLab data‐logger ML01 Power adapter USB cable Sensor cables with 5‐pin mini jack plugs Spare stylus Protective rubber cover
ML11s Temperature sensor (‐40 .. 125 °C)
ML14s Light sensor (1 .. 65,535 lx) ML17f Voltage sensor (‐15 .. 15 V)
User’s Guide.

6 | ML01 MoLab User’s Guide
III. THE MOLAB DATA‐LOGGER
MoLab is controlled by the touch screen, the Start/Stop button, the Navigation button and the Confirm button. The power on/off switch is located on the left side. Two LEDs indicate the power status (left) and the status of the battery (right). Below the LEDs the internal, built‐in microphone is located.
On the right side of MoLab a mini USB port is located.
This port is used for connection to the PC or for recharging the internal battery. Audio Out (for headphones or speaker) and Audio In (for external microphone) ports are located below. The Stylus, needed to control the touch screen, is stored in the slot below the Audio ports.
Color touch screen
Power switch
On/Off LED
Start/Stop button
Navigation button Confirm button
Internal microphone
Battery LED
Audio in
Audio out
Stylus
Memory Card slot
Sensors inputs
USB port

ML01 MoLab User’s Guide | 7
The top edge of MoLab has four sensor inputs for ML sensors and a Micro SD memory card slot for memory extension. At the backside there is a battery compartment for the lithium‐ion rechargeable internal battery (supplied with MoLab).
IV. POWERING
MoLab is powered by an internal rechargeable battery (Li‐Poly 3.7 V, 2300 mAh) located in the backside compartment. The battery is charged when MoLab is connected to the computer via a USB port, or when it is powered by the provided AC power adapter. The right LED indicates the state of charging. It lights up when the battery is charged; it is red when the battery is low and changes to green when the battery is fully charged. The actual status of the battery can be checked in Windows CE or in Coach 6 CE. Notice that the battery can be recharged after partial discharge without losing its capacity. The battery life will depend on the sensors used but typically you can expect to use MoLab up to a few hours without recharging it. To save power turn the screen off
when you do not need it (via Power Properties). The MoLab screen will go blank after a selected time interval of no use (no screen taps, no button press), but MoLab continues its working. To activate the screen again simply touch it or tap it.
Notes:
When the USB port does not provide the standard power, MoLab will not be charged or charging will be slower.
MoLab can be used while the battery is being charged by the power adapter.
On most computers USB ports do no provide enough power for simultaneous operating of MoLab and charging its battery. Using double USB connections significantly improves charging speed.
V. WINDOWS CE OPERATING SYSTEM
MoLab is a Windows CE device. Windows CE Explorer can be used to manage files on MoLab. With Windows CE Services software such as Microsoft ActiveSync or Windows Mobile Device Center, files can be transferred, backed up, added, removed and copied between MoLab and the host PC. To establish communication between MoLab and the PC, you must first install Microsoft ActiveSync (Windows XP and earlier versions of Windows) or Windows Mobile Device Center (Windows Vista and Windows 7) on the host PC. Both programs are freely available on the Microsoft website (www.microsoft.com).

8 | ML01 MoLab User’s Guide
VI. USING MEMORY CARD
For memory extension a micro SD memory card can be used. After inserting such a card in the MoLab’s card slot, the Storage Card folder will appear in the Windows CE folder My Device. You can store your files in a similar way as in other Windows CE folders.
VII. CONNECTING SENSORS
CMA sensors of the ML sensor line can be connected to inputs of MoLab. Four sensor cables with 5‐pins mini jack plugs are provided to connect such sensors to MoLab. Three sensors are delivered with MoLab:
ML11s Temperature sensor (‐ 40 .. 125 °C),
ML14s Light sensor (1 .. 65,535 lx), and
ML17f Voltage sensor (‐15 .. 15 V). Other ML sensors are available separately. For the complete list see the CMA website (www.cma‐science.nl). Additionally, MoLab is equipped with the internal, built‐in sound sensor, which is supported by Coach 6 CE.
To connect a sensor:
Plug the connector of a provided sensor cable into a sensor.
Connect the other end of the sensor cable to a sensor input of MoLab.
Maximal 4 sensors can be used simultaneously.
Connecting a sensor to MoLab.

ML01 MoLab User’s Guide | 9
VIII. USING MOLAB AS A STANDALONE DEVICE – WORKING WITH COACH 6 CE
When working with MoLab as a standalone device MoLab is controlled by its touch screen, buttons, and the Coach 6 CE program running on MoLab. After turning MoLab on, it briefly displays the opening image and starts the Coach 6 CE program. The Main Coach Screen appears on the MoLab screen. Coach 6 CE can also be started via double‐tapping the Coach 6 icon on the MoLab desktop. In this chapter you find a short description how to work with the Coach 6 CE program. Detailed infor‐mation about the use and features of Coach 6 CE can be found in the Guide to Coach 6 CE available on the CMA website (www.cma‐science.nl).
1. Main Screen
The Main Screen is the first screen that appears after starting Coach 6 CE and it displays the Coach 6 CE title image. The main Toolbar offers:
A drop‐down list for direct opening of Coach Activities and Result files stored on MoLab.
A menu icon – for the tool menu with options to open a new or existing activity.
Info on the Coach 6 CE version.
Across the bottom bar of the Main Screen the following icons are displayed:
Icon Tap an icon to:
Exit Coach 6 CE
Open a New Coach Result
Open the utility program to calibrate the screen
The Main Screen of Coach 6 CE.
The opening image of MoLab.

10 | ML01 MoLab User’s Guide
Open the Volume and Sounds properties
Display/hide the on‐screen keyboard
Open the Power Properties
16.10 Open the Date/Time Properties
2. Coach Activities and Results
Coach 6 CE works with Coach Activities (*.cma files) and Coach Results (*.cmr files). Coach Activities are Coach documents created in the Author mode in the Coach 6 PC program. Student users can open such Activities in Coach 6 CE but cannot overwrite them. Instead student users save the results of their work in Coach Results. Coach Activities and Results can be stored in the MoLab user memory (DataFlash) or on a user memory card, and opened in the Coach 6 CE program. The CMA Coach Projects folder, located in DataFlash > CoachCE folder, is a default folder for storing exemplary CMA Coach Activities. This folder can be opened directly via the menu option Open CMA Project available in the Main and Activity Screen menus.
To open an existing Activity (*.cma file) or Result (*.cmr file)
Select the desired Activity or Result file from the drop‐down list. or
Tap the Menu icon and select Open. The Open an Activity dialog opens. This is a
standard Windows CE dialog, which lists folders and Coach Activities and
Results in the selected location.
Browse and select the desired Activity or Result file.
Click OK.
To create a new Result (*.cmr file)
Tap the Menu icon and select New or select New (Sound only) if your new result is created for data collection with the internal, built‐in sound sensor.
or
Tap the Open a New Result icon located in the bottom bar. After opening an Activity or Result, the MoLab Toolbar changes. Each MoLab activity has six Screens, indicated by the following icons:
Activity, Sensors, Diagram, Table, Text, Image.

ML01 MoLab User’s Guide | 11
Tapping an icon in the Toolbar displays the respective Screen. Each Screen has its own Toolbar, which displays (from left to right):
Screen icon – which indicates the currently selected Screen.
A drop‐down list – which lists all items available in the selected Screen, e.g. a list of activities, a list of sensors, a list of diagrams, etc.
A menu icon – which opens the tool menu with options specific for the selected Screen.
On the bottom of each Screen extra icons for measurement are available:
Icon Tap an icon to:
Open the Measurement Settings dialog
Start the measurement
Start the manual measurement
Stop the measurement
3. Activity Screen
The Activity Screen gives, in the form of a tree, an overview of all items available in the opened Activity/Result. Each tree branch corresponds to one of the MoLab Screens with exception of Text Screen, which is split into two branches Texts and Student Texts. If there are no items available under a branch then this branch is not shown in the tree. By clicking the ‘+’ sign a branch can be expanded to show all available items. By clicking the ‘‐‘ sign a branch can be closed again. By double‐tapping an item listed under a branch this item is directly displayed. For example double‐tapping a diagram ‘A1: Temperature sensor (Standard)’ opens the Diagram Screen and displays the ‘A1: Temperature sensor (Standard)’ diagram.
The Activity Screen.

12 | ML01 MoLab User’s Guide
4. Sensors Screen
MoLab automatically detects connected ML sensors and loads the sensors information. Live data measured by the detected sensors are displayed on the Sensors Screen. By default the Sensors Screen is divided into four quadrants. When a sensor is connected to a sensor input (A, B, C or D) then its corresponding quadrant displays the sensor name (e.g. A: Temperature sensor) and its current readings (some sensors have more than one sensor built‐in then more values are shown per sensor input). These live displayed data are not stored in MoLab’s memory. When there is no sensor connected to a sensor input the respective sensor quadrant displays the message (Nothing connected). In some cases for example when using a photogate in counting or timing mode it is only possible to display live data after a measured has been started.
To maximize a sensor quadrant:
Double‐tap the desired sensor quadrant. Or
Select the desired sensor quadrant via the drop‐down list.
ACTIVITY SCREEN TOOL MENU - New ‐ to create a new Result. - New (Sound only) ‐ to create a new Result with the internal sound sensor. - New (Photogate timing) ‐ to create a new Result for timing measurements
with a photogate. In this activity only the Photogate ML54f connected to input A of MoLab can be used.
- Open … ‐ to open an Activity/Result (*.cma/*.cmr file). - Close ‐ to close an opened Activity/Result. - Activity Options ‐ to set the Activity options. - Save … ‐ to save a Result (as *.cmr file). - Save as … ‐ to name and save a Result (as *.cmr file). - Delete … ‐ to delete an opened Activity/Result (*.cma/*.cmr file).
The Sensors Screen.

ML01 MoLab User’s Guide | 13
The Sensor Settings dialog displays sensor information regarding detected sensors. Each detected sensor and sub‐sensor has its own tab. Tap a sensor tab e.g. A1 to display its sensor information. Some sensors have more measurement ranges available. Tap a drop‐down list to choose another range. Use the Set to zero or Set to value button to shift the sensor factory calibration. Use the Calibrate button to create a simple, 2‐ or 3‐point user calibration. This button is active only for sensors, which have the possibility to store a user calibration. Use the Reset button to reset the user calibration to the sensor factory calibration. The Sensor Settings dialog is slightly different for ‘Photogate timing’ Activity/Result. Here only the Photogate ML54f connected to input A of MoLab
SENSORS SCREEN TOOL MENUS The displayed Sensors Screen tool menu is context sensitive. When tapping the
menu icon or long touching a sensor quadrant with (Nothing connected) the short menu appears:
Sensor Settings... – to open a dialog to define sensor settings.
Measurement Settings – to open a dialog to define a measurement type and its specific settings.
When long touching a sensor quadrant displaying the sensor readings the long menu appears:
Sensor Settings... – to open a dialog to define sensor settings.
User Calibration… ‐ to open the User Calibration dialog, appears only if applicable for the detected sensor.
Set to Zero – to set the actual measured value to zero, appears only if applicable for the detected sensor.
Set to Value ‐ to set the actual measured by the sensor value to another value, appears only if applicable for the detected sensor.
Reset Calibration – to reset the user sensor calibration.
Measurement Settings – to open the Measurement Settings dialog to define the measurement type and its specific settings.
The Sensor Settings dialog for ‘Photogate timing’ Activity/Result.
The Sensor Settings dialog.

14 | ML01 MoLab User’s Guide
can be used. Tap a drop‐down list to choose one of the a time interval measurements. Five types of time interval measurements are available in Coach: 1. Time Interval Up‐Up (default)
2. Time interval Down‐ Down
3. Time interval Up – Down (High)
4. Time interval Down – Up (Low)
5. Time interval Up – Down & Down‐ Up,
(High & Low) In the Measurement Settings dialog specify how MoLab has to measure. Select the measurement type (time‐based or manual) and set the measurement settings (measuring time and frequency). If you want to start your measurement automatically enable triggering and define trigger conditions in the Triggering tab. In the Advanced tab it is possible to repeat the measurement process a number of times.
5. Diagram Screen
The Diagram Screen is used to display measured or calculated data in diagrams. A standard diagram, the sensor quantity against the clock (time), is created automatically after the sensor has been detected. Changing of any diagram style options, such as removing the grid or changing the diagram color, removes the suffix ‘(Standard)’ from the diagram’s name. Diagram changes, such as defining a new column, make it a ‘User‐defined’ diagram. All available diagrams are listed in the drop‐down list. The Diagram Screen displays the currently selected diagram.
The Diagram Screen.
The Measurement Settings dialog.

ML01 MoLab User’s Guide | 15
The Grid icon located in the lower, left screen corner allows switching the grid on/off. The Zoom to fit icon located in the lower, right screen corner, allows re‐scaling the horizontal and vertical axes to optimally display all graphs. Tap the Zoom‐out icon until you return to the original scale.
On starting a measurement a graph is drawn. When starting a new measurement, the existing data is overwritten by the new data, without warning.
6. Table Screen
The Table Screen is used to display measured or calculated data numerically in tables. Tables are synchronized with diagrams and share a number of settings (among which their name): irrespective where these settings are changed, they are reflected both in the diagram and the table. The standard table is the table corresponding to the standard diagram. All available tables are listed in the drop‐down list.
DIAGRAM SCREEN TOOL MENU Zoom to Fit (only for a diagram with data) ‐ to optimally zoom in the graph.
Zoom Out (only when in zoomed state) ‐ to return to the previous zoom state.
Scan (only for a diagram with data) ‐ to read co‐ordinates of points in the graph. When sketch is started the additional option appears in the tool menu: o Stop Scan ‐ to stop the scan.
Erase all Values (only for a diagram with data) ‐ to remove all data from the activity.
Sketch ‐ to draw a prediction graph or a graph, which can be converted to real data. When sketch is started the additional options appear in the tool menu: o Erase Sketch ‐ to remove the sketch, and o Convert Sketch to Table ‐ to convert the sketch to real data.
New Diagram ‐ to create a new diagram.
Edit Diagram ‐ to edit the displayed diagram.
Diagram Style ‐ to change the display settings of the diagram.
Process/Analyze ‐ to select data processing and analysis tools.
Copy column (only for a diagram with data) ‐ to keep previous run(s) active.
The Table Screen.
16 | ML01 MoLab User’s Guide
On starting a measurement a table is filled with values. When starting a new measurement run, the existing data is overwritten by the new data.
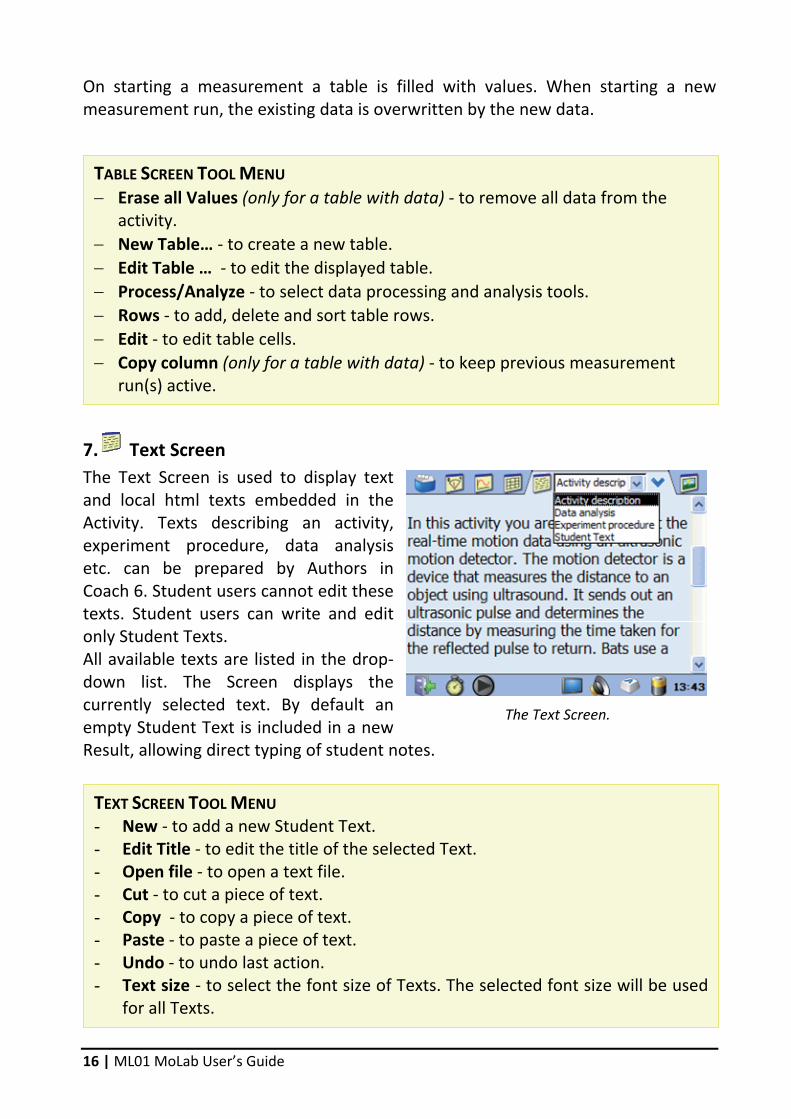
7. Text Screen
The Text Screen is used to display text and local html texts embedded in the Activity. Texts describing an activity, experiment procedure, data analysis etc. can be prepared by Authors in Coach 6. Student users cannot edit these texts. Student users can write and edit only Student Texts. All available texts are listed in the drop‐down list. The Screen displays the currently selected text. By default an empty Student Text is included in a new Result, allowing direct typing of student notes.
TEXT SCREEN TOOL MENU - New ‐ to add a new Student Text. - Edit Title ‐ to edit the title of the selected Text. - Open file ‐ to open a text file. - Cut ‐ to cut a piece of text. - Copy ‐ to copy a piece of text. - Paste ‐ to paste a piece of text. - Undo ‐ to undo last action. - Text size ‐ to select the font size of Texts. The selected font size will be used
for all Texts.
TABLE SCREEN TOOL MENU Erase all Values (only for a table with data) ‐ to remove all data from the
activity.
New Table… ‐ to create a new table.
Edit Table … ‐ to edit the displayed table.
Process/Analyze ‐ to select data processing and analysis tools.
Rows ‐ to add, delete and sort table rows.
Edit ‐ to edit table cells.
Copy column (only for a table with data) ‐ to keep previous measurement run(s) active.
The Text Screen.

ML01 MoLab User’s Guide | 17
To type text in the Text Screen
Tap the Keyboard icon , located in the bottom bar, to display the extended on‐screen keyboard.
Tap a blue text screen.
Tap letters on the on‐screen keyboard to write your text.
8. Image Screen
The Image Screen is used to display photos and images. The following file formats are supported in Coach 6 CE: bmp, gif, jpg, and png. The Image Screen displays the currently selected image. Other available images can be selected for display via the drop‐down list. By default there is no image in a new Result; the Image Screen is empty.
IMAGE SCREEN TOOL MENU - New ‐ to add a new image. - Edit Title … ‐ to edit the title of the selected Image. - 25% ‐ to display the image in 25% of its original size - 50% ‐ to display the image in 50% of its original size. - 75% ‐ to display the image in 75% of its original size. - 100% ‐ to display the image in its original size. - Fit ‐ to display the image fitted to the screen.
The Image Screen.

18 | ML01 MoLab User’s Guide
9. Collecting data with Coach 6 CE
To collect data with MoLab as a standalone device:
Turn MoLab on.
Wait until the Coach 6 CE starts and its Main Screen appears.
Ensure MoLab has sufficient battery power or is connected to its power supply.
Connect the desired ML sensor(s) to the sensor input(s) on MoLab.
Create a new Coach Result:
- Tap the Menu icon and select: o New, or o New (Sound only) ‐ when you want to use the internal Sound sensor, or o New (Photogate timing) ‐ when you want to use the Photogate ML54f
and perform timing experiments. - A new Result opens. MoLab automatically detects the connected sensor(s)
and lists detected sensors, their standard diagrams and tables in the Activity screen.
Or
Open an existing Coach Activity/Result: - Select the desired Activity/Result from the drop‐down list of Activities and
Results or tap the Menu icon , select Open and browse to select the desired Activity/Result.
- The Activity/Result opens. MoLab automatically detects the connected sensor(s). If the detected sensor is different from the sensor defined in the activity then the defined sensor is listed under the activity tree in red. Its sensor quadrant displays information about the defined sensor and the detected sensor. Connect the sensor defined in the Activity or change the defined sensor into the detected sensor by tapping the Exchange button.
Tap the Sensors Screen icon to display the Sensors Screen and check the live readings of the connected sensors.
You are ready to start your measurement. The measurement is executed according to the given measurement settings. Tap the Measurement Settings
icon to check these settings: measurement type, measuring time, sampling frequency and number of collected samples. If needed change the default settings.
Tap the green Start icon or press the MoLab <Start/Stop> button to start data collection. o In most cases, Coach directly starts the measurement. o If triggering is enabled then the measurement is started automatically when

ML01 MoLab User’s Guide | 19
the trigger conditions are met. o When the type of measurement is set to Manual then the green Manual
Start icon appears in the bottom bar. Tap this icon to collect a single measurement. When a keyboard input is specified then the value of one or more quantities have to be typed in.
The measurement stops when the specified measurement time (time‐based) or specified number of samples (manual) has been reached. If you want to
interrupt the measurements process, click the red Stop icon or press the MoLab <Start/Stop> button again.
Save your result file via the Activity Screen menu option Save or Save As….
WARNING! Please notice that when starting a new measurement, by tapping the green Start button or pressing the MoLab <Start/Stop> button, existing data is overwritten by the new data without any warning. To avoid losing any data save your experiment results first.
Note:
To avoid loss of data, for instance in case of empty battery, the Coach CE will save intermediate results during measurements longer than 10 minutes. Saving of the Result file, which includes all texts and images, will be done each minute (in case of new data). The last saved file can be found in CoachProjects /DataRecovery/last_result.cmr
10. Processing and analyzing data
The data collected in measurements can be processed and analyzed with the help of advanced tools. These tools are available under the option Process/Analyze in the menu of Diagram and Table Screens.
The Process/Analyze options work all in a similar way. After selecting an option an extensive dialog that includes the diagram is shown. Above and below the diagram the specific parameters can be specified. The drop‐down list in the left upper corner appears in all dialogs. This list is used to switch between vertical quantities (graphs) if the diagram contains several quantities. All processing and analysis tools are detailed described in the Guide to Coach 6 CE.
10.1. Select/Remove Data With the Select/Remove Data tool either a range of data or single points can be selected for removal or retention.

20 | ML01 MoLab User’s Guide
To select/remove data
Select Process/Analyze > Select /Remove Data.
In the top left drop‐down list select the quantity for which you want to make a selection.
In the next drop‐down list select the selection method.
For the Range method: select the range by dragging the boundary lines, or type in the boundary values in the Begin and End fields.
For the Point‐by‐point method: select points by tapping a point in the graph
or by using small icons: select all,
deselect all, select even,
select odd. The last icon select/deselect a point can be used instead of tapping a point in the graph after selecting the desired point with the <Navigation> button.
Tap to confirm or to close the dialog without changes.
In the next dialog select Keep
selected or Delete selected and confirm with .
10.2. Smooth The Smooth tool is used to create a smooth curve that fits a rough or limited set of measured points. The smoothed graph may consist of (much) more points than the original data set and can successively be processed.
To execute smoothing
Select Process/Analyze > Smooth.
In the top left drop‐down list select the graph you want to smooth.
In the next drop‐down list select the smooth method.
Specify the smoothing parameters: ‐ For Moving average enter the
desired Filter width. ‐ For Spline leave the automatically
calculated Smoothing factor or tap
the icon and type in the desired value.
If desired, change the name of the Quantity.
The Smooth dialog.
The Select/Remove data dialog.

ML01 MoLab User’s Guide | 21
Tap (top right screen corner) to create the smoothed graph. If you are not
satisfied with the result, change parameter settings and tap the icon again.
Tap to confirm or to close the dialog without changes.
Choose between Add graph, Replace graph, New diagram or Replace data and
confirm with .
10.3. Derivative The Derivative tool is used to produce the graph of the first or the second derivative of the original quantity.
To calculate a derivative graph
Select Process/Analyze > Derivative.
In the top left drop‐down list select the graph of which you want to calculate the derivative.
In the next drop‐down list select the derivative order.
In the third drop‐down list select a method of calculating the graph of the derivative (Differences or Smooth).
When desired, edit the Quantity and Unit.
Tap to calculate the derivative graph.
Tap to confirm or to close the dialog without changes.
Select either Add graph or New diagram and confirm with .
10.4. Integral The Integral tool is used to calculate the function (the primitive function) whose derivative is equal to the displayed graph. Such an integral function can be determined for a constant of integration.
To calculate an integral graph
Select Process/Analyze > Integral.
In the top left drop‐down list select the graph of which you want to calculate the integral.
The Derivative dialog.
The Integral dialog.

22 | ML01 MoLab User’s Guide
In the Initial value field type in the constant of integration. This is the value assigned to the quantity along the vertical axis for x=0.
When desired, change the name of the Quantity and/or Unit.
Tap to calculate the integral graph.
Tap to confirm or to close the dialog without changes.
Select either Add graph or New diagram and tap to confirm.
10.5. Slope The Slope tool is used to manually determine the slope of the tangent at any point of a displayed graph.
To determine a slope
Select Process/Analyze > Slope.
In the top left drop‐down list select the graph in which you want to determine a slope.
The diagram in the dialog is in scan mode. The co‐ordinates of the scanned point, indicated by the dark red cross‐hairs, are displayed in the fields below the graph.
Tap the point in which you want to determine the slope. A line appears in the diagram.
Use the stylus and rotate the line until it is positioned correctly along the graph. The only way to determine the slope is by vision; Coach does not indicate which slope is ‘correct’.
Read the value of the slope in the Slope field. You can copy the value of the
slope to the clipboard by tapping .
Click to close the dialog.
10.6. Area The Area tool is used to determine an area between a displayed graph, the horizontal axis and two boundary lines.
The Slope dialog.

ML01 MoLab User’s Guide | 23
To determine an area
Select Process/Analyze > Area.
In the top left drop‐down list select the graph from which you want to determine an area.
The diagram shows two boundary lines between which the area is calculated. Use the stylus and drag the boundary lines to the required position, or type the x‐values for the boundary lines in the Begin and End fields.
Read the area displayed in the Area field. You can copy the value of the
slope to the clipboard by tapping .
Click to close the dialog.
10.7. Function Fit The Function fit tool is a procedure to approximate the data in the graph with a standard mathematical function. You can choose from a number of function types. The coefficients of the fit function are determined using a least‐squares method. Fitting can be done manually or automatically.
To determine a function fit
Select Process/Analyze > Function Fit.
In the top left upper drop‐down list select the graph that you want to fit.
In the next drop‐down list select the function type that will be used.
Tap , Coach automatically esti‐mates the best initial parameter values of the fit function. In some cases this is already the optimal fit.
Tap , Coach automatically refines the suggested fit to find the best function fit.
Tap to confirm.
Select Add graph or Replace graph. When you choose to replace the graph, the original data will be lost unless you saved the result prior to the fit procedure.
The Area dialog.
The Function Fit dialog.

24 | ML01 MoLab User’s Guide
Tap to confirm or to close the dialog without changes.
10.8. Signal Analysis The Signal Analysis tool is used to find the frequency spectrum of the original graph.
To determine a frequency spectrum
Select Process/Analyze > Signal Analysis.
In the top left drop‐down list select the graph of which you want to calculate the frequency spectrum.
In the next drop‐down list select the method: Fourier transform, Linear prediction, R‐ESPRIT or Prony.
In the third drop‐down list select Linear or Logarithmic for the intensity scale along the y‐axis.
Specify signal parameters: ‐ Linear Prediction: enter the
number of coefficients. This number determines the maximum number of peaks (formants), which will be found in the spectrum.
‐ R‐ESPRIT: enter the number of fre‐quencies and the snapshot dimension. This number determines the model used in the analysis and the maximum number of peaks in the spectrum. The snapshot dimension is determined
automatically, or entered manually after tapping the icon. ‐ Prony: enter the number of frequencies.
Tap to display the frequency spectrum of the graph.
Tap to confirm.
Tap again to confirm creating a New diagram or to close the dialog. For Prony and R‐ESPIRIT method you can also display the graph of the approximation found by the selected method by checking the Add approximation to original diagram option.
10.9. Statistics The Statistics tool displays statistical information about the diagram/table as a whole or about a selection of data in the table.
The Signal Analysis dialog.

ML01 MoLab User’s Guide | 25
To display statistics
For whole data: select Process/Analyze > Statistics. For a selection of data: with the stylus drag a selection in a table and then select Process/Analyze > Statistics.
You can copy the statistics information to the
clipboard by tapping .
Click to close the dialog.
10.10. Histogram The histogram option is used to create the histogram bar diagram. The range of the variable (column) is divided into equal size bins for which the frequency of occurrence is calculated. The height of the diagram bar is equal to the frequency of occurrence within the bin.
To determine a histogram
Select Process/Analyze > Histogram.
In the top left drop‐down list select the column for which you want to create the histogram.
Specify the Lower and Upper boundary values.
Type the number of bins (default 5).
Tap to create a histogram. If you are not satisfied with the result,
change parameter settings and tap again.
Tap to confirm your histogram or
to close the dialog without changes.
Tap again to create a New diagram or to return to the Histogram dialog.
The Statistics dialog.
The Histogram dialog.

26 | ML01 MoLab User’s Guide
IX. Using MoLab with a PC computer
MoLab can be used with a Windows computer for:
transferring files between the computer and MoLab,
using MoLab as a lab interface connected to the computer and controlled by the Coach 6 program running on it.
For both MoLab has to be connected to the PC via the USB cable, and its driver and Windows CE Services software have to be installed on the computer.
1. Installing the MoLab driver1
1.1. Windows XP and earlier versions of Windows Prior to connecting MoLab to your Windows XP computer, you need to install the Windows XP driver for MoLab.
Download the XP driver for MoLab from the CMA website (http://www.cma‐science.nl/english). The driver can be found under Support > Interfaces > MoLab data‐logger2.
Unzip this file to a temporary folder on your hard disk. Right click the file wceusbsh.inf and select ‘Install’.
In the first dialog of Found New Hardware Wizard select ‘Yes, this time only’. Click ‘Next’ to continue.
In the second dialog of Found New Hardware Wizard select ‘Install the software automatically (Recommended)’. Click ‘Next’ to continue.
The Wizard searches and installs the CMA MoLab USB Sync driver. When the warning about missing Windows Logo testing appears click ‘Continue Anyway’.
Click ‘Finish’ when the driver installation has finished.
1.2. Windows Vista and Windows 7
Turn MoLab on and connect it to the computer via the USB cable. The additional USB connector can be connected to the second USB port for extra power supply.
1 Administrator rights needed. 2 If you have Coach 6.4 or Coach 6.4 Lite already installed on your computer you can find this driver in the Program Files (x86)\CMA\Coach6\Common\MoLabDriverXP folder.
ML01 MoLab User’s Guide | 27
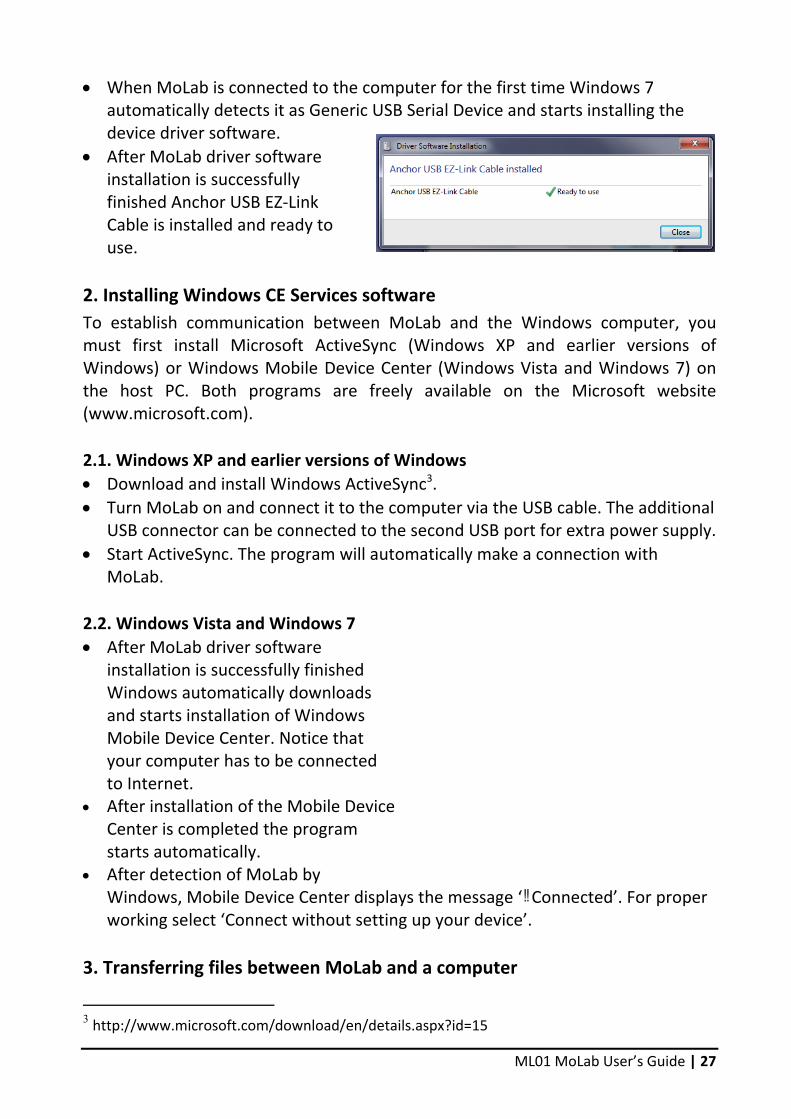
When MoLab is connected to the computer for the first time Windows 7 automatically detects it as Generic USB Serial Device and starts installing the device driver software.
After MoLab driver software installation is successfully finished Anchor USB EZ‐Link Cable is installed and ready to use.
2. Installing Windows CE Services software
To establish communication between MoLab and the Windows computer, you must first install Microsoft ActiveSync (Windows XP and earlier versions of Windows) or Windows Mobile Device Center (Windows Vista and Windows 7) on the host PC. Both programs are freely available on the Microsoft website (www.microsoft.com).
2.1. Windows XP and earlier versions of Windows
Download and install Windows ActiveSync3.
Turn MoLab on and connect it to the computer via the USB cable. The additional USB connector can be connected to the second USB port for extra power supply.
Start ActiveSync. The program will automatically make a connection with MoLab.
2.2. Windows Vista and Windows 7
After MoLab driver software installation is successfully finished Windows automatically downloads and starts installation of Windows Mobile Device Center. Notice that your computer has to be connected to Internet.
After installation of the Mobile Device Center is completed the program starts automatically.
After detection of MoLab by Windows, Mobile Device Center displays the message ‘�Connected’. For proper working select ‘Connect without setting up your device’.
3. Transferring files between MoLab and a computer
3 http://www.microsoft.com/download/en/details.aspx?id=15

28 | ML01 MoLab User’s Guide
After making connection to MoLab you can browse the content of MoLab in Windows ActiveSync/Mobile Device Center, or in Windows Explorer where MoLab is available as CMA_MoLab. Each time MoLab is turned on and connected to the computer via the USB cable, MoLab is detected as CMA_MoLab and Windows ActiveSync or Mobile Device Center starts automatically. Files can be transferred, backed up, added, removed and copied between MoLab and the host PC. WARNING! Be careful when deleting files on MoLab. By removing some folders or files MoLab may not work properly anymore.
4. Using MoLab for data collection with the Coach 6 PC program
In this mode MoLab is connected to a PC computer via a USB cable and is controlled by the Coach 6 program or by the Coach 6 Lite program running on the PC. During such measurement MoLab stays connected to the PC via a USB port and is controlled by the Coach 6 program4 or by the Coach 6 Lite program1 running on the PC. The collected data is transferred in real‐time to the computer. The course of the measurement can be followed directly on the computer screen. When the Coach 6 PC software controls MoLab, then the MoLab screen is inactive and displaying the image shown here. The recorded data are not stored in MoLab’s memory and should be saved on the PC in Coach 6.
Detailed information about the use and features of:
Coach 6 can be found in the Guide to Coach 6, and Coach 6 Lite can be found in the Guide to Coach 6 Lite. Both guides can be found on the CMA website (www.cma‐science.nl/english) under Downloads.
4 The support for MoLab starts in Coach 6.4 and Coach 6.4 Lite.

ML01 MoLab User’s Guide | 29
4.1. Activities for MoLab The PC version of the full Coach 6 program offers more features than the Coach 6 CE program does. One of the most important is the Author mode with the possibility of creating Coach Activities and Results for MoLab.5 Such Activities (*.cma files) and Results (*.cmr files) can be copied to the MoLab DataFlash user memory or a user memory card and opened in the Coach 6 CE program. Any features in the Activities and Results not existing in the Coach 6 CE program, such as images embedded in texts, videos, background graphs, diagram annotations, etc., will be ignored and will be not shown on MoLab. Exemplary Activities, prepared for use by students, are available as well in the Coach 6 CE program as in the Coach 6 and Coach 6 Lite programs.
4.2. Typical measurement procedure in Coach 6
To collect data with MoLab connected to the PC (a typical procedure):
Turn MoLab on and connect it to the computer via a USB cable.
Start Coach 6 on the computer.
Connect an ML sensor(s) to the sensor input(s) on MoLab.
In Coach 6 open an Activity/Result for MoLab.
MoLab automatically detects the connected sensor(s) and displays the sensor icons of detected sensors on the MoLab screen panel on the PC.
The measurement will be executed according to the given measurement set‐
tings. Click the Measurement Settings icon in the Coach 6 toolbar to check these settings: measurement type, measuring time, sampling frequency and number of collected samples.
Follow the instructions in the Activity or directly start the measurement by
clicking the green Start button . o In most cases, Coach automatically starts the measurement. o If triggering is enabled then the measurement is started automatically when the trigger conditions are met.
o When the type of measurement is set to Manual then the green Manual
Start icon appears in the Toolbar. Click this icon to collect a single measurement. When keyboard input(s) is specified then the value of one or more quantities have to be typed in.
The measurement is stopped when the specified measurement time (time‐based) or specified number of samples (manual) has been reached. If you want
to interrupt the measurements process, click the red Stop button or press the Esc button.
Save your result to file via the File menu options Save or Save As….
5 Only possible in the Author mode in Coach 6.

30 | ML01 MoLab User’s Guide
5. MoLab View
MoLab View is a utility program, which displays the image of the MoLab screen on the computer screen. MoLab View is intended for class instructions on MoLab use or when a projected view of the MoLab screen is required.
For using MoLab View, MoLab has to be:
connected to the host PC via a USB port,
Windows CE Services software, Microsoft ActiveSync or Windows Mobile Device Center, has to be installed on the PC6, and
the Coach 6 PC program should be closed.
To Start MoLab View
Click on the Windows Start button and select Programs.
Then go to CMA Coach 6 (or CMA Coach 6 Lite) > Utilities and select MoLab View.
The program automatically displays the current MoLab screen.
6 Notice that in the Mobile Device Center software use the option ‘Connect without setting your device’.
The MoLab View PC program.

ML01 MoLab User’s Guide | 31
The Coach 6 CE program running on MoLab can also be controlled in MoLab View using the computer mouse in the same way you would tap the actual MoLab screen using the stylus.
6. MoLab Update
MoLab Update is a PC program to update Coach 6 CE and is available as a separate program or under Utilities after installation of Coach 6 or Coach 6 Lite PC software. Software updates of Coach 6 CE, as they are released, will be available at CMA website (www.cma‐science.nl/english) under Downloads.
MOLAB VIEW MENU CAPTURE MENU - Save to file ‐ to capture the current displayed screen image and save it as a
image file (*.bmp and *.png formats). - Copy to Clipboard ‐ to capture the current displayed screen image and store
it on the Windows clipboard. - Record ‐ to capture in real‐time a series of displayed screens and save it as a
video file (*.avi format, different compressions available). - Print ‐ to print the current displayed screen image. These options are useful for creating teaching materials and tutorial videos. ZOOM MENU The Zoom menu of MoLab View allows zooming in and zooming out the currently displayed screen.

32 | ML01 MoLab User’s Guide
X. TECHNICAL SPECIFICATIONS
1. MoLab device
Windows CE device On/Off switch 3.5” TFT touch screen, 320 x 240 pixel color display 533 MHz Samsung ARM processor 256 MB memory 64 MB user memory:
‐ 32 MB for MoLab Coach 6 CE application (AppFlash) ‐ 32 MB for user data (DataFlash)
USB mini port for powering and computer connection 4 sensor inputs for ML type of sensors Micro SD memory card slot Audio In/ Audio out ports 3 hardware push buttons Rechargeable battery pack: Li‐ion 3.7 V, 2300 mAh (typical) Built‐in sound sensor Coach 6 CE software upgradable Windows CE OS upgradable
2. Sensor which can be connected to MoLab
Only ML type of CMA sensors can be connected to MoLab. Three of such sensors are delivered together with MoLab: ML11s Temperature sensor (‐ 40 .. 125° C), ML14s Light sensor (1 .. 65,535 lux), and ML17f Voltage sensor (‐15 .. 15 V).
3. Working conditions and maintenance
For your safety and that of your equipment, follow these rules for handling and cleaning your MoLab and for working more comfortably. Your MoLab is designed to be operated on a desk or hand‐held. Your MoLab is not waterproof. Precautions must be taken to ensure that liquid
cannot enter the unit. Do not expose your MoLab to extreme heat or cold sources. Do not expose to
direct sunlight for extended periods of time. Do not expose it to temperatures higher than 60° C.
Operating your MoLab outside the following ranges may affect performance: o Temperature: 5° to 40° C. o Relative humidity: 0% to 90% (noncondensing)

ML01 MoLab User’s Guide | 33
Never force a connector into a port. When connecting a sensor, make sure that
the sensor cable connector matches the port, and that you have positioned the connector correctly in relation to the port. Firmly press the sensor cable connector into the sensor port to assure good contact.
When cleaning your MoLab, first turn it off and unplug the connected sensors and USB cable. Then clean with a soft, lint‐free cloth. Avoid getting moisture in any openings. Do not spray liquid directly on MoLab. Do not use aerosol sprays, solvents, or abrasives that might damage the finish. For cleaning the MoLab Screen you can use a cloth dampened just with water.
When replacing the battery, only use a MoLab replacement battery pack supplied by CMA.
4. CMA software for MoLab
Coach 6 CE – Windows CE program pre‐installed on MoLab. Coach 6 Lite for PC – PC program to control MoLab with computer, free but
limited version. Coach 6 for PC – PC program to control MoLab with computer (license needed),
includes Author mode to create Activities for MoLab and Data‐Video, Modeling and Animations possibilities.
MoLab View – PC program to display the MoLab screen on a computer screen.
5. Microsoft software for MoLab
The software below is needed to establish communication between MoLab and the host PC. Without it MoLab will not work properly with the computer. Microsoft ActiveSync ‐ Windows CE Services software for Windows XP and
earlier Windows versions. Windows Mobile Device Center ‐ Windows CE Services software for Windows
Vista and Windows 7. This software can be downloaded freely from www.microsoft.com.

34 | ML01 MoLab User’s Guide

ML01 MoLab User’s Guide | 35
Warranty:
The MoLab data‐logger ML01 is warranted to be free from defects in materials and workmanship for a period of 12 months from the date of purchase provided that it has been used under normal laboratory conditions. This warranty does not apply if MoLab has been damaged by accident or misuse.
Note: This product is to be used for educational purposes only. It is not appropriate for industrial, medical, research, or commercial applications.
Rev. 11/02/2014

36 | ML01 MoLab User’s Guide