Embed Size (px)
Citation preview
Mold Cavity Roughness vs. Flow of Polymer
Michal Stanek, Miroslav Manas and David Manas
Tomas Bata University in Zlín, Faculty of Technology, Department of Production Engineering, TGM 275, 76272 Zlín, Czech Republic
Abstract. Injection molding represents such a way of polymer processing that requires injection of polymer melt into the mold cavity with very high injection rate. The fluidity of polymers is affected by many parameters (mold design, melt temperature, injection rate and pressure). The main objective of this paper is the study of influence of surface roughness of mold cavity of the polymer melts flow. Evaluation of set of data obtained by experiments where the testing conditions were widely changed shows that quality of cavity surface affects on the length of flow.
Keywords: Injection molding, Surface roughness, Fluidity, Polymer, Cavity.PACS: 83.50.Uv, 83.80.Sg
INTRODUCTION
Polymer injection molding is the most used technology of polymer processing nowadays. It enables the manufacture of final products, which do not require any further operations. The tools used for their production – the injection molds – are very complicated machines that are made using several technologies. Working of shaping cavities is the major problem involving not only the cavity of the mold itself, giving the shape and dimensions of the future product, but also the runners leading the polymer melt to the separate cavities. The runners may be very complex and in most cases takes up to 40 % volume of the product itself (shape cavity). In practice, high quality of runner surface is still very often required. Hence, surface polishing for perfect conditions for melt flow is demanded. The stated finishing operations are very time and money consuming leading to high costs of the tool production. [1] This work gives the results of studying the influence of the quality of flow pathway surface and influences of other technological parameters on the polymer melt flow.
Results of the experiments carried out with selected types of thermoplastics proved a minimal influence of surface roughness of the flow channels on the polymer melt flow. This considers excluding (if the conditions allow it) the very complex and expensive finishing operations from the technological process as the influence of the surface roughness on the flow characteristics does not seem to play as important role as was previously thought.
Regressive models created on the basis of experiment results enable to predict the flow behavior of the polymers quite precisely with regard to the surface quality and the parameters of the process injection molding itself. Application of the measurement
75
meltflow front
solidifying layer
wall
results may have significant influence on the production of shaping parts of the injection molds especially in changing the so far used processes and substituting them by less costly production processes which might increase the competitiveness of the tool producers and shorten the time between product plan and its implementation.
POLYMER MATERIAL INJECTION MOLDING PROCESS
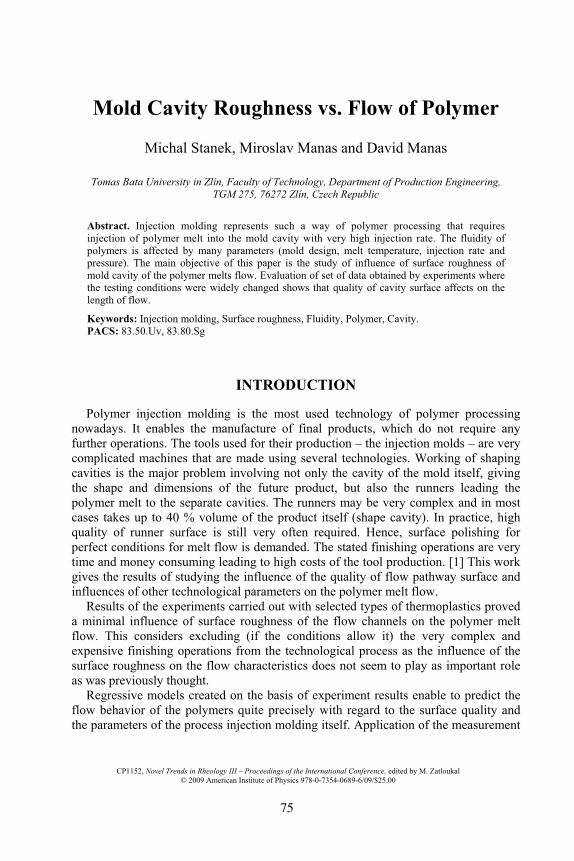
Injection molding is a way of shaping polymeric materials, during which the molded material is filled at high rate (injected) into a closed cavity of a tempered mold. It produces high quality and precise products (shots) from a wide range of plastics. Injection molding has some other advantages. For instance, precise mold design might eliminate other working. [2] Cold runner molds in case of thermoplastics can be crushed and reused, decreasing the polymer waste to minimum. The injection molding process is quite fast and can be well automated. In order to get a shot with good physical properties and good surface, the filling of the mold must be controlled so that the melt would not flow into the form in one flow front but gradually. A plastic nucleus is formed by this way of laminar flow, which enables the compression of the melt in the mold and consecutive creeping. A constant flowing rate given by the axial movement of the screw is chosen for most of the flows. During filling the mold cavity the plastic material does not slide along the mold surface but it is rolled over. This type of laminar flow is usually described as a “fountain flow” (Figure 1). [3]
FIGURE 1. Fountain flow of polymer melt.
INJECTION MOLD FOR TESTING SAMPLES
The injection mold was designed for the easiest possible manipulation both with the mold itself and during injection molding while changing the testing plates, size of the mold gate etc. The injection mold is inserted into a universal frame. Its description and reasons for use are stated bellow.
Universal Frame
The frame (Figure 2) was designed for use with many different injection molds that fit the size of the frame. This makes the change of the separate injection molds easier, because the frame remains clamped to the injection molding machine and only
76
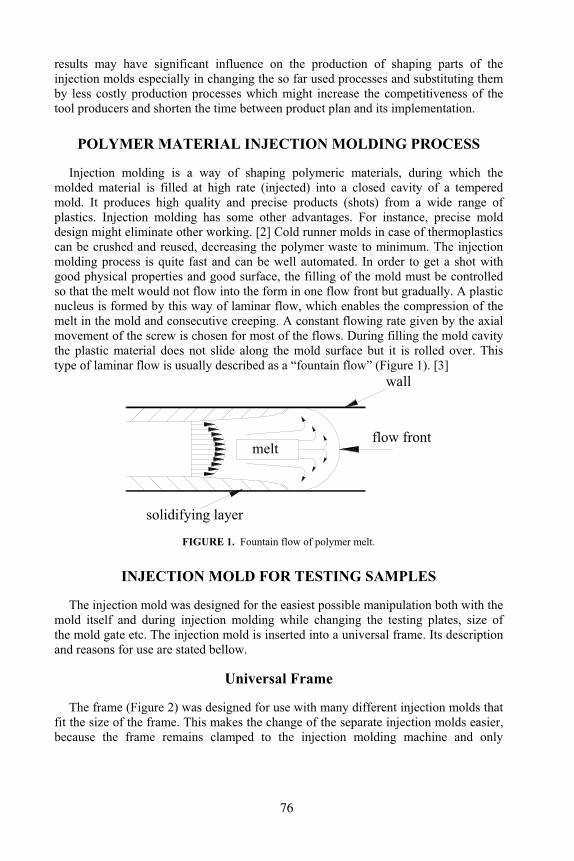
the shaping and ejection parts of the molds are changed. Attaching right and left sides of the frame to fixed and moving plates of the injection machine is done using four clamps on each side.
FIGURE 2. Cross section of injection mould for thermoplastics 1 – universal frame, 2 – cavity part of the injection mould, 3 – ejector system.
Cavity Parts of the Injection Mold for Testing Samples
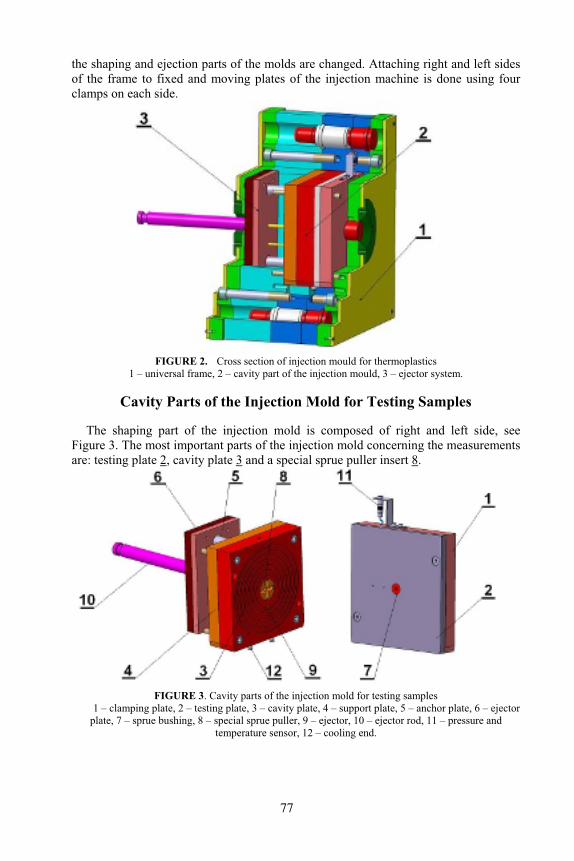
The shaping part of the injection mold is composed of right and left side, see Figure 3. The most important parts of the injection mold concerning the measurements are: testing plate 2, cavity plate 3 and a special sprue puller insert 8.
FIGURE 3. Cavity parts of the injection mold for testing samples1 – clamping plate, 2 – testing plate, 3 – cavity plate, 4 – support plate, 5 – anchor plate, 6 – ejector
plate, 7 – sprue bushing, 8 – special sprue puller, 9 – ejector, 10 – ejector rod, 11 – pressure and temperature sensor, 12 – cooling end.
77
testing plate
mold plate
Special Sprue Puller Insert
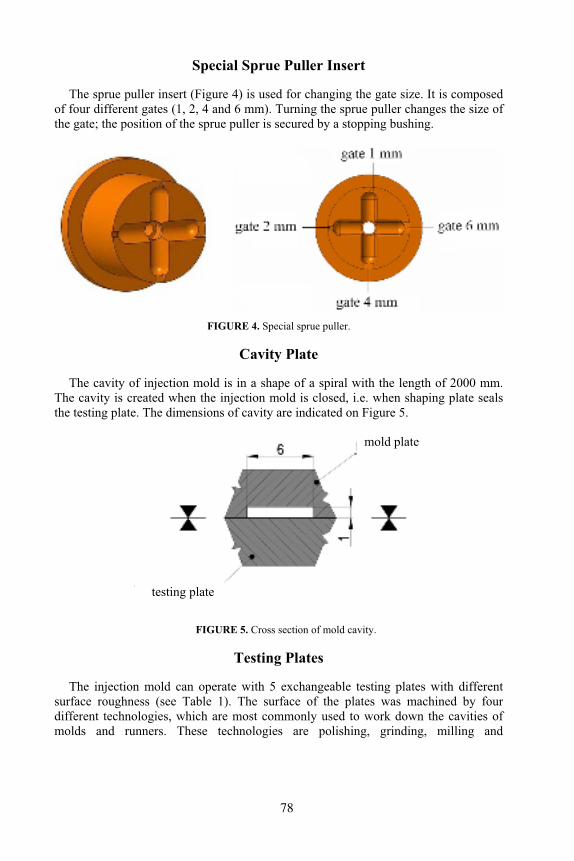
The sprue puller insert (Figure 4) is used for changing the gate size. It is composed of four different gates (1, 2, 4 and 6 mm). Turning the sprue puller changes the size of the gate; the position of the sprue puller is secured by a stopping bushing.
FIGURE 4. Special sprue puller.
Cavity Plate
The cavity of injection mold is in a shape of a spiral with the length of 2000 mm. The cavity is created when the injection mold is closed, i.e. when shaping plate seals the testing plate. The dimensions of cavity are indicated on Figure 5.
FIGURE 5. Cross section of mold cavity.
Testing Plates
The injection mold can operate with 5 exchangeable testing plates with different surface roughness (see Table 1). The surface of the plates was machined by four different technologies, which are most commonly used to work down the cavities of molds and runners. These technologies are polishing, grinding, milling and
78
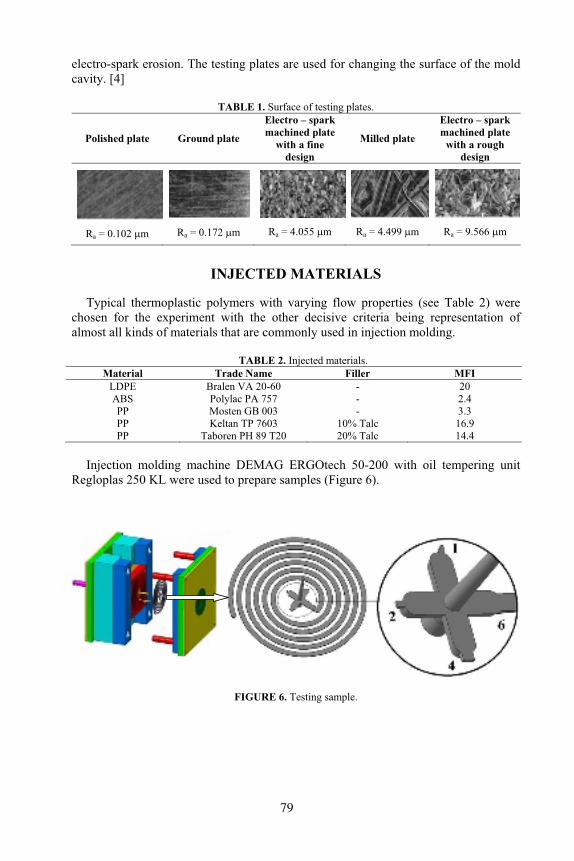
electro-spark erosion. The testing plates are used for changing the surface of the mold cavity. [4]
TABLE 1. Surface of testing plates.
Polished plate Ground plate
Electro – spark machined plate
with a fine design
Milled plate
Electro – spark machined plate
with a rough design
Ra = 0.102 :m Ra = 0.172 :m Ra = 4.055 :m Ra = 4.499 :m Ra = 9.566 :m
INJECTED MATERIALS
Typical thermoplastic polymers with varying flow properties (see Table 2) were chosen for the experiment with the other decisive criteria being representation of almost all kinds of materials that are commonly used in injection molding.
TABLE 2. Injected materials.Material Trade Name Filler MFI
LDPE Bralen VA 20-60 - 20 ABS Polylac PA 757 - 2.4 PP Mosten GB 003 - 3.3 PP Keltan TP 7603 10% Talc 16.9 PP Taboren PH 89 T20 20% Talc 14.4
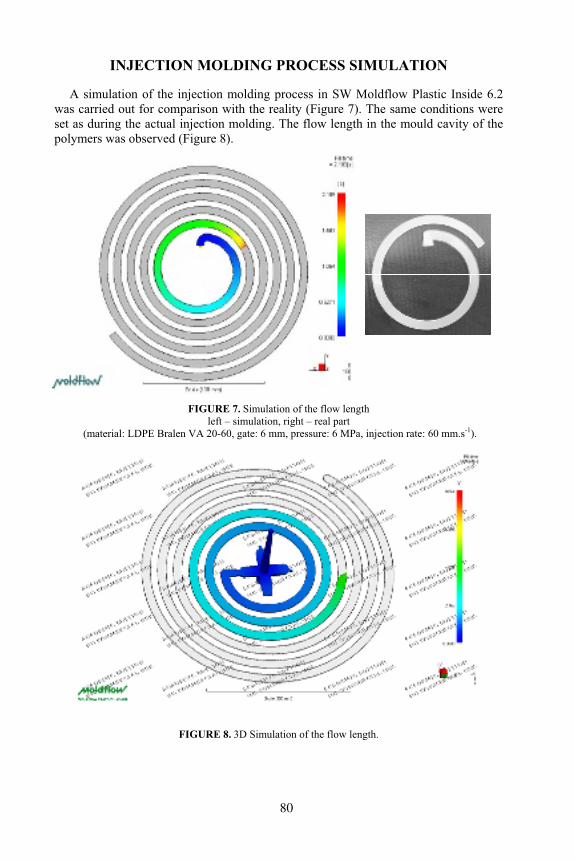
Injection molding machine DEMAG ERGOtech 50-200 with oil tempering unit Regloplas 250 KL were used to prepare samples (Figure 6).
FIGURE 6. Testing sample.
79
INJECTION MOLDING PROCESS SIMULATION
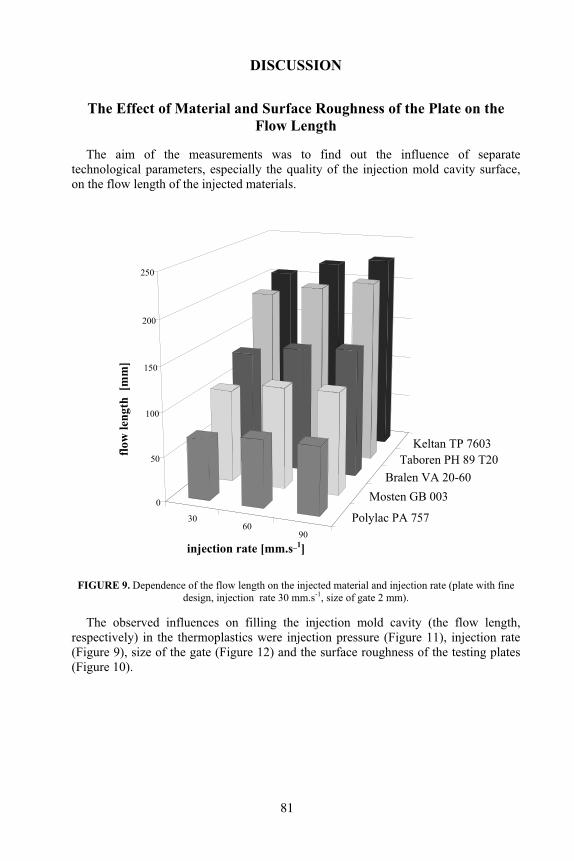
A simulation of the injection molding process in SW Moldflow Plastic Inside 6.2 was carried out for comparison with the reality (Figure 7). The same conditions were set as during the actual injection molding. The flow length in the mould cavity of the polymers was observed (Figure 8).
FIGURE 7. Simulation of the flow length left – simulation, right – real part
(material: LDPE Bralen VA 20-60, gate: 6 mm, pressure: 6 MPa, injection rate: 60 mm.s-1).
FIGURE 8. 3D Simulation of the flow length.
80
DISCUSSION
The Effect of Material and Surface Roughness of the Plate on the Flow Length
The aim of the measurements was to find out the influence of separate technological parameters, especially the quality of the injection mold cavity surface, on the flow length of the injected materials.
FIGURE 9. Dependence of the flow length on the injected material and injection rate (plate with fine design, injection rate 30 mm.s-1, size of gate 2 mm).
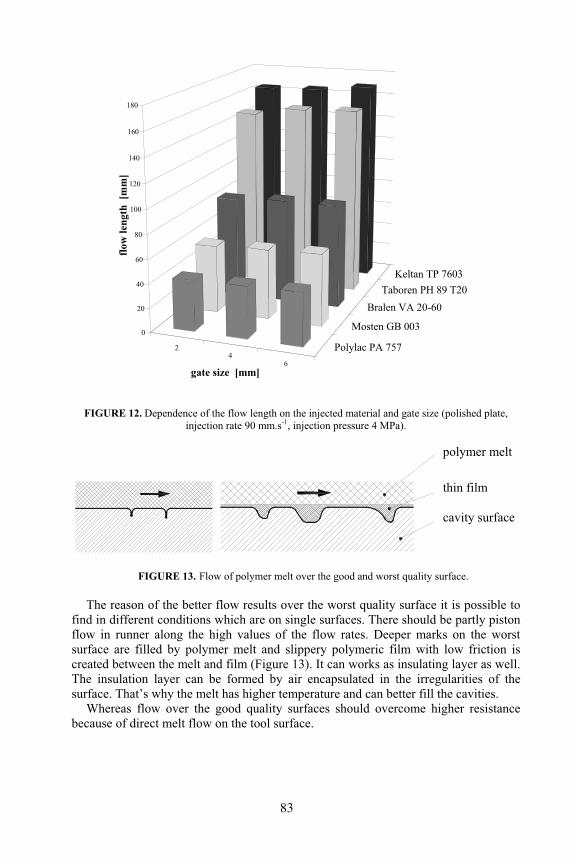
The observed influences on filling the injection mold cavity (the flow length, respectively) in the thermoplastics were injection pressure (Figure 11), injection rate (Figure 9), size of the gate (Figure 12) and the surface roughness of the testing plates (Figure 10).
3060
90
Polylac PA 757
Mosten GB 003Bralen VA 20-60
Taboren PH 89 T20Keltan TP 7603
0
50
100
150
200
250
flow
leng
th [
mm
]
injection rate [mm.s_1]
81
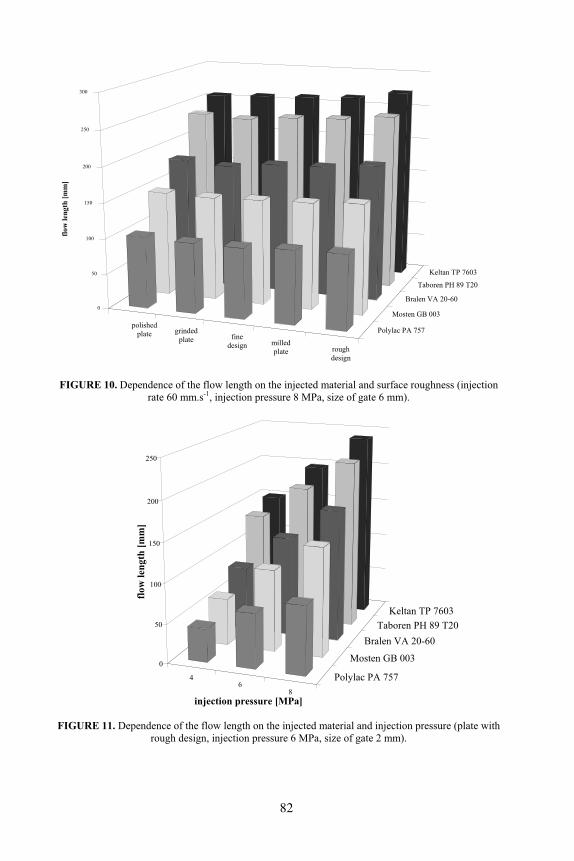
FIGURE 10. Dependence of the flow length on the injected material and surface roughness (injection rate 60 mm.s-1, injection pressure 8 MPa, size of gate 6 mm).
FIGURE 11. Dependence of the flow length on the injected material and injection pressure (plate with rough design, injection pressure 6 MPa, size of gate 2 mm).
polished plate grinded
plate fine design milled
plate rough design
Polylac PA 757
Mosten GB 003
Bralen VA 20-60
Taboren PH 89 T20
Keltan TP 7603
0
50
100
150
200
250
300
flow
leng
th [m
m]
46
8
Polylac PA 757
Mosten GB 003
Bralen VA 20-60 Taboren PH 89 T20
Keltan TP 7603
0
50
100
150
200
250
flow
leng
th [m
m]
injection pressure [MPa]
82
povrch desky
tavenina
povrch desky
film
tavenina
FIGURE 12. Dependence of the flow length on the injected material and gate size (polished plate, injection rate 90 mm.s-1, injection pressure 4 MPa).
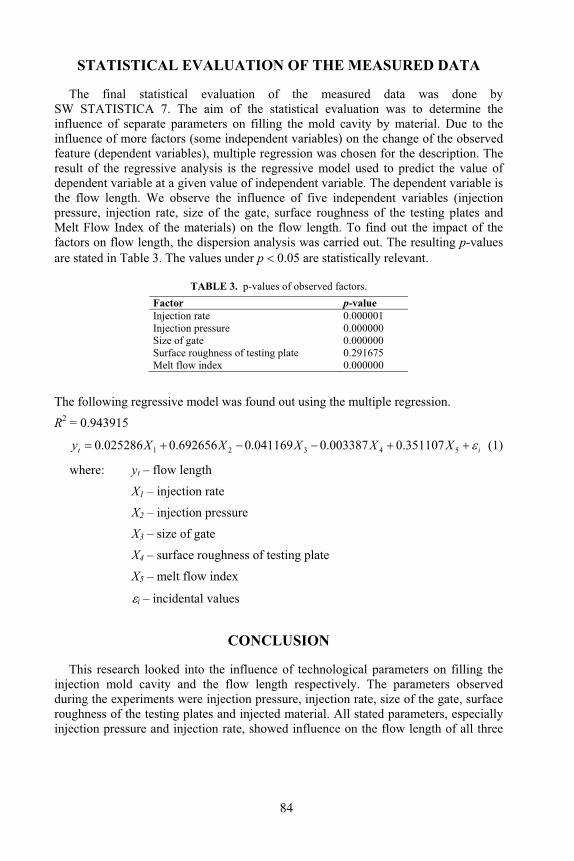
FIGURE 13. Flow of polymer melt over the good and worst quality surface.
The reason of the better flow results over the worst quality surface it is possible to find in different conditions which are on single surfaces. There should be partly piston flow in runner along the high values of the flow rates. Deeper marks on the worst surface are filled by polymer melt and slippery polymeric film with low friction is created between the melt and film (Figure 13). It can works as insulating layer as well. The insulation layer can be formed by air encapsulated in the irregularities of the surface. That’s why the melt has higher temperature and can better fill the cavities.
Whereas flow over the good quality surfaces should overcome higher resistance because of direct melt flow on the tool surface.
24
6
Polylac PA 757
Mosten GB 003
Bralen VA 20-60 Taboren PH 89 T20
Keltan TP 7603
0
20
40
60
80
100
120
140
160
180
flow
leng
th [
mm
]
gate size [mm]
polymer melt
thin film
cavity surface
83
STATISTICAL EVALUATION OF THE MEASURED DATA
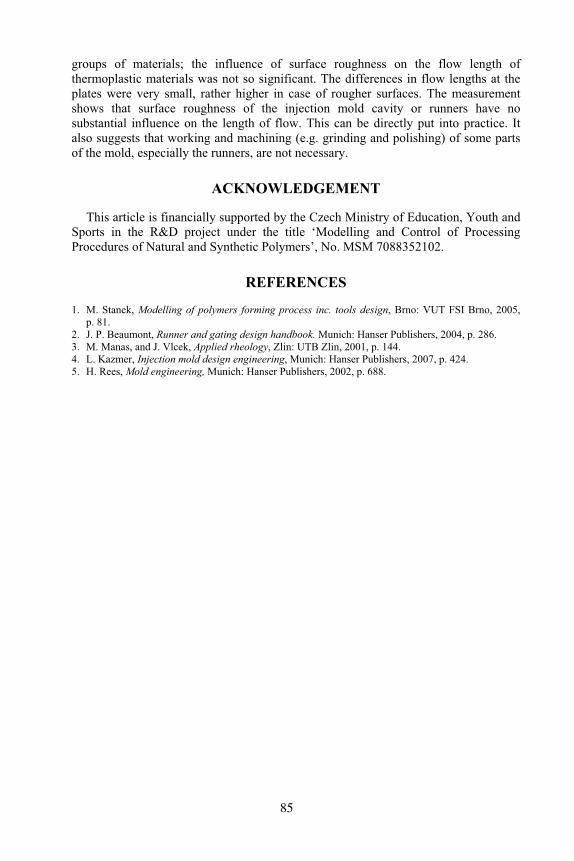
The final statistical evaluation of the measured data was done by SW STATISTICA 7. The aim of the statistical evaluation was to determine the influence of separate parameters on filling the mold cavity by material. Due to the influence of more factors (some independent variables) on the change of the observed feature (dependent variables), multiple regression was chosen for the description. The result of the regressive analysis is the regressive model used to predict the value of dependent variable at a given value of independent variable. The dependent variable is the flow length. We observe the influence of five independent variables (injection pressure, injection rate, size of the gate, surface roughness of the testing plates and Melt Flow Index of the materials) on the flow length. To find out the impact of the factors on flow length, the dispersion analysis was carried out. The resulting p-values are stated in Table 3. The values under p 0.05 are statistically relevant.
TABLE 3. p-values of observed factors. Factor p-value Injection rate 0.000001 Injection pressure 0.000000 Size of gate 0.000000 Surface roughness of testing plate 0.291675 Melt flow index 0.000000
The following regressive model was found out using the multiple regression.
R2 = 0.943915
it XXXXXy +������ 54321 351107.0003387.0041169.0692656.0025286.0 (1)
where: yt – flow length
X1 – injection rate
X2 – injection pressure
X3 – size of gate
X4 – surface roughness of testing plate
X5 – melt flow index
+i – incidental values
CONCLUSION
This research looked into the influence of technological parameters on filling the injection mold cavity and the flow length respectively. The parameters observed during the experiments were injection pressure, injection rate, size of the gate, surface roughness of the testing plates and injected material. All stated parameters, especially injection pressure and injection rate, showed influence on the flow length of all three
84
groups of materials; the influence of surface roughness on the flow length of thermoplastic materials was not so significant. The differences in flow lengths at the plates were very small, rather higher in case of rougher surfaces. The measurement shows that surface roughness of the injection mold cavity or runners have no substantial influence on the length of flow. This can be directly put into practice. It also suggests that working and machining (e.g. grinding and polishing) of some parts of the mold, especially the runners, are not necessary.
ACKNOWLEDGEMENT
This article is financially supported by the Czech Ministry of Education, Youth and Sports in the R&D project under the title ‘Modelling and Control of Processing Procedures of Natural and Synthetic Polymers’, No. MSM 7088352102.
REFERENCES
1. M. Stanek, Modelling of polymers forming process inc. tools design, Brno: VUT FSI Brno, 2005, p. 81.
2. J. P. Beaumont, Runner and gating design handbook. Munich: Hanser Publishers, 2004, p. 286. 3. M. Manas, and J. Vlcek, Applied rheology, Zlin: UTB Zlin, 2001, p. 144. 4. L. Kazmer, Injection mold design engineering, Munich: Hanser Publishers, 2007, p. 424. 5. H. Rees, Mold engineering, Munich: Hanser Publishers, 2002, p. 688.
85